Article

WaterSmart-GIS: A Web Application of a Data Assimilation Model to Support Irrigation Research and Decision Making

1
Center for Spatial Information Science and Systems, George Mason University, Fairfax, VA 22030, USA
2
Department of Geography and Geoinformation Science, George Mason University, Fairfax, VA 22030, USA
*
Author to whom correspondence should be addressed.
ISPRS Int. J. Geo-Inf. 2022, 11(5), 271; https://doi.org/10.3390/ijgi11050271
Submission received: 6 February 2022 / Revised: 12 April 2022 / Accepted: 16 April 2022 / Published: 19 April 2022
(This article belongs to the Special Issue GIS Software and Engineering for Big Data)

Abstract

:
Irrigation is the primary consumer of freshwater by humans and accounts for over 70% of all annual water use. However, due to the shortage of open critical information in agriculture such as soil, precipitation, and crop status, farmers heavily rely on empirical knowledge to schedule irrigation and tend to excessive irrigation to ensure crop yields. This paper presents WaterSmart-GIS, a web-based geographic information system (GIS), to collect and disseminate near-real-time information critical for irrigation scheduling, such as soil moisture, evapotranspiration, precipitation, and humidity, to stakeholders. The disseminated datasets include both numerical model results of reanalysis and forecasting from HRLDAS (High-Resolution Land Data Assimilation System), and the remote sensing datasets from NASA SMAP (Soil Moisture Active Passive) and MODIS (Moderate-Resolution Imaging Spectroradiometer). The system aims to quickly and easily create a smart, customized irrigation scheduler for individual fields to relieve the burden on farmers and to significantly reduce wasted water, energy, and equipment due to excessive irrigation. The system is prototyped here with an application in Nebraska, demonstrating its ability to collect and deliver information to end-users via the web application, which provides online analytic functionality such as point-based query, spatial statistics, and timeseries query. Systems such as this will play a critical role in the next few decades to sustain agriculture, which faces great challenges from climate change and increased natural disasters.

1. Introduction

As exceptional drought increased in the western United States and south Europe in the summer of 2021, topics about the impact of climate change and the consequences this devastating drought has had on farming and farmers in those regions are highly debated. The sixth assessment report of the IPCC (Intergovernmental Panel on Climate Change, Geneva, Switzerland) [1] projected that climate change-derived impacts will affect all of North and Central America, and pose a unique challenge for adaptation and risk management in agriculture. The report pointed out both the sophistication of the challenge as well as the indirect consequences of climate change such as plague, disease, species evolution, soil erosion, decreasing groundwater supply, and increasing extreme weather. To tackle the challenge, agriculture must be equipped with smarter and highly efficient strategies [2,3,4] for collecting actionable information, disseminating this information to stakeholders in a timely manner, and helping make practical decisions based on real-world scenarios.
Irrigation is one of the most important activities in farming. Like other farming activities of modern agriculture in the high plains and Midwestern states (the Corn Belt, USA) [5], irrigation is mechanized and automated [6,7]. A common irrigation device used in the Midwest is the central pivot irrigation system (CPIS), which pumps water (usually groundwater) into the center through a long pipe suspended on an arm-like motor vehicle [8]. The pipe is installed with regularly spaced sprinklers to spread water evenly to a certain diameter. Farmers can control the irrigation water amount and circles by setting up the scheduler on the control device on a CPIS. During the irrigation season (normally July to early August in the Corn Belt), farmers will irrigate once every 5 to 10 days. The decision is based on either field observation and manual examination of soil moisture content or a fixed irrigation scheduler, which normally will not change with rainfall events. Using more flexible and efficient data-driven irrigation scheduling can potentially save water [9,10].
However, popular adoption of the scientific irrigation management for large geographic region (e.g., a state) has not happened. Timely and accurate data of crop, soil, and weather conditions is necessary for farmers and water managers to make optimal irrigation decisions. Useful information, such as remotely sensed soil moisture and model-generated evapotranspiration, are actually existing and open to the public for free. OpenET project [11], for example, made a great effort to generate and distribute ET data at a filed scale to advance the use of data-driven irrigation scheduling. Many other standard land surface parameters at various spatial and temporal resolutions are available freely and near-real-time from NASA data centers. Our goal in this study was to collect the timely and accurate data from remote sensors and weather/soil/crop models, and then synthesize them to drive the irrigation reasoning on a web portal, which can provide a one-stop solution literally for free for those who need to access all necessary information for irrigation management in a timely and easy manner. Integrating multi-source datasets, and processing and visualizing them into a ready-for-action form in one data portal will help fill the gap between information providers and consumers which would otherwise eventually waste the time value of the data and damage chances for farmers to make better decisions.
Many types of data needed to drive irrigation decisions are routinely produced and distributed by federal agencies. There are three major challenges to overcome when leveraging existing free federal data resources and providing irrigation decision supporting information. The first is the big data nature of streaming agricultural data. The tremendous number of data produced by model and remote sensors requires large data storage and processing capability for irrigation application developers to maintain an operational service [12]. The second issue is how to bring together the datasets from hybrid sources. Datasets from various agencies have heterogeneous formats and specifics, and it takes great effort to harmonize and integrate them into one application. The third challenge is that most of the model and remote-sensed datasets need to be further analyzed, taking the local environmental/societal conditions into consideration [13]. For example, irrigation practices in semiarid regions are very different from those in wetter regions, and farmers from different regions care about various indicators [14]. Some emphasize soil moisture, while others may take serious measures to monitor precipitation and evapotranspiration. Collecting and providing analysis on various meteorological and social factors is a critical task for irrigation information systems.
This paper developed a web-based geographic information system, WaterSmart-GIS (https://geobrain.csiss.gmu.edu/watersmartport/, accessed on 8 February 2022), to deliver near-real-time information about soil moisture, evapotranspiration, precipitation, humidity, etc., to stakeholders in a timely manner. The hosted or collected datasets include both real-time numerical model results from HRLDAS (High-Resolution Land Data Assimilation System, https://ral.ucar.edu/solutions/products/high-resolution-land-data-assimilation-system-hrldas (accessed on 17 April 2022)) [15], and the remote sensing datasets from NASA SMAP (Soil Moisture Active Passive, https://smap.jpl.nasa.gov/ (accessed on 17 April 2022)) [16] and MODIS (Moderate-Resolution Imaging Spectroradiometer, https://modis.gsfc.nasa.gov/about/ (accessed on 17 April 2022)) [17]. This aims to help farmers quickly and easily create a wiser customized irrigation scheduler for their individual fields to relieve the burden on farmers and significantly reduce wasted water, energy, and equipment cost in excessive irrigation. The system is prototyped here with an application in Nebraska, demonstrating its ability to collect and deliver information to end-users via web application and the provided functionality such as point-based query, spatial statistics, and profiling. Systems such as this will play a critical role in the next few decades to sustain humanity in the face of challenges such as global warming, frequent exceptional drought, plague, wildfires, the exploding human population, and greenhouse gas emissions. The whole development procedure using open-sourced web GIS tools and standard protocols for data access should also be effective as a reference to other disciplines involving a number of data sources.
This paper is organized as follows. Section 2 introduces the related work. Section 3 and Section 4 explain the design and implementation of WaterSmart-GIS. In Section 5, we present a real-world use case to validate the system, and the results are displayed. Section 6 discusses the system and its benefits for the future, and the last section concludes the work.

2. Related Work

There are many ongoing research and development efforts in both the industry and academia to develop easy-to-access visualization applications to support practical irrigation [11,18,19,20,21,22].
Visualization of geospatial data, shortened as geovisualization, integrates approaches from visualization in scientific computing, cartography, image analysis, information visualization, exploratory data analysis (EDA), and geographic information systems (GIS) to provide theory, methods, and tools for visual exploration, analysis, synthesis, and presentation of geospatial data [23]. In the digital era, geovisualization has greatly expanded the static 2D maps and 3D models to an interactive and dynamic form on the web with the help of web GIS development tools and frameworks. With the digitalization acceleration, geovisualization has been boosted to handle multidimensional big geospatial data [24,25], support photogrammetric processing [26], and integrate knowledge networks for visualization of 3D geospatial models [27]. Geovisualization technology has been proved successful in promoting geographical analysis and decision making in fire prevention, water quality assessment [28], seismic risk simulation [29], excavation process [30], and criminal activity [25].
Many agricultural decision support systems (DSS) and information dissemination systems have been developed for irrigation decision support using geovisualization tools. IrriWatch (https://www.irriwatch.com/en/, accessed on 17 April 2022), based on the surface energy balance algorithm for land (SEBAL)[22], is commercially available. It combines multiple data resources, and is able to provide field-scale irrigation recommendation. A web-based irrigation decision support system (WIDSS) [31] is presented for canal irrigation management in large irrigated districts. This system utilizes basic data related to irrigation system engineering information, crop and soil characteristics, and historical meteorological data, which are stored in the system in advance. Its decision is made based on water balance simulation considering real-time in-field data and weather forecast data, which are acquired automatically. IrrigaSys [20] provides an irrigation water management service using the MOHID-Land model [32], a physically based, spatially distributed, continuous, variable time-step model for water and property cycles in inland waters, to compute soil water dynamics and irrigation scheduling at field-plot scale. The success of this system relies heavily on initial input of crop type, sowing dates, soil texture, and irrigation method of every field plot served by the system, which should be defined by a manager who is also responsible for reporting irrigation events carried out by farmers. A web-based irrigation decision support system with limited inputs (WIDSSLI) [33] adopts the FAO-56 dual crop coefficient approach [34] to simulate the soil water balance. Irrigation decisions are made by comparing the soil water content with the corresponding lower limit. Recently, LCIS-DSS [18] compares three different decision-making methodologies: in situ soil sensor, remote sensing, and simulation modeling of water balance. Evaluation in a case study involving maize has shown that the method based on an in situ sensor supplied more water to achieve maximum maize production, while the other two methods require a high level of user expertise.
While agricultural DSS focus on irrigation decision making, providing farmers ready-to-act irrigation recommendation for their assigned fields, agricultural information dissemination systems are designed to exhibit one product or one series of products from remote sensing or model results, with limited analysis functions. These systems visualize various types of agricultural data regionally and globally, contributing to the availability of necessary data for driving irrigation decisions. CropGIS [35] visualized modeled biomass information of maize using the crop growth model APSIM (Agricultural Production Systems Simulator, https://www.apsim.info/ (accessed on 17 April 2022)), with historical meteorological data from 2001 to 2014 and high-resolution satellite imagery. This web application is a demonstration for displaying its biomass production and forecasts from its modeling results. CropScape [19] was developed to visualize, disseminate, and analyze the annually updated Cropland Data Layer (CDL), which contains crop- and other specific land cover classifications for the conterminous United States. A cloud environment is built for serving CDL products to provide geo-referenced, high-accuracy, 30 or 56 m resolution, crop-specific land cover information since 1997 [36]. This web application provides great convenience for different users to access, view, and analyze the product. VegScape [37] generates and visualizes geospatially varying vegetation condition indices for timely crop condition using 250 m MODIS daily surface reflectance data for the conterminous United States. TerraGIS [38], a web application based on the Google Maps application programming interface (API), delivers Digital Soil Maps of the physical, chemical, and hydrological properties of soil for cotton fields in Australia. HidroMap [39] is an open-source geographic information system (GIS) for irrigation monitoring organized in two modules, desktop-GIS and web-GIS. The desktop module detects irrigation activities based on satellite imagery, while the web module visualizes them. The Global Agricultural Drought Monitoring and Forecasting System (GADMFS, http://gis.csiss.gmu.edu/GADMFS/ (accessed on 17 April 2022)) [40,41] is a cloud-based web system with an integrated advanced cyberinfrastructure framework that provides global drought indicators derived from satellite- and model-based vegetation condition datasets.

3. Architecture Design

This section will detail the system design. The system consists of three layers: user layer, service layer, and model layer, as shown in Figure 1. Each layer handles one particular type of task and interacts with the other layers to form a workflow. The system is designed to serve the latest advanced observations and model simulation about soil, vegetation, and climate in one single system. The details of each layer are introduced below. A special design to handle issues of big data download and storage and large throughput which result from frequent (hourly) model runs is also presented.

3.1. Soil Vegetation and Climate Model Layer

This layer is responsible for collecting observations and data assimilation outputs from government public servers as initial condition and input files, and running models of WaterSmart-GIS to produce the soil moisture (SM)/evapotranspiration (ET)/vegetation products. The collected datasets include SMAP Level 4 product from Jet Propulsion Laboratory (JPL, Pasadena, CA, USA), field reports from USDA NASS (https://www.nass.usda.gov/, accessed on 17 April 2022), National Water Model (NWM, https://water.noaa.gov/about/nwm (accessed on 17 April 2022)) [42] outputs from the Office of Water Prediction in NOAA (Washington, DC, USA), Global Forecast System (GFS, https://www.ncei.noaa.gov/products/weather-climate-models/global-forecast (accessed on 17 April 2022)) [43], outputs from the National Centers for Environmental Prediction in NOAA, MODIS land surface temperature product (MOD21) from NASA, and AmeriFlux [44] stationary data of soil moisture (only three sites in Nebraska). This layer mainly generates products under five categories: soil profile, vegetation status, remote sensing-observed SM, HRLDAS-simulated SM and ET, machine learning-derived SM and ET. Each category has various data and model sources.
HRLDAS model running: We run the models twice to generate the state of SM and ET using NWM and GFS, respectively. The results from NWM are a reanalysis estimation of the situation in the past few hours. The results from GFS forecast the SM and ET in the next few days. Meanwhile, we also serve the downloaded NWM and GFS input files into the WaterSmart-GIS as references, including temperature, humidity, pressure, long/short-wave radiation flux, and wind.
SMAP: Due to failure of its radar, the NASA’s SMAP mission only produces the surface layer of soil moisture product (top 5 cm) at spatial resolution of 36 km [45]. The SMAP Level 4 product provides both surface and rootzone soil moisture at 9 km resolution, which is derived from the assimilation of standard 36 km data into a land surface model [46,47]. Consistency has been demonstrated between SMAP soil moisture retrievals and qualitative soil moisture condition surveys conducted by USDA NASS at county scale [48]. We therefore use the NASS reported categorical soil moisture conditions to grade SMAP soil moisture products into four categories: very short, short, adequate, and surplus. The SMAP categorical products are much easier for practical use in daily irrigation decision making.
Soil properties are considered as relatively static conditions for a region. The physical and chemical soil properties considered here include calcium carbonate content, carbon exchange capacity, electrical conductivity, pH, sodium adsorption ratio, soil organic matter, available water holding capacity, bulk density, permanent wilting point, sand, silt, clay, etc. We used the web API of Soil Web developed by the UC Davis team to retrieve their aggregated products from USDA point-based datasets [49].
Vegetation Status: Normalized difference vegetation index (NDVI) and vegetation condition index (VCI) [50] are used to indicate the health status of crops [51]. The products are retrieved from VegScape and generated using NASA MODIS datasets with a 250 m resolution and about a one-day delay. NDVI indicates the absolute status of vegetation health, while VCI compares the current NDVI to the range of values observed in the same period of the past twenty years to estimate the relative health of the vegetation in the current period [52]. Therefore, VCI is one option to look at vegetation condition and characterize the potential drought. NDVI and VCI have been proven to be very helpful in detecting potential water stress and drought conditions during the growing season [53].
Machine-learning-derived (ML-derived) SM and ET: As an experimental product, we employed Random Forest to train on the AmeriFlux in situ data of SM and ET, and produced a new version of SM and ET aside from the HRLDAS and SMAP [54]. This ML model uses remote sensing predictors such as land surface temperature (LST), vegetation index, albedo, and leaf area index (LAI) from MODIS, as well as meteorological parameters such as wind speed and air pressure, in the training. MODIS products used in this model include land surface reflectance (MOD09GA), LST (MOD11A1), and LAI (MOD15A2). The land surface reflectance and LST products are both 500 m daily data, while LAI product is 1000 m data with a temporal resolution that is 4 days. Therefore, all MODIS data are resampled to 1 km. The AmeriFlux data provide ET and soil moisture measurements of isolated points based on their site stations. Each site includes one ET measurement and three soil moisture measurements in depths of 0–10 cm, 10–50 cm, and 50–100 cm. The energy balance closure of the ground-truth data is first evaluated using the regression correlation of estimated available energy and surface energy flux [55]. Then, ET corrected by the energy balance closure correction factor (LE_CORR) corresponding to the MODIS Terra satellite overpass time, which is 10:30 am local time, is used as in situ observed ET. The motivation is to fix the problems that HRLDAS tends to estimate lower soil moisture in rootzone and SMAP is too coarse in spatial resolution for field-scale irrigation management.
Each category of products is generated separately and located in one accessible place and made available for WaterSmart-GIS to use. The HRLDAS and ML-derived products are generated hourly. The scripts for generating SMAP categorical products are triggered every four hours starting at midnight every day. Table 1 lists spatial and temporal resolution specifications of the five categories of products as well as weather variables from NWM and GFS.

3.2. WaterSmart-GIS Service Layer

This layer is the middleware to open the data products accessible to everyone via the Internet. The major function has three modules: data interaction, analytics, and dissemination.
The interaction module is responsible for providing the web services that serve the cropland data for product browsing, visualization, and query. As there are many types of products served in the system, the product inventory service is developed to produce a list containing all the supported data categories in the system. The inventory provides metadata such as product name, short description, time extent, frequency, depth, and unit. With this inventory of all products served in the system, the data specified by users can be easily searched and located, and, thus, rendered and analyzed on client side. The query service takes user inputs of product type, location, and area of interest (AOI), and outputs the corresponding data on the location/area. Query web service is compliant to standardized Open Geospatial Consortium (OGC) Web Map Service, OGC Web Feature Service, and OGC Web Coverage Service. It makes the query service interoperable by both API users and WaterSmart-GIS users. The standard operations for obtaining values include GetFeatureInfo, GetFeature, GetCoverage, etc. This is one of the most frequently visited services, so the performance requirement for the querying is higher than other services. In order to reduce the latency, the granularity of individual files is controlled to avoid producing big files. The visualization service adopts MapServer to publish the tremendous number of GeoTiff files into Web Map Service (WMS) and Web Coverage Service (WCS). As for NetCDF [56] files, we use ncWMS [57] to visualize them directly and save the extensive work of converting NetCDF into GeoTiff. The visualization style stays consistent with community standard or de facto rules to make it easier for users to comprehend.
The data analytics module is responsible for generating insights into the WaterSmart products and meeting routine requirements by clients in agriculture. It allows users to conduct basic statistics on the SM, ET, weather, and vegetation products, such as calculating the area of the selected AOI, generating a histogram of SM moisture values over the AOI, converting the pixels into acreage, and calculating the percentage of each SM category in the region. Meanwhile, a typical requirement by farmers or agricultural agency officials is to obtain crop and soil timeseries data. The timeseries data depict the trends of each variable over a period of time at various temporal resolutions (hourly, daily, weekly). The returned data are a single dataset containing the data points with time labels and variable names. The objective of the timeseries service is to compare the values for the same location at the same time over a period. Thus, it is flexible to request multiple variables at the same time or at different times but with the same time frame and temporal resolution. Another essential function required especially by the agriculture department is to produce a PDF report containing the map, legend, and variable information for them to put into crop field regular reports. Sometimes, it is more efficient to preserve the map as a report material with detailed explanation about the crop and soil status in irrigation assisting.
The data dissemination module is responsible for distributing the data files. Due to the tremendous number of files (updated hourly over two years), we have to control the data read and ensure the file system can keep up with frequent requests. For frequently visited data products such as HRLDAS SM and ET, we first convert the NetCDF files to be Climate and Forecast (CF) convention [58]-compliant and make them available to the WMS. Less-visited data, such as some of the weather model results, will not be converted until they are requested. If the system receives a download request, an on-demand script transforming the NetCDF into GeoTiff and clipping to the inputted AOI will be called.

3.3. WaterSmart-GIS User Layer

This layer includes the front end of WaterSmart-GIS directly delivering all the functions and products to the users. Its usability defines the openness and accessibility to backend resources. Overall, it provides the following interfaces:
  • Product Catalog provides a browser and selector to all the SM and ET products. The catalog serves as the entry point for users to choose a product from a hierarchical tree selector based on the irrigation needs. Each product name is associated with a short description and unit explanation.
  • Layer Management controls all the layers selected in the product catalog and added into the map. Via this module, users can manipulate the layers’ visibility, order, and opacity to discover abnormal events, water stress information, and potential wilting point for irrigation.
  • AOI selector is a drawing tool to specify the area of interest. It supports drawing multiple types of AOIs including point, rectangle, polygon, and uploading a Geography Markup Language (GML) file or a zipped ESRI Shapefile. It also allows users to choose from the county list to define the AOI by county administrative boundaries.
  • Legend is explicitly displayed along with the rendered products, showing the value range and corresponding color palette. The units of products are placed alongside as the units of different products are quite different.
  • Map Viewer is the interface to display the WMS layers of the WaterSmart products. It comes with a base map as location and context reference, such as the OpenStreetMap tile map layer, and Global Land Cover layer. The most recent SM image layer is placed on top as default.
  • Map Controller allows users to manipulate the map viewer and find more information from it. It provides functions such as obtaining pixel info of all the displayed layers on the clicked position. Other basic functions such as panning/zooming in/out, navigation window, and changing base maps (including the latest cropland data layer), are supported.
  • Data Analysis is the graphical interface allowing users to directly invoke the data analysis web services described in the section above. This system is specifically designed for agriculture and irrigation. Therefore, the analysis is able to focus on cropland by overlaying a crop mask. It also allows users to export or print the analysis results.
  • Data Download is a function for directly downloading the data of the selected AOI. GeoTiff is the essential format for the output files due to its feasibility and flexibility in subsequent processing.
  • Comparison enables side-by-side observation by adding a slider line to directly compare two layers in one view.
  • Animation provides advanced features for users to view the changes in SM and ET in a dynamic way. Spatial pattern changes can be easily observed by users through this function. Reasonable timeframe, e.g., irrigation season or early growing season, are recommended considering server burden.

4. WaterSmart-GIS System Implementation

The WaterSmart-GIS web system aims to deliver visualized geospatial data to non-GIS users in a responsive and interactive way using modern techniques. This interface allows for temporal and spatial analysis, download, and manipulation of the information. Various APIs on the server backend are responsible for hosting data and handling requests from the client side.

4.1. Technology Used

The web application was designed to be component-based using the React framework (https://reactjs.org/ (accessed on 17 April 2022)) and responsive using a CSS framework called Bootstrap [59]. The application system functionalities were implemented using the lightweight Python Flask framework [60] and Web Processing Service (WPS) based on OGC standards in backend. The data visualization was realized by JavaScript OpenLayers 6.1 (https://openlayers.org/ (accessed on 17 April 2022)) on the client side. OpenLayers framework provides basic map controllers including panning, zooming and mouse position on map. The geospatial data were hosted by MapServer, which implements industry-standard OGC protocols such as Web Map Service (WMS) and Web Coverage Service (WCS), and ncWMS, which is an extended WMS for displaying environmental data. MapServer (https://mapserver.org/ (accessed on 17 April 2022)) is selected because it is an open-source platform for publishing spatial data and interactive mapping applications to the web. Both of the mapper servers were deployed on the servlet container Apache Tomcat. Table 2 elaborates data servers, geoprocessing and map services, and frontend libraries used in our system.

4.2. Web-Based Interface

The WaterSmart-GIS web application is developed to facilitate the direct use of different groups of web services by users. The design of web browser-based client is illustrated as Figure 2. In this prototype implementation, users can customize visualization of geospatial data in Nebraska, and request analytics services over these data via the graphic user interface (GUI). The GUI is composed of a map explorer and a configuration panel. The map explorer displays interactive layers and supports common map operations such as zoom in/out and panning. The data product, together with auxiliary layers such as boundary layers, base map layers, and crop mask layers, can be selected through the configuration panel. The configuration panel supports various operations including AOI editing, data selection, layer manipulation, map swipe, animation, requesting statistics of the layer within user defined AOI, generating a printable map in PDF format, querying time series of specific data type on a selected point, downloading data, and other functionalities. The returned results of queries will be displayed in a dialog, which can be further saved or rendered as a chart.

4.3. Developer-Oriented Web API

This application also provides rich web APIs for developers to download, analyze, and query data. As all of our data are served by MapServer and ncWMS server, developers can access our data directly by WMS with suitable parameters. The response to a WMS request is one or more geo-registered map images that can be displayed in a browser application. Functionalities on the client side, such as statistics, PDF, and timeseries requests, are all handled by APIs based on the Python Flask framework, which is open to developers as well. These APIs are applicable to all the data types available on our application. The PDF API will return a PDF-formatted report for a specified AOI, while other results from APIs for statistics and timeseries are sent back to developers in the form of a data-interchange format (JSON). On the client side, these results are visualized in graphical widgets via interactive and customizable charts using the Google Visualization API on the client side. However, users can retrieve the raw data in JSON using proper API requests for their developing and researching. Another important API to fully utilize our data is to download raw data of user-selected AOI. This is different from the PDF API as the data are downloaded in a GeoTiff format with a geospatial reference so that users can do their own process and calculation, while PDF API returns a visualized map as a readable report.

5. Use Cases in Nebraska

Nebraska is one of the leading states in terms of agricultural output. The state’s fertile farms produce bountiful yields of corn, soybean, wheat, hay, sorghum, and sugar beets. Most of its corn is raised in the central and southern counties, which lie in the great corn belt of the mid-United States. Due to the importance of agriculture to the state, Nebraska continues to seek better ways to harness and preserve its rich natural resources. Compared to its rich and fertile soil resource, Nebraska’s precipitation averages more than 30 inches annually in the southeast to less than 20 inches in the western panhandle, as most of the state’s moisture comes from the distant Gulf of Mexico. Since a minimum of 25 inches is usually considered necessary for normal crop production, about one-half of Nebraska may be considered semiarid. Figure 3 presents Nebraska’s location and basic information. Through these following use cases in Nebraska, our application demonstrates its ability to help users optimize water use efficiency and protect the quality of water resources by providing thorough information about soil properties, soil water use, and soil moisture level.

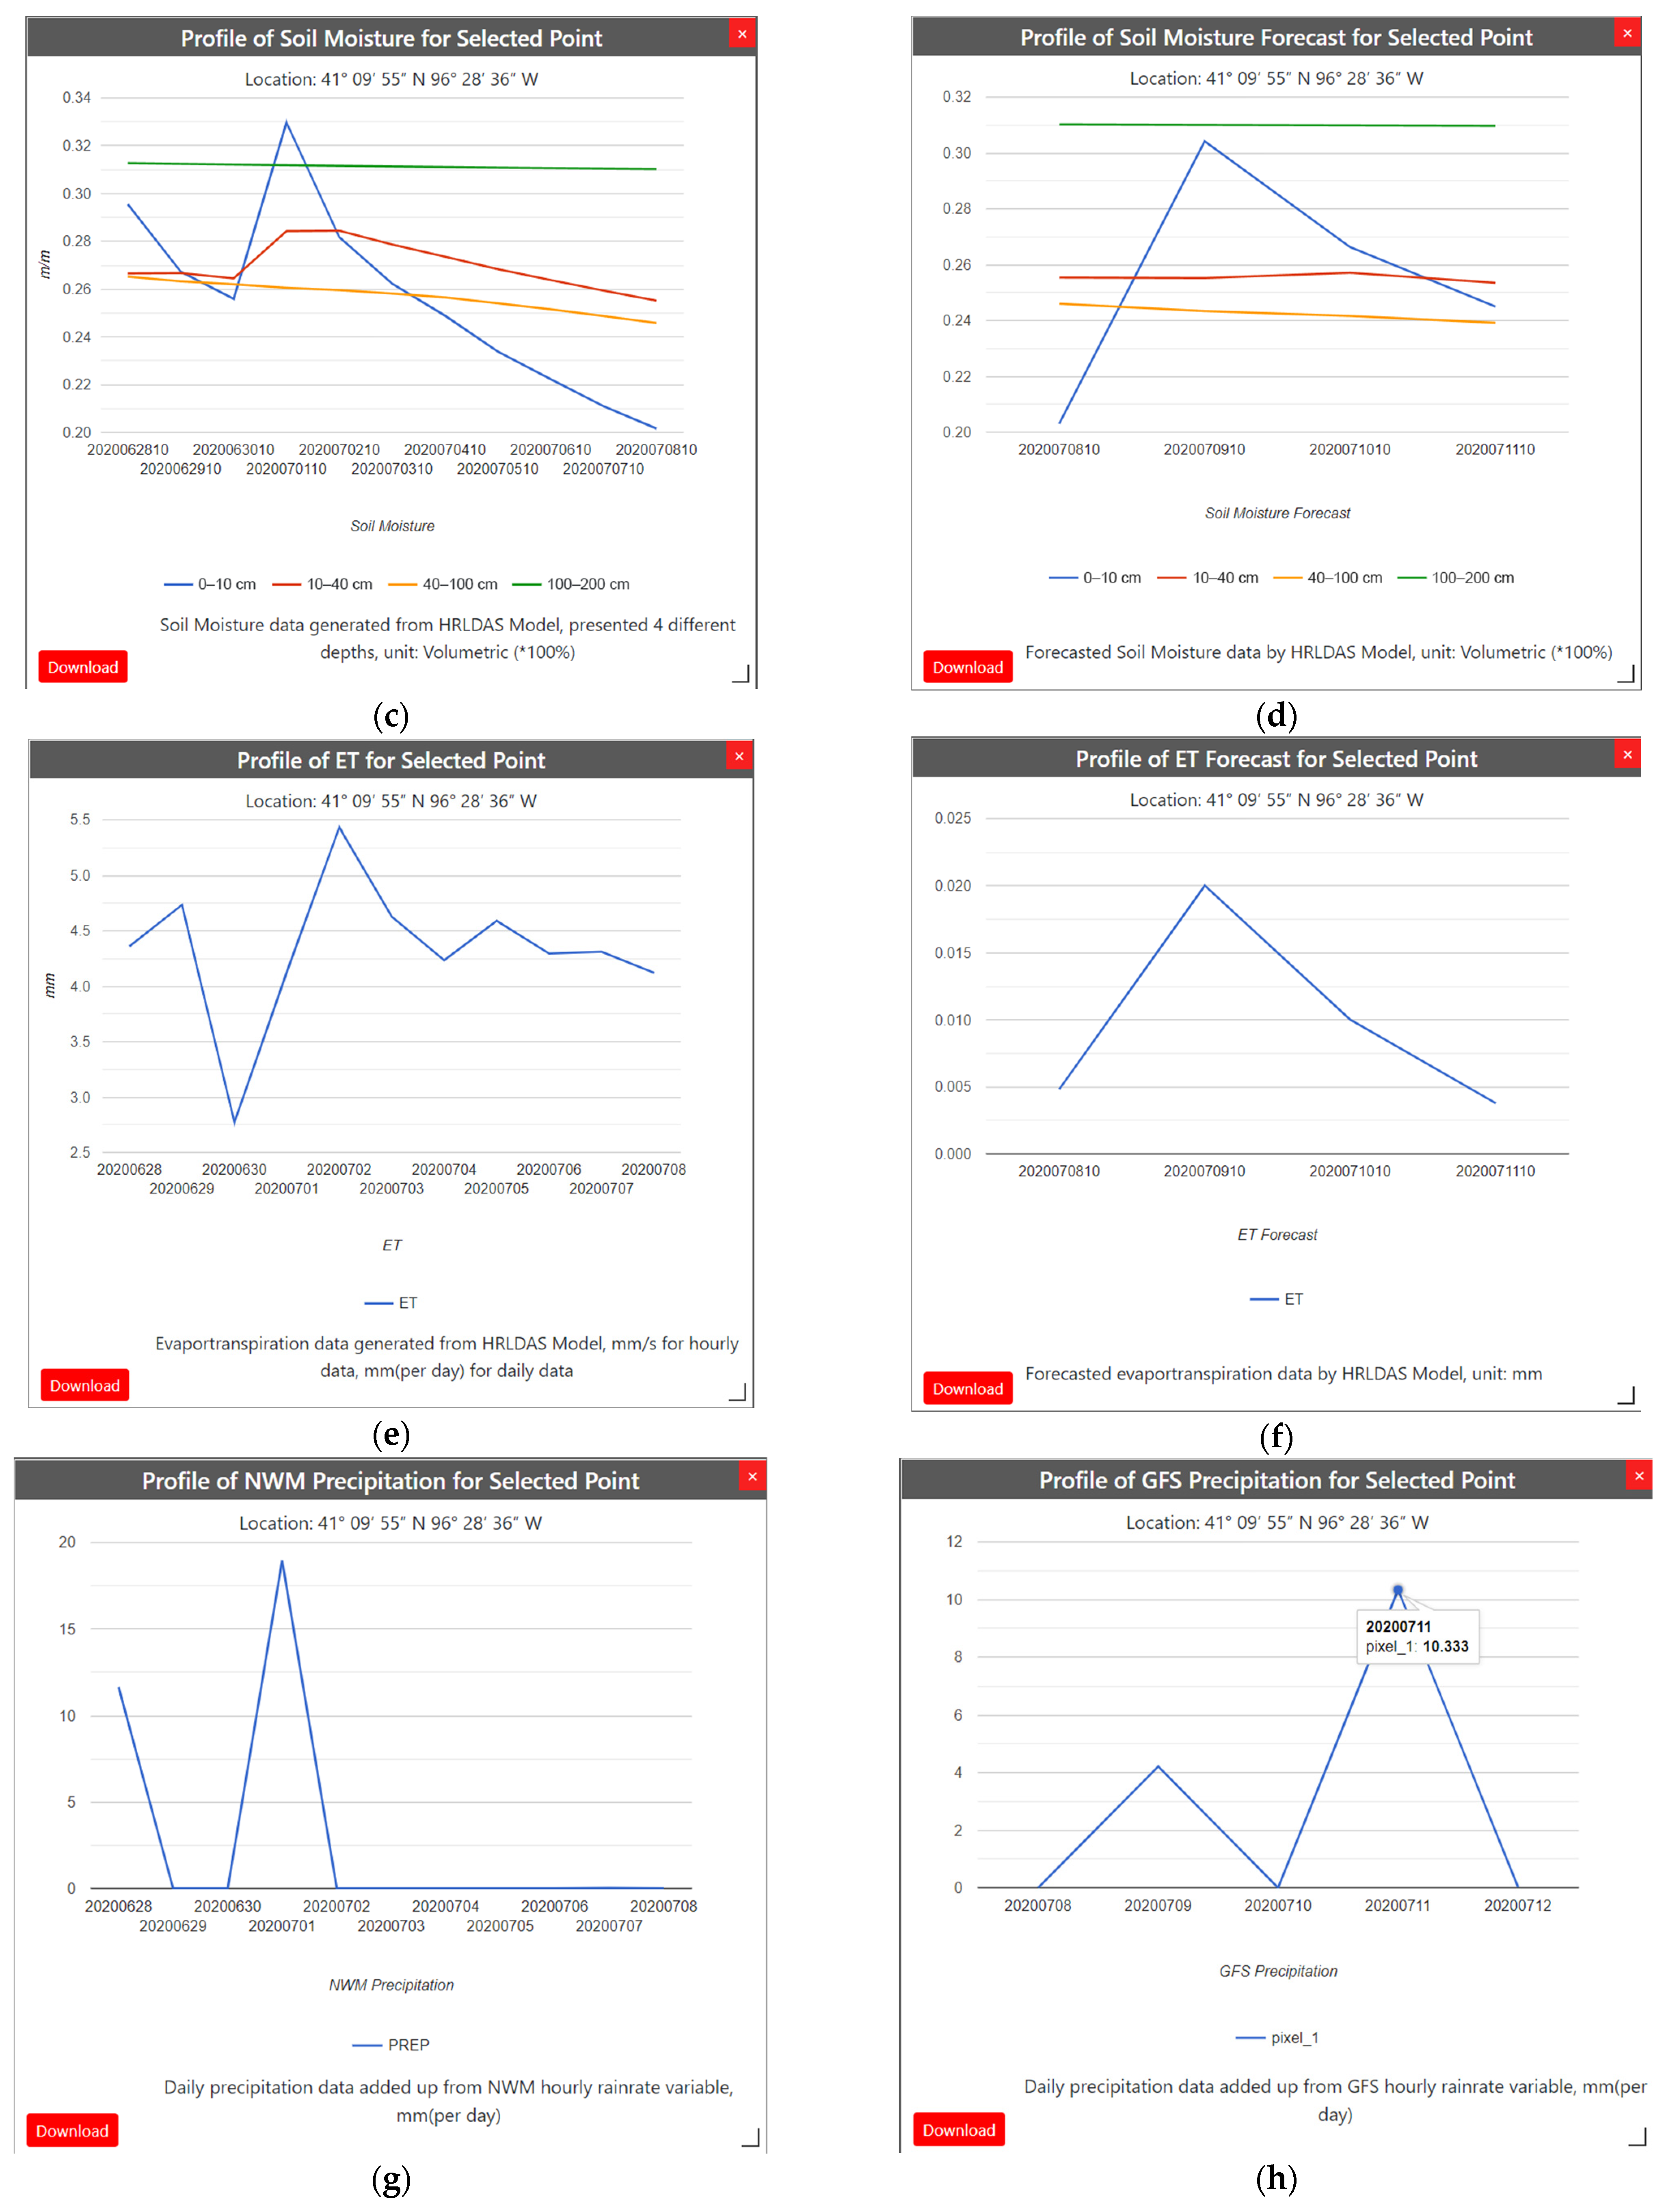
5.1. Use Scenario #1: Early Growing Season (April, May, June)

In the early growing season, the temperature is cooler. This lessens the amount of water lost to soil evaporation and allows more of the stored soil water to be used for crop transpiration. Meanwhile, the amount of rainfall in this period is greater than the amount of crop ET. Therefore, irrigation is not usually applied in this period. Users would mainly use our portal to monitor soil moisture, ET, and precipitation daily or hourly on one specific crop field or the general Nebraska cropland.
A calendar widget provides the options to select the day or hour of interest during the early growing season. Users can find a brief introduction about the product type they selected, as shown in Figure 4. Based on selected time and product type, the product layer will be fetched from the server side then visualized on the map explorer.
In addition to the visualization of multiple products on the map explorer, the statistical function on the left sidebar provides a more detailed and accurate scope to investigate the distribution pattern of ET or other products for a given AOI. As shown in Figure 5a, the table lists pixel numbers, acreage, and percentage of different categories of ET on 7 April 2021. A pie chart and bar chart are available on top of the dialog to represent the retrieved statistic result in a more attractive way. The statistic function is also able to return the result of cropland only and overall result. Regarding the defined AOI, raw data as well as a PDF formatted map decorated with scale, compass, legend, and geographic frame can be downloaded. As forecasted data are also available, users may not only try to monitor ET in a near-real-time manner, but also consider the timeseries of ET in the near future for a certain field. Once product type, timeseries step, and period are determined, for example, daily ET from 1 May 2021 to 1 July 2021, the daily ET time series would be returned and delineated in a line chart. The raw data of the result in CSV format are also available for downloading. Figure 5 exhibits the results of statistics and timeseries functions.

5.2. Use Scenario #2: Irrigation Season (July, August)

As the growing season progresses and canopy cover increases, evaporation from the wet soil surface gradually decreases. When the crop reaches full cover, approximately 95 percent of ET is due to transpiration and evaporation from the crop canopy, where most of the solar radiation is intercepted. Beginning from July, high temperature and long daylight time result in a much larger ET than that in the early growing season. The rainfall amount, decreasing in the meanwhile, cannot keep the stored soil water at file capacity. In this period, farmers have to observe their farms very closely and carefully and irrigate in time to make sure the crop yield will not be affected by water shortage. It is a very complicated and dynamic process to decide when and how much water to irrigate in a given field. Traditionally, farmers need to check the soil surface, crop leaves, local weather forecasting, as well as their following work schedule before they make a decision of irrigation. Usually, they tend to apply more water than necessary to their fields at a much earlier time, before soil water cannot afford crop ET, to ensure the crop health.
With the support of the WaterSmart-GIS, farmers can now easily find out the soil properties, crop health condition, soil water level in the root zone, daily and hourly ET, and weather conditions, most of which will be updated in a near-real-time manner together with forecasted data. Therefore, all the information needed for irrigation decision making is provided to farm users in our portal. The following describes two different ways to utilize our portal for irrigation decision making.
For one crop field located in 41.1651° N, 96.4766° W, users may need to know its soil properties, which should be constant for a long time, as well as recent and forecasted ET, soil moisture, and weather variables. Other than the time series information for ET and soil moisture products, the timeseries function also provides a comprehensive list of soil property and weather condition variables. All these requested data are returned and listed in a table or line chart by the timeseries function. Figure 6 lists this information in the scenario that an irrigation is pending on 8 July 2020 for this field. The soil properties, as listed in Figure 6a, provide important information including available water holding capacity, fragments of sand, silt, and clay in the soil, as well as other chemical and physical properties. Together with the soil moisture level like in Figure 6c, users can determine the upper limit of the irrigation amount, exceeding which the irrigated water would be a waste of resource. Detailed weather variables such as wind speed, temperature, rain rate, and surface pressure are given out by the National Water Model in Figure 6b. A clear decreasing trend in soil moisture is presented in Figure 6c from 28 June to 8 July, which is probably caused by the high ET and no rain since 2 July according to Figure 6e,g. The decision must be made whether to irrigate or not. By checking the forecasted rain rate and ET, in Figure 6f,h, users can expect a small rain on 9 July and another larger rain on 11 July, while the ET keeps decreasing. The increasing forecasted soil moisture in Figure 6c confirms this. Considering the information above, irrigation may not be necessary on 8 July.
In the previous case, although users could have a thorough overview of all the information related to the crop field, they would need to request multiple times for different data. If one wishes to know only some of the information in an independent dialog, we recommend another way to inspect the layers. After layers are loaded for viewing, users can request the exact values of all the loaded layers on the selected point. That is to say, a function to query pixel information is designed and provided to users on the top right toolbar. After entering this inspection mode, users can check their interested place on the map. A popup window will appear nearby containing the grid values of all visible layers on the map together with the point latitude and longitude, as shown in Figure 7b. Through this way, a user-customized profile at this point can be generated. In the example below, the high ET and low level of rootzone soil moisture indicate that irrigation is potentially needed. Furthermore, weather forecasting data indicate nearly no rain in the following several days. The soil moisture will keep reducing if there is no other intervention as the forecasted soil moisture illustrates. Therefore, it is reasonable to say that it is necessary to irrigate this field in the next few days.

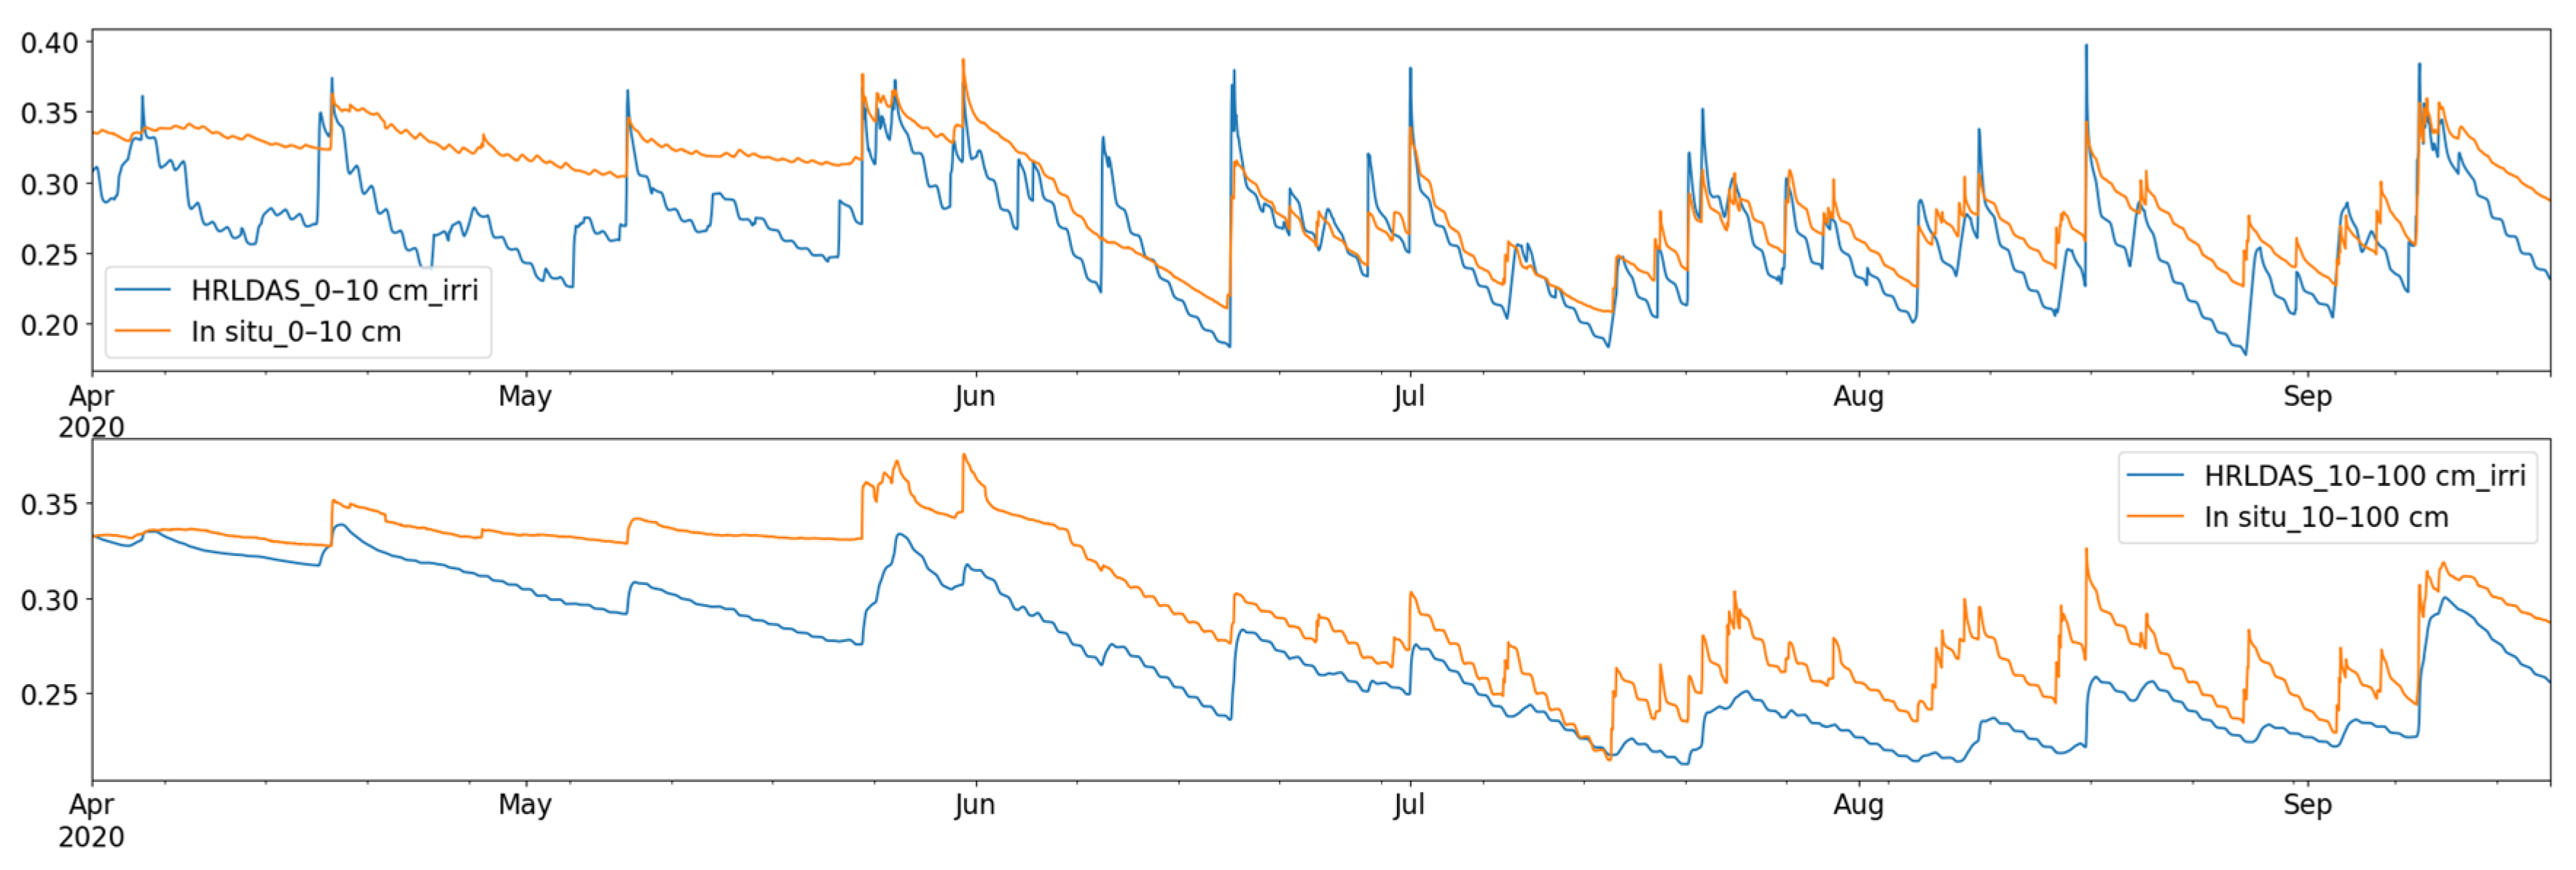
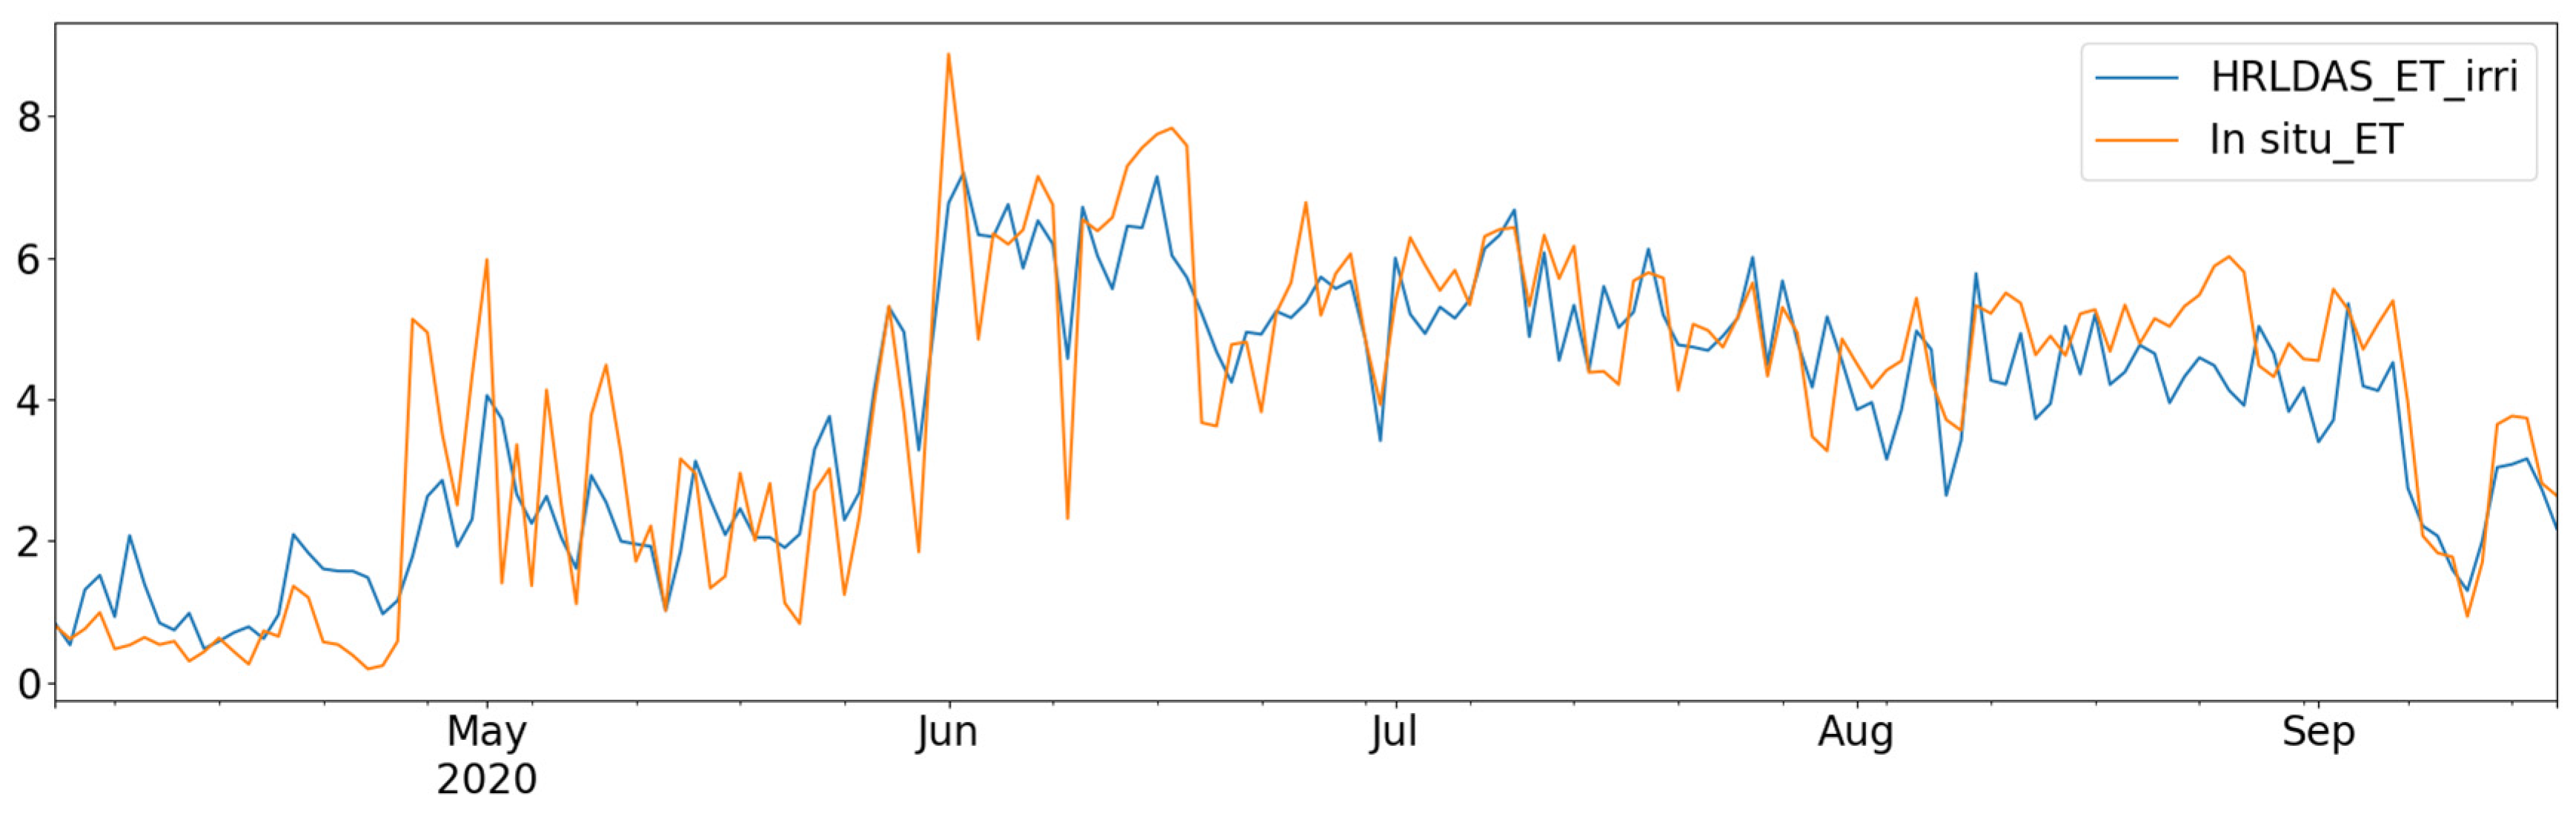
5.3. Evaluation of HRLDAS SM and ET with Ground Observations

The major task of WaterSmart-GIS is to provide products on monitoring and forecasting SM and ET. The primary products are generated by HRLDAS, thus it is necessary to evaluate and validate the accuracy of HRLDAS products. HRLDAS model soil moisture has been verified against observations from the Oklahoma Mesonet [61] in the past, which demonstrated that HRLDAS was able to capture the observed seasonal tendency of soil moisture evolution [15]. In this study, data from all three sites of AmeriFlux network inside Nebraska, namely, US-Ne1, US-Ne2, US-Ne3, in 2020 growing season, are collected for evaluation. US-Ne1 and US-Ne2 are irrigated and US-Ne3 is rainfed. We therefore incorporated in situ irrigation information of these sites into the model input to capture soil moisture peaks caused by irrigation. As shown in Figure 8, the orange curve is the observed SM from AmeriFlux network, and the blue line is the HRLDAS output in 2020. In the early growing season, the HRLDAS soil moisture is generally lower than observed values at both surface and rootzone soil. From June to the end of the growing season, the HRLDAS starts to do well on capturing most peaks caused by precipitation, and the simulated values are very close to the real values, or at least in the same range. We use root mean square error (RMSE) to evaluate the overall accuracy of the model soil moisture. The RMSE of surface (top 10 cm) soil moisture is 0.036 m3/m3, and 0.038 m3/m3 for the rootzone (10 cm to 100 cm) soil moisture, which is similar to former verification study of model soil moisture [62] and below the SMAP mission accuracy requirement of 0.04 m3/m3 [45]. Although HRLDAS produces slightly lower soil moisture in the rootzone layer during the growing season, the RMSE of 0.023 m3/m3, and 0.037 m3/m3 for surface and rootzone soil moisture during irrigation season (from middle of June to the end of August), are still acceptable.
Figure 9 shows a comparison of the HRLDAS ET and the sensed real ET data from the same three sites of AmeriFlux network. HRLDAS ET has a generally good agreement with observations with a correlation (R2) of 0.81, and the RMSE of ET is 0.92 mm/day. This is within the error range of ET in irrigation water management, and agrees with another ET modeling study [63]. In the early growing season, ET is generally low due to the lack of vegetation. During the growing season, as there is a steady amount of water vapor from crops, ET starts to rise from late May and keeps high to the end of the growing season. Although the figure shows a certain level of inconsistency, the seasonal tendency of ET has been depicted well by the model.
Results without in situ irrigation information incorporated are also presented in Figure 10 and Figure 11 to demonstrate the model performance without user-supplied information. Compare to the results with in situ irrigation information, some soil moisture peaks are not depicted by the model without irrigation information during the irrigation season. Estimated surface-layer soil moisture and ET are very similar with or without irrigation data incorporated. Only rootzone soil moisture is accumulated and higher than that without irrigation data incorporated during the irrigation season when irrigation is frequently applied. The overall soil moisture accuracy also reduces to 0.043 m3/m3 for surface, and 0.049 m3/m3 for rootzone. The RMSE of model ET is 1.10 mm/day without the in situ irrigation information and its correlation with real ET is 0.77. Although these results can still capture the seasonal tendency and support irrigation decision making, the accuracy reductions indicate that past irrigation activities in the current growing season should be fully considered in simulation. Note that this is a very preliminary evaluation of model results at only three sites and for one year. A more complete evaluation plan is outlined in Section 6.2. Future Work.

6. Discussion

6.1. Benefits for Agriculture Researchers and Decision Making

This system can serve as a one-stop shop for agronomists and agriculture researchers to browse, observe, analyze, and download almost all the types of data related to irrigation, including remote sensing and model simulation. Its novel contribution to the research community is its comprehensiveness and flexibility on data manipulation and visualization. Using standardized web interfaces, the agriculture-themed data are organized and streamed in layers via OGC web services and RESTful APIs. Researchers can not only intuitively browse the data, but also obtain data time series of interesting locations. It also allows people to compare across product types by creating profiles of a location. People can obtain a holistic report about the soil texture, water content, chemical properties, wilting point, field capacity, historical soil moisture, etc. With such a tool, researchers can easily extract required information without spending time searching and performing data formation or transformation work. For decision makers, WaterSmart-GIS could serve as a bridge between them and scientists. They can gain a direct visual understanding of the soil moisture status with less explanation from scientists and stimulate the communication to drive in-time effective decisions. Compared to other web information systems, WaterSmart-GIS combines the most popular GIS functionalities such as statistics and profiling and expands them to HRLDAS model results, which has rarely been seen in numerical model visualization systems. The soil status and evapotranspiration that can actually impact the real-world decisions should be accessed easily through web systems. WaterSmart-GIS fills in that gap and provides rich data from multiple sources on SM and ET in a timely manner. Remote sensing data products such as SMAP and MODIS-based vegetation have about a 3–5 days delay, while HRLDAS products only have a 4 h latency, and can be used as a reliable data source for daily operation.

6.2. Future Work

The accuracy of SM and ET products is critical for supporting irrigation decision making. In this study, a preliminary evaluation of model products was presented based on in situ data of three sites inside Nebraska from AmeriFlux network. An extensive evaluation would be conducted in our next step. In situ data of more sites from AmeriFlux and other monitoring networks such as the U.S. Climate Reference Network (USCRN, https://www.ncei.noaa.gov/access/crn/ (accessed on 17 April 2022)) developed by the National Oceanic and Atmospheric Administration (NOAA) and Soil Climate Analysis Network (SCAN, https://www.drought.gov/data-maps-tools/soil-climate-analysis-network-scan (accessed on 17 April 2022)) were collected from 2019 to 2021 for further evaluation of model products. Moreover, the NASA SMAP science team has conducted several algorithm validation field campaigns, including those specifically for agricultural fields. The data collected from those field campaigns will be used to validate the model products. The common validation practices described in the SMAP Algorithm Theoretical Basis Documents (ATBDs, https://eospso.nasa.gov/content/algorithm-theoretical-basis-documents (accessed on 17 April 2022)) will be followed. On the other hand, we will also use SMAP soil moisture products and NASA MODIS ET products for a spatially comprehensive validation. The HRLDAS products will be aggregated to the spatial resolution of the SMAP or MODIS ET products and compared with these products to compute RMSE at the coarse resolution. Since accuracy of the SMAP and MODIS ET products is known, this comparison will indirectly evaluate the quality of our ET and SM estimation.
Many things can be done to further improve the accuracy of the existing SM and ET products. The bottleneck challenge is the missing gaps in remote sensing products caused by clouds and satellite revisiting cycles. So many researchers are troubled by the lack of continuous and long-term data. Machine learning has been proven to be a robust tool to fill in the gaps, given adequate training data [64]. Free and open ground-truth data should also be made available along with the remote-sensed and model-simulated data for on-the-fly validation. Crowdsourced datasets such as roadside photos or field-collected soil samples (loam or clay) could be loaded to assist evaluation of the current situation on points [65]. Intercomparison among ground-sensed, remote-sensed, and model-simulated datasets should be made easier [66] by providing a one-click button for the selected AOIs. For researchers, machine learning-augmented continuous observations should be made available for downloading or hot analysis such as interpolation or correlation analysis. For decision makers, considering farmers’ work environment, it would be better if we make all the information accessible via mobile devices such as the smartphone, PDA devices on the tractors, or big equipment in the fields (such as central pivots). The ultimate goal is to make WaterSmart-GIS a one-stop outlet service for users to access and manipulate multisource SM and ET information and make wise decisions based on that. Current coverage is only for Nebraska and it can be extended to other states or even countries as well due to the global coverage of the remote sensing datasets and the HRLDAS model scaling capacity.

7. Conclusions

To address the shortage of near-real-time, useful public information on soil moisture and evapotranspiration, this paper developed a web application named WaterSmart-GIS to deliver near-real-time information about SM, ET, as well as weather variables such as precipitation, humidity, etc., to the stakeholders in a timely manner. The hosted or collected datasets include both real-time numerical model results from HRLDAS (High-Resolution Land Data Assimilation System), and the remote sensing datasets from NASA SMAP (Soil Moisture Active Passive) and MODIS (Moderate-Resolution Imaging Spectroradiometer). It aims to help farmers quickly and easily create a wiser customized irrigation scheduler for their individual fields, relieving the burden on farmers, and to significantly reduce the water waste, and energy and equipment cost, in excessive irrigation. Our current coverage of Nebraska shows that the system can effectively collect and deliver key information to the right users via a web application with the additional provided functionality of point-based query, spatial statistics, and profiling. Systems such as this will play a critical role in the next few decades to sustain agriculture and food security for humankind, as we face great challenges such as global warming, frequent exceptional drought, plague, wildfires, caused by the dramatic climate change, exploding human population, and tremendously accumulated green gas emission.

Author Contributions

Conceptualization, Liping Di; Data curation, Ziheng Sun; Formal analysis, Haoteng Zhao and Ziheng Sun; Funding acquisition, Liping Di; Investigation, Haoteng Zhao and Ziheng Sun; Methodology, Haoteng Zhao; Project administration, Liping Di; Resources, Ziheng Sun; Software, Haoteng Zhao and Ziheng Sun; Supervision, Liping Di; Validation, Haoteng Zhao; Visualization, Haoteng Zhao; Writing—original draft, Haoteng Zhao; Writing—review and editing, Ziheng Sun. All authors have read and agreed to the published version of the manuscript.

Funding

This research was supported by a grant from NSF (Grant #1739705, PI: L.D.).

Institutional Review Board Statement

Not applicable.

Informed Consent Statement

Not applicable.

Data Availability Statement

Publicly available datasets were analyzed in this study. These data can be found here: https://geobrain.csiss.gmu.edu/watersmartport/, accessed on 8 February 2022.

Acknowledgments

The authors would like to thank Sarah Di of Carnegie Mellon University for editing and proofreading this manuscript.

Conflicts of Interest

The authors declare no conflict of interest. The funders had no role in the design of the study; in the collection, analyses, or interpretation of data; in the writing of the manuscript, or in the decision to publish the results.

References

  1. Masson-Delmotte, V.; Zhai, P.; Pirani, A.; Connors, S.L.; Péan, C.; Berger, S.; Caud, N.; Chen, Y.; Goldfarb, L.; Gomis, M.I.; et al. (Eds.) IPCC, 2021: Climate Change 2021: The Physical Science Basis. Contribution of Working Group I to the Sixth Assessment Report of the Intergovernmental Panel on Climate Change; Cambridge University Press: Cambridge, UK, 2021. [Google Scholar]
  2. Lin, L.; Di, L.; Zhang, C.; Guo, L.; Tang, J.; Yu, E.; Rahman, M.S.; Zhao, H.; Yu, Z.; Sun, Z. Building Near-Real-Time MODIS Data Fusion Workflow to Support Agricultural Decision-making Applications. In Proceedings of the 2019 8th International Conference on Agro-Geoinformatics (Agro-Geoinformatics), Istanbul, Turkey, 16–19 July 2019; pp. 1–5. [Google Scholar]
  3. Sun, Z.; Di, L. A Review of Smart Irrigation Decision Support Systems. In Proceedings of the 2021 9th International Conference on Agro-Geoinformatics (Agro-Geoinformatics), Shenzhen, China, 26–29 July 2021; pp. 1–4. [Google Scholar]
  4. Zhang, C.; Di, L.; Hao, P.; Yang, Z.; Lin, L.; Zhao, H.; Guo, L. Rapid in-season mapping of corn and soybeans using machine-learned trusted pixels from Cropland Data Layer. Int. J. Appl. Earth Obs. Geoinf. 2021, 102, 102374. [Google Scholar] [CrossRef]
  5. Green, T.R.; Kipka, H.; David, O.; McMaster, G.S. Where is the USA Corn Belt, and how is it changing? Sci. Total Environ. 2018, 618, 1613–1618. [Google Scholar] [CrossRef] [PubMed] [Green Version]
  6. Christiansen, J.E. Irrigation by Sprinkling; University of California Berkeley: Berkeley, CA, USA, 1942; Volume 4. [Google Scholar]
  7. Grassini, P.; Yang, H.; Irmak, S.; Thorburn, J.; Burr, C.; Cassman, K.G. High-yield irrigated maize in the Western US Corn Belt: II. Irrigation management and crop water productivity. Field Crops Res. 2011, 120, 133–141. [Google Scholar] [CrossRef] [Green Version]
  8. Martin, D.; Kranz, W.; Smith, T.; Irmak, S.; Burr, C.; Yoder, R. Center Pivot Irrigation Handbook (ec3017); University of Nebraska-Lincoln: Lincoln, NE, USA, 2017. [Google Scholar]
  9. Neissi, L.; Albaji, M.; Nasab, S.B. Combination of GIS and AHP for site selection of pressurized irrigation systems in the Izeh plain, Iran. Agric. Water Manag. 2020, 231, 106004. [Google Scholar] [CrossRef]
  10. Yousaf, W.; Awan, W.K.; Kamran, M.; Ahmad, S.R.; Bodla, H.U.; Riaz, M.; Umar, M.; Chohan, K. A paradigm of GIS and remote sensing for crop water deficit assessment in near real time to improve irrigation distribution plan. Agric. Water Manag. 2021, 243, 106443. [Google Scholar] [CrossRef]
  11. Melton, F.S.; Huntington, J.; Grimm, R.; Herring, J.; Hall, M.; Rollison, D.; Erickson, T.; Allen, R.; Anderson, M.; Fisher, J.B. OpenET: Filling a critical data gap in water management for the western united states. JAWRA J. Am. Water Resour. Assoc. 2021. [Google Scholar] [CrossRef]
  12. Di, L.; Sun, Z. Big data and its applications in agro-geoinformatics. In Agro-Geoinformatics; Springer: Cham, Switzerland, 2021; pp. 143–162. [Google Scholar]
  13. Ara, I.; Turner, L.; Harrison, M.T.; Monjardino, M.; DeVoil, P.; Rodriguez, D. Application, adoption and opportunities for improving decision support systems in irrigated agriculture: A review. Agric. Water Manag. 2021, 257, 107161. [Google Scholar] [CrossRef]
  14. Fields, C.M.; Labadie, J.W.; Rohmat, F.I.; Johnson, L.E. Geospatial decision support system for ameliorating adverse impacts of irrigated agriculture on aquatic ecosystems. Agric. Water Manag. 2021, 252, 106877. [Google Scholar] [CrossRef]
  15. Chen, F.; Manning, K.W.; LeMone, M.A.; Trier, S.B.; Alfieri, J.G.; Roberts, R.; Tewari, M.; Niyogi, D.; Horst, T.W.; Oncley, S.P. Description and evaluation of the characteristics of the NCAR high-resolution land data assimilation system. J. Appl. Meteorol. Climatol. 2007, 46, 694–713. [Google Scholar] [CrossRef] [Green Version]
  16. Entekhabi, D.; Njoku, E.G.; O’Neill, P.E.; Kellogg, K.H.; Crow, W.T.; Edelstein, W.N.; Entin, J.K.; Goodman, S.D.; Jackson, T.J.; Johnson, J. The soil moisture active passive (SMAP) mission. Proc. IEEE 2010, 98, 704–716. [Google Scholar] [CrossRef]
  17. Justice, C.; Townshend, J.; Vermote, E.; Masuoka, E.; Wolfe, R.; Saleous, N.; Roy, D.; Morisette, J. An overview of MODIS Land data processing and product status. Remote Sens. Environ. 2002, 83, 3–15. [Google Scholar] [CrossRef]
  18. Bonfante, A.; Monaco, E.; Manna, P.; De Mascellis, R.; Basile, A.; Buonanno, M.; Cantilena, G.; Esposito, A.; Tedeschi, A.; De Michele, C. LCIS DSS—An irrigation supporting system for water use efficiency improvement in precision agriculture: A maize case study. Agric. Syst. 2019, 176, 102646. [Google Scholar] [CrossRef]
  19. Han, W.; Yang, Z.; Di, L.; Mueller, R. CropScape: A Web service based application for exploring and disseminating US conterminous geospatial cropland data products for decision support. Comput. Electron. Agric. 2012, 84, 111–123. [Google Scholar] [CrossRef]
  20. Simionesei, L.; Ramos, T.B.; Palma, J.; Oliveira, A.R.; Neves, R. IrrigaSys: A web-based irrigation decision support system based on open source data and technology. Comput. Electron. Agric. 2020, 178, 105822. [Google Scholar] [CrossRef]
  21. Zhang, C.; Yang, Z.; Di, L.; Yu, E.; Li, L.; Zhao, H. Web Geoprocessing Services for Disseminating and Analyzing SMAP Derived Soil Moisture Data Products. Earth Space Sci. Open Arch. ESSOAr 2020. [Google Scholar] [CrossRef]
  22. Bastiaanssen, W.G.; Menenti, M.; Feddes, R.; Holtslag, A. A remote sensing surface energy balance algorithm for land (SEBAL). 1. Formulation. J. Hydrol. 1998, 212, 198–212. [Google Scholar] [CrossRef]
  23. MacEachren, A.M.; Kraak, M.-J. Research challenges in geovisualization. Cartogr. Geogr. Inf. Sci. 2001, 28, 3–12. [Google Scholar] [CrossRef]
  24. Kilsedar, C.E.; Brovelli, M.A. Multidimensional Visualization and Processing of Big Open Urban Geospatial Data on the Web. ISPRS Int. J. Geo-Inf. 2020, 9, 434. [Google Scholar] [CrossRef]
  25. Salcedo-Gonzalez, M.; Suarez-Paez, J.; Esteve, M.; Gómez, J.A.; Palau, C.E. A novel method of spatiotemporal dynamic geo-visualization of criminal data, applied to command and control centers for public safety. ISPRS Int. J. Geo-Inf. 2020, 9, 160. [Google Scholar] [CrossRef] [Green Version]
  26. Guimarães, N.; Pádua, L.; Adão, T.; Hruška, J.; Peres, E.; Sousa, J.J. VisWebDrone: A Web Application for UAV Photogrammetry Based on Open-Source Software. ISPRS Int. J. Geo-Inf. 2020, 9, 679. [Google Scholar] [CrossRef]
  27. Neuville, R.; Pouliot, J.; Poux, F.; De Rudder, L.; Billen, R. A formalized 3D geovisualization illustrated to selectivity purpose of virtual 3D city model. ISPRS Int. J. Geo-Inf. 2018, 7, 194. [Google Scholar] [CrossRef] [Green Version]
  28. Balla, D.; Zichar, M.; Kiss, E.; Szabó, G.; Mester, T. Possibilities for Assessment and Geovisualization of Spatial and Temporal Water Quality Data Using a WebGIS Application. ISPRS Int. J. Geo-Inf. 2022, 11, 108. [Google Scholar] [CrossRef]
  29. Mazzei, M.; Quaroni, D. Development of a 3D WebGIS Application for the Visualization of Seismic Risk on Infrastructural Work. ISPRS Int. J. Geo-Inf. 2022, 11, 22. [Google Scholar] [CrossRef]
  30. Papadopoulou, E.-E.; Kasapakis, V.; Vasilakos, C.; Papakonstantinou, A.; Zouros, N.; Chroni, A.; Soulakellis, N. Geovisualization of the Excavation Process in the Lesvos Petrified Forest, Greece Using Augmented Reality. ISPRS Int. J. Geo-Inf. 2020, 9, 374. [Google Scholar] [CrossRef]
  31. Wang, W.; Cui, Y.; Luo, Y.; Li, Z.; Tan, J. Web-based decision support system for canal irrigation management. Comput. Electron. Agric. 2019, 161, 312–321. [Google Scholar] [CrossRef]
  32. Ramos, T.; Simionesei, L.; Jauch, E.; Almeida, C.; Neves, R. Modelling soil water and maize growth dynamics influenced by shallow groundwater conditions in the Sorraia Valley region, Portugal. Agric. Water Manag. 2017, 185, 27–42. [Google Scholar] [CrossRef]
  33. Li, H.; Li, J.; Shen, Y.; Zhang, X.; Lei, Y. Web-based irrigation decision support system with limited inputs for farmers. Agric. Water Manag. 2018, 210, 279–285. [Google Scholar] [CrossRef]
  34. Allen, R.G.; Pereira, L.S.; Smith, M.; Raes, D.; Wright, J.L. FAO-56 dual crop coefficient method for estimating evaporation from soil and application extensions. J. Irrig. Drain. Eng. 2005, 131, 2–13. [Google Scholar] [CrossRef] [Green Version]
  35. Machwitz, M.; Hass, E.; Junk, J.; Udelhoven, T.; Schlerf, M. CropGIS–A web application for the spatial and temporal visualization of past, present and future crop biomass development. Comput. Electron. Agric. 2019, 161, 185–193. [Google Scholar] [CrossRef]
  36. Zhang, C.; Di, L.; Yang, Z.; Lin, L.; Eugene, G.Y.; Yu, Z.; Rahman, M.S.; Zhao, H. Cloud environment for disseminating NASS cropland data layer. In Proceedings of the 2019 8th International Conference on Agro-Geoinformatics (Agro-Geoinformatics), Istanbul, Turkey, 16–19 July 2019; pp. 1–5. [Google Scholar]
  37. Yang, Z.; Yu, G.; Di, L.; Zhang, B.; Han, W.; Mueller, R. Web service-based vegetation condition monitoring system-vegscape. In Proceedings of the 2013 IEEE International Geoscience and Remote Sensing Symposium-IGARSS, Melbourne, Australia, 21–26 July 2013; pp. 3638–3641. [Google Scholar]
  38. Huang, J.; Buchanan, S.; Bishop, T.; Triantafilis, J. terra GIS-a web GIS for delivery of digital soil maps in cotton-growing areas of Australia. Soil Use Manag. 2017, 33, 568–582. [Google Scholar] [CrossRef]
  39. Piedelobo, L.; Ortega-Terol, D.; Del Pozo, S.; Hernández-López, D.; Ballesteros, R.; Moreno, M.A.; Molina, J.-L.; González-Aguilera, D. HidroMap: A new tool for irrigation monitoring and management using free satellite imagery. ISPRS Int. J. Geo-Inf. 2018, 7, 220. [Google Scholar] [CrossRef] [Green Version]
  40. Sun, Z.; Di, L.; Fang, H.; Guo, L.; Yu, E.; Tang, J.; Zhao, H.; Gaigalas, J.; Zhang, C.; Lin, L. Advanced cyberinfrastructure for agricultural drought monitoring. In Proceedings of the 2019 8th International Conference on Agro-Geoinformatics (Agro-Geoinformatics), Istanbul, Turkey, 16–19 July 2019; pp. 1–5. [Google Scholar]
  41. Sun, Z.; Di, L.; Zhang, C.; Fang, H.; Yu, E.; Lin, L.; Tang, J.; Tan, X.; Liu, Z.; Jiang, L. Building robust geospatial web services for agricultural information extraction and sharing. In Proceedings of the 2017 6th International Conference on Agro-Geoinformatics, Fairfax, VA, USA, 7–10 August 2017; pp. 1–4. [Google Scholar]
  42. Cosgrove, B.; Gochis, D.; Clark, E.P.; Cui, Z.; Dugger, A.L.; Feng, X.; Karsten, L.R.; Khan, S.; Kitzmiller, D.; Lee, H.S. An Overview of the National Weather Service National Water Model. In Proceedings of the AGU Fall Meeting Abstracts, San Francisco, CA, USA, 12–16 December 2016; p. H42B–05. [Google Scholar]
  43. NCEP; NWS; NOAA; DOC. NCEP Global Forecast System (GFS) Analyses and Forecasts; The National Center for Atmospheric Research: Boulder, CO, USA, 2007. [Google Scholar] [CrossRef]
  44. Baldocchi, D.; Falge, E.; Gu, L.; Olson, R.; Hollinger, D.; Running, S.; Anthoni, P.; Bernhofer, C.; Davis, K.; Evans, R. FLUXNET: A new tool to study the temporal and spatial variability of ecosystem-scale carbon dioxide, water vapor, and energy flux densities. Bull. Am. Meteorol. Soc. 2001, 82, 2415–2434. [Google Scholar] [CrossRef]
  45. Chan, S.K.; Bindlish, R.; O’Neill, P.E.; Njoku, E.; Jackson, T.; Colliander, A.; Chen, F.; Burgin, M.; Dunbar, S.; Piepmeier, J. Assessment of the SMAP passive soil moisture product. IEEE Trans. Geosci. Remote Sens. 2016, 54, 4994–5007. [Google Scholar] [CrossRef]
  46. Colliander, A.; Reichle, R.H.; Crow, W.T.; Cosh, M.H.; Chen, F.; Chan, S.; Das, N.N.; Bindlish, R.; Chaubell, J.; Kim, S. Validation of soil moisture data products from the NASA SMAP mission. IEEE J. Sel. Top. Appl. Earth Obs. Remote Sens. 2021, 15, 364–392. [Google Scholar] [CrossRef]
  47. Reichle, R.; De Lannoy, G.; Koster, R.D.; Crow, W.T.; Kimball, J.S. and Liu, Q. SMAP L4 Global 3-hourly 9 km EASE-Grid Surface and Root Zone Soil Moisture Geophysical Data, Version 6; SMAP observatory: Boulder, CO, USA, 2021. [Google Scholar] [CrossRef]
  48. Colliander, A.; Yang, Z.; Mueller, R.; Sandborn, A.; Reichle, R.; Crow, W.; Entekhabi, D.; Yueh, S. Consistency between NASS surveyed soil moisture conditions and SMAP soil moisture observations. Water Resour. Res. 2019, 55, 7682–7693. [Google Scholar] [CrossRef]
  49. Walkinshaw, M.; O’Geen, A.T.; Beaudette, D.E. Soil Properties; California Soil Resource Lab: Davis, CA, USA, 2020. [Google Scholar]
  50. Liu, W.T.; Kogan, F.N. Monitoring regional drought using the Vegetation Condition Index. Int. J. Remote Sens. 1996, 17, 2761–2782. [Google Scholar] [CrossRef]
  51. Zhao, H.; Di, L.; Sun, Z.; Hao, P.; Yu, E.; Zhang, C.; Lin, L. Impacts of Soil Moisture on Crop Health: A Remote Sensing Perspective. In Proceedings of the 2021 9th International Conference on Agro-Geoinformatics (Agro-Geoinformatics), Shenzhen, China, 26–29 July 2021; pp. 1–4. [Google Scholar]
  52. Sun, Z.; Peng, C.; Deng, M.; Chen, A.; Yue, P.; Fang, H.; Di, L. Automation of customized and near-real-time vegetation condition index generation through cyberinfrastructure-based geoprocessing workflows. IEEE J. Sel. Top. Appl. Earth Obs. Remote Sens. 2014, 7, 4512–4522. [Google Scholar] [CrossRef]
  53. Sun, Z.; Di, L. Intercomparison of Agricultural Drought Monitoring Products. In Proceedings of the 2021 9th International Conference on Agro-Geoinformatics (Agro-Geoinformatics), Shenzhen, China, 26–29 July 2021; pp. 1–5. [Google Scholar]
  54. Hao, P.; Di, L.; Guo, L. Estimation of crop evapotranspiration from MODIS data by combining random forest and trapezoidal models. Agric. Water Manag. 2022, 259, 107249. [Google Scholar] [CrossRef]
  55. Wilson, K.; Goldstein, A.; Falge, E.; Aubinet, M.; Baldocchi, D.; Berbigier, P.; Bernhofer, C.; Ceulemans, R.; Dolman, H.; Field, C. Energy balance closure at FLUXNET sites. Agric. For. Meteorol. 2002, 113, 223–243. [Google Scholar] [CrossRef] [Green Version]
  56. Rew, R.; Davis, G. NetCDF: An interface for scientific data access. IEEE Comput. Graph. Appl. 1990, 10, 76–82. [Google Scholar] [CrossRef]
  57. Blower, J.D.; Gemmell, A.; Griffiths, G.H.; Haines, K.; Santokhee, A.; Yang, X. A Web Map Service implementation for the visualization of multidimensional gridded environmental data. Environ. Model. Softw. 2013, 47, 218–224. [Google Scholar] [CrossRef] [Green Version]
  58. Eaton, B.; Gregory, J.; Drach, B.; Taylor, K.; Hankin, S.; Caron, J.; Signell, R.; Bentley, P.; Rappa, G.; Höck, H. NetCDF Climate and Forecast (CF) Metadata Conventions. 2003. Available online: http://cfconventions.org/Data/cf-conventions/cf-conventions-1.8/cf-conventions.pdf (accessed on 17 April 2022).
  59. Spurlock, J. Bootstrap: Responsive Web Development; O’Reilly Media, Inc.: Sevastopol, CA, USA, 2013. [Google Scholar]
  60. Grinberg, M. Flask Web Development: Developing Web Applications with Python; O’Reilly Media, Inc.: Sevastopol, CA, USA, 2018. [Google Scholar]
  61. Brock, F.V.; Crawford, K.C.; Elliott, R.L.; Cuperus, G.W.; Stadler, S.J.; Johnson, H.L.; Eilts, M.D. The Oklahoma Mesonet: A technical overview. J. Atmos. Ocean. Technol. 1995, 12, 5–19. [Google Scholar] [CrossRef]
  62. Robock, A.; Luo, L.; Wood, E.F.; Wen, F.; Mitchell, K.E.; Houser, P.R.; Schaake, J.C.; Lohmann, D.; Cosgrove, B.; Sheffield, J. Evaluation of the North American Land Data Assimilation System over the southern Great Plains during the warm season. J. Geophys. Res. Atmos. 2003, 108, 8846. [Google Scholar]
  63. Anapalli, S.S.; Fisher, D.K.; Reddy, K.N.; Rajan, N.; Pinnamaneni, S.R. Modeling evapotranspiration for irrigation water management in a humid climate. Agric. Water Manag. 2019, 225, 105731. [Google Scholar]
  64. Almendra-Martín, L.; Martínez-Fernández, J.; Piles, M.; González-Zamora, Á. Comparison of gap-filling techniques applied to the CCI soil moisture database in Southern Europe. Remote Sens. Environ. 2021, 258, 112377. [Google Scholar]
  65. Sun, Z.; Di, L.; Cvetojevic, S.; Yu, Z. GeoFairy2: A Cross-Institution Mobile Gateway to Location-Linked Data for In-Situ Decision Making. ISPRS Int. J. Geo-Inf. 2021, 10, 1. [Google Scholar] [CrossRef]
  66. Sun, Z.; Di, L.; Cash, B.; Gaigalas, J. Advanced cyberinfrastructure for intercomparison and validation of climate models. Environ. Model. Softw. 2020, 123, 104559. [Google Scholar]
Figure 1. WaterSmart-GIS architect design.
Ijgi 11 00271 g001
Figure 2. WaterSmart-GIS web interface.
Ijgi 11 00271 g002
Figure 3. The Nebraska maps of its: (a) location; (b) crop types; (c) soil texture class; and (d) annual total precipitation (mm).
Ijgi 11 00271 g003aIjgi 11 00271 g003b
Figure 4. Soil moisture map in Nebraska on 7 March 2022.
Ijgi 11 00271 g004
Figure 5. Results table and charts for selected AOI and points returned by provided analysis functions: (a) Statistical result of ET in the user-defined AOI; (b) Hourly ET time series of line chart of user-selected point; (c,d) Pie chart and bar chart of the statistical result in (a).
Ijgi 11 00271 g005
Figure 6. Information needed before irrigation decision making. (a) Soil properties; (b) Weather variables; (c,d) Recent and future soil moisture; (e,f) Recent and future ET; (g,h) Recent and future rain rate.
Ijgi 11 00271 g006aIjgi 11 00271 g006b
Figure 7. (a) Selected farm field; (b) Generating a customized profile of multiple variables for the selected location; (c) A photo of the selected farm filed.
Ijgi 11 00271 g007aIjgi 11 00271 g007b
Figure 8. A comparison of HRLDAS SM and ground-observed SM in 2020, averaged over three sites inside Nebraska (from top to bottom: 0–10 cm, 10–100 cm depth).
Ijgi 11 00271 g008
Figure 9. A comparison of HRLDAS ET and ground-observed ET in 2020 growing season, averaged over three sites inside Nebraska.
Ijgi 11 00271 g009
Figure 10. HRLDAS SM with and without in situ irrigation information incorporated in 2020, averaged over three sites inside Nebraska (from top to bottom: 0–10 cm, 10–100 cm depth).
Ijgi 11 00271 g010
Figure 11. HRLDAS ET with and without in situ irrigation information incorporated in the 2020 growing season, averaged over three sites inside Nebraska.
Ijgi 11 00271 g011
Table 1. Resolution specifications of the five categories of products and weather variables.
Data CategoryData ProductSpatial ResolutionTemporal Resolution
HRLDAS OutputsSoil Moisture500 mHourly
Forecasted Soil Moisture500 mHourly
ET500 mHourly
ET500 mDaily
Forecasted ET500 mHourly
SMAPSoil Moisture9 km3 Hours
Soil Moisture9 kmDaily
Soil Moisture9 kmWeekly
Categorical Soil Moisture Condition9 kmWeekly
Soil PropertiesCalcium Carbonate800 m/ *
Cation Exchange Capacity800 m/
Electrical Conductivity800 m/
pH800 m/
Sodium Adsorption Ratio800 m/
Available Water Holding Capacity800 m/
Permanent Wilting Point800 m/
Bulk Density800 m/
Percent Sand800 m/
Percent Clay800 m/
Percent Silt800 m/
Vegetation IndexNDVI250 mDaily
NDVI250 mWeekly
VCI250 mWeekly
ML-Derived ProductsSM1 kmDaily
ET1 kmDaily
Weather
Variable (NWM/GFS)
Air temperature500 mHourly
Surface Downward Longwave Flux500 mHourly
Surface Downward Shortwave Flux500 mHourly
Surface Specific Humidity500 mHourly
Wind Speed U-Component500 mHourly
Wind Speed V-Component500 mHourly
Air Pressure500 mHourly
Precipitation Flux500 mHourly
Precipitation500 mDaily
* Soil properties are static, and updated annually.
Table 2. Technologies used in WaterSmart-GIS.
Data FormatServerServiceFront-End
GeoTiffMapServerOGC WPS/WMS/WCS, Flask APIsOpenLayers, React, Bootstrap
NetCDFncWMS
Publisher’s Note: MDPI stays neutral with regard to jurisdictional claims in published maps and institutional affiliations.

