
Spatiotemporal Analysis of Traffic Accidents Hotspots Based on Geospatial Techniques


Abstract
:1. Introduction
2. Related Work and Original Contribution
3. Revisiting the GIS-Based Traffic Accidents Evaluation Methods
4. Materials and Methods
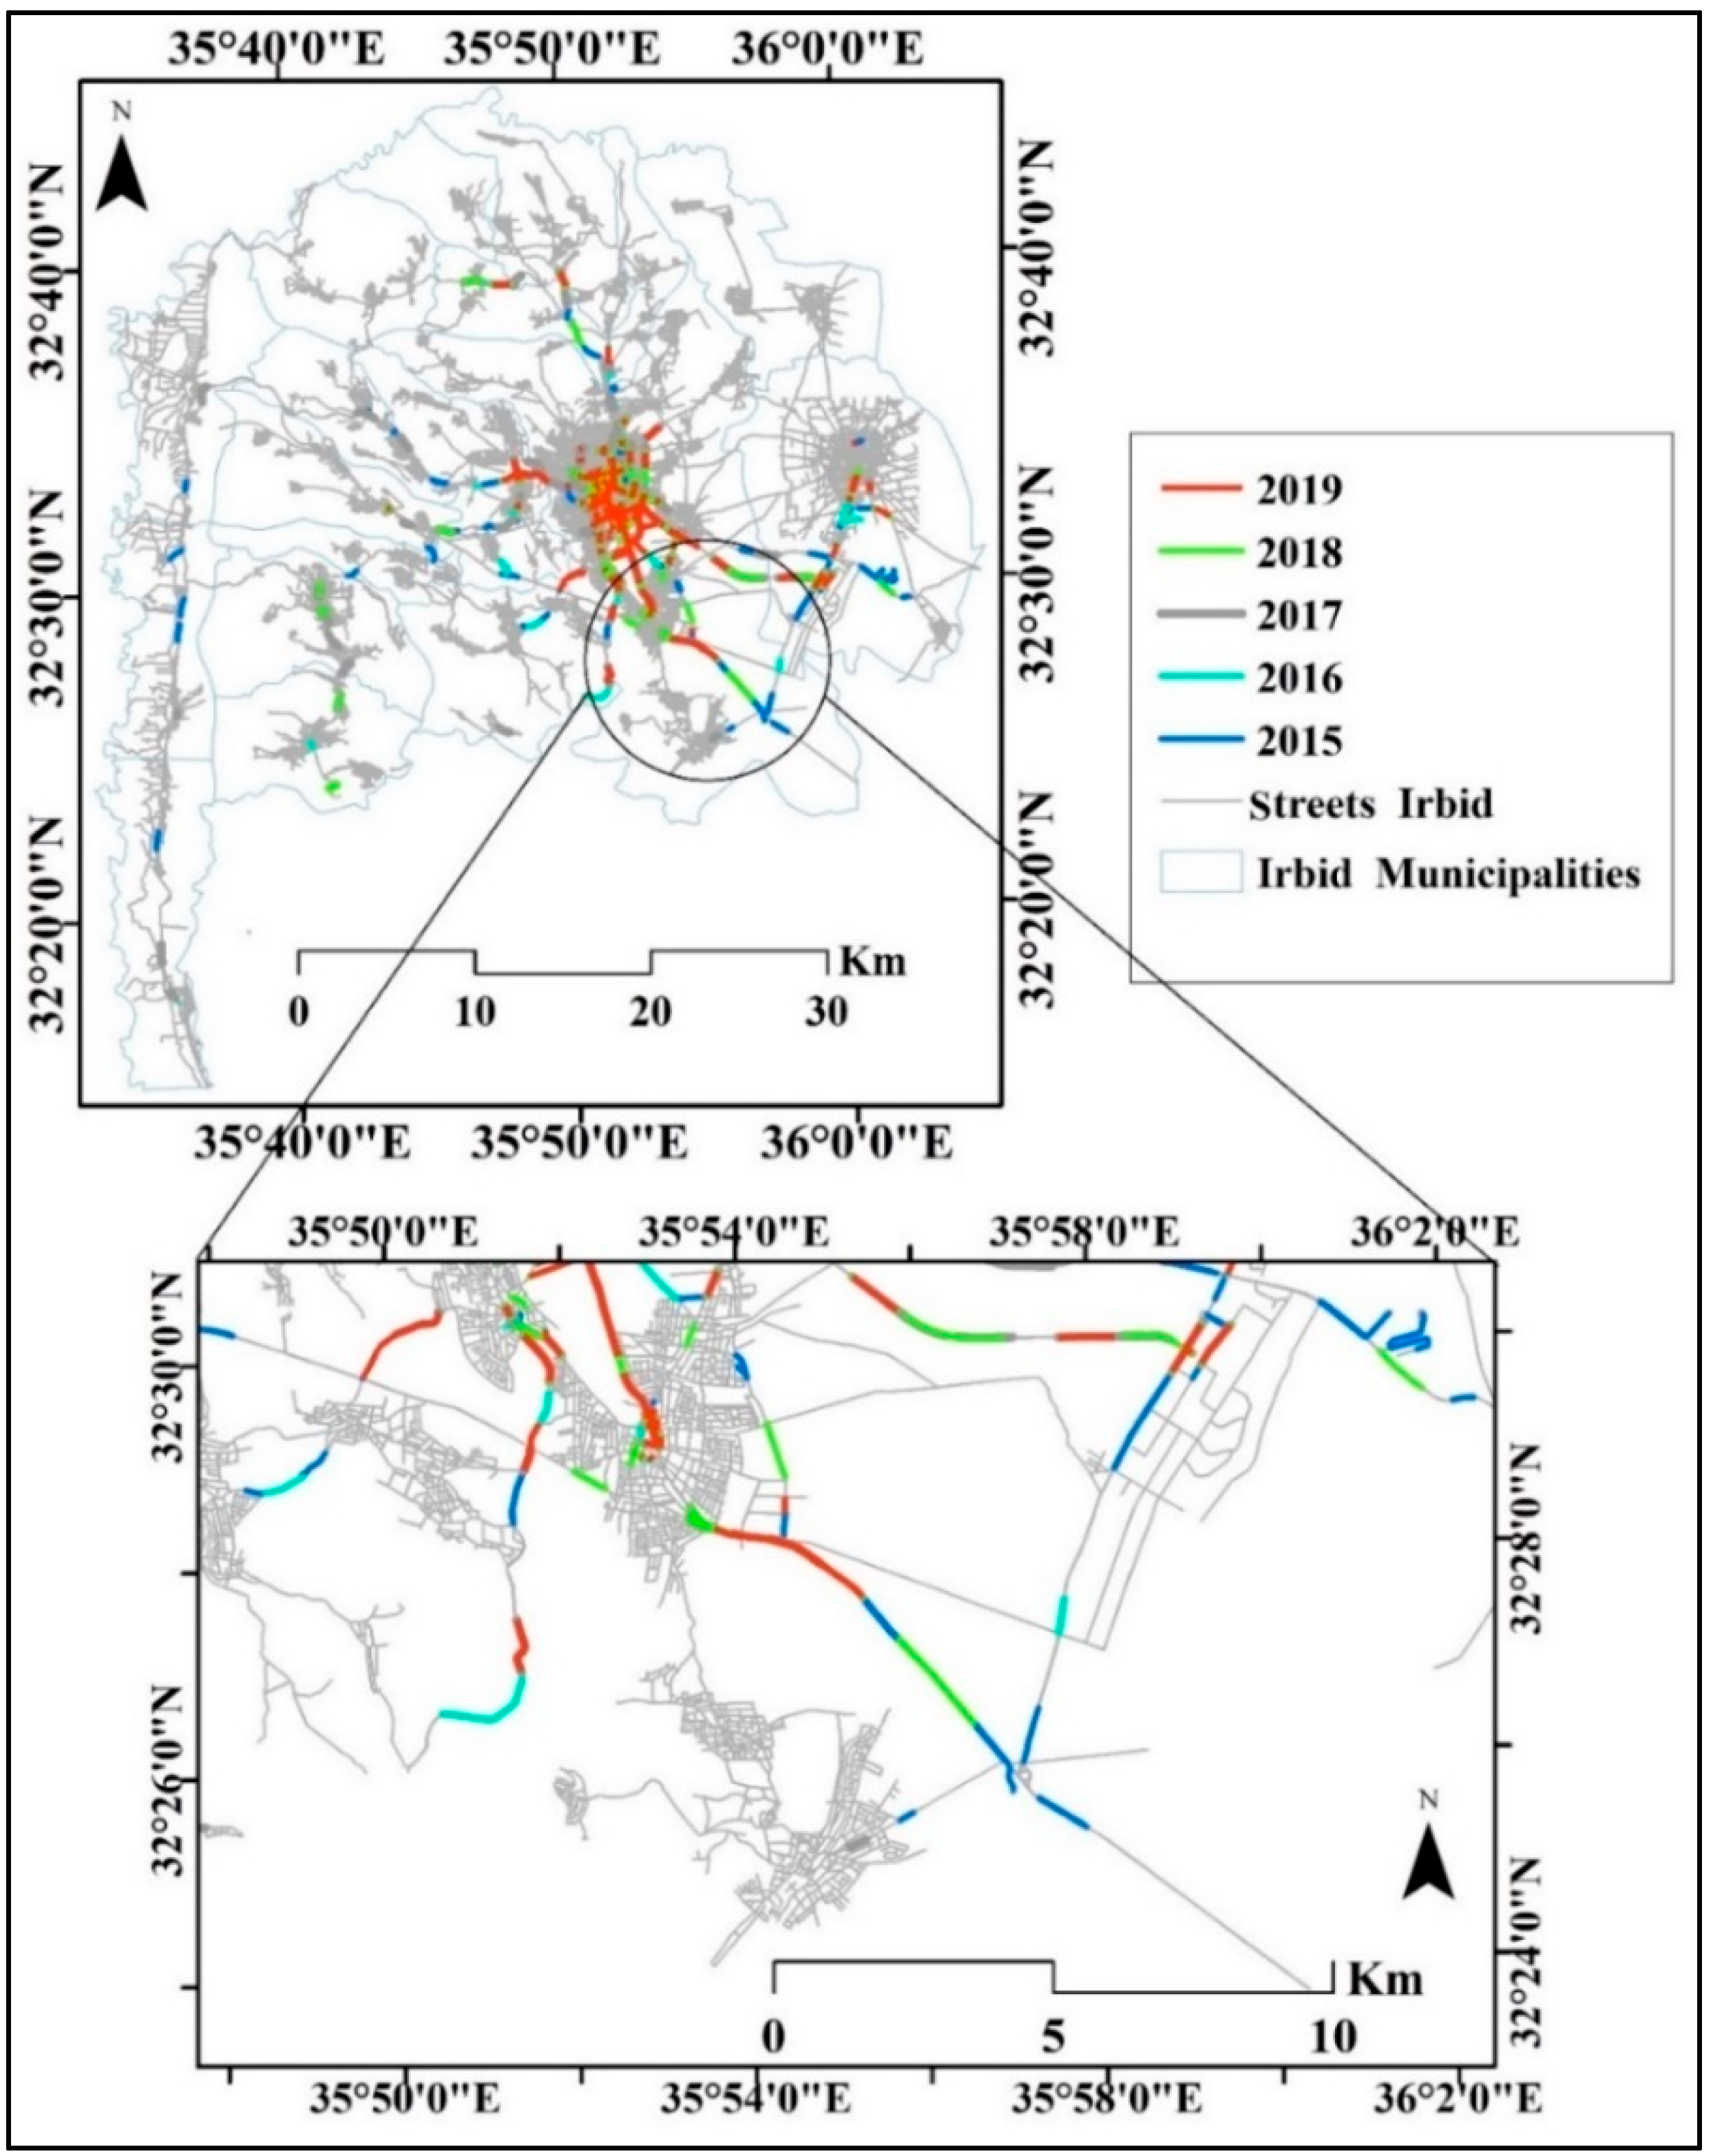
4.1. Study Area
4.2. Methods
4.2.1. Data and its Preprocessing
4.2.2. Hotspot Analysis of Traffic Accidents in Irbid Governorate
Defining the Spatial Unit of Analysis
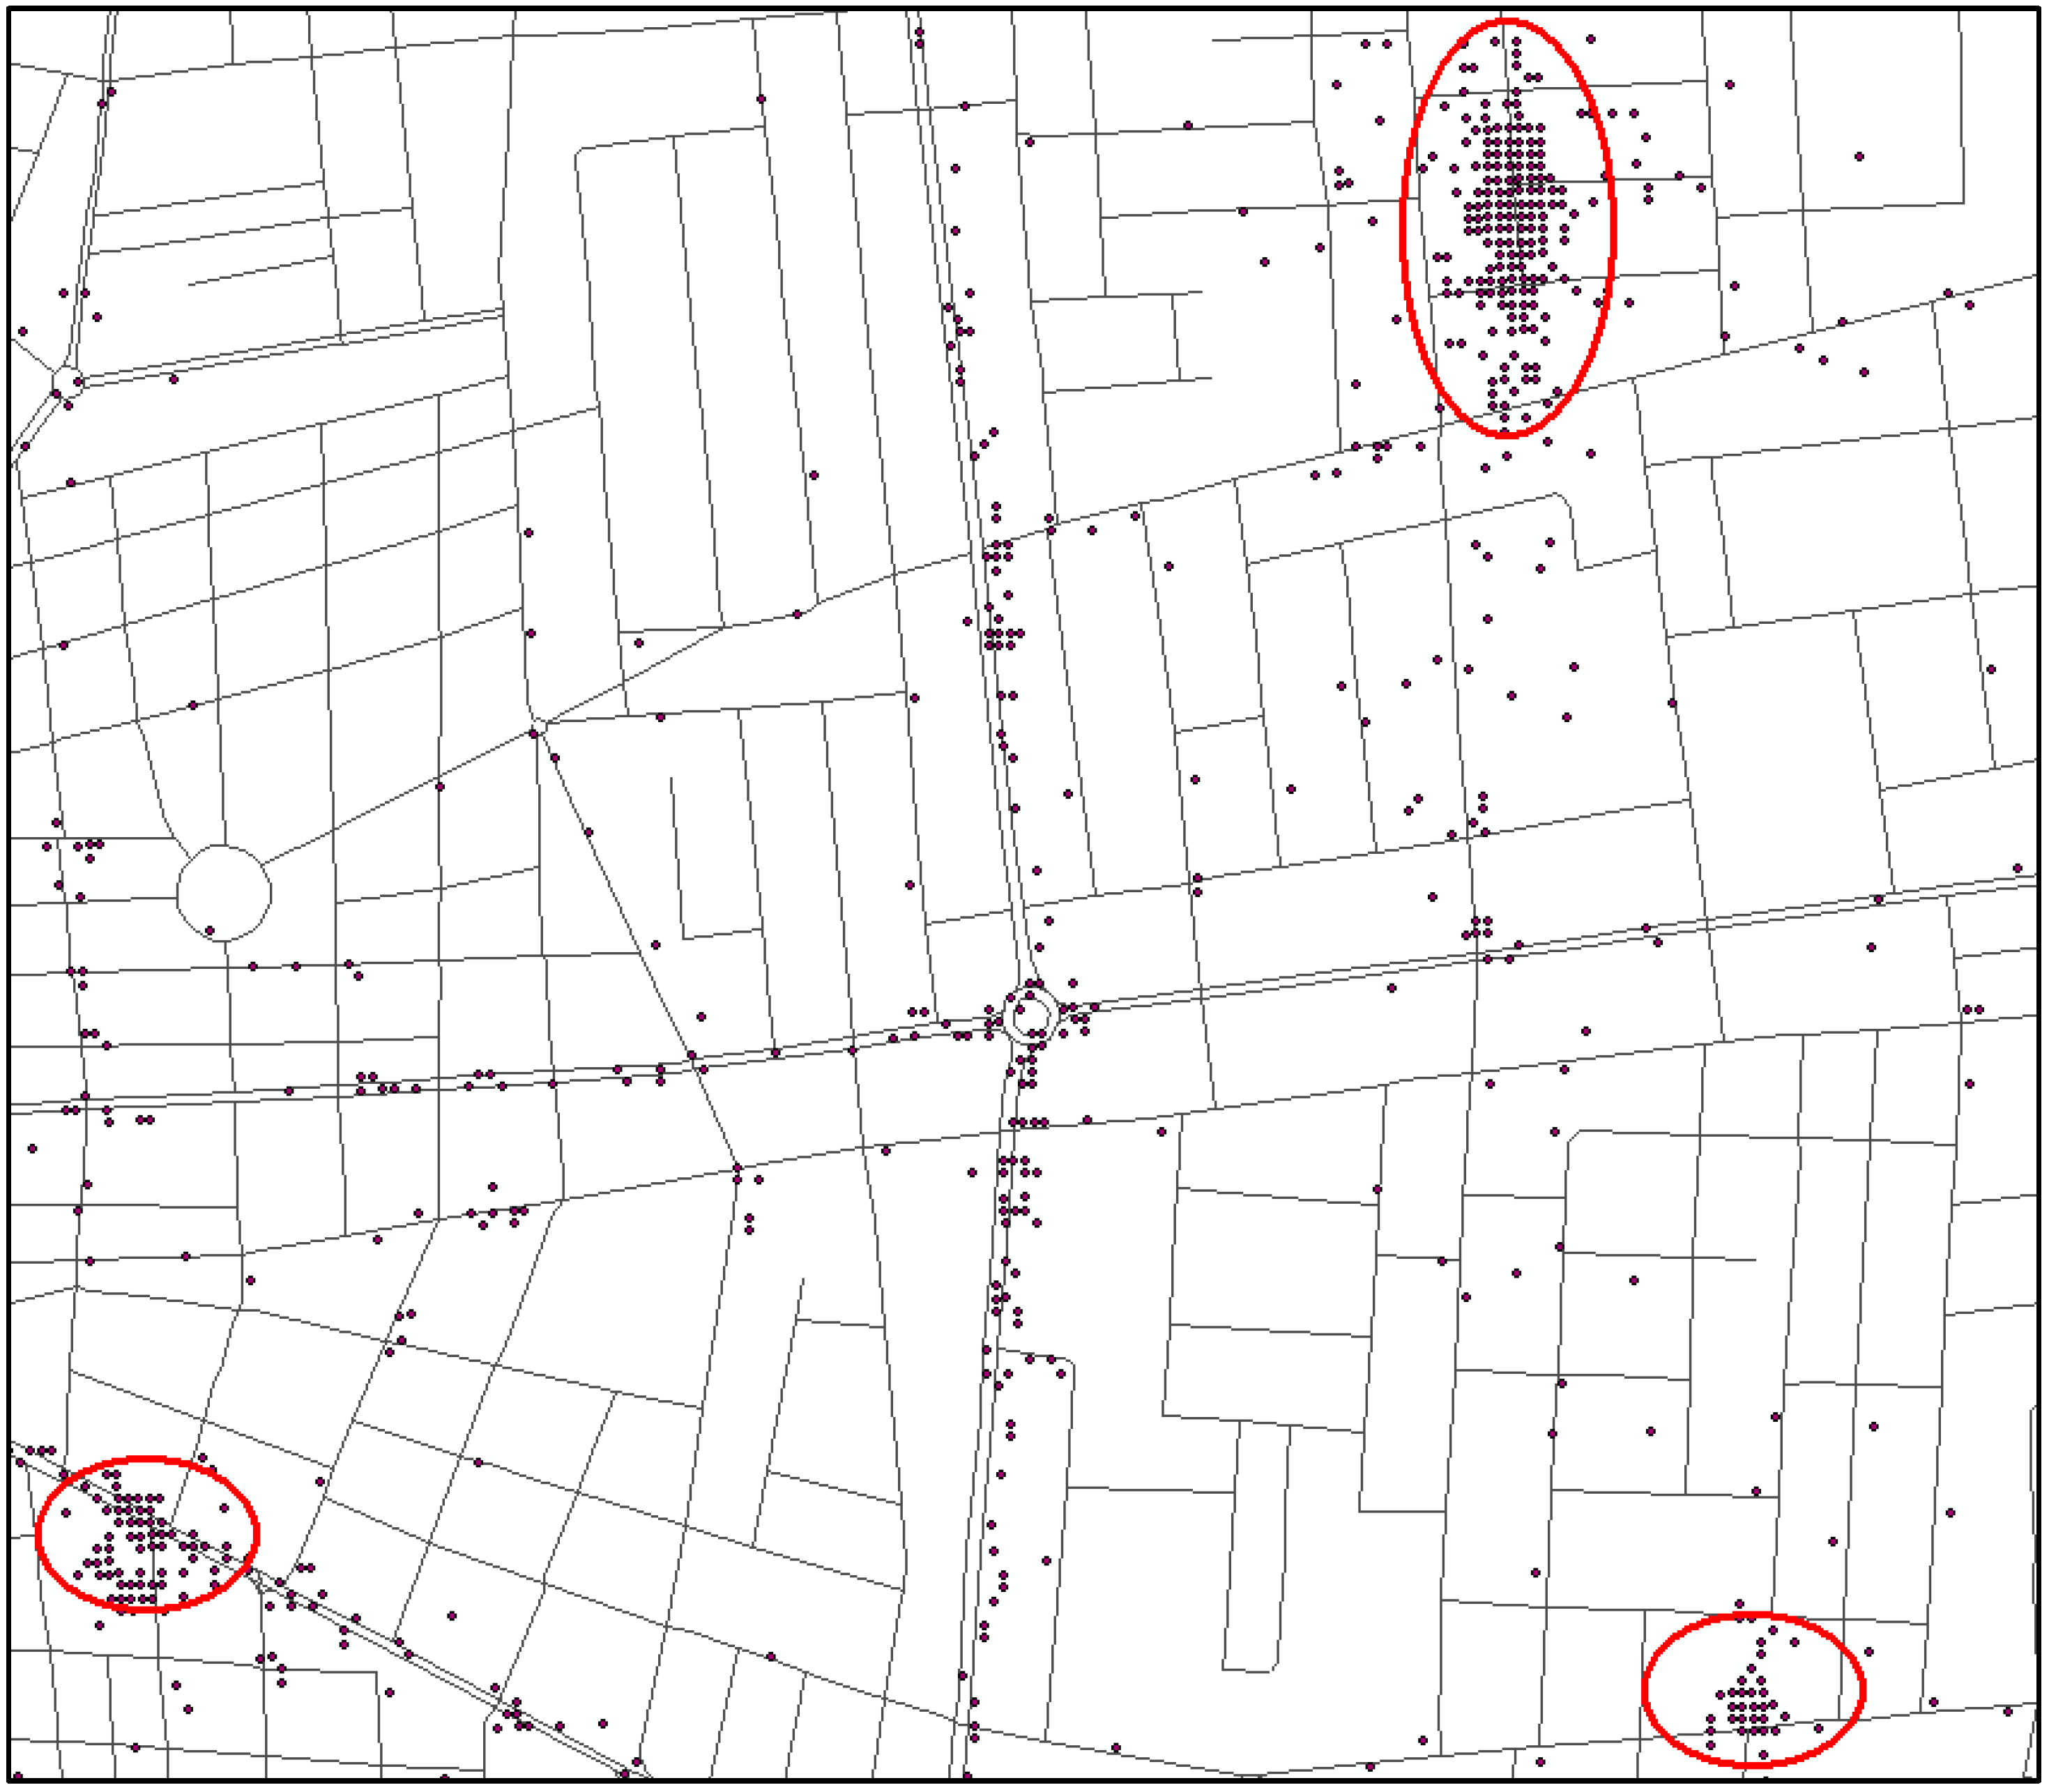
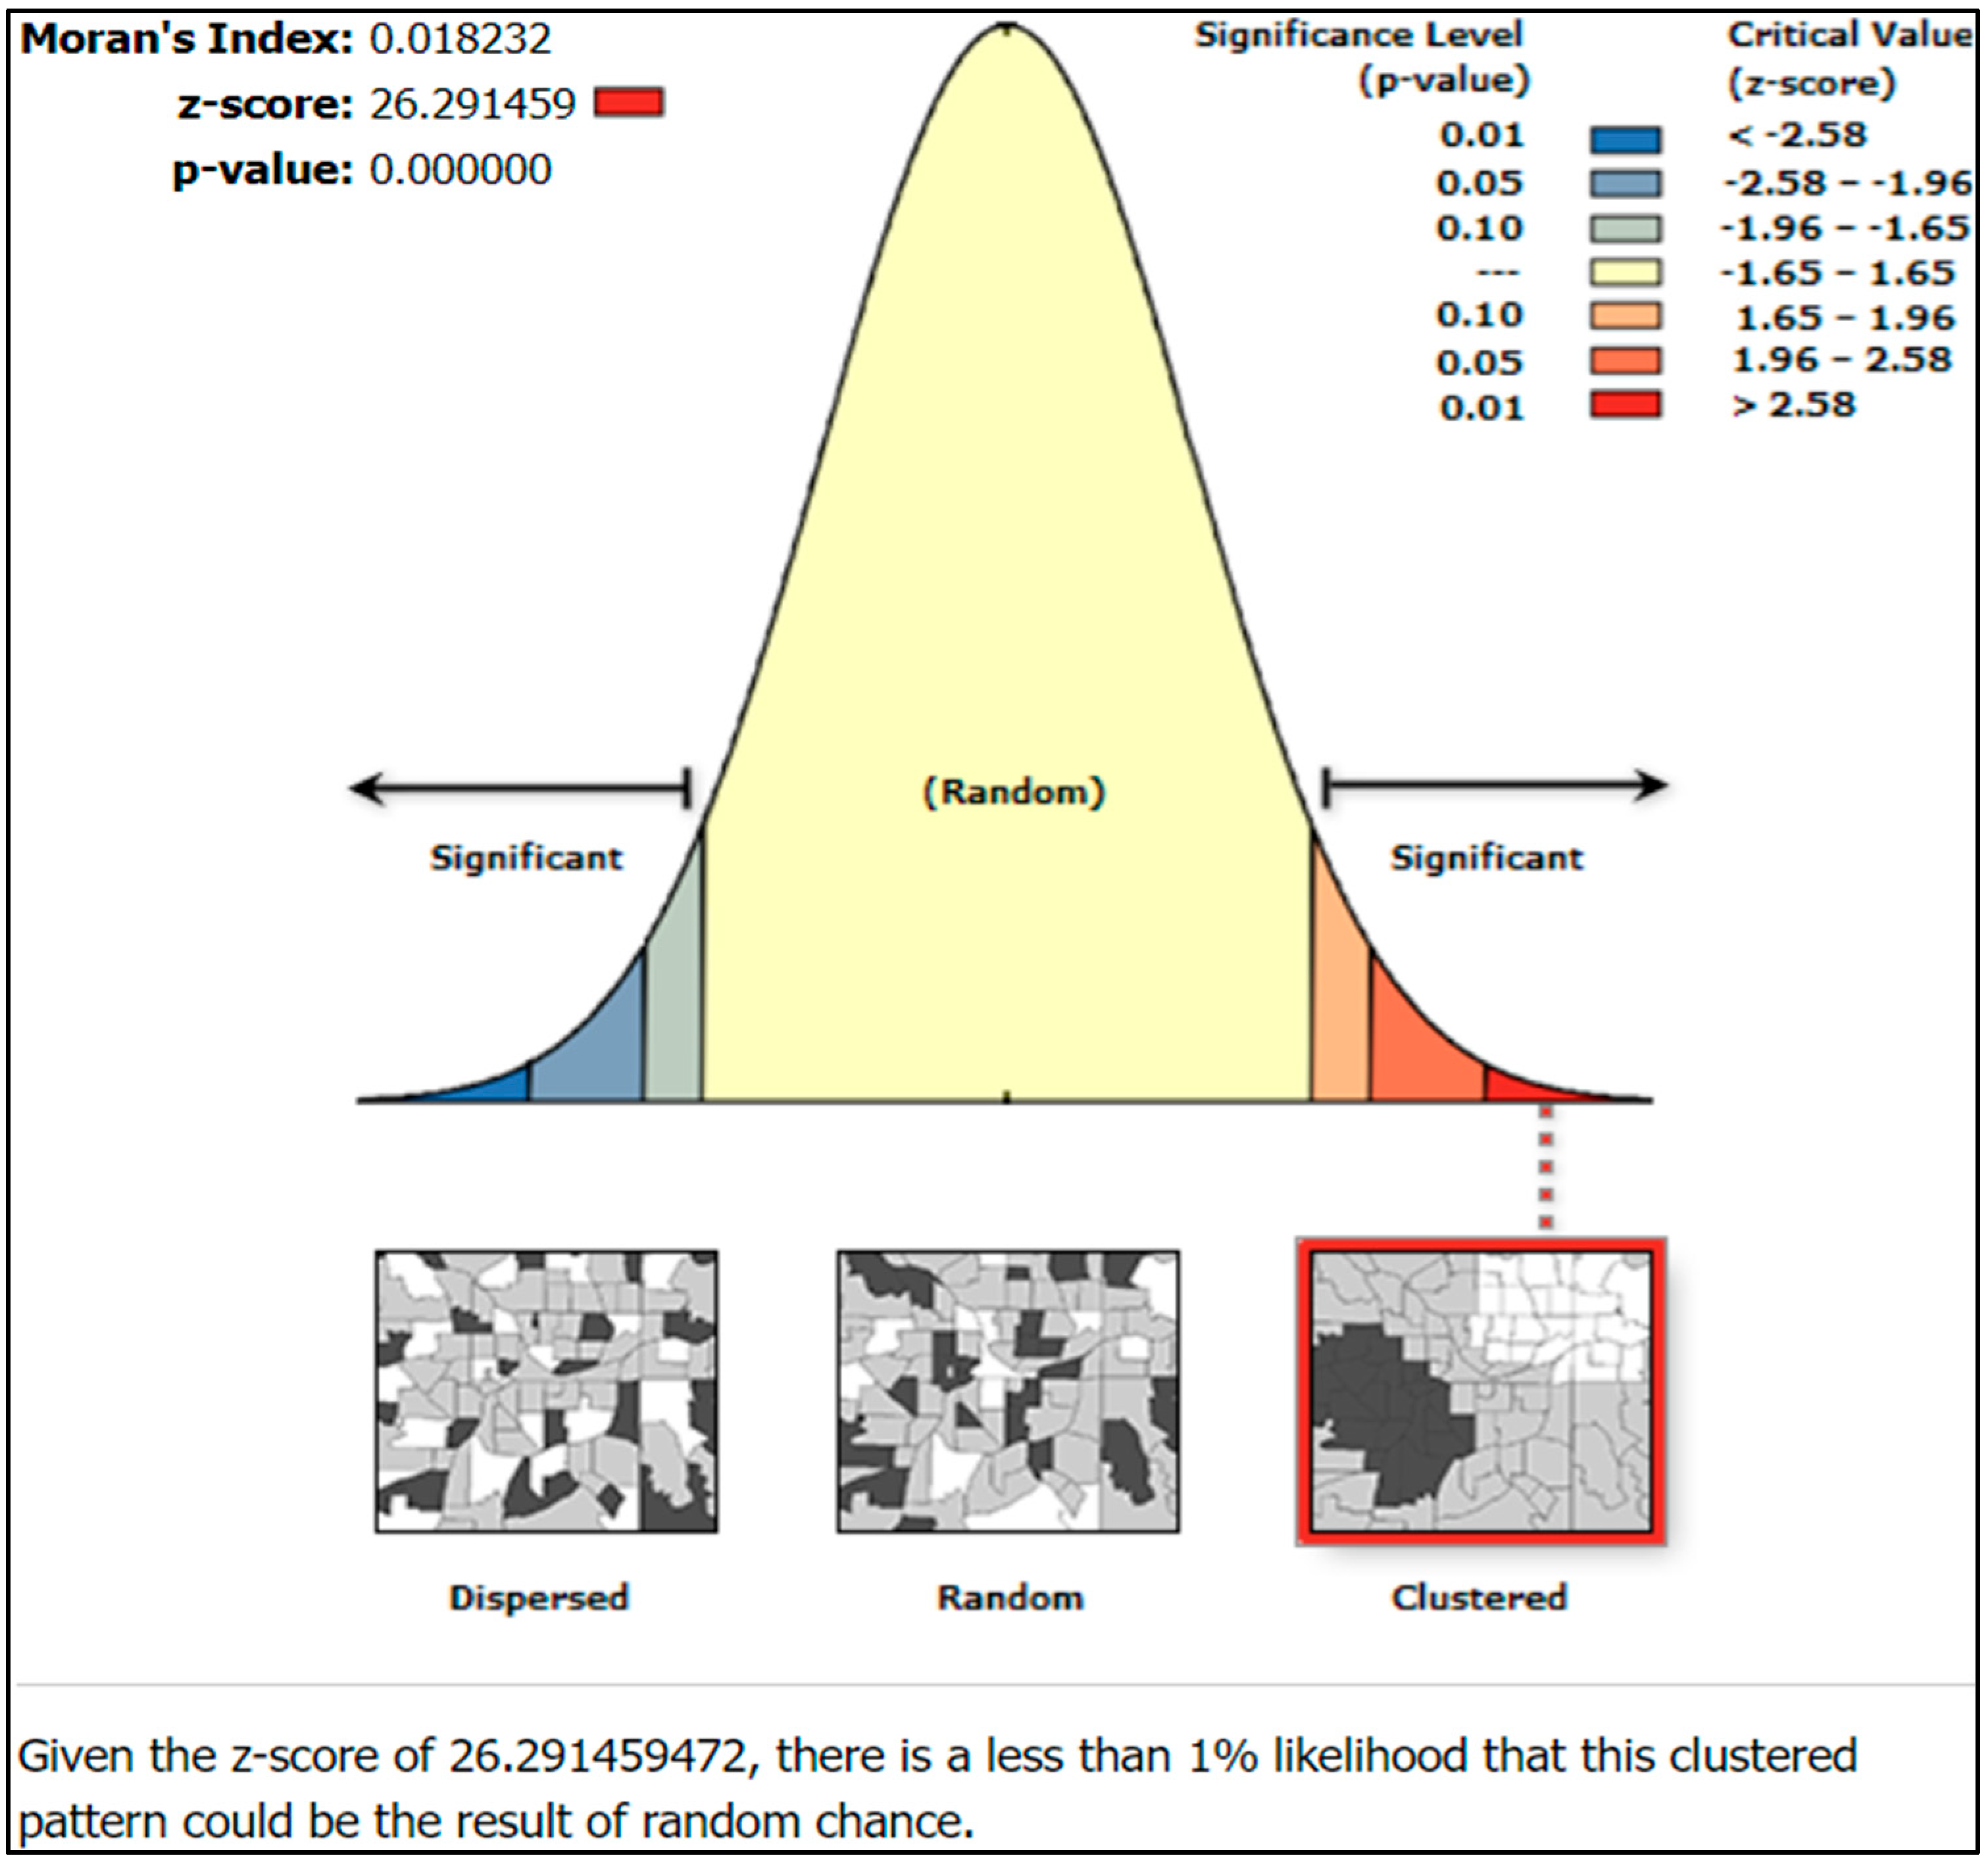
Spatial Autocorrelation (Global Moran’s I)
Getis–Ord Gi* Statistic
- Evaluating the null hypothesis of the spatial distribution of traffic accidents that hypothesize a complete spatial randomness of traffic accidents in the study area. Calculating the z-scores and p-values of the point features (i.e., traffic accidents) to determine whether to reject the null hypothesis or not.
- Aggregating the number of accidents associated with each road segment using a spatial join function that produced a new attribute field for the road network layer that indicates the sum of all accidents that happened on a particular road segment (i.e., spatial unit). This attribute field was then used as the input for calculating the hotspot function (Getis–Ord Gi*).
- Appling a cutoff fixed distance band or threshold distance for calculating the conceptualization of spatial relationships.
- Performing the hotspot analysis (i.e., Getis–Ord Gi*) and identifying the hotspot road segments at the various levels of analysis (i.e., attribute of interest) such as (i) year, (ii) month, (iii) day of the week, (iv) time of a day, and (v) severity. The statistical equation for calculating Gi* can be written as in Equations (3)–(5):
5. Results and Discussion
5.1. Analysis of Road Accident Data
5.2. Spatiotemporal Mapping of Hotspot Traffic Accidents in Irbid Governorate
5.2.1. Spatial Autocorrelation (Global Moran’s I)
5.2.2. Hotspot Analysis Using Getis–Ord Gi*
6. Conclusions
Author Contributions
Funding
Institutional Review Board Statement
Informed Consent Statement
Data Availability Statement
Acknowledgments
Conflicts of Interest
References
- Yan, M.; Chen, W.; Wang, J.; Zhang, M.; Zhao, L. Characteristics and Causes of Particularly Major Road Traffic Accidents Involving Commercial Vehicles in China. Int. J. Environ. Res. Public Health 2021, 18, 3878. [Google Scholar] [CrossRef] [PubMed]
- World Health Organization (WHO). Global Status Report on Road Safety (2015). 2016. Available online: https://www.who.int/violence_injury_prevention/road_safety_status/2015/en/ (accessed on 20 November 2018).
- WHO (World Health Organization). Global Status Report on Road Safety 2018; World Health Organization: Geneva, Switzerland, 2018. Available online: https://www.who.int/publications/i/item/9789241565684 (accessed on 19 June 2021).
- Li, M.; Xie, H.; Shu, P. Study on the Impact of Traffic Accidents in Key Areas of Rural Roads. Sustainability 2021, 13, 7802. [Google Scholar] [CrossRef]
- Tola, A.M.; Demissie, T.A.; Saathoff, F.; Gebissa, A. Severity, Spatial Pattern and Statistical Analysis of Road Traffic Crash Hot Spots in Ethiopia. Appl. Sci. 2021, 11, 8828. [Google Scholar] [CrossRef]
- Bíl, M.; Andrášik, R.; Sedoník, J. A detailed spatiotemporal analysis of traffic crash hotspots. Appl. Geogr. 2019, 107, 82–90. [Google Scholar] [CrossRef]
- Elvik, R. A survey of operational definitions of hazardous road locations in some European countries. Accid. Anal. Prev. 2008, 40, 1830–1835. [Google Scholar] [CrossRef]
- Al-Masaeid, H. Traffic accidents in Jordan. Jordan J. Civ. Eng. 2009, 3, 331–343. [Google Scholar]
- Ghadi, M.; Török, Á.; Tánczos, K. Study of the Economic Cost of Road Accidents in Jordan. Period. Polytech. Transp. Eng. 2018, 46, 129–134. [Google Scholar] [CrossRef] [Green Version]
- JPSD (Jordan Public Security Directorate). Annual Report of Traffic Accidents in Jordan. 2020. Available online: https://www.psd.gov.jo/en-us/ (accessed on 17 January 2022).
- Hoque, M.S.; Hasan, M.R. Involvement of vehicle factors in road accidents. J. Civ. Eng. 2007, 35, 17–27. [Google Scholar]
- Shah, S.A.R.; Ahmad, N. Road Infrastructure Analysis with Reference to Traffic Stream Characteristics and Accidents: An Application of Benchmarking Based Safety Analysis and Sustainable Decision-Making. Appl. Sci. 2019, 9, 2320. [Google Scholar] [CrossRef] [Green Version]
- Zhang, Y.; Lu, H.; Qu, W. Geographical Detection of Traffic Accidents Spatial Stratified Heterogeneity and Influence Factors. Int. J. Environ. Res. Public Health 2020, 17, 572. [Google Scholar] [CrossRef] [Green Version]
- Klinjun, N.; Kelly, M.; Praditsathaporn, C.; Petsirasan, R. Identification of Factors Affecting Road Traffic Injuries Incidence and Severity in Southern Thailand Based on Accident Investigation Reports. Sustainability 2021, 13, 12467. [Google Scholar] [CrossRef]
- Zou, Y.; Zhang, Y.; Cheng, K. Exploring the Impact of Climate and Extreme Weather on Fatal Traffic Accidents. Sustainability 2021, 13, 390. [Google Scholar] [CrossRef]
- Borruso, G. Network density estimation: Analysis of point patterns over a network. In International Conference on Computational Science and Its Applications; Springer: Berlin/Heidelberg, Germany, 2005; pp. 126–132. [Google Scholar]
- Xie, Z.; Yan, J. Kernel Density Estimation of traffic accidents in a network space. Comput. Environ. Urban Syst. 2008, 32, 396–406. [Google Scholar] [CrossRef] [Green Version]
- Anderson, T.K. Kernel density estimation and K-means clustering to profile road accident hotspots. Accid. Anal. Prev. 2009, 41, 359–364. [Google Scholar] [CrossRef] [PubMed]
- Harirforoush, H. Spatial and Temporal Analysis of Seasonal Traffic Accidents. Am. J. Traffic Transp. Eng. 2019, 4, 7. [Google Scholar] [CrossRef] [Green Version]
- Gatrell, A.C.; Bailey, T.C.; Diggle, P.J.; Rowlingson, B.S. Spatial Point Pattern Analysis and Its Application in Geographical Epidemiology. Trans. Inst. Br. Geogr. 1996, 21, 256. [Google Scholar] [CrossRef]
- Moons, E.; Brijs, T.; Wets, G. Improving Moran’s I to Identify Hot Spots in Traffic Safety. In Geocomputation and Urban Planing; Springer: Berlin/Heidelberg, Germany, 2009; pp. 117–132. [Google Scholar]
- Harirforoush, H.; Bellalite, L. A new integrated GIS-based analysis to detect hotspots: A case study of the city of Sherbrooke. Accid. Anal. Prev. 2019, 130, 62–74. [Google Scholar] [CrossRef]
- Ljubič, P.; Todorovski, L.; Lavrač, N.; Bullas, J.C. Time-series analysis of UK traffic accident data. In Proceedings of the Fifth International Multi-Conference Information Society, Lyon, France, 13–16 September 2002; pp. 131–134. [Google Scholar]
- El-Sadig, M.; Norman, J.N.; Lloyd, O.L.; Romilly, P.; Bener, A. Road traffic accidents in the United Arab Emirates: Trends of morbidity and mortality during 1977–1998. Accid. Anal. Prev. 2002, 34, 465–476. [Google Scholar] [CrossRef]
- Lavrač, N.; Jesenovec, D.; Trdin, N.; Kosta, N.M. Mining spatio-temporal data of traffic accidents and spatial pattern visualization. Adv. Methodol. Stat. 2008, 5, 45–63. [Google Scholar] [CrossRef]
- Prasannakumar, V.; Vijith, H.; Charutha, R.; Geetha, N. Spatio-temporal clustering of road accidents: GIS based analysis and assessment. Procedia. Soc. Behav. Sci. 2011, 21, 317–325. [Google Scholar] [CrossRef] [Green Version]
- Plug, C.; Xia, J.; Caulfield, C. Spatial and temporal visualisation techniques for crash analysis. Accid. Anal. Prev. 2011, 43, 1937–1946. [Google Scholar] [CrossRef] [PubMed]
- Kingham, S.; Sabel, C.E.; Bartie, P. The impact of the ‘school run’on road traffic accidents: A spatio-temporal analysis. J. Transp. Geogr. 2011, 19, 705–711. [Google Scholar] [CrossRef]
- Liu, C.; Sharma, A. Exploring spatio-temporal effects in traffic crash trend analysis. Anal. Methods Accid. Res. 2017, 16, 104–116. [Google Scholar] [CrossRef] [Green Version]
- Kaygisiz, Ö.; Düzgün, Ş.; Yıldız, A.; Senbil, M. Spatio-temporal accident analysis for accident prevention in relation to behavioral factors in driving: The case of South Anatolian Motorway. Transp. Res. Part F Traffic Psychol. Behav. 2015, 33, 128–140. [Google Scholar] [CrossRef]
- Olsen, J.R.; Mitchell, R.; Ogilvie, D.; on behalf of the M74 Study Team. Effect of a New Motorway on Social-Spatial patterning of road traffic accidents: A retrospective longitudinal natural experimental study. PLoS ONE 2017, 12, e0184047. [Google Scholar] [CrossRef] [Green Version]
- Wang, C.; Quddus, M.A.; Ison, S.G. A spatio-temporal analysis of the impact of congestion on traffic safety on major roads in the UK. Transp. A Transp. Sci. 2013, 9, 124–148. [Google Scholar] [CrossRef] [Green Version]
- Obaidat, M.T.; Ramadan, T.M. Traffic accidents at hazardous locations of urban roads. Jordan J. Civ. Eng. 2012, 6, 436–447. [Google Scholar]
- Al-Omari, B.; Ghuzlan, K.; Hasan, H. Traffic accidents trends and characteristics in Jordan. Int. J. Civ. Environ. Eng. 2013, 13, 9–16. [Google Scholar]
- Al-Rousan, T.M.; Umar, A.A.; Al-Omari, A.A. Characteristics of crashes caused by distracted driving on rural and suburban roadways in Jordan. Infrastructures 2021, 6, 107. [Google Scholar] [CrossRef]
- Al-Omari, B.H.; Obaidat, E.S. Analysis of Pedestrian Accidents in Irbid City, Jordan. Open Transp. J. 2013, 7, 1–6. [Google Scholar] [CrossRef] [Green Version]
- Al-Omari, A.; Shatnawi, N.; Khedaywi, T.; Miqdady, T. Prediction of traffic accidents hot spots using fuzzy logic and GIS. Appl. Geomatics 2019, 12, 149–161. [Google Scholar] [CrossRef]
- Alkhadour, W.; Zraqou, J.; Al-Helali, A.; Al-Ghananeem, S. Traffic Accidents Detection using Geographic Information Systems (GIS). Int. J. Adv. Comput. Sci. Appl. 2021, 12, 484–494. [Google Scholar] [CrossRef]
- Songchitruksa, P.; Zeng, X. Getis–Ord Spatial Statistics to Identify Hot Spots by Using Incident Management Data. Transp. Res. Rec. J. Transp. Res. Board 2010, 2165, 42–51. [Google Scholar] [CrossRef]
- ESRI. ESRI Online Help for Spatial Statistics and Analysis. Available online: https://desktop.arcgis.com/en/arcmap/10.3/tools/editing-toolbox/snap.htm (accessed on 28 January 2022).
- Ord, J.K.; Getis, A. Local Spatial Autocorrelation Statistics: Distributional Issues and an Application. Geogr. Anal. 1995, 27, 286–306. [Google Scholar] [CrossRef]
- Getis, A.; Aldstadt, J. Constructing the spatial weights matrix using a local statistic. Geog Anal. 2004, 36, 90–104. [Google Scholar] [CrossRef]


| Category | Technique | Description |
|---|---|---|
| Preliminary global statistical tests | Tests for clustering (e.g., nearest neighbor index, Moran’s I, and Geary’s C statistic) | Relative measure to compare spatial distributions between different types of spatial events or against the same type for different periods of time. generate an understanding of the global patterns in the data and show evidence of clustering existence. This clustering does, however, vary at different scales. |
| Mapping techniques | Continuous surface smoothing methods (e.g., kernel density) | The quartic kernel estimation method requires identifying the grid cell size and search radius prior to running which remains a problem. |
| Local indicators of spatial association (LISA) statistics | Getis–Ord Gi* statistic | LISA statistics are a more advanced method to understand hotspot of traffic accidents. They assesse the local association between data by comparing local averages to global averages. LISA output indicates the level at which hotspot can be more clearly distinguished from other levels of concentration. |
| Year | Total Num. of Accidents (Reported) | Num. of Accidents Used in the Spatiotemporal Analysis (after Filtering) | % |
|---|---|---|---|
| 2015 | 12,293 | 5475 | 44.5 |
| 2016 | 14,759 | 10,068 | 68.2 |
| 2017 | 15,701 | 11,458 | 73.0 |
| 2018 | 16,470 | 10,149 | 61.6 |
| 2019 | 16,940 | 12,901 | 76.2 |
| Total | 76,163 | 50,051 | 65.7 |
| Distance (m) * | Moran’s Index | Expected Index | Variance | z-Score | p-Value |
|---|---|---|---|---|---|
| 65.00 | 0.041913 | −0.000021 | 0.000006 | 17.628812 | 0.0000 |
| 75.00 | 0.038452 | −0.000021 | 0.000005 | 17.202281 | 0.0000 |
| 85.00 | 0.036705 | −0.000021 | 0.000004 | 17.329749 | 0.0000 |
| 95.00 | 0.036883 | −0.000021 | 0.000004 | 18.283657 | 0.0000 |
| 105.00 | 0.035879 | −0.000021 | 0.000004 | 18.697440 | 0.0000 |
| 115.00 | 0.034091 | −0.000021 | 0.000003 | 18.488937 | 0.0000 |
| 125.00 | 0.032416 | −0.000020 | 0.000003 | 18.289320 | 0.0000 |
| 135.00 | 0.030373 | −0.000020 | 0.000003 | 17.801679 | 0.0000 |
| 145.00 | 0.029340 | −0.000020 | 0.000003 | 17.777098 | 0.0000 |
| 155.00 | 0.028194 | −0.000020 | 0.000003 | 17.667624 | 0.0000 |
| Category | Total Number of Traffic Accidents | Length at 99% Confidence Level (GiBin = 3) (km) | |
|---|---|---|---|
| Year | 2015 | 12,293 | 183.2 |
| 2016 | 14,759 | 152.7 | |
| 2017 | 15,701 | 145.8 | |
| 2018 | 16,470 | 129.7 | |
| 2019 | 16,940 | 129.1 | |
| Month | Jan | 5616 | 117.1 |
| Feb | 5405 | 113.5 | |
| Mar | 6150 | 128.3 | |
| Apr | 6411 | 127.7 | |
| May | 6555 | 146.3 | |
| Jun | 6745 | 154.6 | |
| Jul | 7397 | 145.3 | |
| Aug | 6835 | 157.2 | |
| Sep | 6018 | 133.8 | |
| Oct | 6250 | 149.4 | |
| Nov | 6383 | 137.3 | |
| Dec | 6398 | 126.7 | |
| Day of the Week | Sunday | 10,616 | 131.1 |
| Monday | 11,757 | 153.1 | |
| Tuesday | 10,585 | 141.4 | |
| Wednesday | 11,021 | 154.5 | |
| Thursday | 10,818 | 148.2 | |
| Friday | 13,118 | 149.5 | |
| Saturday | 8248 | 139.8 | |
| Period of the day (Hours) | 24–6 | 5008 | 133.5 |
| 6–12 | 14,297 | 162.5 | |
| 12–18 | 22,464 | 154.6 | |
| 18–24 | 34,394 | 142.5 | |
| Severity | No Injuries | 12,709 | 150.8 |
| Slight Injuries | 3495 | 134.5 | |
| Medium Injuries | 960 | 80.1 | |
| Sever Injuries | 496 | 105.7 | |
| Fatal | 457 | 80.8 | |
Publisher’s Note: MDPI stays neutral with regard to jurisdictional claims in published maps and institutional affiliations. |
© 2022 by the authors. Licensee MDPI, Basel, Switzerland. This article is an open access article distributed under the terms and conditions of the Creative Commons Attribution (CC BY) license (https://creativecommons.org/licenses/by/4.0/).
Share and Cite
Hazaymeh, K.; Almagbile, A.; Alomari, A.H. Spatiotemporal Analysis of Traffic Accidents Hotspots Based on Geospatial Techniques. ISPRS Int. J. Geo-Inf. 2022, 11, 260. https://doi.org/10.3390/ijgi11040260
Hazaymeh K, Almagbile A, Alomari AH. Spatiotemporal Analysis of Traffic Accidents Hotspots Based on Geospatial Techniques. ISPRS International Journal of Geo-Information. 2022; 11(4):260. https://doi.org/10.3390/ijgi11040260
Chicago/Turabian StyleHazaymeh, Khaled, Ali Almagbile, and Ahmad H. Alomari. 2022. "Spatiotemporal Analysis of Traffic Accidents Hotspots Based on Geospatial Techniques" ISPRS International Journal of Geo-Information 11, no. 4: 260. https://doi.org/10.3390/ijgi11040260