
Extraction of Urban Built-Up Areas Based on Data Fusion: A Case Study of Zhengzhou, China
Abstract
:1. Introduction
2. Materials and Methods
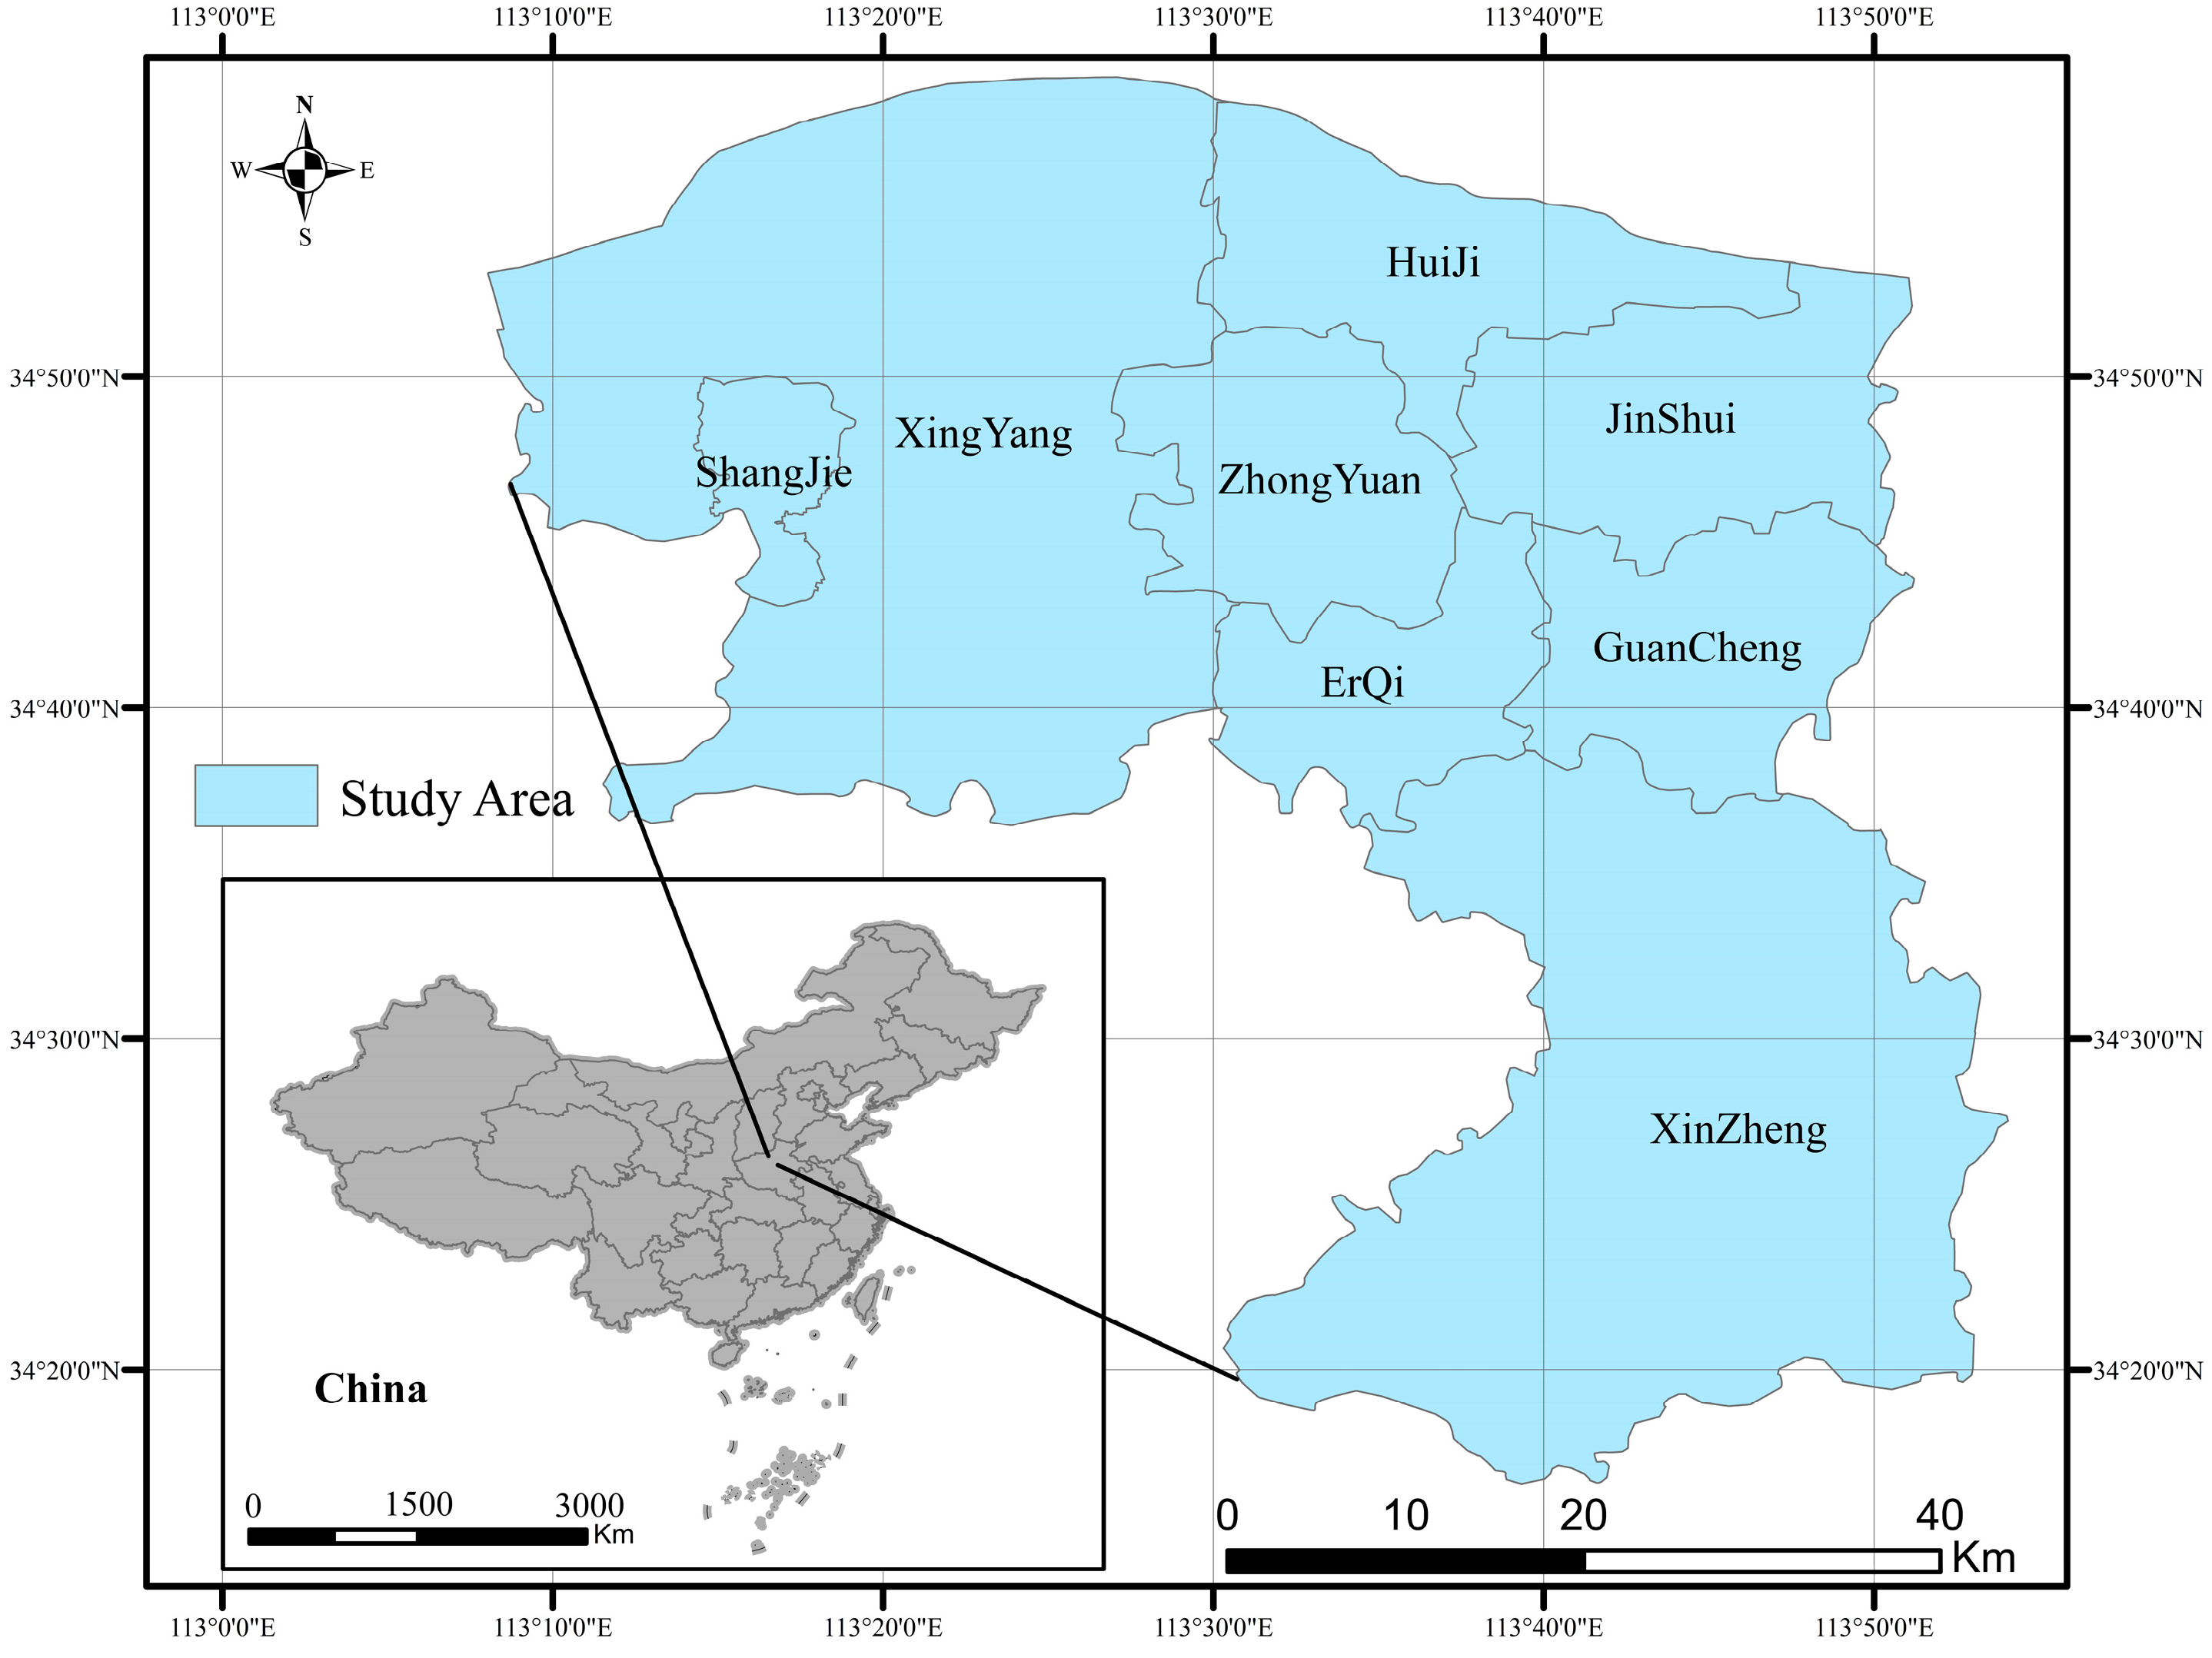
2.1. Study Area
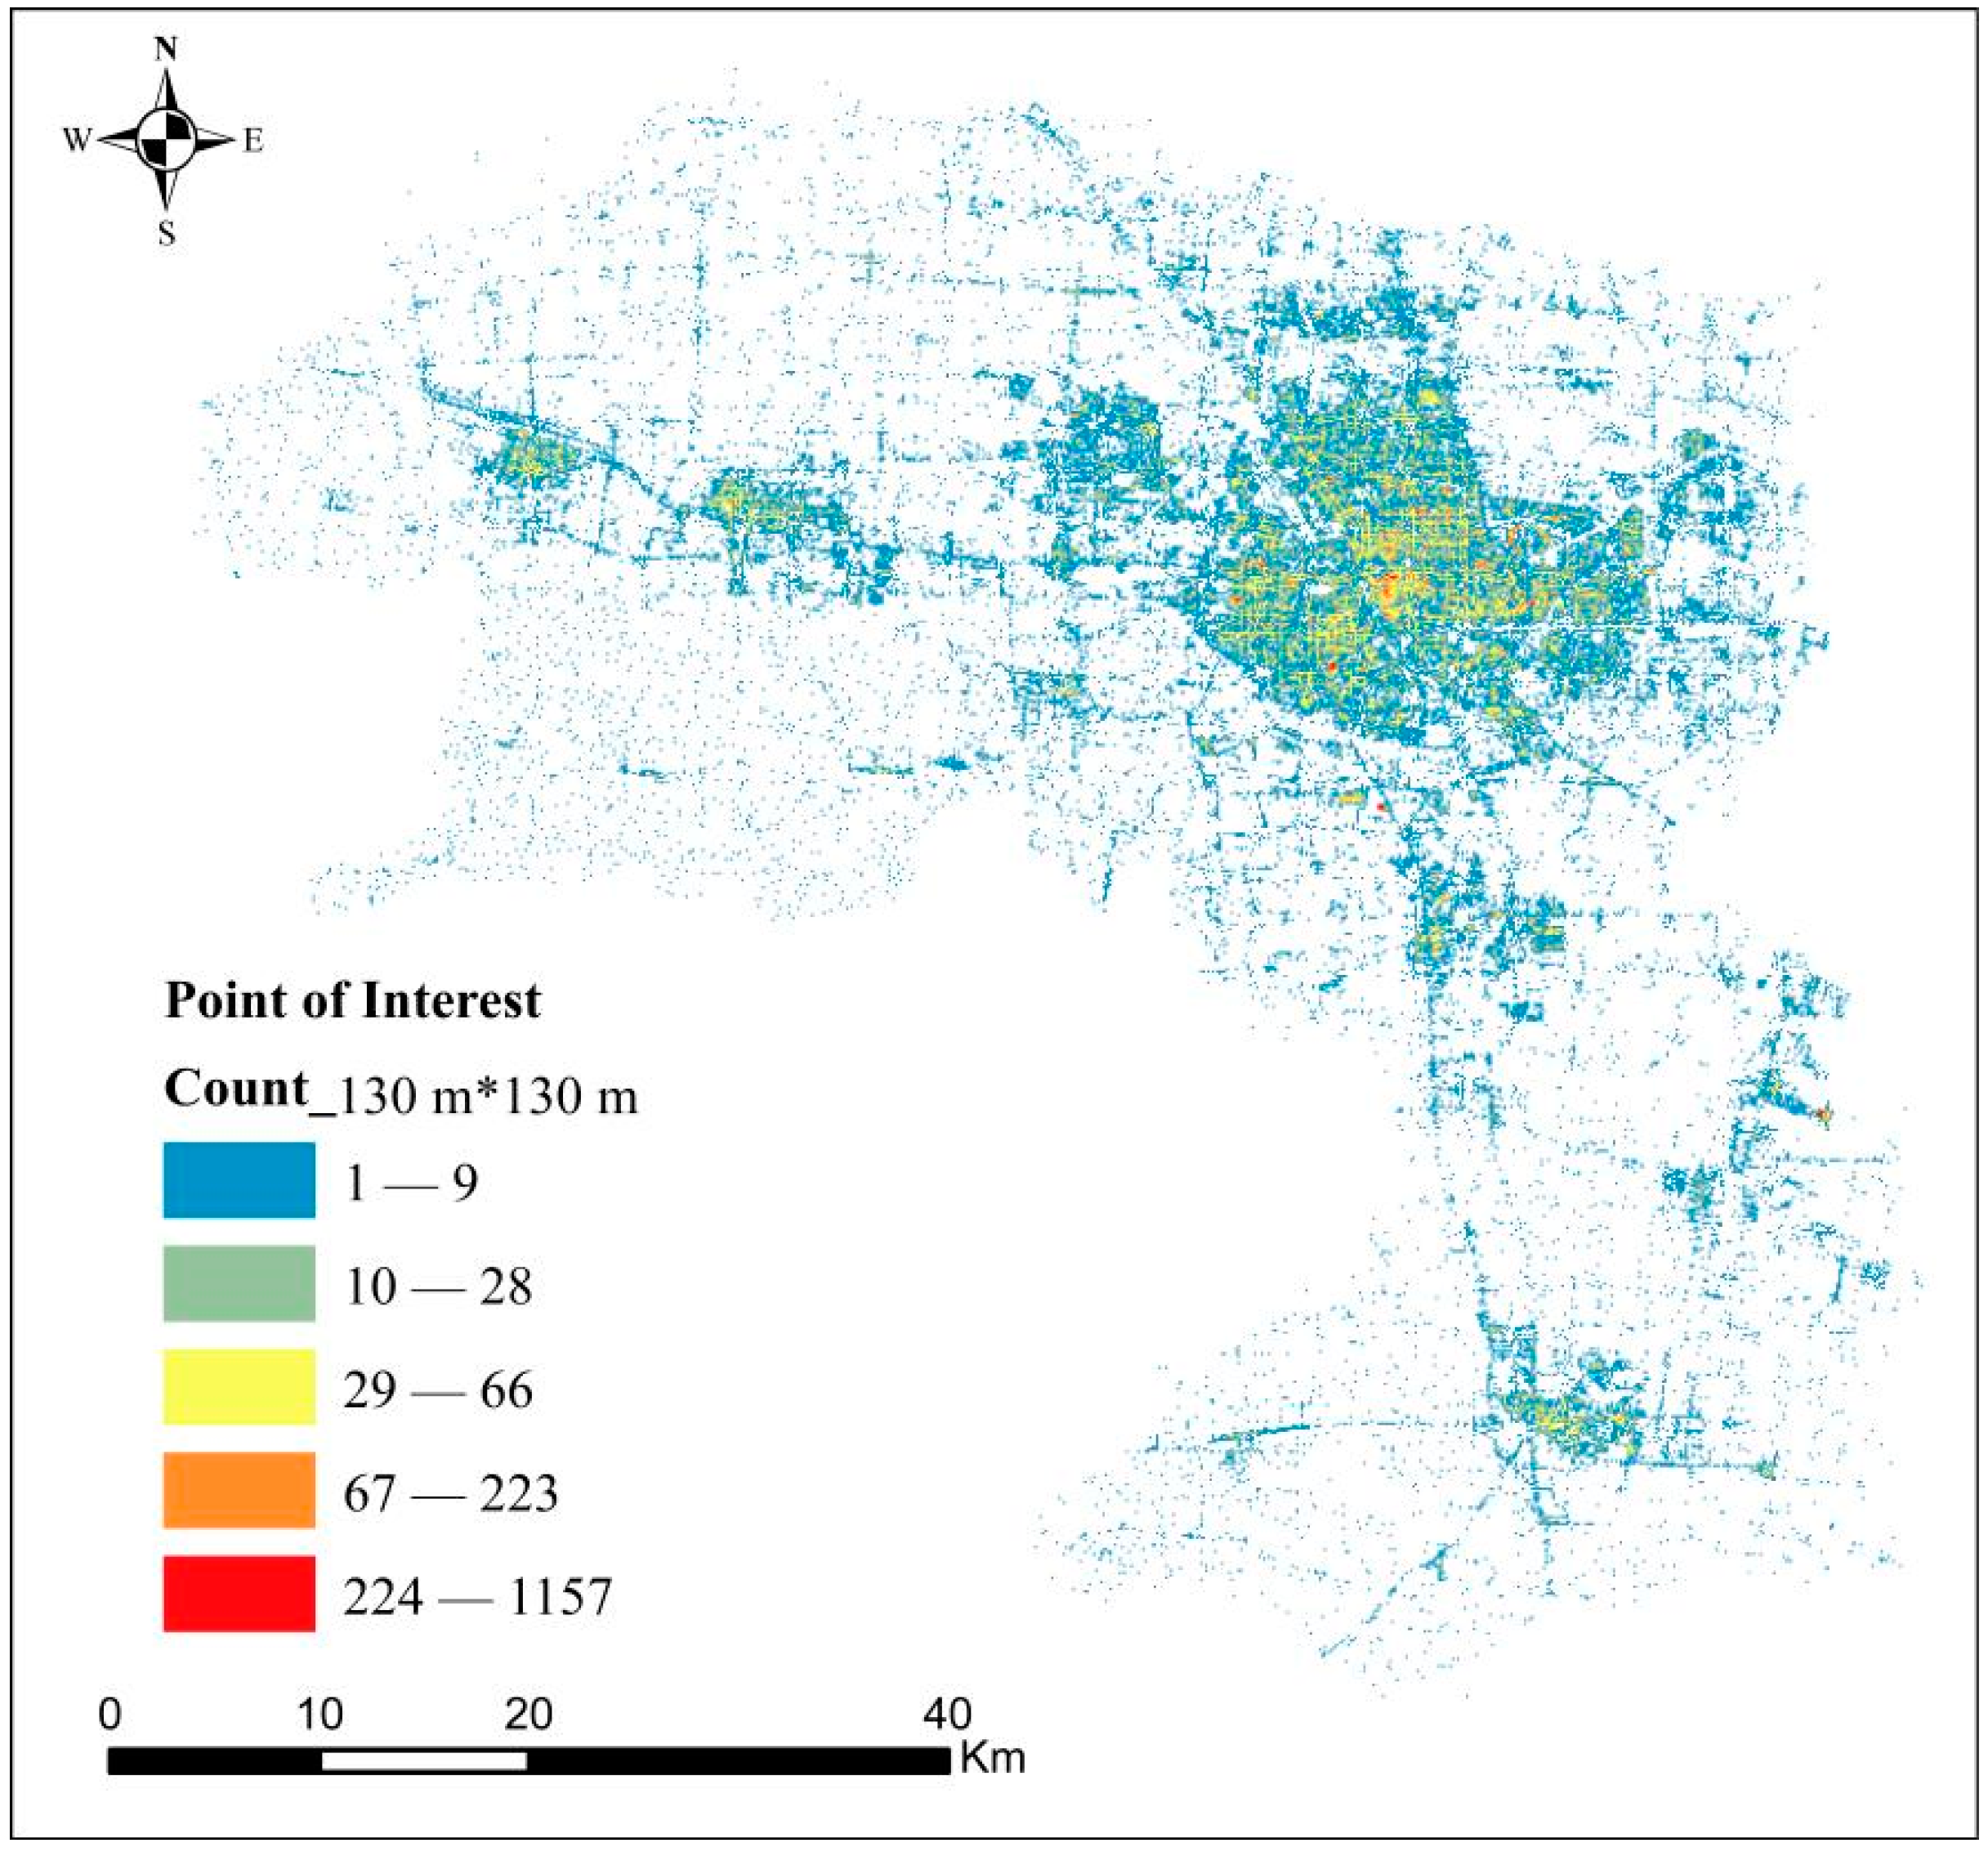
2.2. Study Data
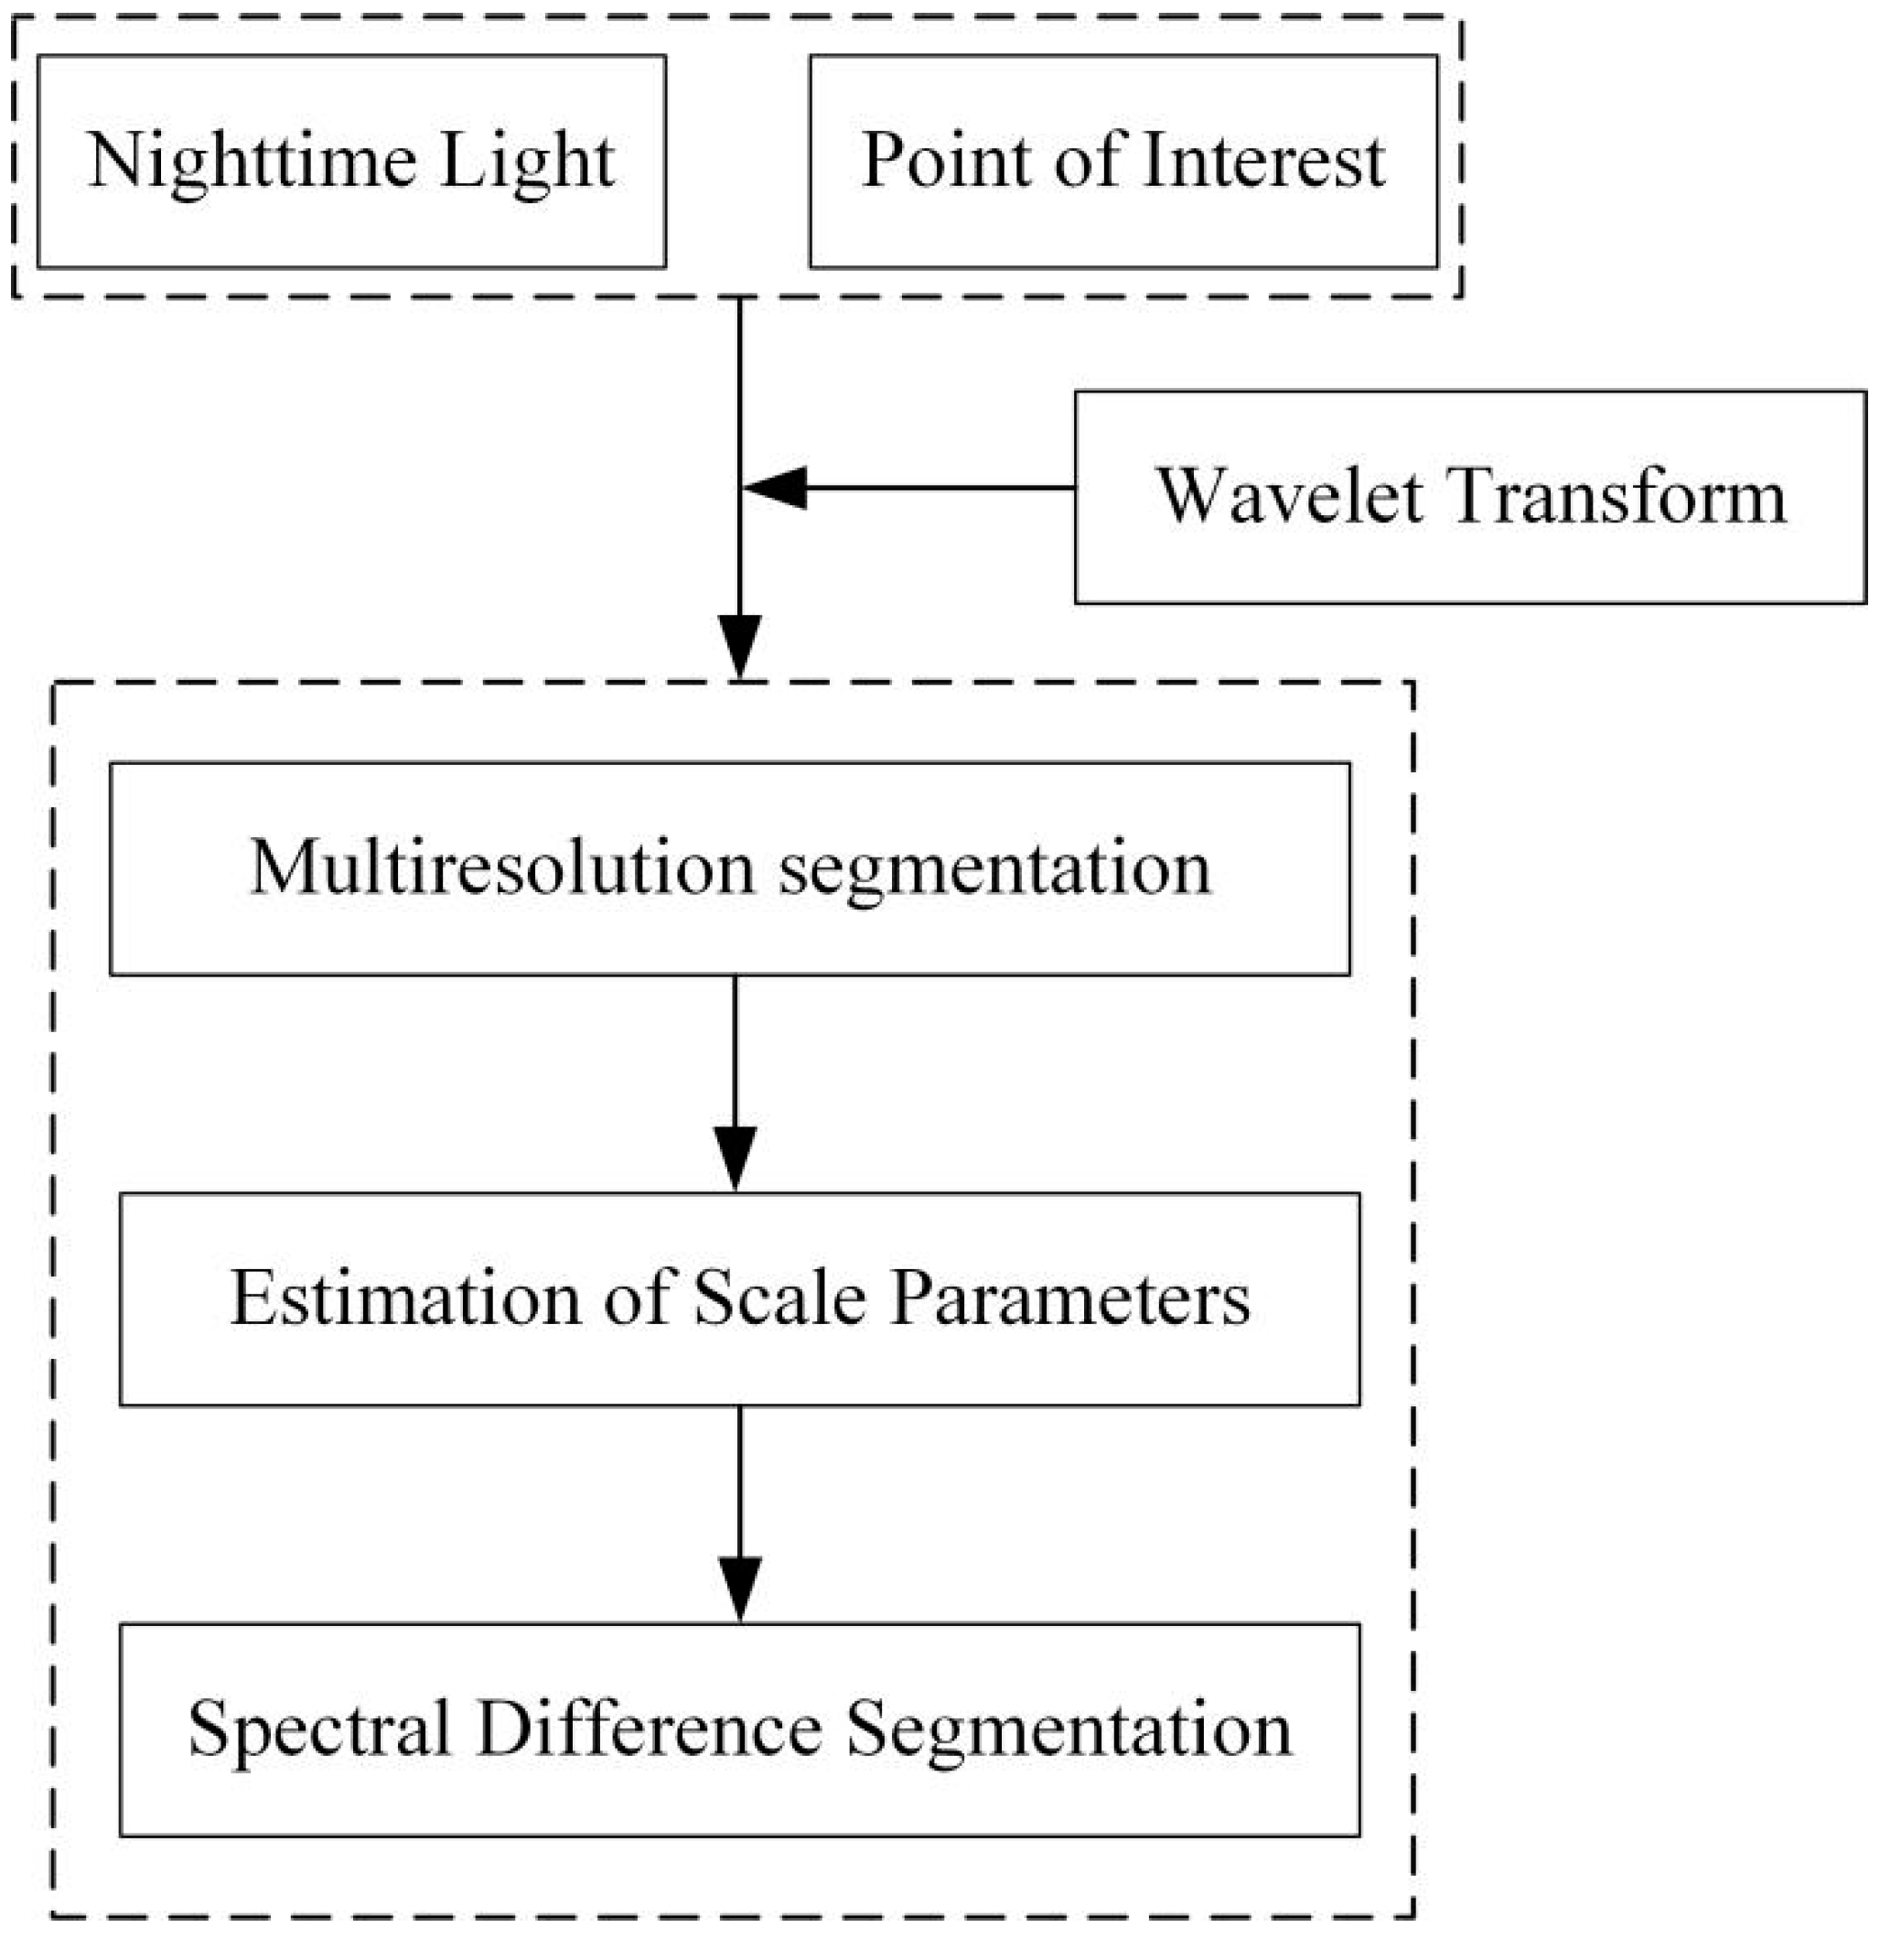
2.3. Methods
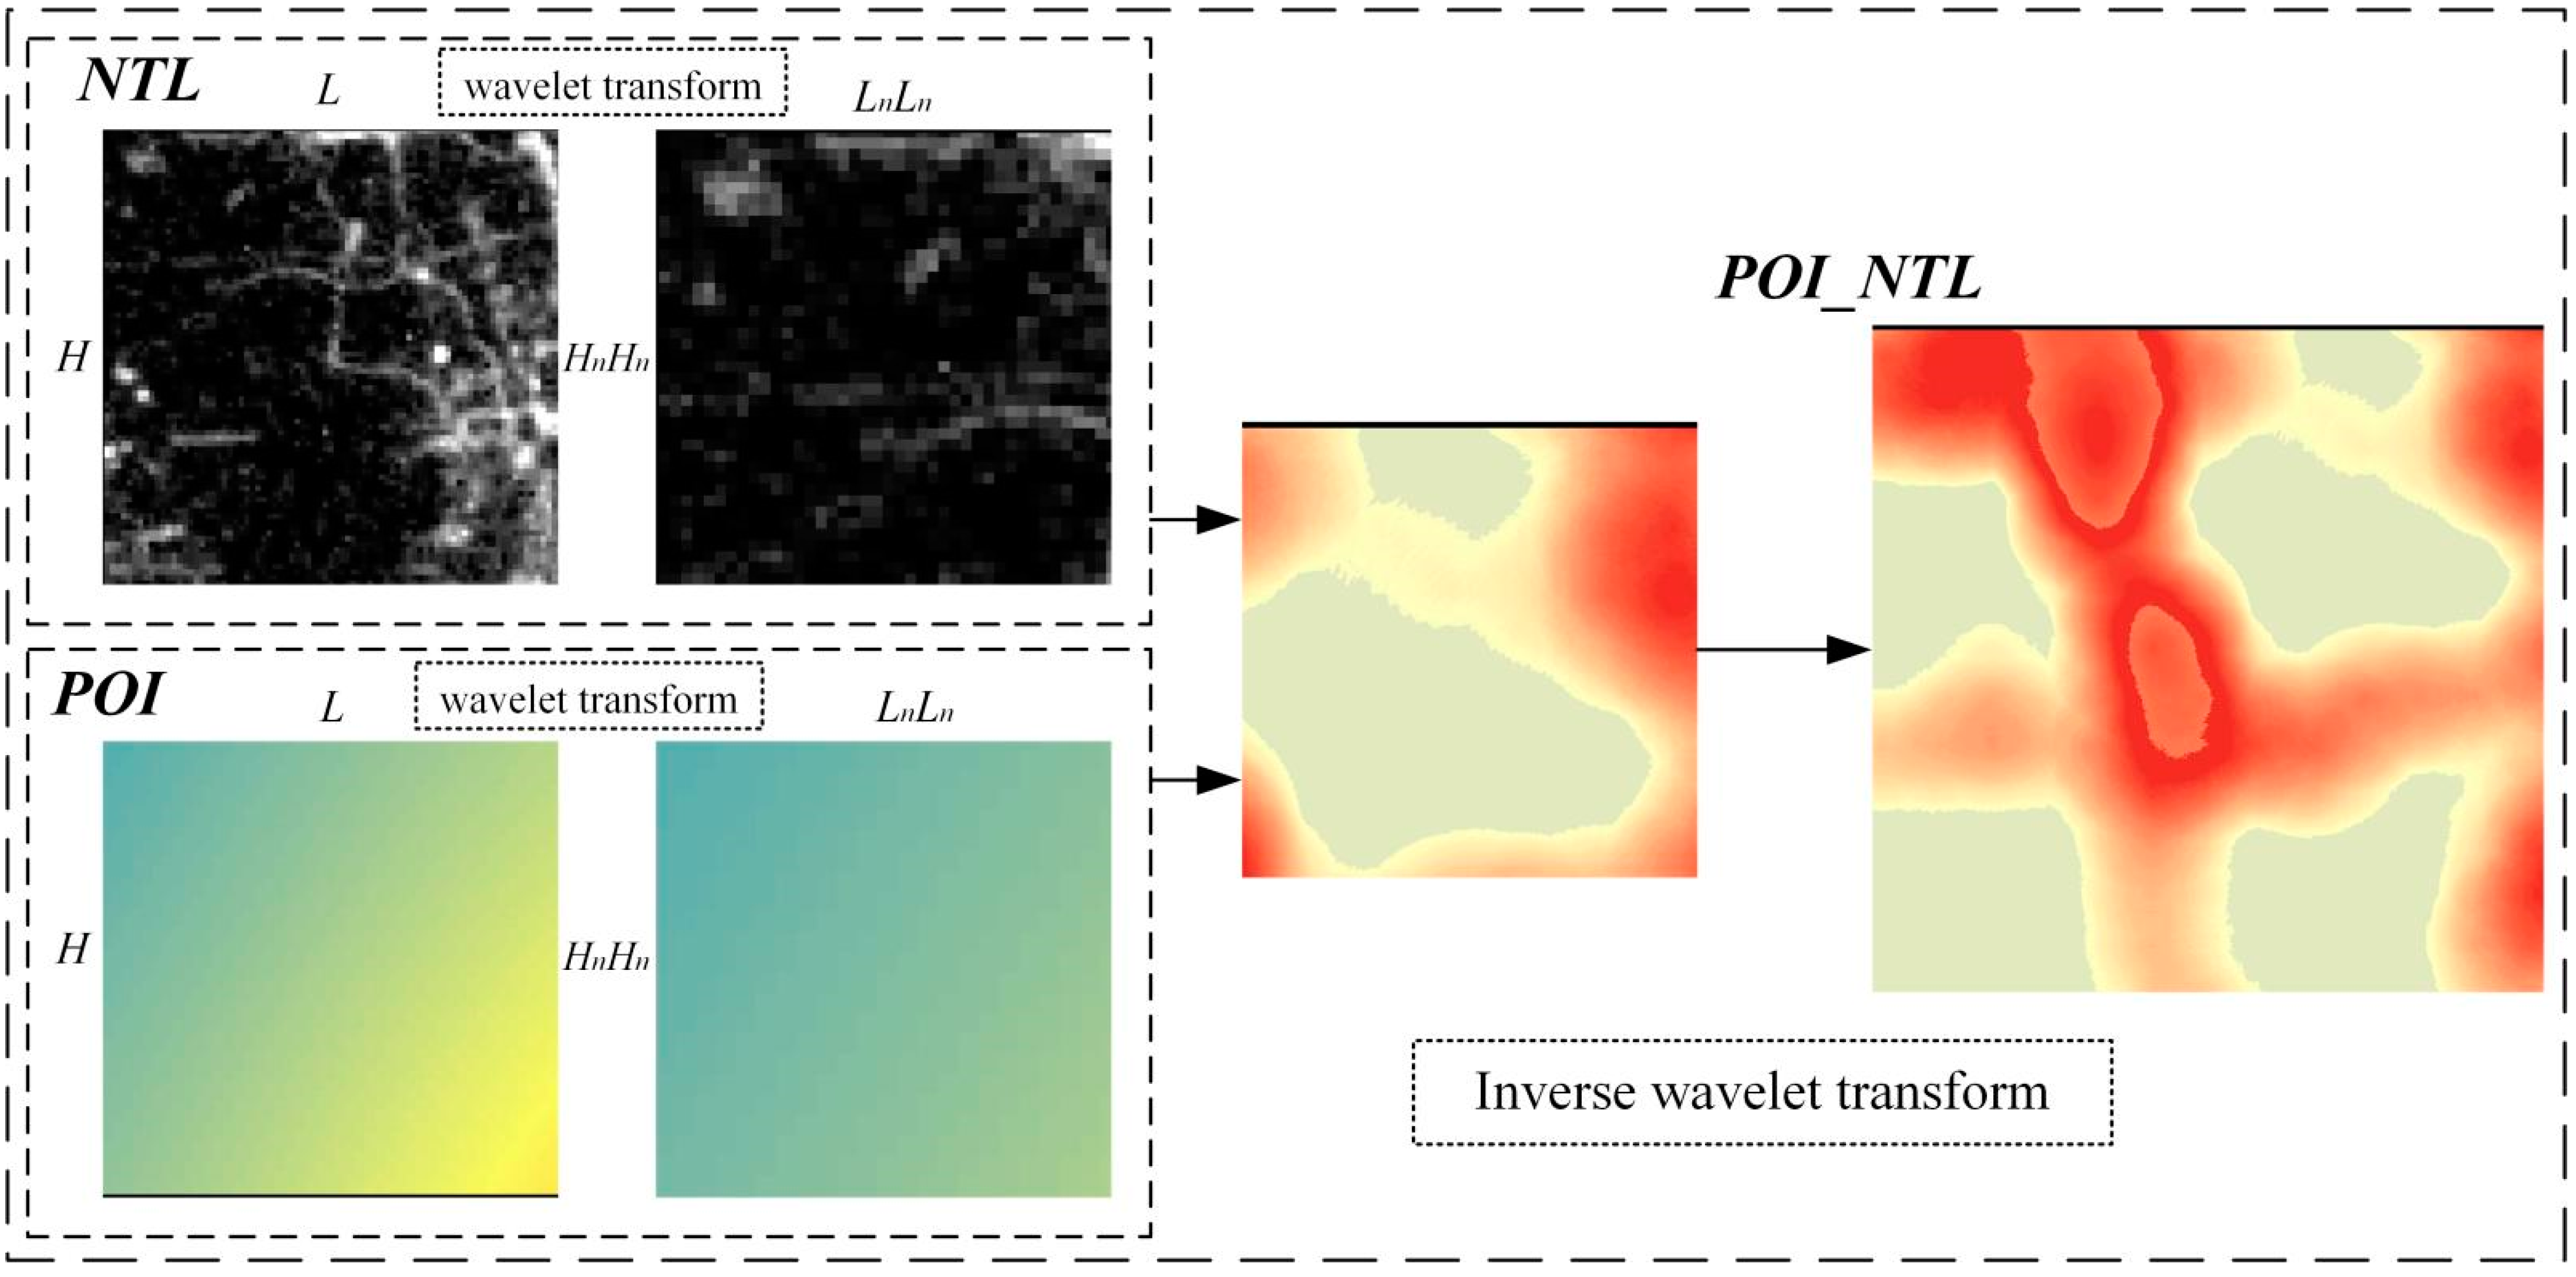
2.3.1. Wavelet Transform (WT)
2.3.2. Multiresolution Segmentation
2.3.3. Estimation of Scale Parameters (ESP)
2.3.4. Spectral Difference Segmentation (SDS)
3. Results
3.1. Urban Built-Up Area of Zhengzhou Extracted by Different Data
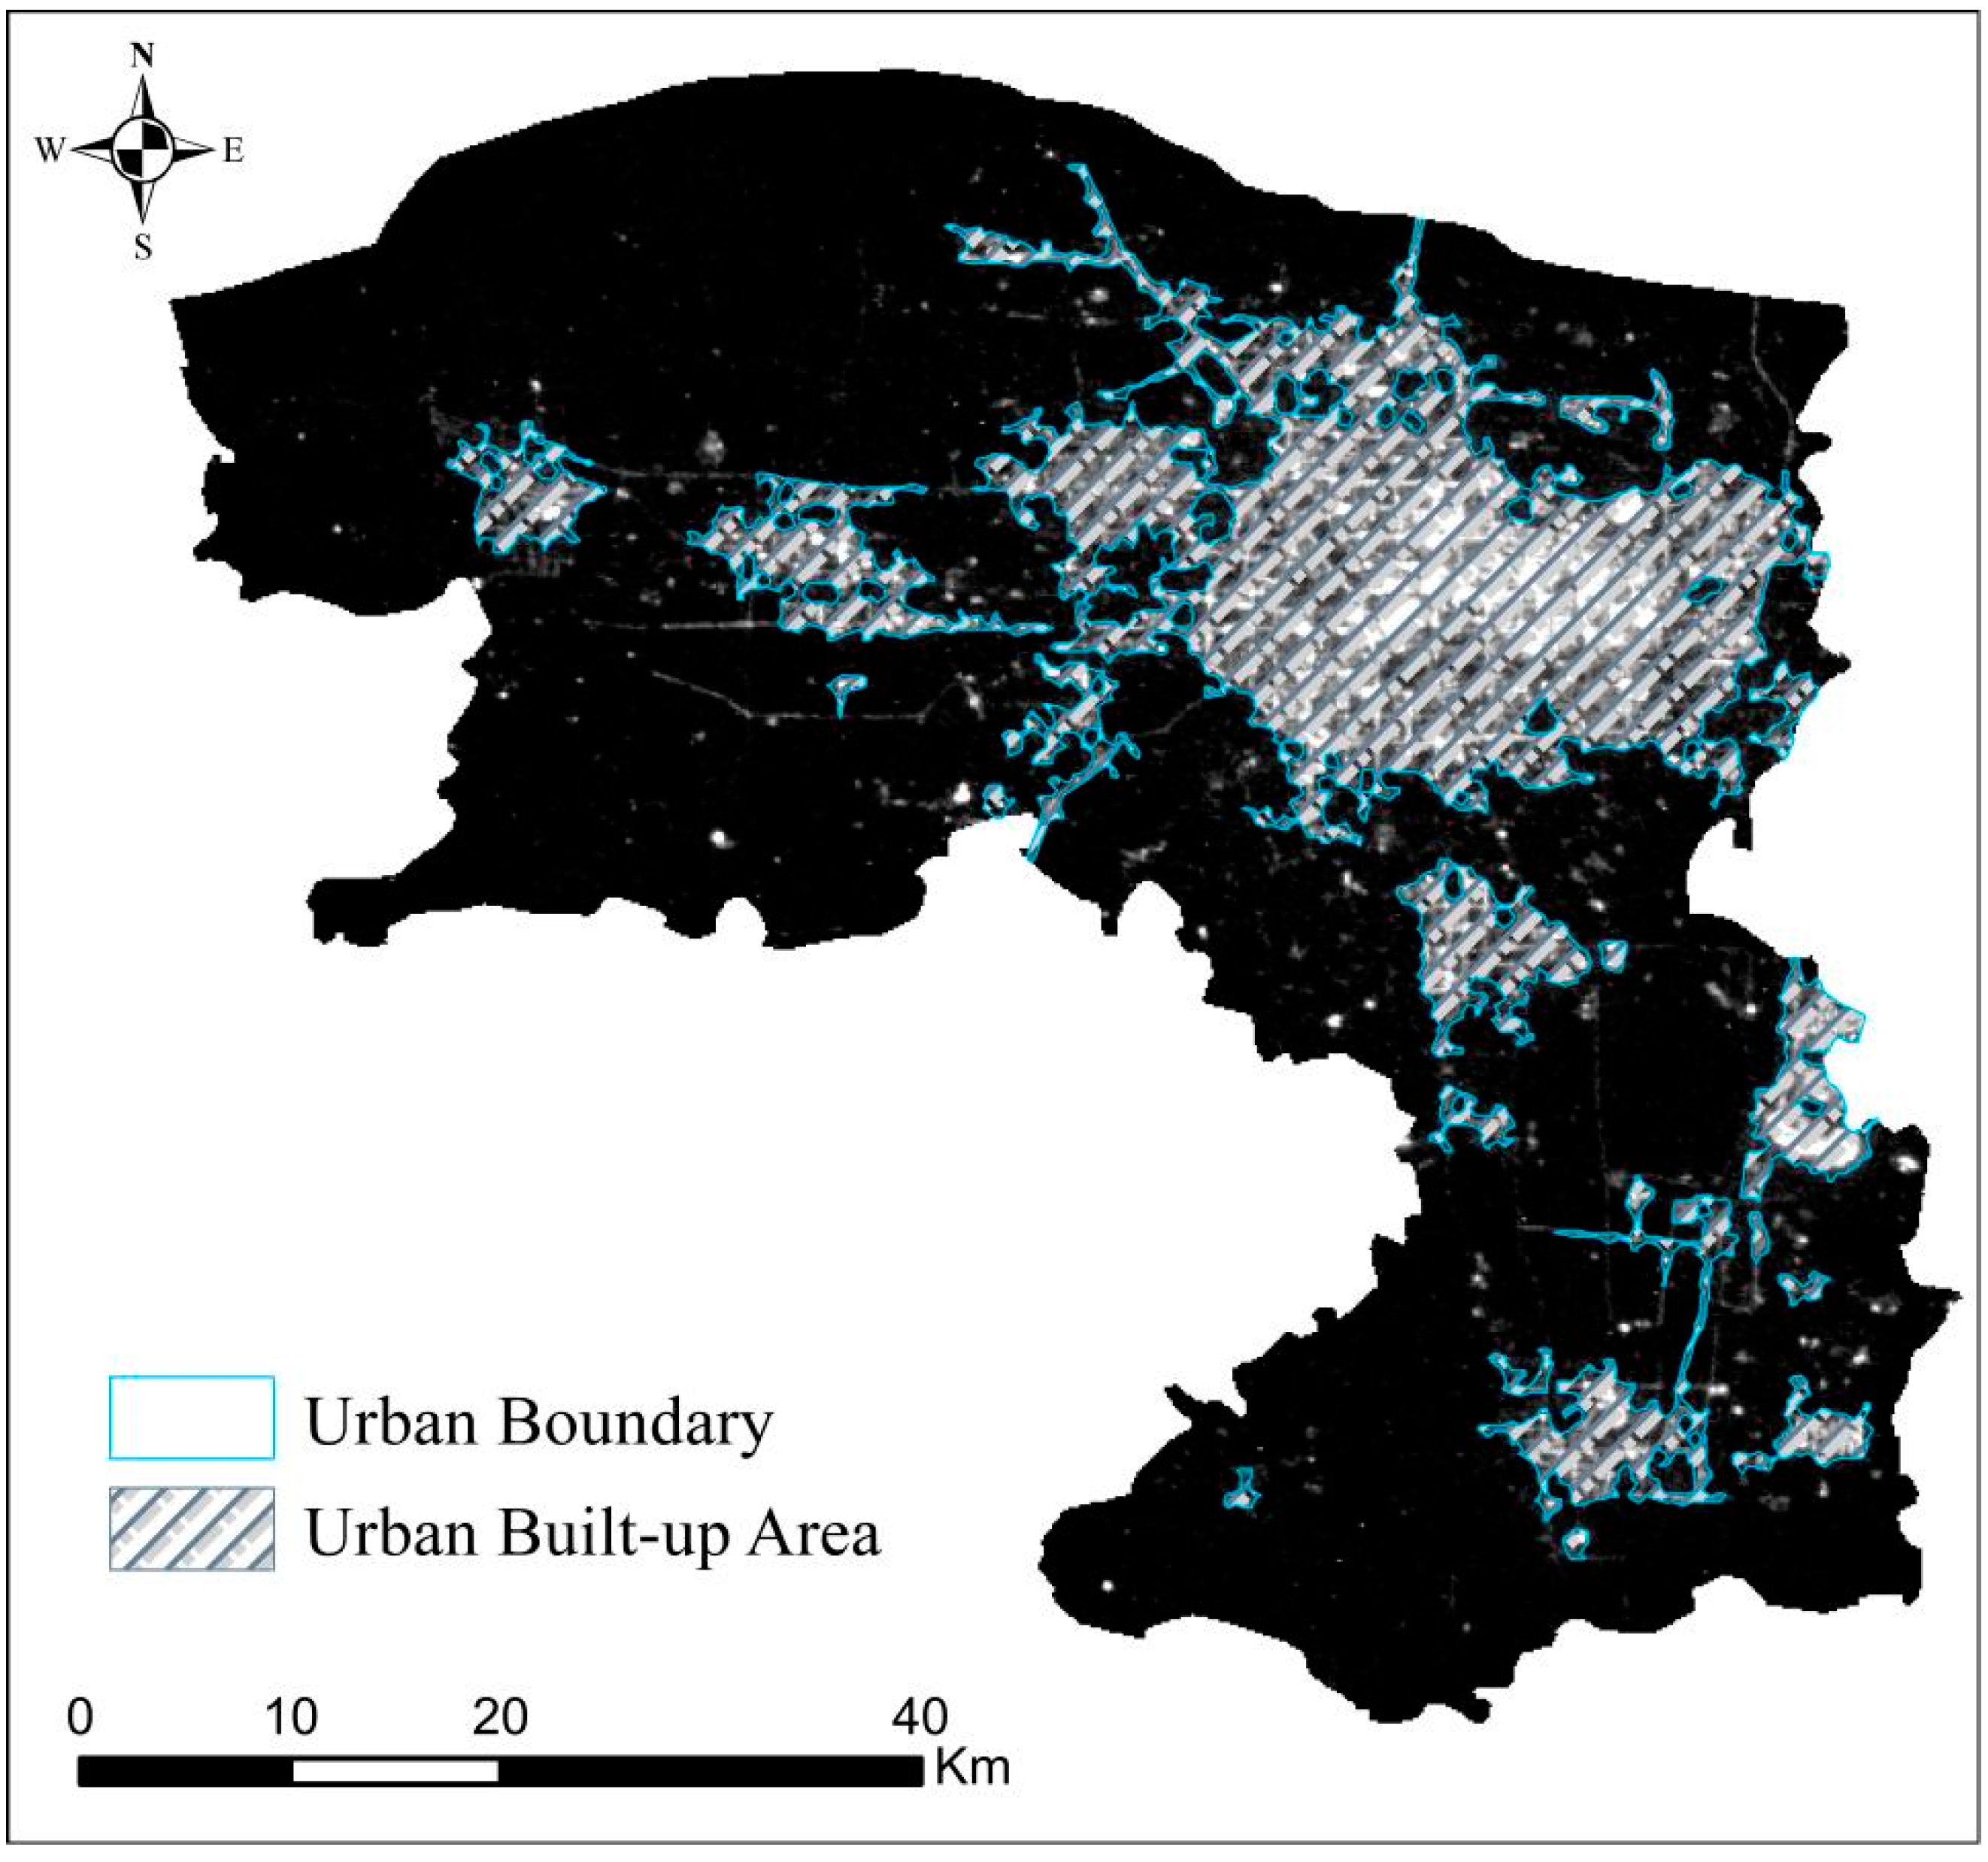
3.1.1. Urban Built-Up Area of Zhengzhou Extracted by NTL Data
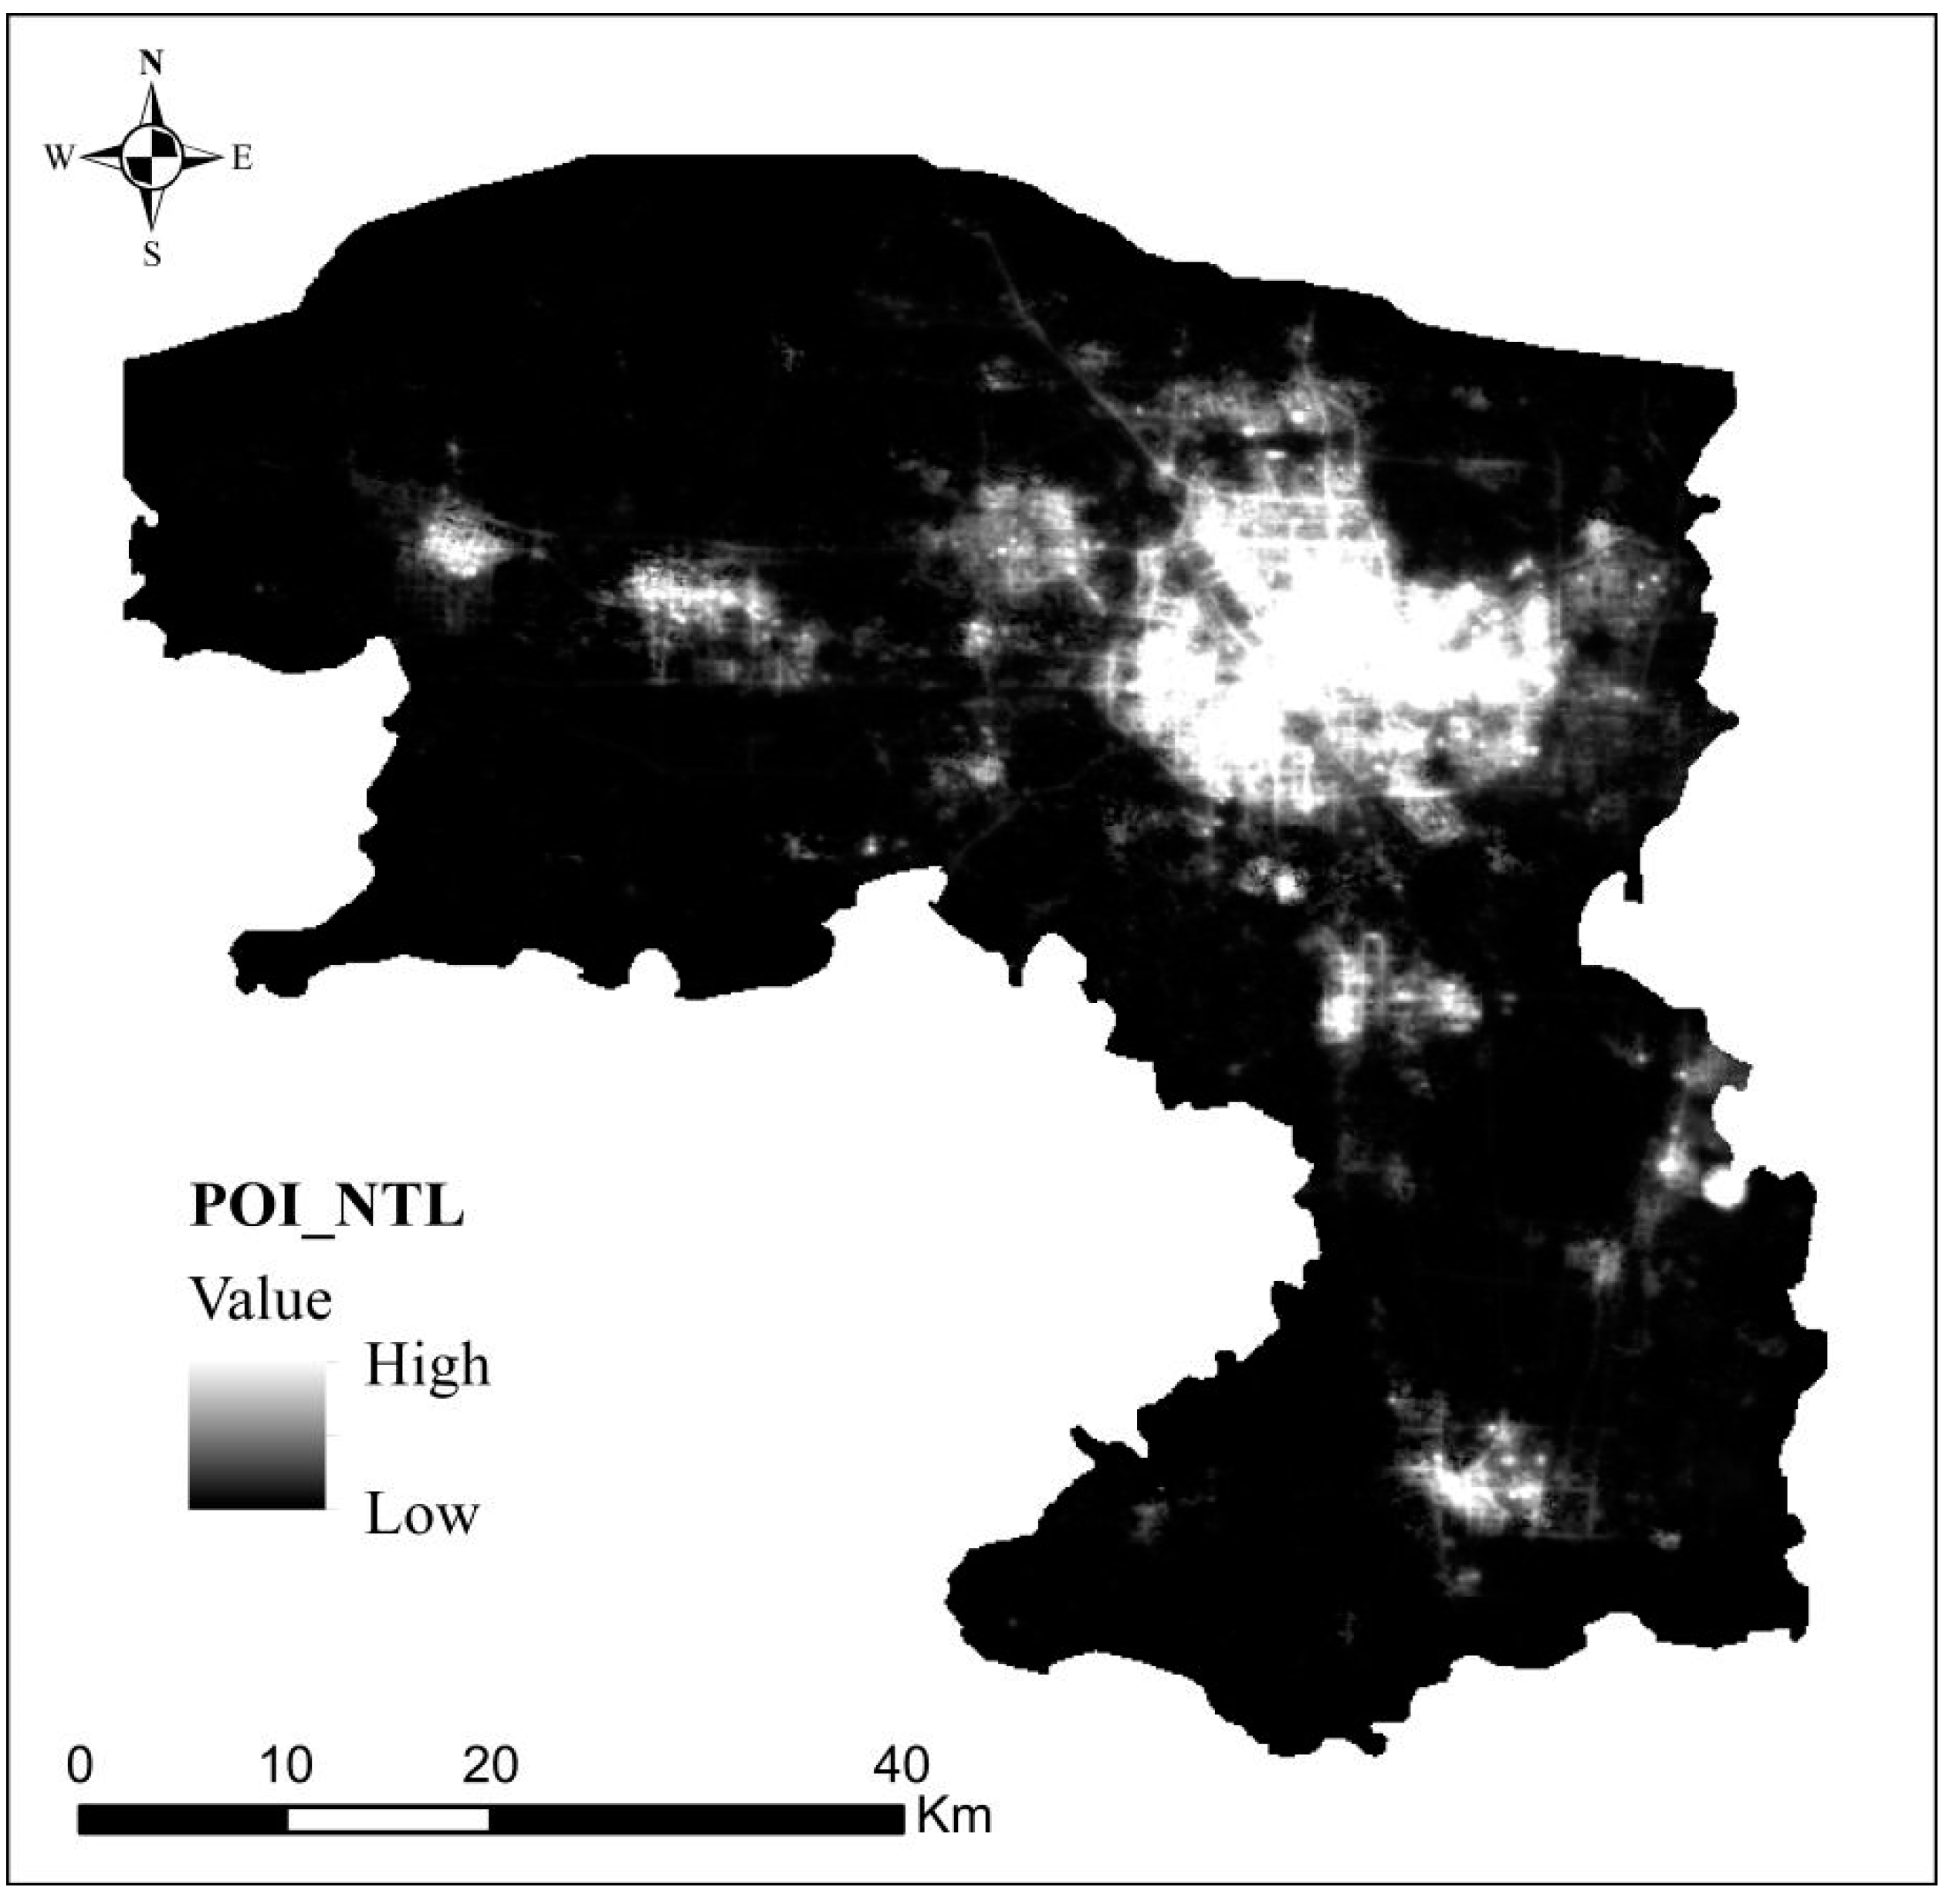
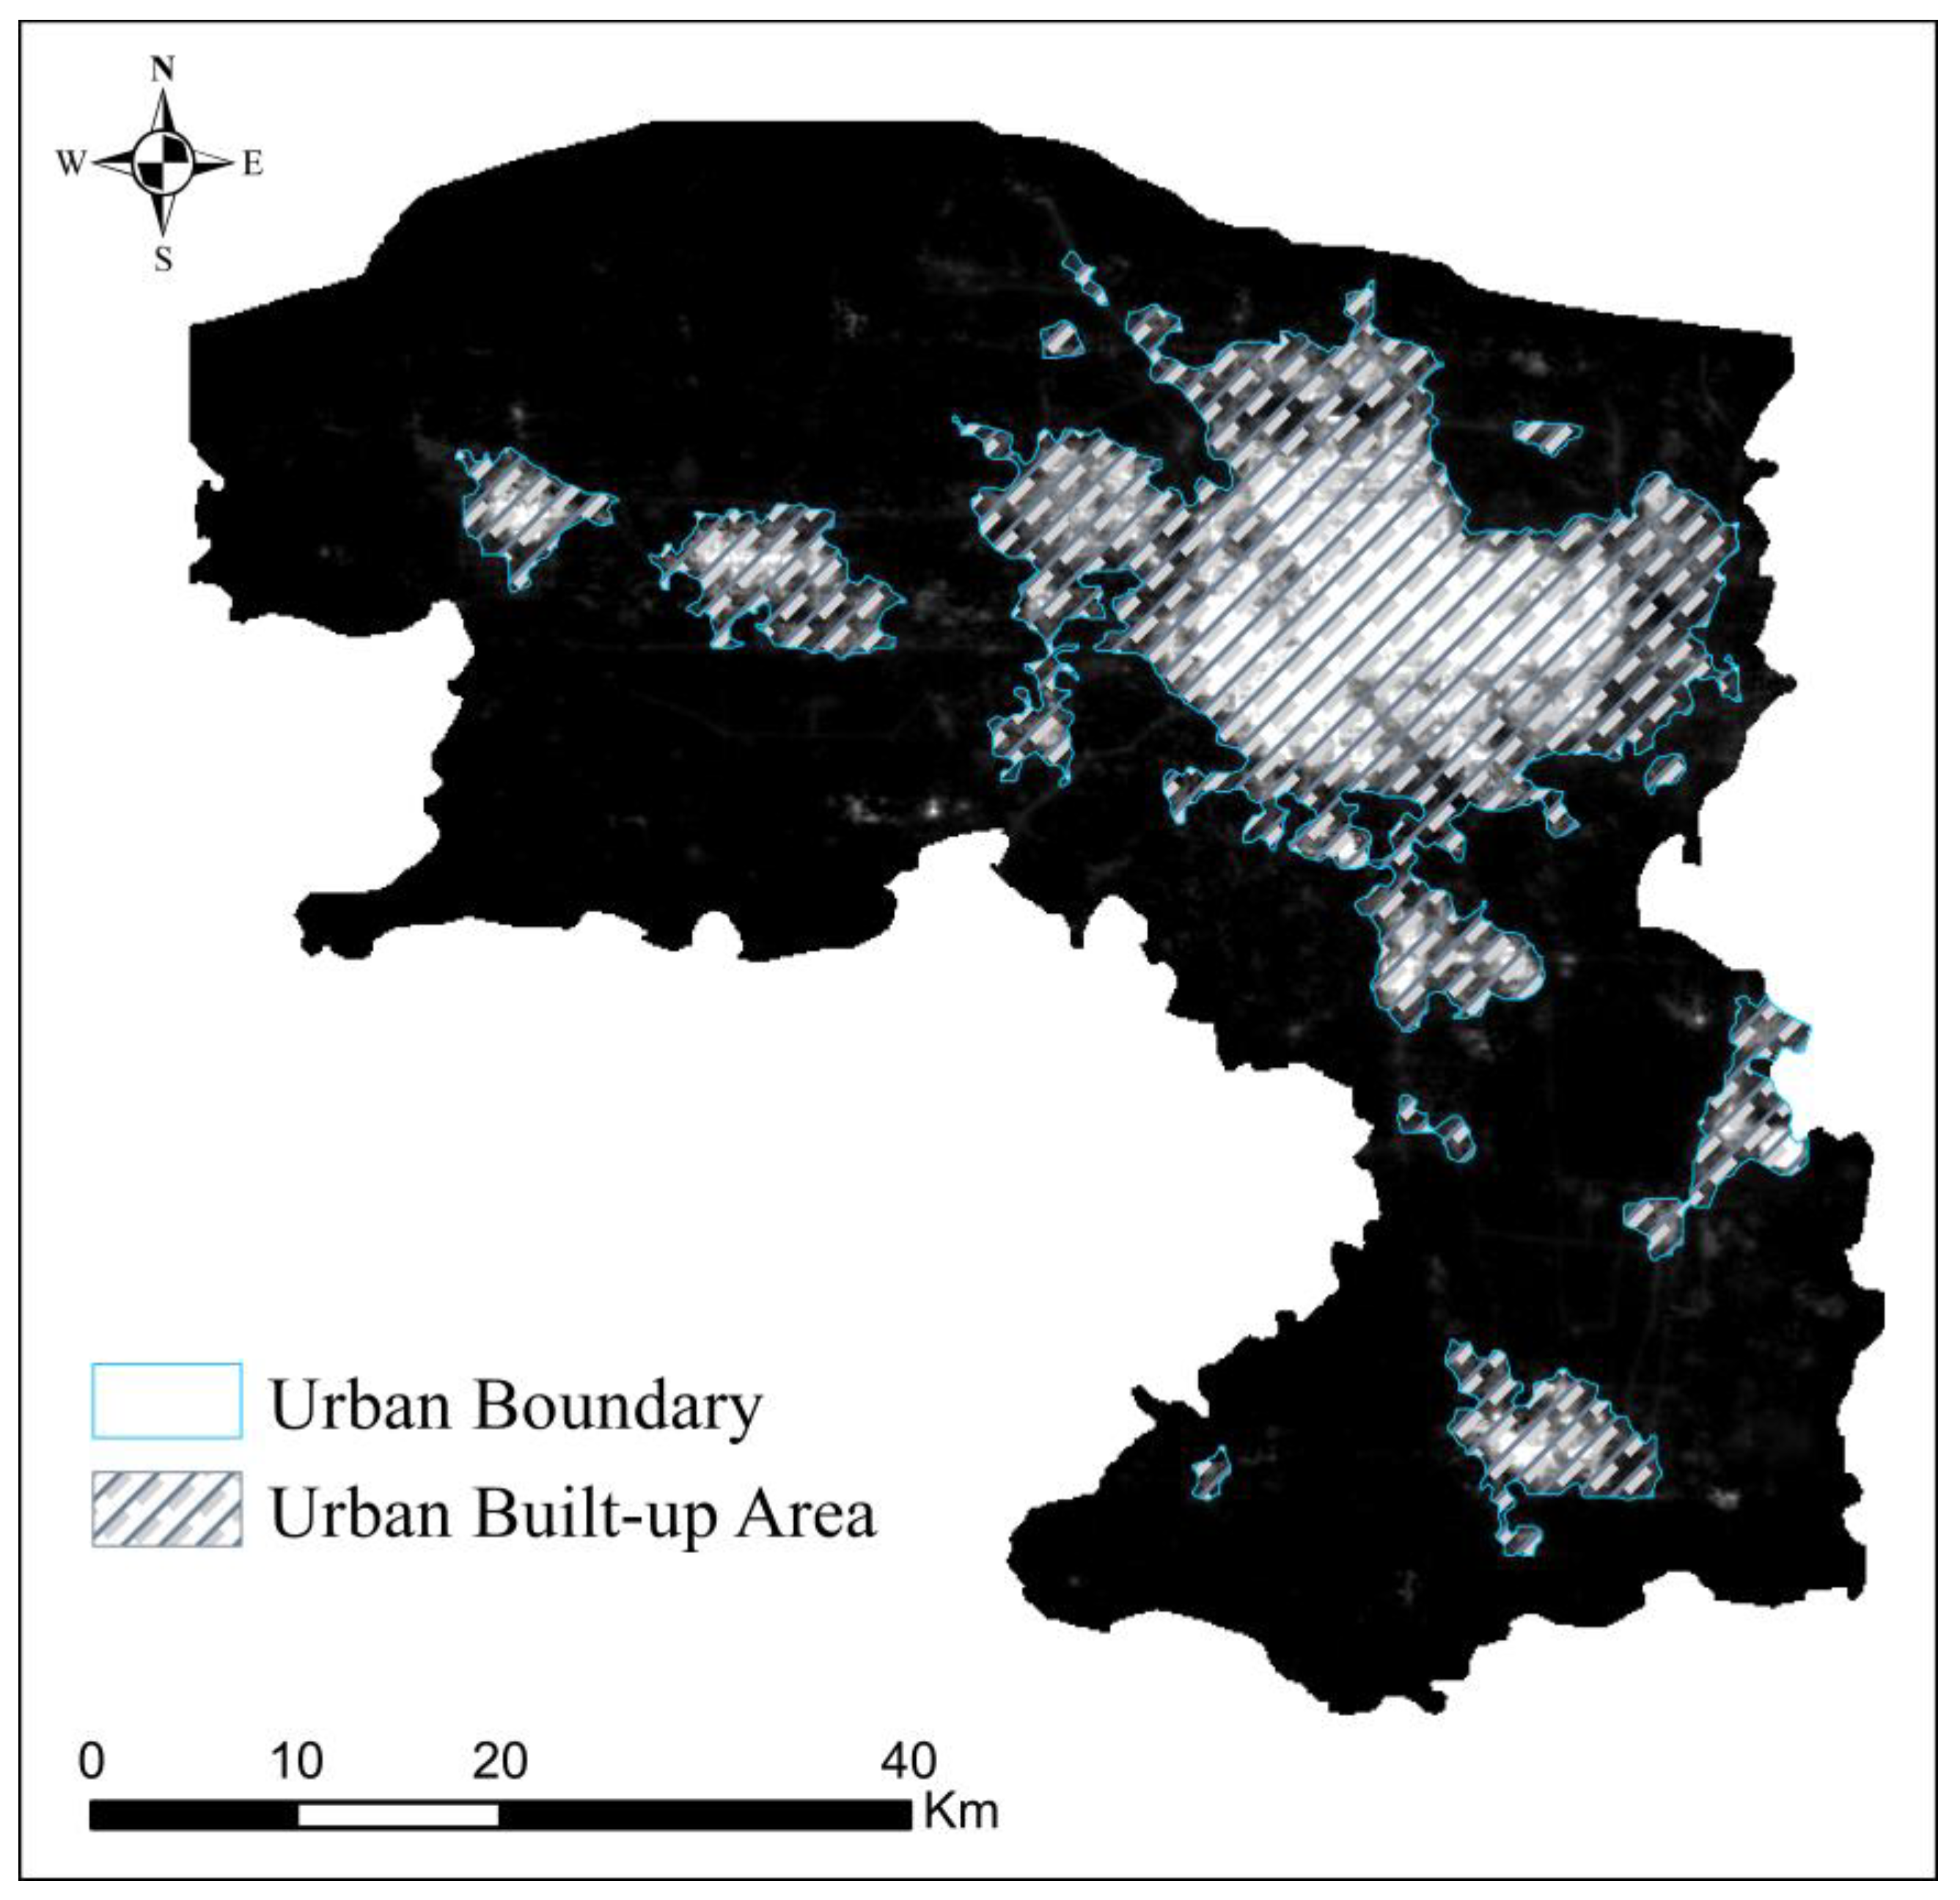
3.1.2. Urban Built-Up Area of Zhengzhou Extracted by Fusing NTL and POI Data
3.2. Comparative Verification of the Extraction Results
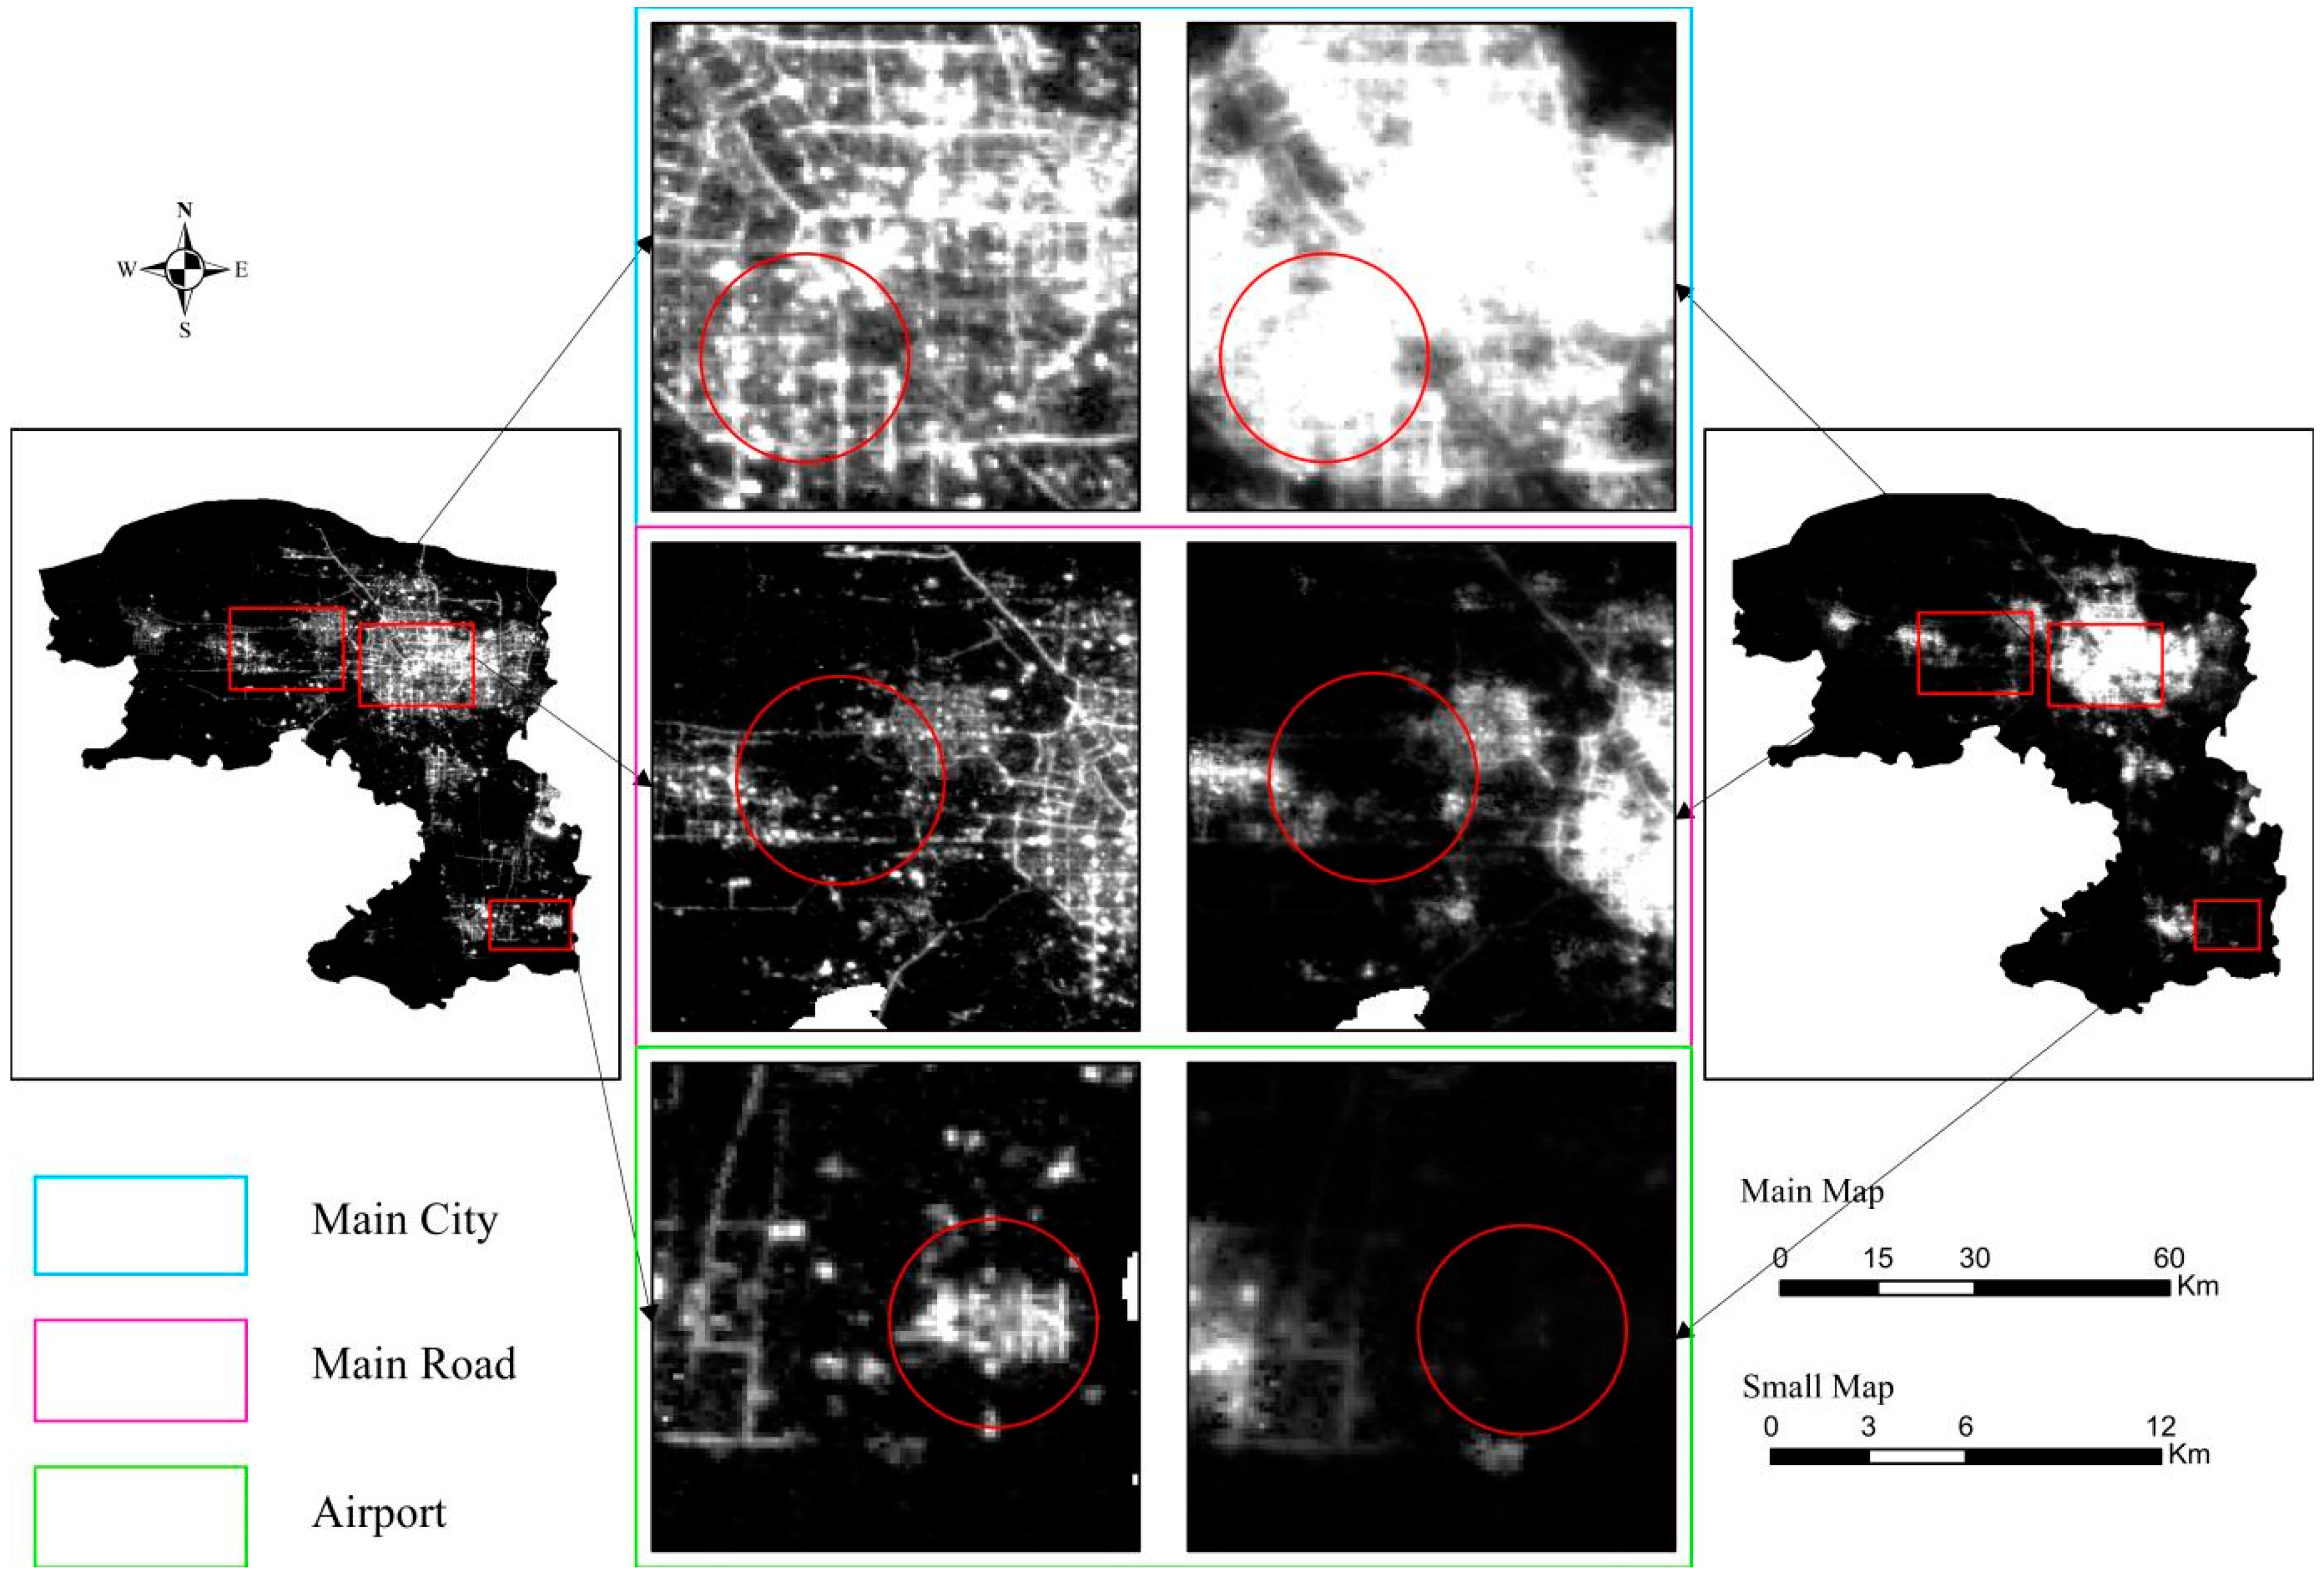
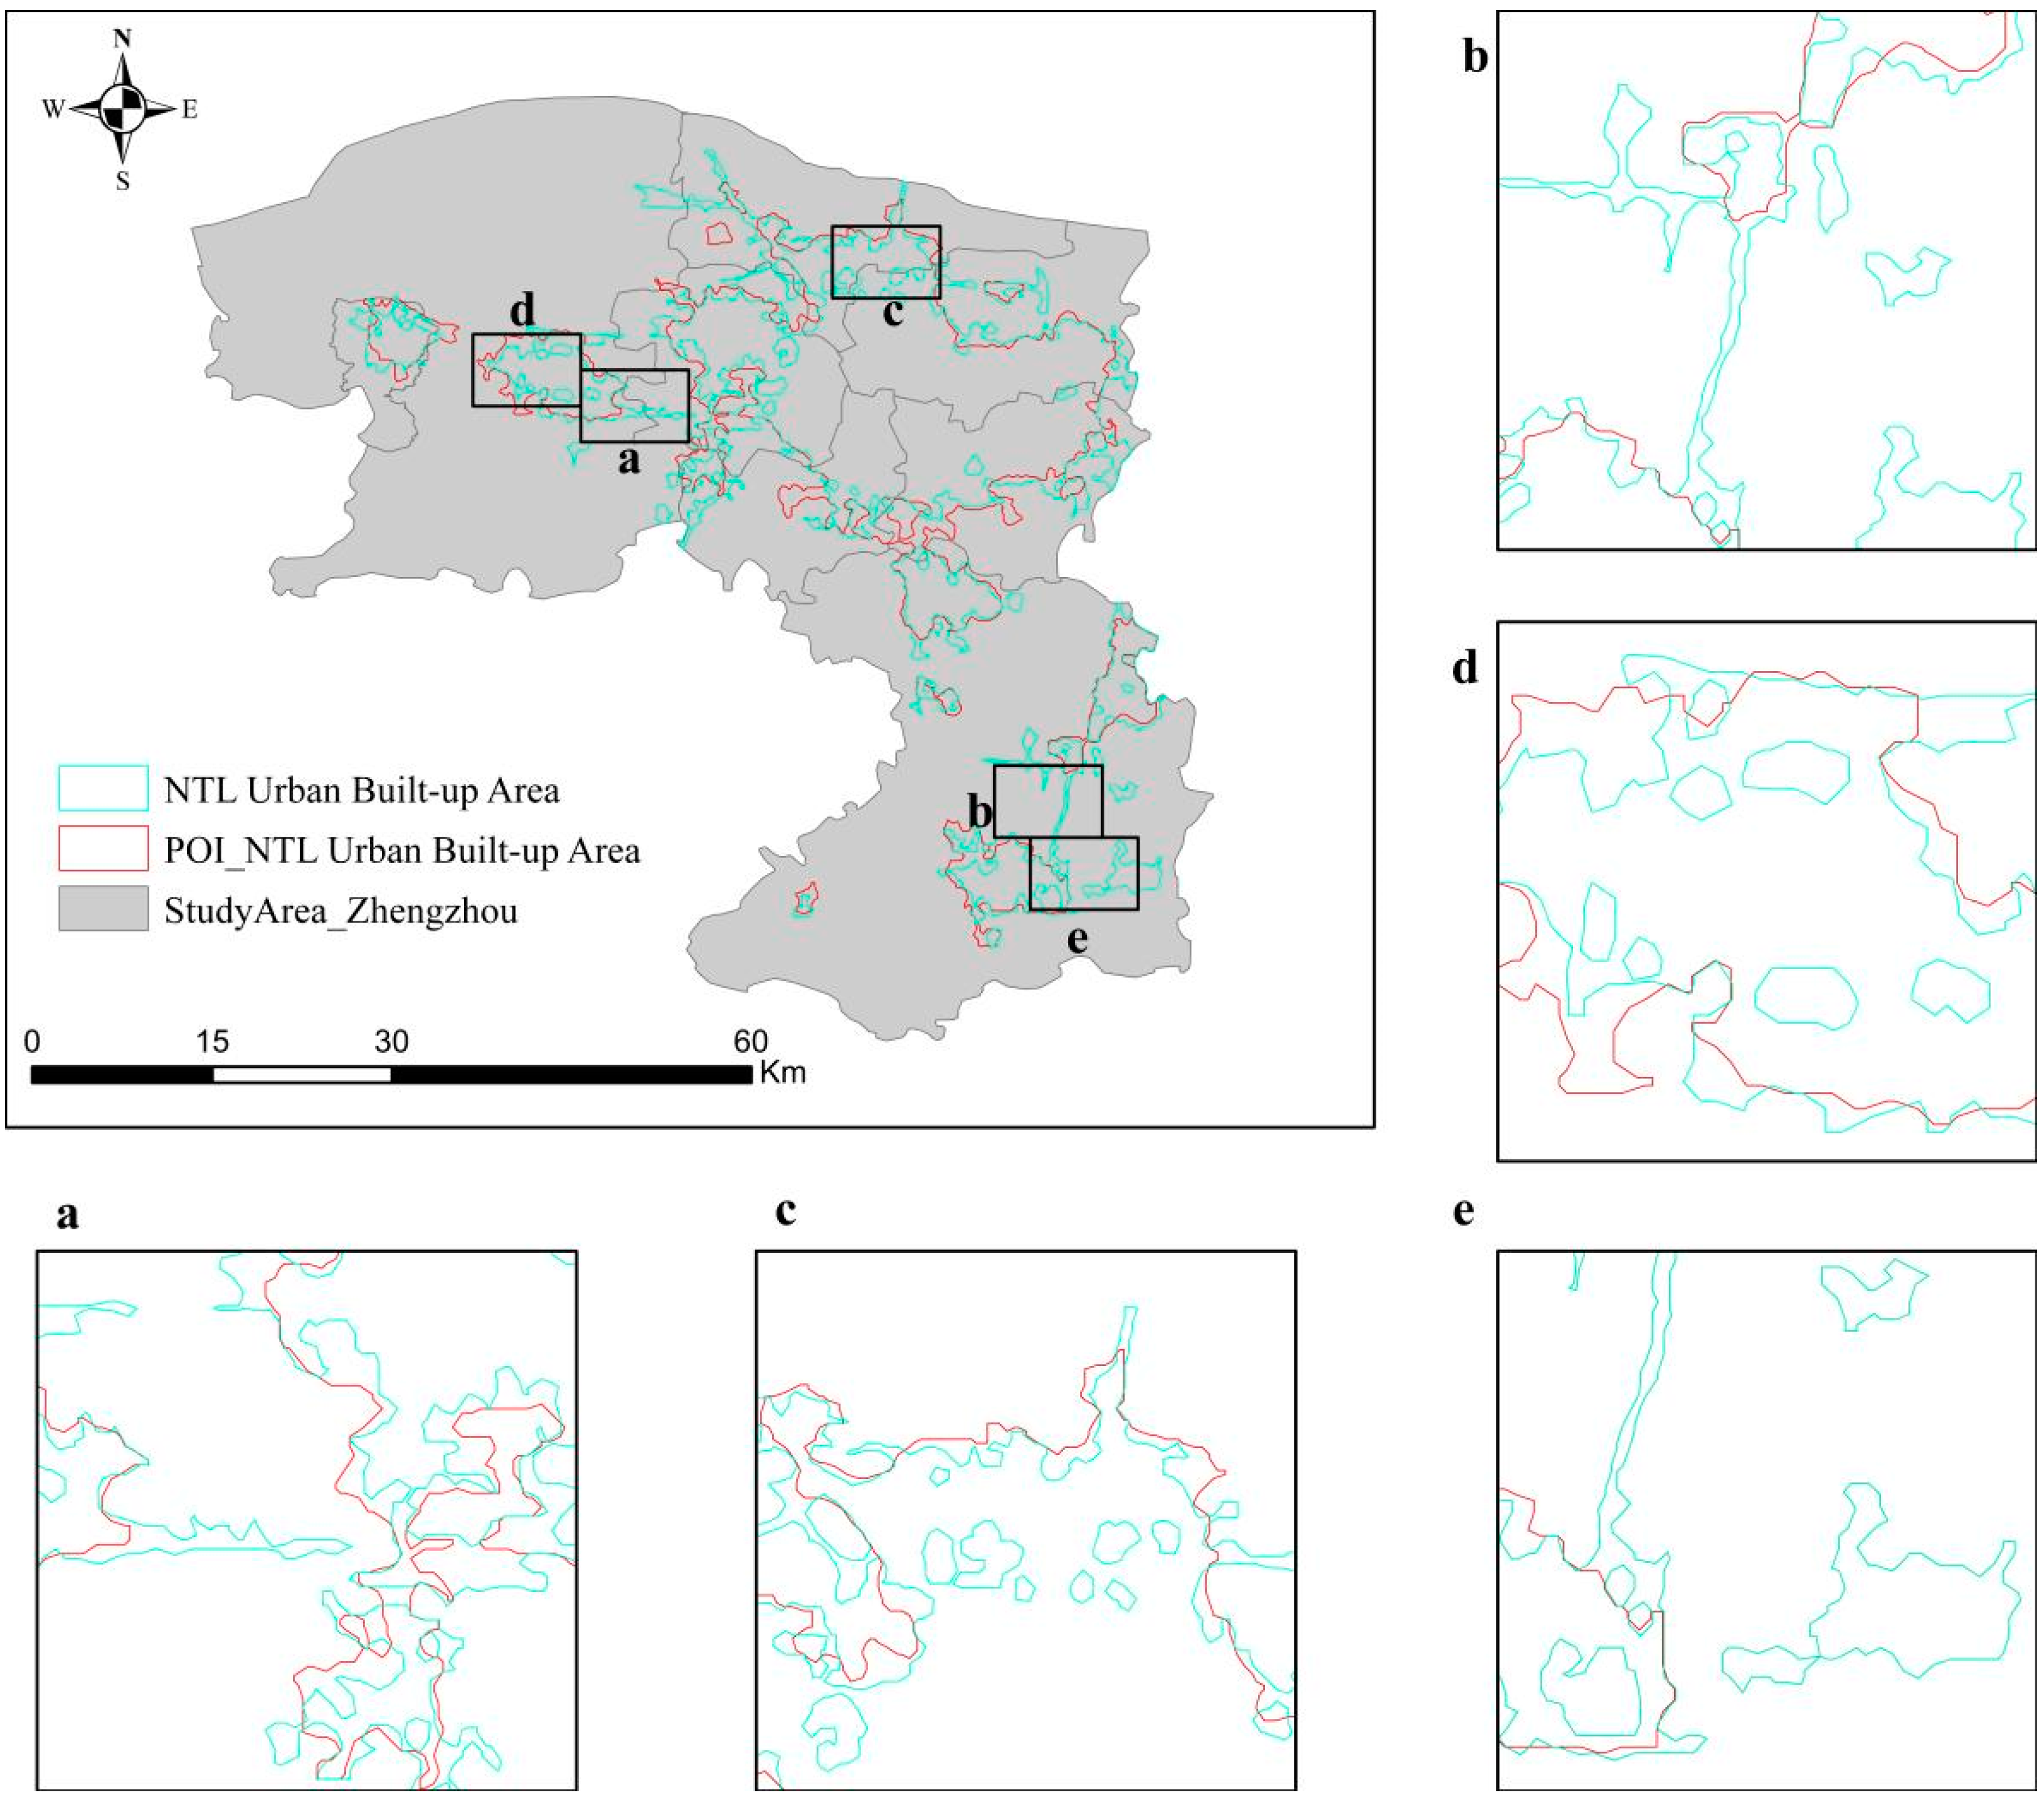
3.2.1. Comparative Analysis before and after Data Fusion
3.2.2. Comparative Analysis of Extracted Urban Built-Up Areas before and after Data Fusion
3.2.3. Precision Verification
4. Discussion
5. Conclusions
Author Contributions
Funding
Data Availability Statement
Conflicts of Interest
References
- Anasuya, B.; Swain, D.; Vinoj, V. Rapid urbanization and associated impacts on land surface temperature changes over Bhubaneswar Urban District, India. Environ. Monit. Assess. 2019, 191, 790. [Google Scholar] [CrossRef] [PubMed]
- Trinder, J.; Liu, Q. Assessing environmental impacts of urban growth using remote sensing. Geo-Spat. Inf. Sci. 2020, 23, 20–39. [Google Scholar] [CrossRef] [Green Version]
- Ejiagha, I.R.; Ahmed, M.R.; Hassan, Q.K.; Dewan, A.; Gupta, A.; Rangelova, E. Use of remote sensing in comprehending the influence of urban landscape’s composition and configuration on land surface temperature at neighbourhood scale. Remote Sens. 2020, 12, 2508. [Google Scholar] [CrossRef]
- Liang, X.; Liu, X.; Chen, G.; Leng, J.; Wen, Y.; Chen, G. Coupling fuzzy clustering and cellular automata based on local maxima of development potential to model urban emergence and expansion in economic development zones. Int. J. Geogr. Inf. Sci. 2020, 34, 1930–1952. [Google Scholar] [CrossRef]
- Li, H.M.; Li, X.G.; Yang, X.Y.; Zhang, H. Analyzing the relationship between developed land area and nighttime light emissions of 36 Chinese cities. Remote Sens. 2019, 11, 10. [Google Scholar] [CrossRef] [Green Version]
- Andrade-Núñez, M.J.; Aide, T.M. Built-up expansion between 2001 and 2011 in South America continues well beyond the cities. Environ. Res. Lett. 2018, 13, 084006. [Google Scholar] [CrossRef]
- Kotharkar, R.; Bahadure, P. Achieving compact city form through density distribution: Case of Indian cities. J. Urban Plan. Dev. 2020, 146, 04019022. [Google Scholar] [CrossRef]
- Shi, K.; Huang, C.; Yu, B.; Yin, B.; Huang, Y.; Wu, J. Evaluation of NPP-VIIRS night-time light composite data for extracting built-up urban areas. Remote Sens. Lett. 2014, 5, 358–366. [Google Scholar] [CrossRef]
- Zheng, Y.; Tang, L.; Wang, H. An improved approach for monitoring urban built-up areas by combining NPP-VIIRS nighttime light, NDVI, NDWI, and NDBI. J. Clean. Prod. 2021, 328, 129488. [Google Scholar] [CrossRef]
- Kotarba, A.Z.; Aleksandrowicz, S. Impervious surface detection with nighttime photography from the International Space Station. Remote Sens. Environ. 2016, 176, 295–307. [Google Scholar] [CrossRef]
- Wang, Z.; Yang, S.; Wang, S.; Shen, Y. Monitoring evolving urban cluster systems using DMSP/OLS nighttime light data: A case study of the Yangtze River Delta region, China. J. Appl. Remote Sens. 2017, 11, 046029. [Google Scholar] [CrossRef]
- Wang, R.; Wan, B.; Guo, Q.; Hu, M.; Zhou, S. Mapping regional urban extent using NPP-VIIRS DNB and MODIS NDVI data. Remote Sens. 2017, 9, 862. [Google Scholar] [CrossRef] [Green Version]
- Yu, B.; Tang, M.; Wu, Q.; Yang, C.; Deng, S.; Shi, K.; Peng, C.; Wu, J.; Chen, Z. Urban built-up area extraction from log-transformed NPP-VIIRS nighttime light composite data. IEEE Geosci. Remote Sens. Lett. 2018, 15, 1279–1283. [Google Scholar] [CrossRef]
- Li, F.; Yan, Q.; Zou, Y.; Liu, B. Extraction Accuracy of Urban Built-up Area Based on Nighttime Light Data and POI: A Case Study of Luojia 1-01 and NPP/VIIRS Nighttime Light Images. Geomat. Inf. Sci. Wuhan Univ. 2021, 46, 825–835. [Google Scholar]
- Liu, X.; Ning, X.; Wang, H.; Wang, C.; Zhang, H.; Meng, J. A rapid and automated urban boundary extraction method based on nighttime light data in China. Remote Sens. 2019, 11, 1126. [Google Scholar] [CrossRef] [Green Version]
- Li, F.; Yan, Q.; Bian, Z.; Liu, B.; Wu, Z. A POI and LST adjusted NTL urban index for urban built-up area extraction. Sensors 2020, 20, 2918. [Google Scholar] [CrossRef]
- Xiao, P.; Wang, X.; Feng, X.; Zhang, X.; Yang, Y. Detecting China’s urban expansion over the past three decades using nighttime light data. IEEE J. Sel. Top. Appl. Earth Obs. Remote Sens. 2014, 7, 4095–4106. [Google Scholar] [CrossRef]
- Cao, Q.; Yu, D.; Georgescu, M.; Wu, J.; Wang, W. Impacts of future urban expansion on summer climate and heat-related human health in eastern China. Environ. Int. 2018, 112, 134–146. [Google Scholar] [CrossRef]
- Zou, Y.; Peng, H.; Liu, G.; Yang, K.; Xie, Y.; Weng, Q. Monitoring Urban Clusters Expansion in the Middle Reaches of the Yangtze River, China, Using Time-Series Nighttime Light Images. Remote Sens. 2017, 9, 1007. [Google Scholar] [CrossRef] [Green Version]
- Sharma, R.C.; Tateishi, R.; Hara, K.; Gharechelou, S.; Iizuka, K. Global mapping of urban built-up areas of year 2014 by combining MODIS multispectral data with VIIRS nighttime light data. Int. J. Digit. Earth 2016, 9, 1004–1020. [Google Scholar] [CrossRef]
- Wang, Z.; Shrestha, R.M.; Román, M.O.; Kalb, V.L. NASA’s Black Marble Multi-Angle Nighttime Lights Temporal Composites. IEEE Geosci. Remote Sens. Lett. 2022, 19, 2505105. [Google Scholar]
- Lee, G.-B.; Lee, M.-J.; Lee, W.-K.; Park, J.-H.; Kim, T.-H. Shadow Detection Based on Regions of Light Sources for Object Extraction in Nighttime Video. Sensors 2017, 17, 659. [Google Scholar] [CrossRef]
- Cai, J.; Huang, B.; Song, Y. Using multi-source geospatial big data to identify the structure of polycentric cities. Remote Sens. Environ. 2017, 202, 210–221. [Google Scholar] [CrossRef]
- Zhuo, L.; Zhang, C.; Zhu, X.; Huang, T.; Hu, Y.; Tao, H. iSEAM: Improving the Blooming Effect Adjustment for DMSP-OLS Nighttime Light Images by Considering Spatial Heterogeneity of Blooming Distance. IEEE J. Sel. Top. Appl. Earth Obs. Remote Sens. 2021, 14, 3903–3913. [Google Scholar] [CrossRef]
- Hasan, S.; Shi, W.; Zhu, X.; Abbas, S. Monitoring of Land Use/Land Cover and Socioeconomic Changes in South China over the Last Three Decades Using Landsat and Nighttime Light Data. Remote Sens. 2019, 11, 1658. [Google Scholar] [CrossRef] [Green Version]
- Bell, A.; Mantecon, T.; Diaz, C.; Del-Blanco, C.R.; Jaureguizar, F.; Garcia, N. A Novel System for Nighttime Vehicle Detection Based on Foveal Classifiers With Real-Time Performance. IEEE Trans. Intell. Transp. Syst. 2021, 23, 5421–5433. [Google Scholar] [CrossRef]
- Zhang, J.; Zhang, X.; Tan, X.; Yuan, X. Extraction of Urban Built-Up Area Based on Deep Learning and Multi-Sources Data Fusion—The Application of an Emerging Technology in Urban Planning. Land 2022, 11, 1212. [Google Scholar] [CrossRef]
- Zhang, S.; Wei, H. Identification of Urban Agglomeration Spatial Range Based on Social and Remote-Sensing Data—For Evaluating Development Level of Urban Agglomeration. ISPRS Int. J. Geo-Inf. 2022, 11, 456. [Google Scholar] [CrossRef]
- Zhang, Q.; Seto, K.C. Mapping urbanization dynamics at regional and global scales using multi-temporal DMSP/OLS nighttime light data. Remote Sens. Environ. 2011, 115, 2320–2329. [Google Scholar] [CrossRef]
- Chen, Y.; Deng, A. Using POI Data and Baidu Migration Big Data to Modify Nighttime Light Data to Identify Urban and Rural Area. IEEE Access 2022, 10, 93513–93524. [Google Scholar] [CrossRef]
- Zhou, Y.; He, X.; Zhu, Y. Identification and Evaluation of the Polycentric Urban Structure: An Empirical Analysis Based on Multi-Source Big Data Fusion. Remote Sens. 2022, 14, 2705. [Google Scholar] [CrossRef]
- Cao, X.; Shi, Y.; Zhou, L. Research on Urban Carrying Capacity Based on Multisource Data Fusion—A Case Study of Shanghai. Remote Sens. 2021, 13, 2695. [Google Scholar] [CrossRef]
- Jun, Z.; Xiao-Die, Y.; Han, L. The Extraction of Urban Built-Up Areas by Integrating Night-Time Light and POI Data—A Case Study of Kunming, China. IEEE Access 2021, 9, 22417–22429. [Google Scholar] [CrossRef]
- He, X.; Zhu, Y.; Chang, P.; Zhou, C. Using Tencent User Location Data to Modify Night-Time Light Data for Delineating Urban Agglomeration Boundaries. Front. Environ. Sci. 2022, 10, 860365. [Google Scholar] [CrossRef]
- He, X.; Zhang, Z.; Yang, Z. Extraction of urban built-up area based on the fusion of night-time light data and point of interest data. R. Soc. Open Sci. 2021, 8, 210838. [Google Scholar] [CrossRef] [PubMed]
- Zhang, J.; Yuan, X.; Tan, X.; Zhang, X. Delineation of the Urban-Rural Boundary through Data Fusion: Applications to Improve Urban and Rural Environments and Promote Intensive and Healthy Urban Development. Int. J. Environ. Res. Public Health 2021, 18, 7180. [Google Scholar] [CrossRef] [PubMed]
- Zhou, C.; He, X.; Wu, R.; Zhang, G. Using Food Delivery Data to Identify Urban -Rural Areas: A Case Study of Guangzhou, China. Front. Earth Sci. 2022, 10, 860361. [Google Scholar] [CrossRef]
- He, X.; Zhou, C.; Zhang, J.; Yuan, X. Using Wavelet Transforms to Fuse Nighttime Light Data and POI Big Data to Extract Urban Built-Up Areas. Remote Sens. 2020, 12, 3887. [Google Scholar] [CrossRef]
- Wang, L.; Fan, H.; Wang, Y. Improving population mapping using Luojia 1-01 nighttime light image and location-based social media data. Sci. Total Environ. 2020, 730, 139148. [Google Scholar] [CrossRef]
- Wang, J.; Hu, C.; Ma, B.; Mu, X. Rapid Urbanization Impact on the Hydrological Processes in Zhengzhou, China. Water 2020, 12, 1870. [Google Scholar] [CrossRef]
- Li, X.; Zhu, J.; Yin, X.; Yao, C.; Huang, J.; Li, M. Mapping construction land of Guangzhou based on Luojia No. 1 nightlight data. J. Geo-Inf. Sci. 2019, 21, 1802–1810. [Google Scholar]
- Shi, K.; Chen, Z.; Cui, Y.; Wu, J.; Yu, B. NPP-VIIRS Nighttime Light Data Have Different Correlated Relationships With Fossil Fuel Combustion Carbon Emissions From Different Sectors. IEEE Geosci. Remote Sens. Lett. 2020, 18, 2062–2066. [Google Scholar] [CrossRef]
- Ortakavak, Z.; Çabuk, S.N.; Cetin, M.; Kurkcuoglu, M.A.S.; Cabuk, A. Determination of the nighttime light imagery for urban city population using DMSP-OLS methods in Istanbul. Environ. Monit. Assess. 2020, 192, 790. [Google Scholar] [CrossRef] [PubMed]
- Shi, K.; Chang, Z.; Chen, Z.; Wu, J.; Yu, B. Identifying and evaluating poverty using multisource remote sensing and point of interest (POI) data: A case study of Chongqing, China. J. Clean. Prod. 2020, 255, 120245. [Google Scholar] [CrossRef]
- Zikirya, B.; He, X.; Li, M.; Zhou, C. Urban Food Takeaway Vitality: A New Technique to Assess Urban Vitality. Int. J. Environ. Res. Public Health 2021, 18, 3578. [Google Scholar] [CrossRef] [PubMed]
- Massout, S.; Smara, Y. Panchromatic and multispectral image fusion using the spatial frequency and the à trous wavelet transform. J. Appl. Remote Sens. 2021, 15, 036510. [Google Scholar] [CrossRef]
- Gharbia, R.; Hassanien, A.E.; El-Baz, A.H.; Elhoseny, M.; Gunasekaran, M. Multi-spectral and panchromatic image fusion approach using stationary wavelet transform and swarm flower pollination optimization for remote sensing applications. Future Gener. Comput. Syst. 2018, 88, 501–511. [Google Scholar] [CrossRef]
- Shu-Long, Z. Image fusion using wavelet transform. Int. Arch. Photogramm. Remote Sens. Spat. Inf. Sci. 2002, 34, 552–556. [Google Scholar]
- Li, G.; Yang, H.; Wang, J.; Li, Y.; Zhang, C.; Xie, H.; Feng, B. PCA-based Wavelet Remote Sensing Image Synthesis Simulation Method. In Proceedings of the 2021 IEEE 5th Advanced Information Technology, Electronic and Automation Control Conference (IAEAC), Chongqin, China, 12–14 March 2021; Volume 5, pp. 1042–1046. [Google Scholar]
- Cheng, J.; Liu, H.; Liu, T.; Wang, F.; Li, H. Remote sensing image fusion via wavelet transform and sparse representation. ISPRS J. Photogramm. Remote Sens. 2015, 104, 158–173. [Google Scholar] [CrossRef]
- Hu, K.; Feng, X. Research on the multi-focus image fusion method based on the lifting stationary wavelet transform. J. Inf. Process. Syst. 2018, 14, 1293–1300. [Google Scholar]
- Gao, J.; Wang, B.; Wang, Z.; Wang, Y.; Kong, F. A wavelet transform-based image segmentation method. Optik 2020, 208, 164123. [Google Scholar] [CrossRef]
- Guobin, C.; Sun, Z.; Zhang, L. Road Identification Algorithm for Remote Sensing Images Based on Wavelet Transform and Recursive Operator. IEEE Access 2020, 8, 141824–141837. [Google Scholar] [CrossRef]
- Drăguţ, L.; Csillik, O.; Eisank, C.; Tiede, D. Automated parameterisation for multi-scale image segmentation on multiple layers. ISPRS J. Photogramm. Remote Sens. 2014, 88, 119–127. [Google Scholar] [CrossRef] [PubMed] [Green Version]
- Wang, Z.; Chen, G.; Yu, B.; Zhang, X. Determination of the optimal segmentation scale of high-resolution remote sensing images of islands and reefs in the south China sea. Geosptial Inf. 2018, 16, 21–24. [Google Scholar]
- Zhao, G.; Dong, J.; Liu, J.; Zhai, J.; Cui, Y.; He, T.; Xiao, X. Different patterns in daytime and nighttime thermal effects of urbanization in Beijing-Tianjin-Hebei urban agglomeration. Remote Sens. 2017, 9, 121. [Google Scholar] [CrossRef] [Green Version]
- Cui, Y.; Shi, K.; Jiang, L.; Qiu, L.; Wu, S. Identifying and Evaluating the Nighttime Economy in China Using Multisource Data. IEEE Geosci. Remote Sens. Lett. 2020, 18, 1906–1910. [Google Scholar] [CrossRef]
- Liu, S.; Shi, K.; Wu, Y.; Chang, Z. Remotely sensed nighttime lights reveal China’s urbanization process restricted by haze pollution. Build. Environ. 2021, 206, 108350. [Google Scholar] [CrossRef]
- Yuan, H.; Wang, X.; Wu, C.; Wang, H. Satellite Observed Strong Relationship Between Nighttime Surface Temperature and Leaf Coloring Dates of Terrestrial Ecosystems in East China. IEEE J. Sel. Top. Appl. Earth Obs. Remote Sens. 2020, 13, 717–725. [Google Scholar] [CrossRef]
- Wang, M.; Song, Y.; Wang, F.; Meng, Z. Boundary extraction of urban built-up area based on luminance value correction of NTL image. IEEE J. Sel. Top. Appl. Earth Obs. Remote Sens. 2021, 14, 7466–7477. [Google Scholar] [CrossRef]
- Li, Q.; Zheng, B.; Tu, B.; Yang, Y.; Wang, Z.; Jiang, W.; Yao, K.; Yang, J. Refining urban built-up area via multi-source data fusion for the analysis of Dongting Lake eco-economic zone spatiotemporal expansion. Remote Sens. 2020, 12, 1797. [Google Scholar] [CrossRef]
- Liu, L.; Leung, Y. A study of urban expansion of prefectural-level cities in South China using night-time light images. Int. J. Remote Sens. 2015, 36, 5557–5575. [Google Scholar] [CrossRef]
- Li, L.; Zhou, H.; Wen, Q.; Chen, T.; Guan, F.; Ren, B.; Yu, H.; Wang, Z. Automatic extraction of urban built-up area based on object-oriented method and remote sensing data. Int. Arch. Photogramm. Remote Sens. Spat. Inf. Sci. 2018, 42, 877–883. [Google Scholar] [CrossRef] [Green Version]
- He, X.; Zhou, C.; Wang, Y.; Yuan, X. Risk Assessment and Prediction of COVID-19 Based on Epidemiological Data From Spatiotemporal Geography. Front. Environ. Sci. 2021, 9, 634156. [Google Scholar] [CrossRef]
- Wu, J.; Zhang, Z.; Yang, X.; Li, X. Analyzing Pixel-Level Relationships between Luojia 1-01 Nighttime Light and Urban Surface Features by Separating the Pixel Blooming Effect. Remote Sens. 2021, 13, 4838. [Google Scholar] [CrossRef]
- Bu, L.; Xu, Z.; Zhang, G. Night-Light Image Restoration Method Based on Night Scattering Model for Luojia 1-01 Satellite. Sensors 2019, 19, 3761. [Google Scholar] [CrossRef]


| Data | Urban | Rural | Accuracy | Kappa | |
|---|---|---|---|---|---|
| NTL | Urban | 498 | 70 | 85.95% | 0.7089 |
| Rural | 211 | 1221 | |||
| POI_NTL | Urban | 532 | 36 | 96.15% | 0.8454 |
| Rural | 101 | 1331 |
Publisher’s Note: MDPI stays neutral with regard to jurisdictional claims in published maps and institutional affiliations. |
© 2022 by the authors. Licensee MDPI, Basel, Switzerland. This article is an open access article distributed under the terms and conditions of the Creative Commons Attribution (CC BY) license (https://creativecommons.org/licenses/by/4.0/).
Share and Cite
Chen, Y.; Zhang, J. Extraction of Urban Built-Up Areas Based on Data Fusion: A Case Study of Zhengzhou, China. ISPRS Int. J. Geo-Inf. 2022, 11, 521. https://doi.org/10.3390/ijgi11100521
Chen Y, Zhang J. Extraction of Urban Built-Up Areas Based on Data Fusion: A Case Study of Zhengzhou, China. ISPRS International Journal of Geo-Information. 2022; 11(10):521. https://doi.org/10.3390/ijgi11100521
Chicago/Turabian StyleChen, Yaping, and Jun Zhang. 2022. "Extraction of Urban Built-Up Areas Based on Data Fusion: A Case Study of Zhengzhou, China" ISPRS International Journal of Geo-Information 11, no. 10: 521. https://doi.org/10.3390/ijgi11100521