

Aggregation of an Amyloidogenic Peptide on Gold Surfaces

School of Biological and Chemical Sciences, University of Galway, H91 TK33 Galway, Ireland
Biomolecules 2023, 13(8), 1261; https://doi.org/10.3390/biom13081261
Submission received: 6 July 2023
/
Revised: 3 August 2023
/
Accepted: 14 August 2023
/
Published: 18 August 2023
(This article belongs to the Special Issue Mechanisms and Kinetics of Interactions of Biomolecules at Interfaces)
Abstract
:Solid surfaces have been shown to affect the aggregation and assembly of many biomolecular systems. One important example is the formation of protein fibrils, which can occur on a range of biological and synthetic surfaces. The rate of fibrillation depends on both the protein structure and the surface chemistry, with the different molecular and oligomer structures adopted by proteins on surfaces likely to be crucial. In this paper, the aggregation of the model amyloidogenic peptide, A(16–22), corresponding to a hydrophobic segment of the amyloid beta protein on a gold surface is studied using molecular dynamics simulation. Previous simulations of this peptide on gold surfaces have shown that it adopts conformations on surfaces that are quite different from those in bulk solution. These simulations show that this then leads to significant differences in the oligomer structures formed in solution and on gold surfaces. In particular, oligomers formed on the surface are low in beta-strands so are unlike the structures formed in bulk solution. When oligomers formed in solution adsorb onto gold surfaces they can then restructure themselves. This can then help explain the inhibition of A(16–22) fibrillation by gold surfaces and nanoparticles seen experimentally.
1. Introduction
Since their discovery amyloid fibrils have attracted significant scientific interest [1]. Much of this has focused on their involvement in disease, initially inspired by the discovery of plaques comprised of amyloid-beta fibrils in the brains of patients with Alzheimer’s disease [2]. Subsequently, they have been found to be implicated in over thirty diseases [3], notably degenerative diseases such as Parkinson’s or Type-II diabetes. This has prompted much work investigating the structure and formation of amyloid fibrils, as a focus for developing treatments for these diseases [4]. Alongside pathogenic fibrils, amyloid fibrils have been found to fulfil a number of functional roles [5], including mediating surface adhesion [6], biofilm structuring [7], and hormone storage [8]. Due to their attractive material and mechanical properties, amyloid fibrils have also been investigated as components in synthetic systems [5,9], with applications in areas including biomaterials [10] and optoelectronics [11]. Understanding the formation of fibrils, both pathogenic and functional, and how this depends on the environment is therefore of great interest
Commonly it is recognised that the formation of fibrils (and protein aggregation and assembly in general) is affected by surfaces [12,13] and nanoparticles [14,15], which is often attributed to two discrete effects [16]. The first is that, due to their amphiphilic nature, the concentration of proteins near a surface is typically higher than in a bulk solution. This increase in protein concentration then increases the likelihood of proteins aggregating into supramolecular structures, such as fibrils [17]. The second effect comes from the change in the protein conformation on surfaces, due to protein–surface interactions. This can then lead to differences in protein–protein interactions on surfaces, with consequent effects on their aggregation [18,19]. While the first effect increases the rate of fibril formation, the second can promote or inhibit the fibril formation process depending on both protein and surface chemistry. In particular, while hydrophobic surfaces were observed to enhance fibrillation for amyloid beta [20], they inhibited fibril growth for amylin [21]. In the case of amylin molecular dynamics simulations have shown that on hydrophobic surfaces [22] it preferentially adopts alpha-helical structures that may be unfavourable towards fibril formation. This suggests that there is a decoupling between the protein concentration and fibrillation rate, with the relative strengths of the protein–surface and protein–protein interactions playing a critical role [23,24].
Despite the long interest in fibril formation, both in bulk solution and on surfaces, there are many unanswered questions in this. In particular, aspects of the early stages of fibril formation are unclear [25], such as the structure of prefibrillar oligomers. The structure of these can determine the rate of fibril growth as well as influence the structure of the final fibril, which may give rise to fibril polymorphism [26]. It is also thought that the toxic species in some amyloid diseases are off-pathway oligomers [27,28], so understanding oligomer structure and formation may give insight into the progress of degenerative diseases and guide the development of therapies [29]. Due to their small size and relatively transient nature, determining the structure of these small oligomers and their aggregation into fibrils is challenging experimentally [30].
As it operates directly on the molecular level, molecular dynamics simulations have emerged as a powerful tool for the investigation of protein–surface interactions [31,32]. These have been used for a number of years to investigate the adsorption of proteins onto surfaces, revealing molecular details that drive adsorption onto surfaces, such as the role of bound water and surface chemistry and structure. Recently, a number of studies have used these to investigate the behaviour of fibril forming proteins on surfaces [22,33,34,35,36,37,38,39,40], often in combination with advanced sampling techniques, such as replica exchange molecular dynamics [41] or metadynamics [42]. These have shown that changes to surface chemistry can have a significant effect on the conformations the protein can adopt. The specific effect is, however, protein-dependent so it is challenging to draw general conclusions from this.
Simulations have also been used to investigate the formation of protein fibrils [43,44], in particular investigating the early stages of this. These have shown that initially peptides can aggregate into disordered oligomers, with conformational change into beta-strand rich oligomers following this [45,46,47]. While these simulations have largely addressed oligomers in bulk solution, a few simulations have investigated the effect of surfaces on the formation and structure of protein oligomers [35,48,49,50,51]. Notably the amyloidogenic fragments GNNQQNY (from SUP35 prion protein) and NNFGAIL (from amylin) are both found to form fibrillar structures on gold surface [35], mediated by attachment onto already adsorbed peptides. This was in agreement with experimental work that showed that gold nanoparticles enhanced fibril formation for these peptides [52]. Simulations have also addressed the adsorption of fibrils onto surfaces, examining the fibril–surface interaction and changes to fibril structure for different surface chemistries [48,49].
In this paper, the structures formed by aggregates of the amyloidogenic peptide A(16–22) (KLVFFAE) on the Au111 surface and in bulk solution are investigated using molecular dynamics simulations. This is a key fibril forming segment from the amyloid-beta protein [53] and due to its relatively small size, it has attracted significant attention. Single-molecule simulations have also shown that, unlike the GNNQQNY and NNFGAIL sequences studied previously, on gold surfaces this does not adopt fibril-like conformations [34,40]. This makes the combination of the A(16–22) peptide and Au111 surface an ideal test case for investigating the interplay between peptide conformation and interpeptide interactions in oligomerization. Gold nanoparticles have also attracted significant interest in medical applications [54], so understanding the interaction between gold surfaces, for which the Au111 surface is the most thermodynamically stable, is of relevance to medicine. Unlike previous studies of peptide aggregation on surfaces, we are interested in isolating the specific roles of surfaces and interpeptide interactions on this. In order to specifically investigate the role of surfaces on the aggregation of A(16–22) simulations of aggregation of initially isolated monomers on the surfaces will be compared to aggregation in bulk solution. This allows us to examine whether the peptides retain the fibril unfavourable conformation adopted by individual peptides on surfaces during the aggregation process or whether the interpeptide interactions drive the formation of fibril-like conformations. In addition, the adsorption of oligomers formed in solution onto the Au111 surface was investigated to determine the change in oligomer structure due to interaction with the surface.
2. Model and Methodology
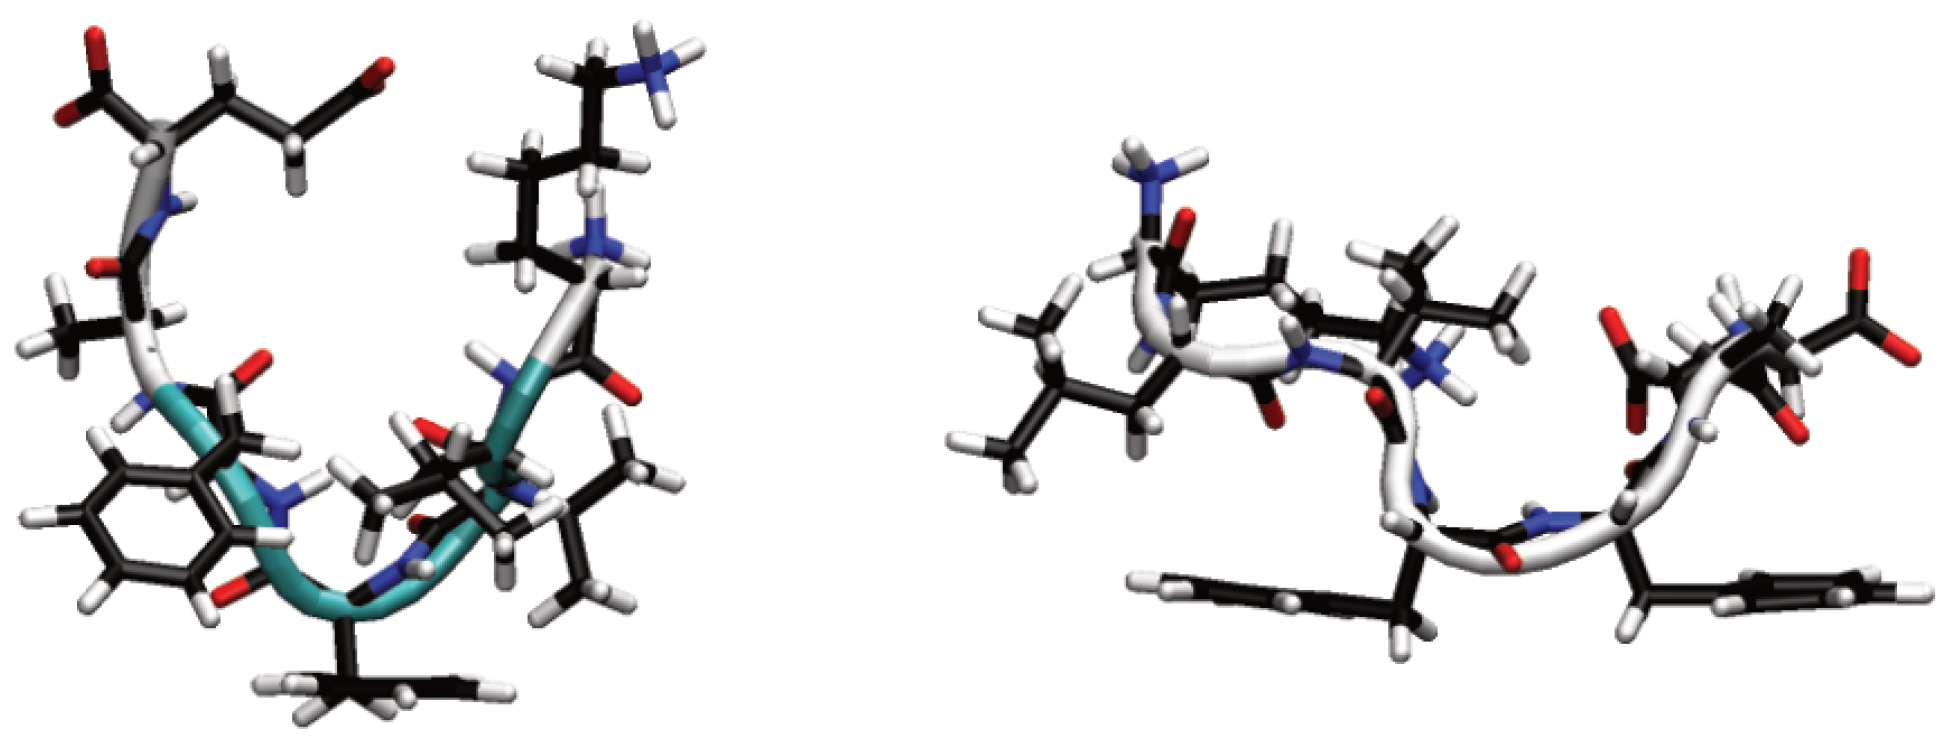
For both surface and solution simulations, the systems contained four to eight A(16–22) (KLVFFAE) molecules. The initial conformations of the peptides were taken to be the most common conformations found from previous simulations of single A(16–22) peptides in solution and on the Au111 surface [40] (Figure 1). The termini and polarizable residues (K and E) were charged, as appropriate for pH 7. As the peptide is overall charge neutral no counter-ions were needed to neutralise the system. The initial conformations were taken to be the most common structures found from previous simulations of single A(16–22) peptides in solution and the Au111 surface [40] (Figure 1). For bulk simulations, the peptides were randomly placed in the box using the packmol program [55]. These were then solvated through the addition of water molecules, removing any water molecules that overlap with the peptides. The peptide concentrations were 0.05–0.10 mol L; this is considerably higher than the peptide concentrations used in the experiment but allowed for the formation of oligomers within the simulation timescales.
In the surface simulations the surface consisted of a 20 × 12 unit cell Au111 surface, with five layers of atoms. A lattice parameter of 4.14 Å was used, consistent with previous work [56]. Positions of the surface atoms, except for the mobile charge sites (see below), were held fixed in the simulations. For simulations investigating aggregation on the surface the peptides were placed in a regular lattice on the surface with random orientations. The initial peptide structure was taken to be the most commonly found conformation from simulations of single A(16–22) peptides on the Au111 surface, with the molecule oriented so the Phe residues were facing the surface. The surface dimensions were 5.860 nm × 6.090 nm, giving a surface density of 1.86–3.92 × 10 mol m. In the oligomer adsorption simulations, the final oligomer structure from each of the bulk solution simulations (with all the peptides in the system in a single oligomer) was used. These were oriented with their long axis aligned along the x-axis and placed so the closest distance between any atom and the gold surface was 10 Å.
All simulations were run in duplicate from different starting configurations. For all cases, the initial structure was energy minimised, with a tolerance of 10 kJ mol nm. For the surface simulations, the z-box length was adjusted so the water density far from the surface was equal to the bulk water density, with this typically being nm.
The charmm22* force field [57,58,59] was used for modelling the peptides with the charmm-TIP3P model [60] used for water. The gold surface was modelled using the polarizable GolP-Charmm model [56,61]. This introduces a mobile charge attached to each gold atom to mimic the effect of polarization and additional interstitial interaction sites on the surface to ensure favourable adsorption on top of the surface gold atoms.
All simulations were run at 300 K, with the solution simulations performed at 1 atm. The temperature was controlled using a velocity-rescale thermostat [62], with a relaxation time of 0.2 ps, while the pressure in the solution simulations was controlled using the Parinello-Rahman barostat [63] (with a relaxation time of 2 ps). Long-range electrostatic interactions were accounted for using a particle mesh Ewald (PME) sum [64], with a real space cutoff of 11 Å. For the solution simulations, 36 wavevectors were used in each direction, for the surface simulations there were 40 wavevectors in the x and y directions and 52 in the z-direction. Short-range van der Waals interactions were cut-off at 11 Å. The simulation timestep was 2 fs, with bonds involving hydrogen atoms constrained using the LINCS [65] and water molecule geometries constrained using the SETTLE algorithms. All simulations were run for 500 ns, with (unless otherwise stated) averages calculated over the final 100 ns. This time was sufficient for the distribution of oligomer sizes to become approximately constant (Figure A1).
The simulations were performed using the Gromacs MD package (version 2018.4) [66,67], with analysis of the simulations performed using standard gromacs utilities and in-house python scripts written using the MDAnalysis library [68]. Simulation snapshots were generated using Visual Molecular Dynamics (VMD) [69]. Peptide oligomerization was monitored using a cluster analysis; two peptides were considered to be part of the same cluster if the distance between two heavy (non-hydrogen) atoms was less than 4 Å. This condition was also used for the calculation of the residue-reside contact maps. The similarity of the peptide structures to reference structures was monitored through the distance (), calculated according to
3. Results
3.1. Oligomerization of A(16–22) on Au111 Surfaces and in Solution
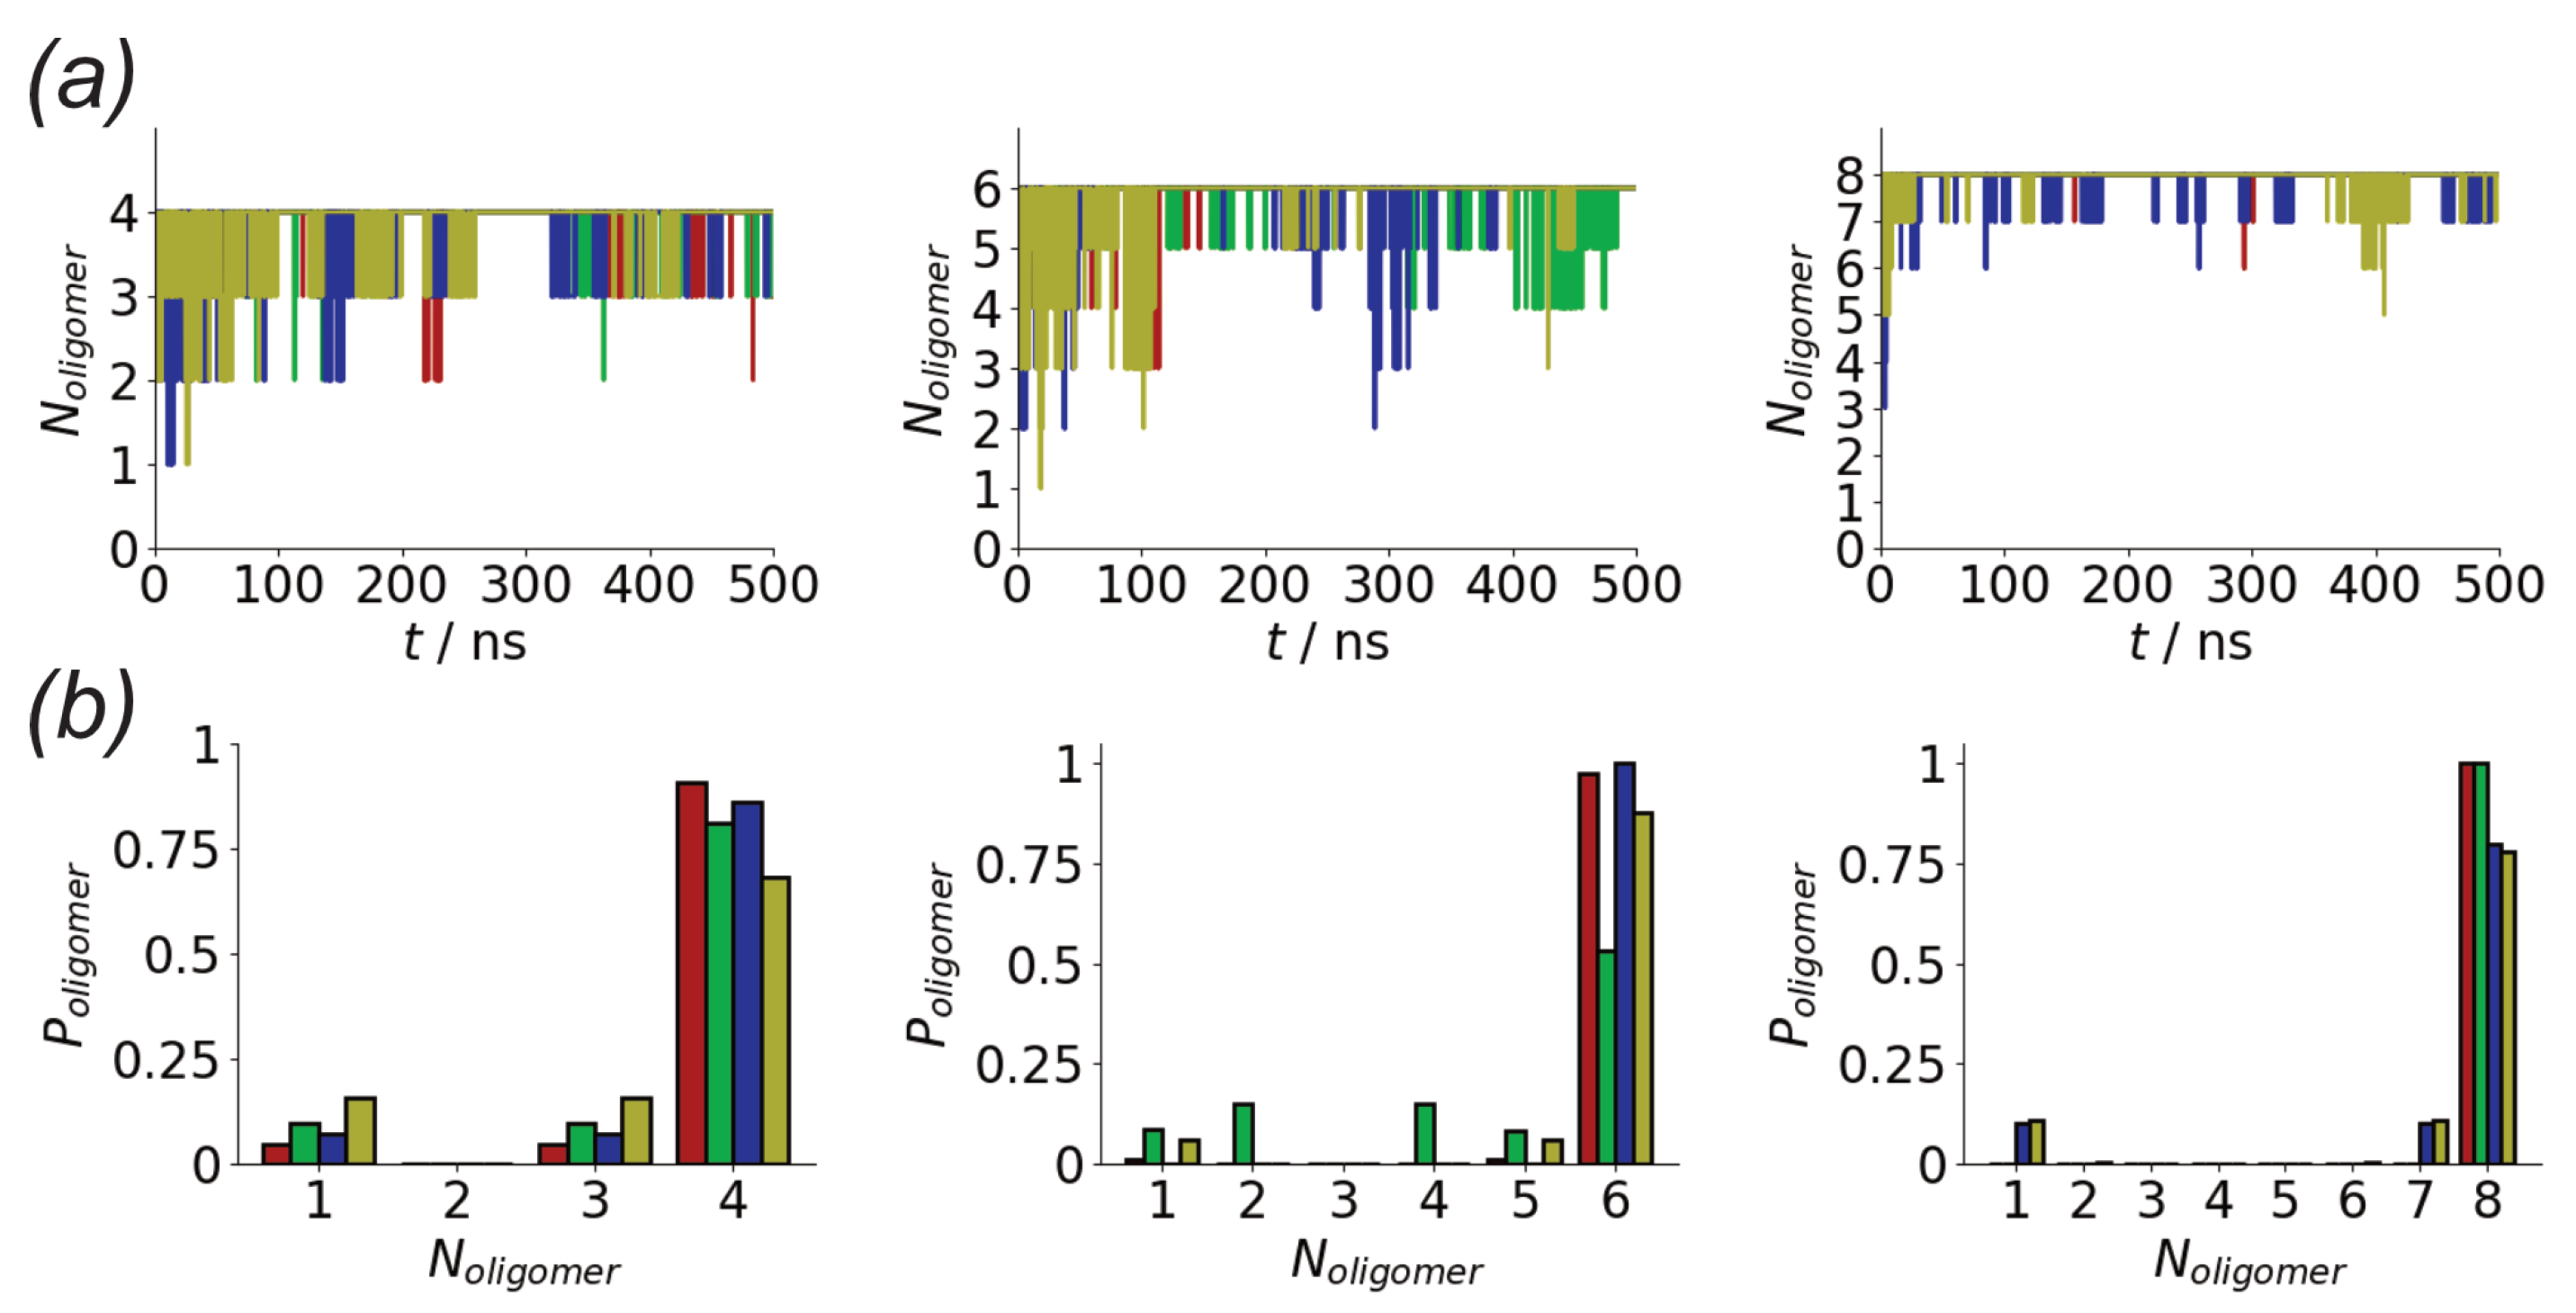
In both the surface and solution simulations rapid aggregation is seen for the different systems (Figure 2a). This is unsurprising due to the high concentration of molecules in the simulation. Across the different simulations aggregation within 50 ns is seen. The aggregation is more rapid for the Nmol = 8 system for both surface and solution simulations, consistent with decreased lag time seen for higher protein concentrations [71]. However, as the concentration in all systems is significantly higher than in experimental systems no quantitative conclusions will be drawn from this. While some variation is seen, this typically contains all the peptides, indicating relatively strong binding of the peptides. As the number of peptides in the system increases, the fluctuations in the size of the largest oligomer tend to decrease, suggesting stronger binding of molecules into these larger aggregates.
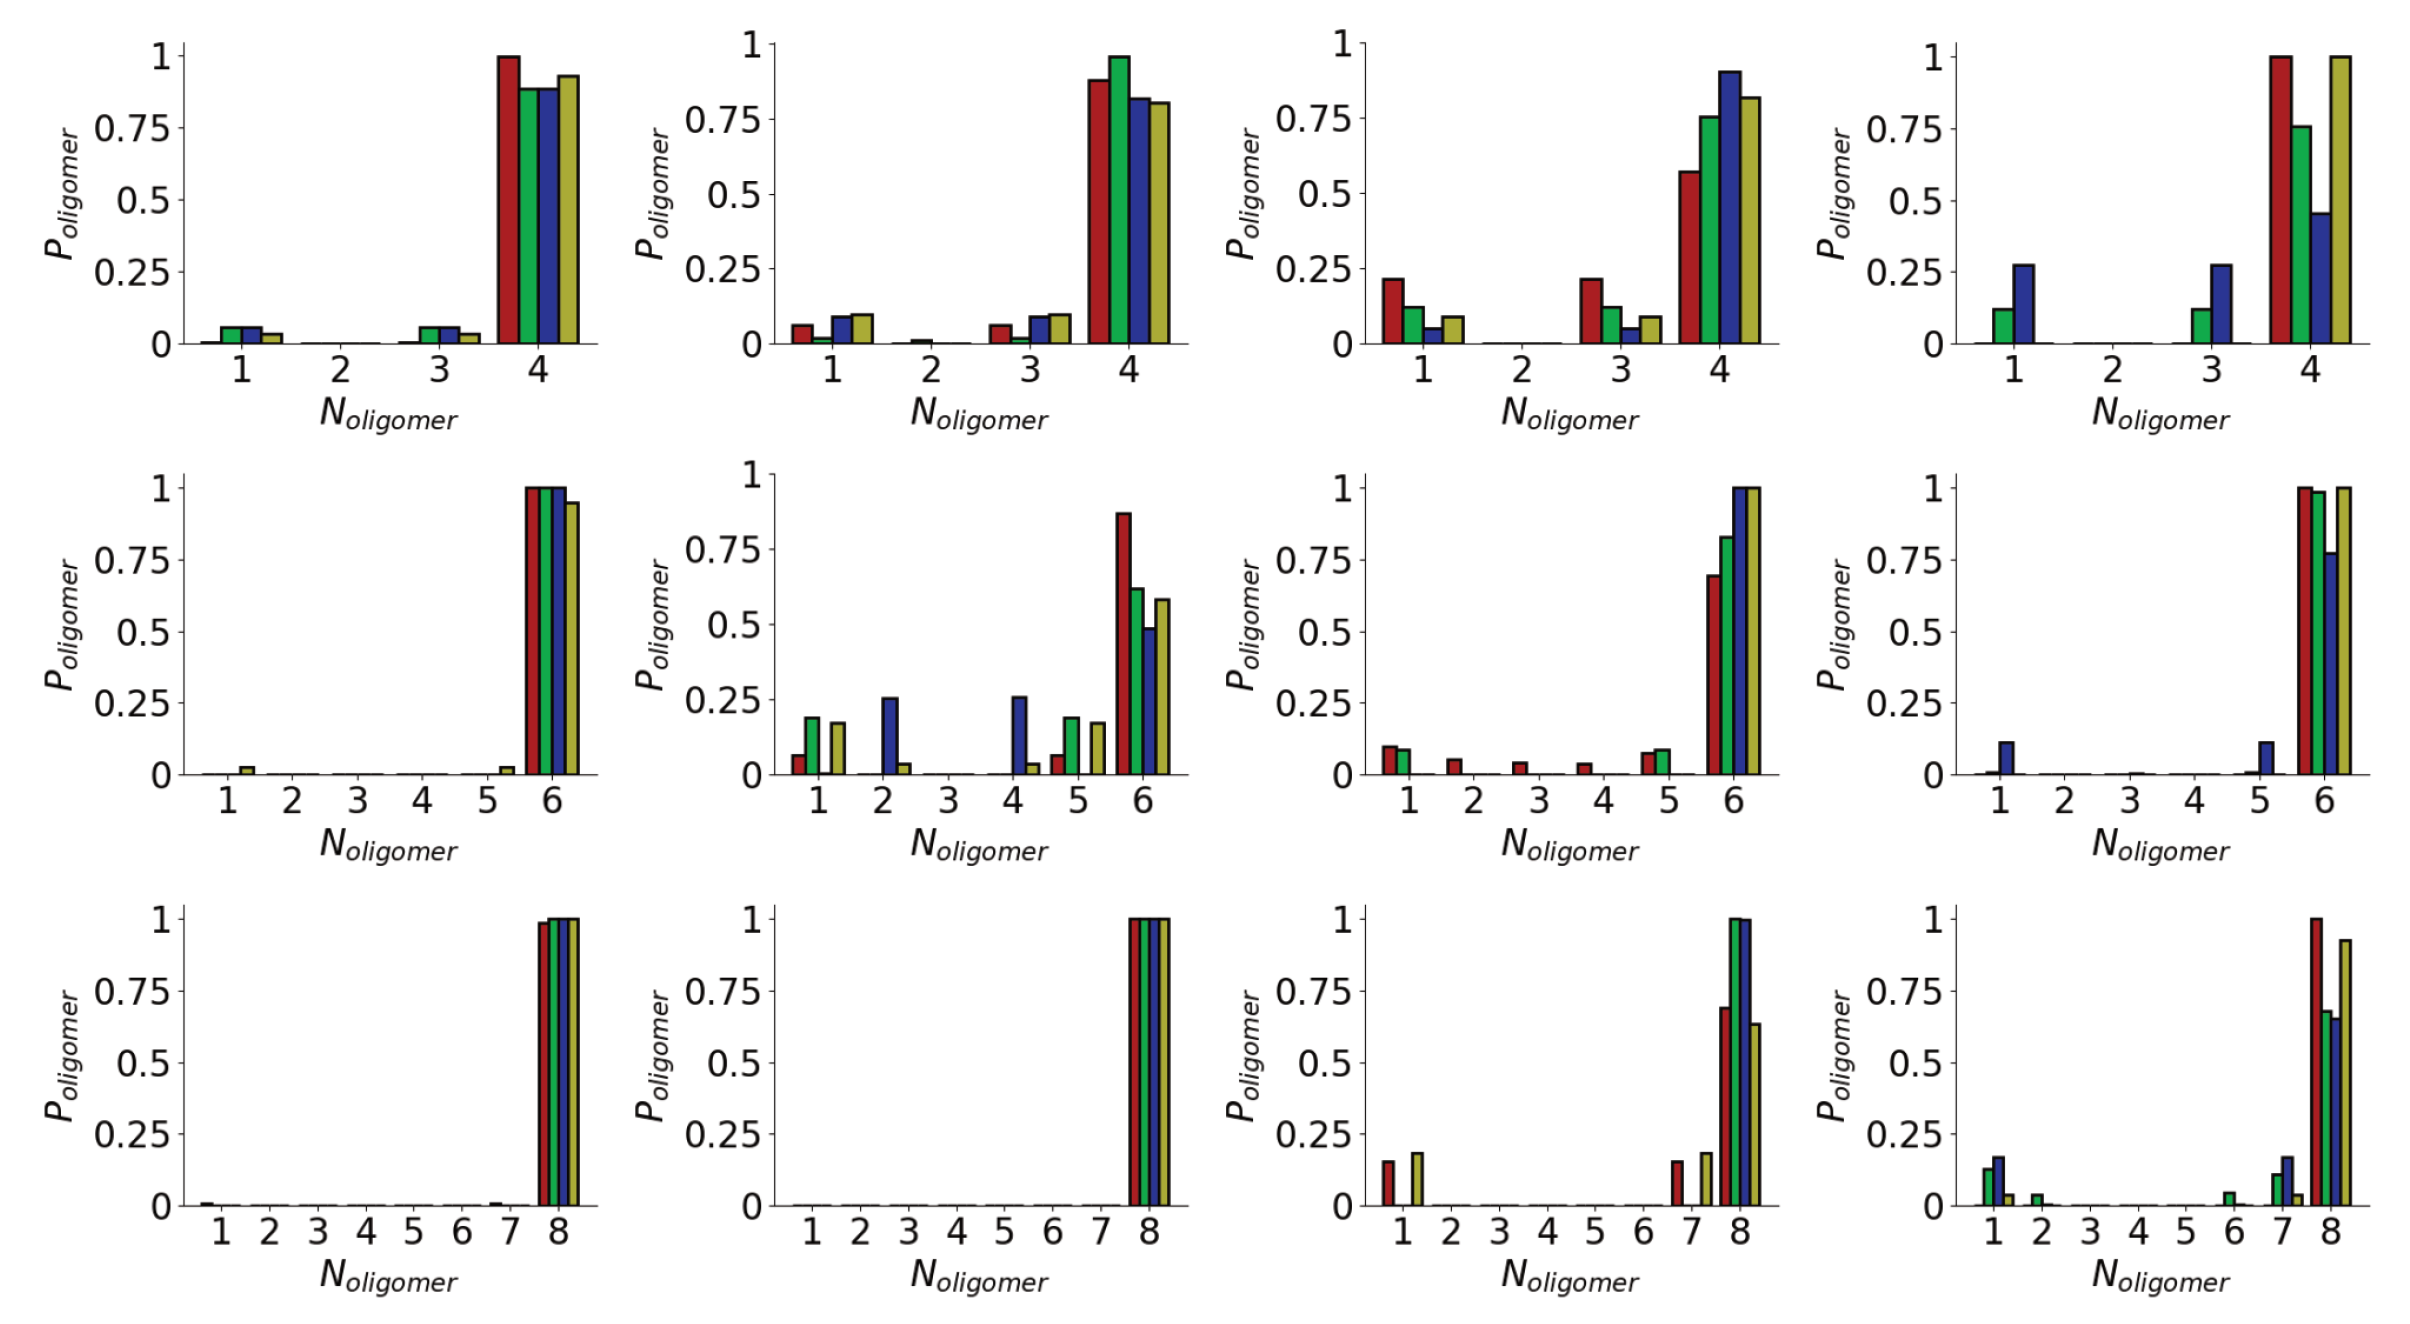
The differences in stability of the different aggregates can be seen by considering the probability of different oligomer sizes seen in the simulations (Figure 2b). As suggested by the time variation of oligomer size, the probability of finding all the peptides in a single aggregate typically increases with the total number of peptides. For the surface simulations, the larger aggregates are generally more likely than in solution, suggesting stronger aggregation on surfaces. Indeed for the eight peptide simulations, only a single oligomer containing all the peptides is seen for the surface simulations. Variations between different simulation runs for the same number of peptides are seen; notably for six peptides one of the surface simulations has a much lower probability of forming larger oligomers.
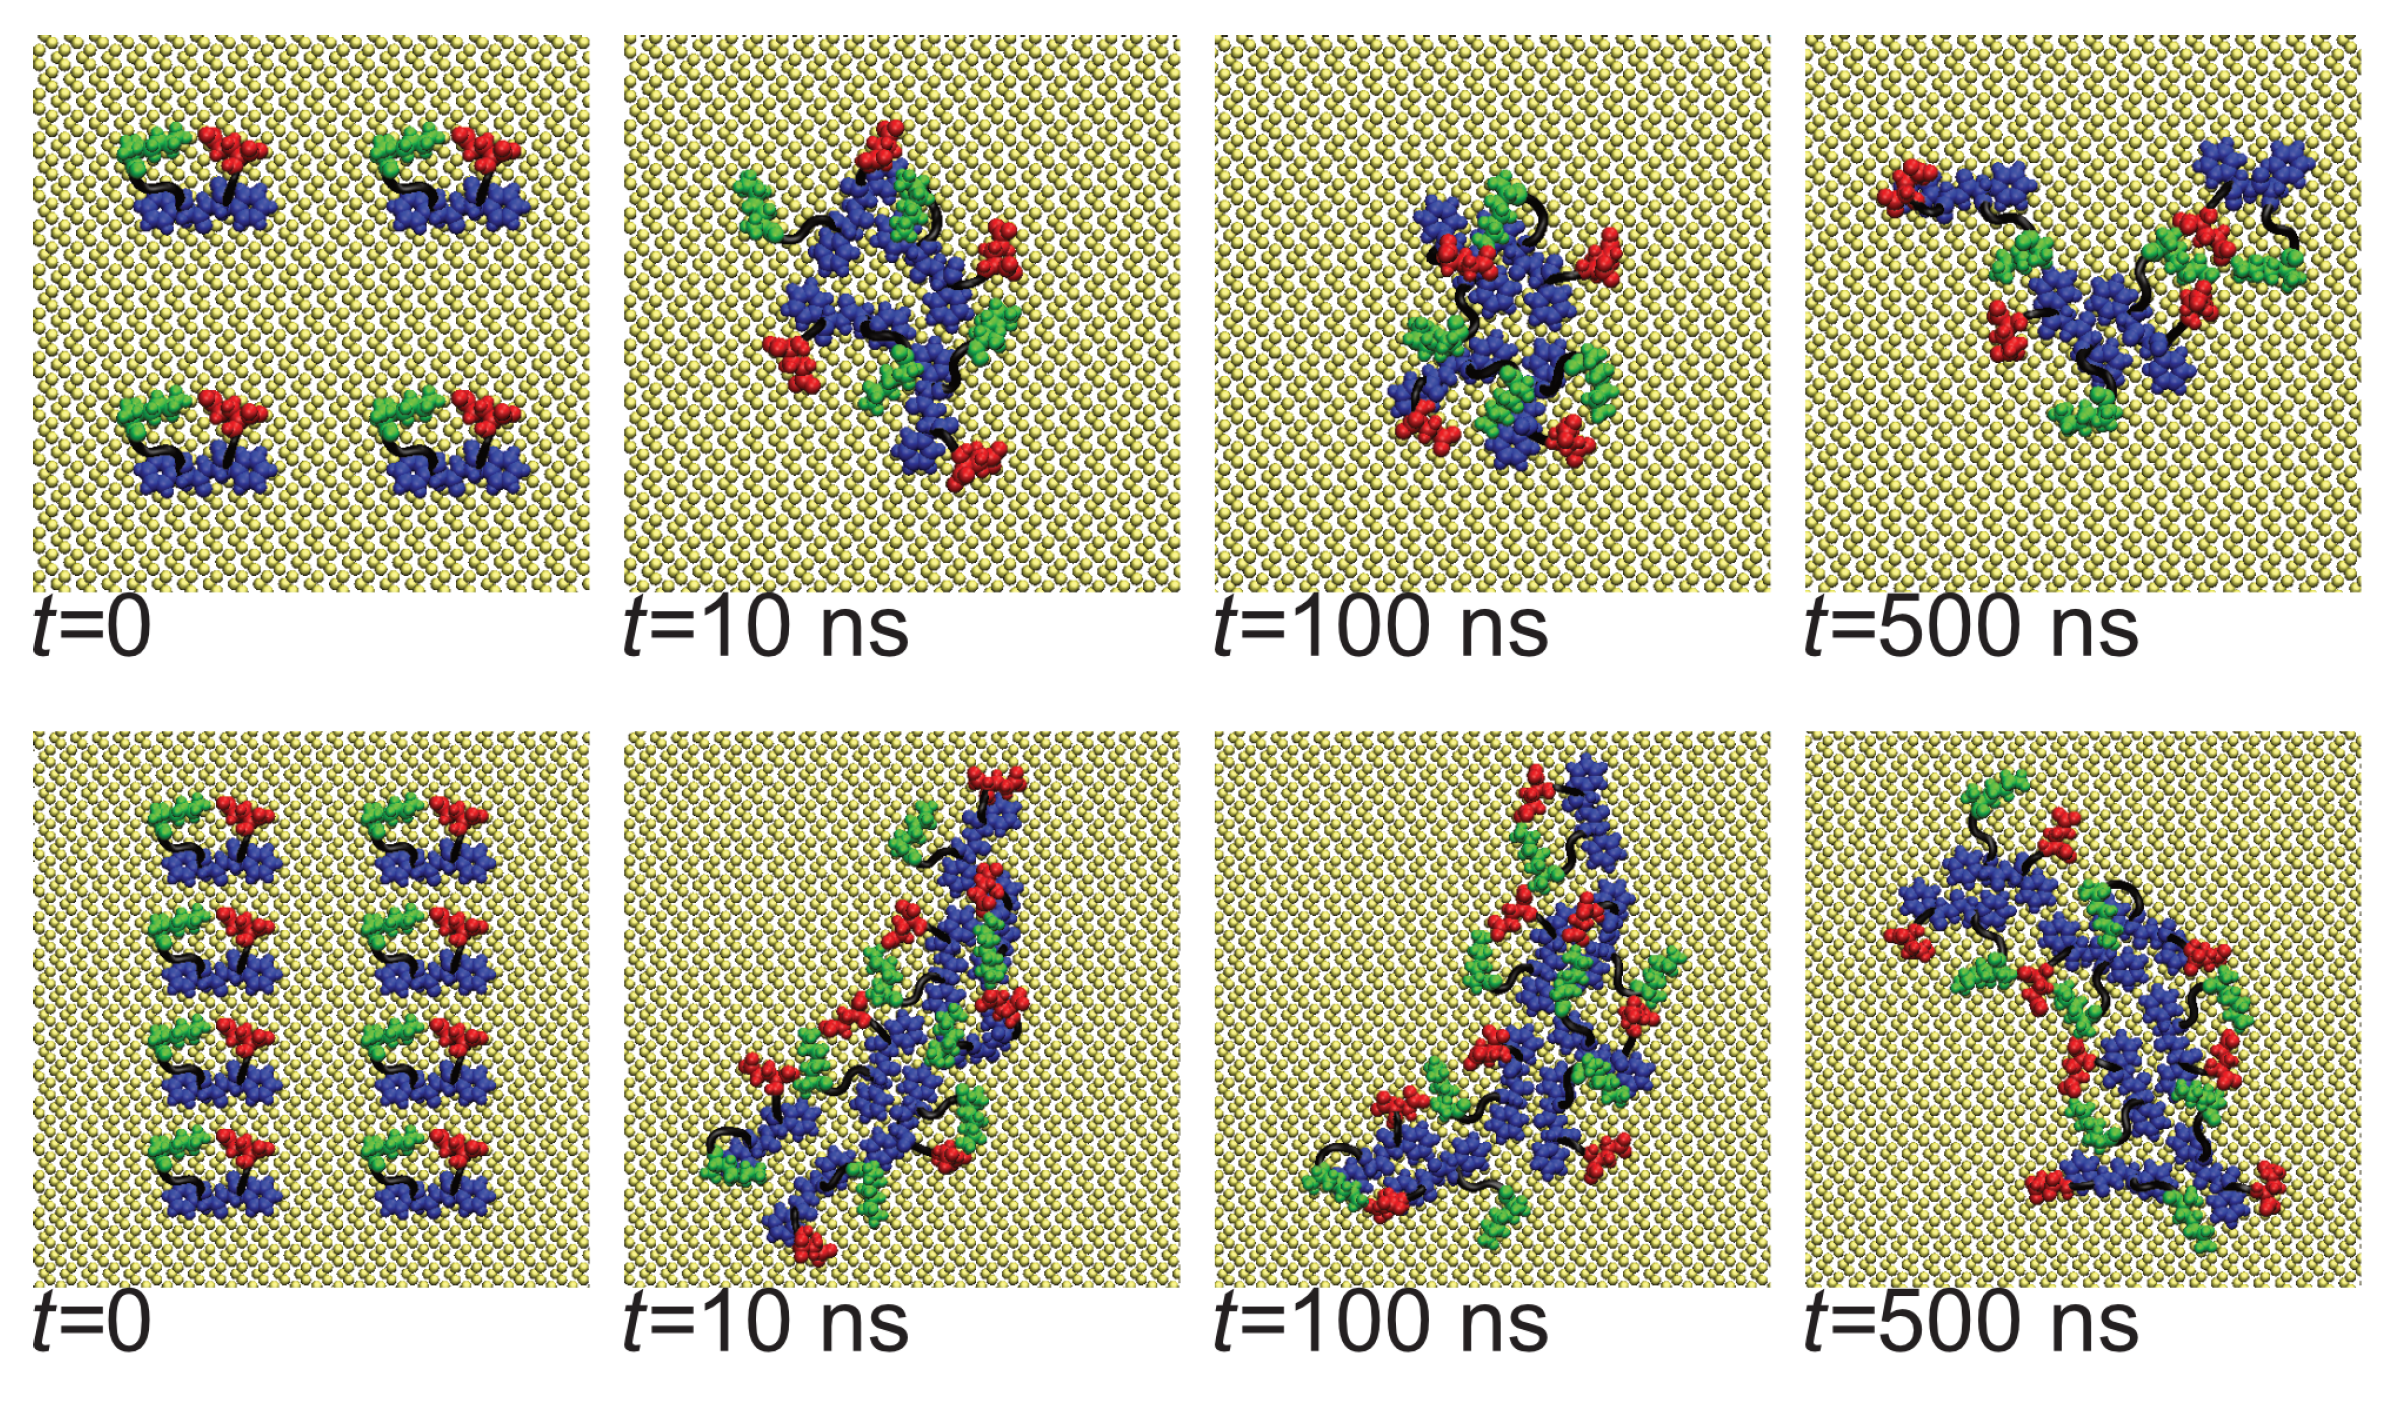
The rapid oligomerization can be seen visually through simulation snapshots. Shown in Figure 3 are representative snapshots showing the evolution of the oligomers across the first Nmol = 4 and Nmol = 8 simulations for the Au111 surface. While at the beginning of the simulation, these are placed on a regular grid and not in contact with each other, within the first 10 ns these have typically aggregated into a single oligomer. For Nmol = 4, this is relatively weakly bound and goes through a number of structural arrangements across the simulation. The structure of the larger Nmol = 8 aggregate remains more stable throughout the simulation, consistent with the oligomer size histogram (Figure 2b). Note that for Nmol = 8 the aggregate stretches across the entire simulation box.
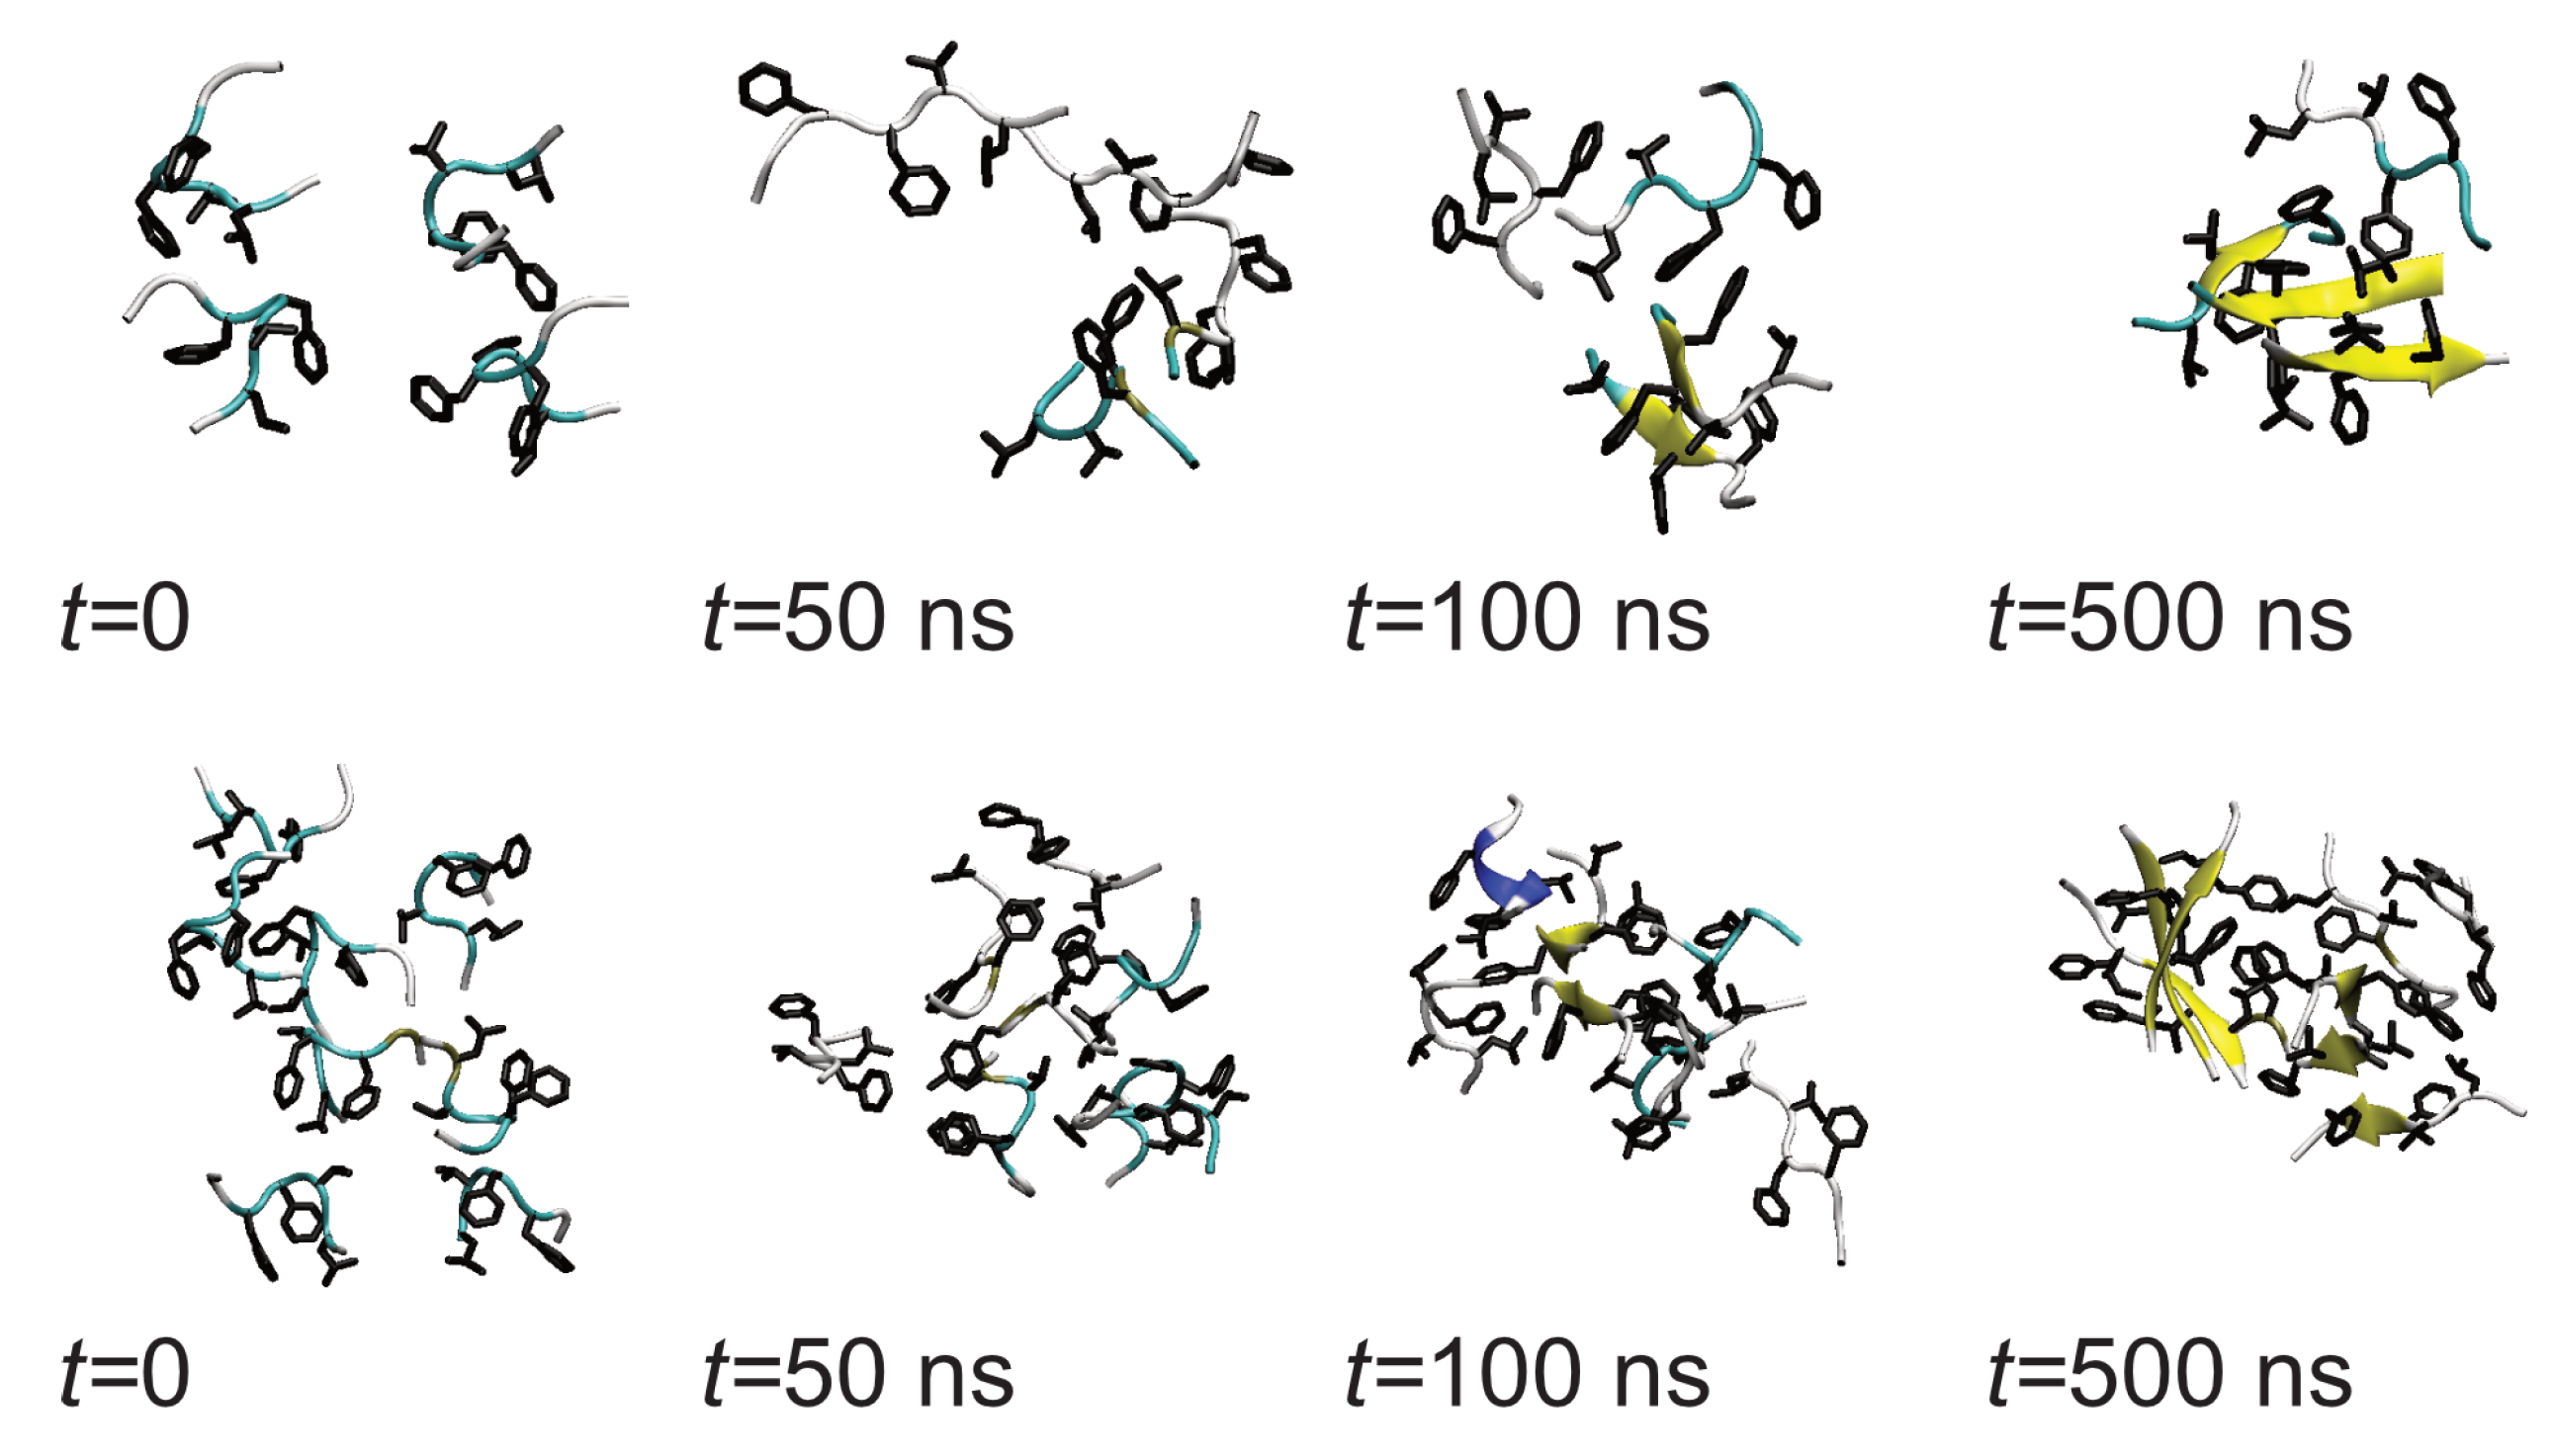
In the bulk solution, the initial aggregation is somewhat slower and the initial oligomers are less strongly bound than on the Au111 surface. After about 50 ns disordered amorphous oligomers are formed (Figure 4). Across the simulations, they restructure into more compact and ordered oligomers, with peptides adopting beta-strand-rich structures. This two-step process of fibril formation has been observed in previous studies of aggregation of amyloidogenic peptides.
3.2. Surfaces Drive Formation of Linear Aggregates
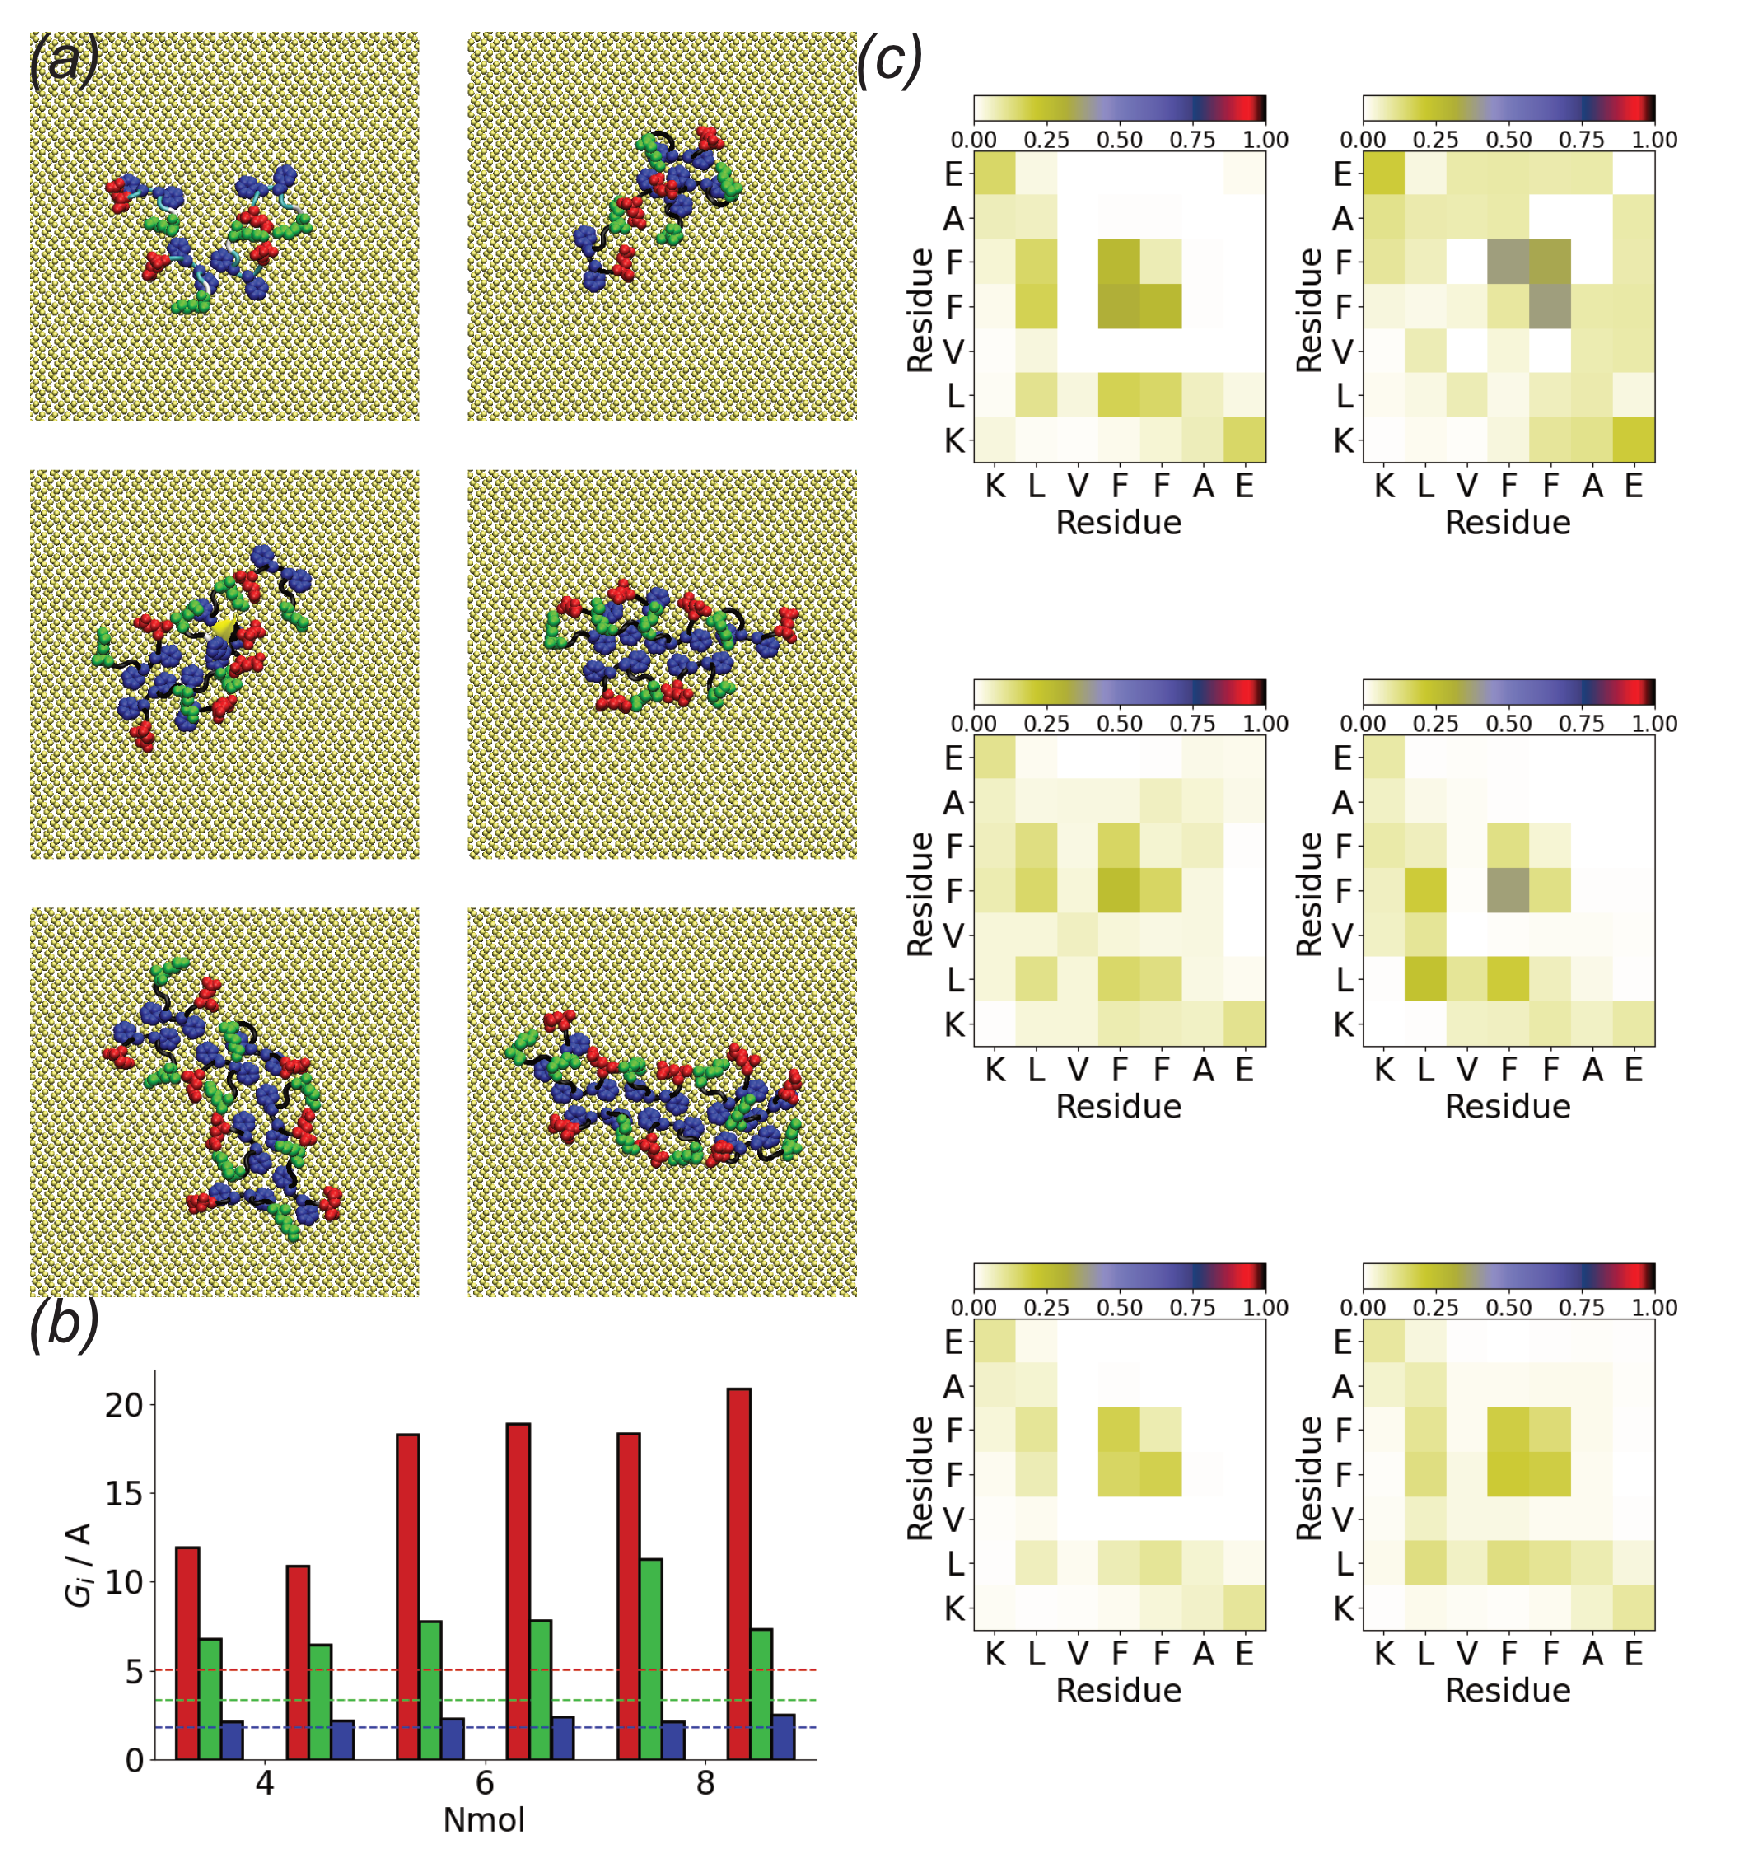
The tendency towards roughly linear structures on the Au111 surface, particularly for larger Nmol, is seen for all the simulations (Figure 5). As seen in previous simulations the phenylalanine residues lie flat against the gold surface [34,40]. These are typically at the centre of the oligomer, leading to many contacts between these. Typically the charged, terminal residues (lysine and glutamic acid) are found on the outside of the aggregates.
The tendency towards the formation of linear, monolayer structures can be quantified through the eigenvalues of the oligomer gyration tensor (Figure 5b). is approximately the same for all the simulations and is comparable to that of an individual peptide molecule. This suggests that the strong adsorption of A(16–22) onto the Au111 surface leads to monolayer formation. Similar to , is also typically similar for different Nmol. This is comparable to twice that of a single molecule, consistent with the formation of linear structures two molecules wide. An exception to this is found in the first Nmol = 8 simulation, where zig-zag structures are formed. The largest eigenvalue increases with Nmol consistent with the typically linear structures formed.
The structures formed on the Au111 surface are associated with specific interactions between residues, as shown by the intermolecular residue–residue contact maps (Figure 5c). In all cases, contacts are predominately formed by the two phenylalanine residues. In particular, for larger Nmol these form the centre of the linear structures. Contacts between the two charged terminal residues (lysine and glutamic acid) are also found.
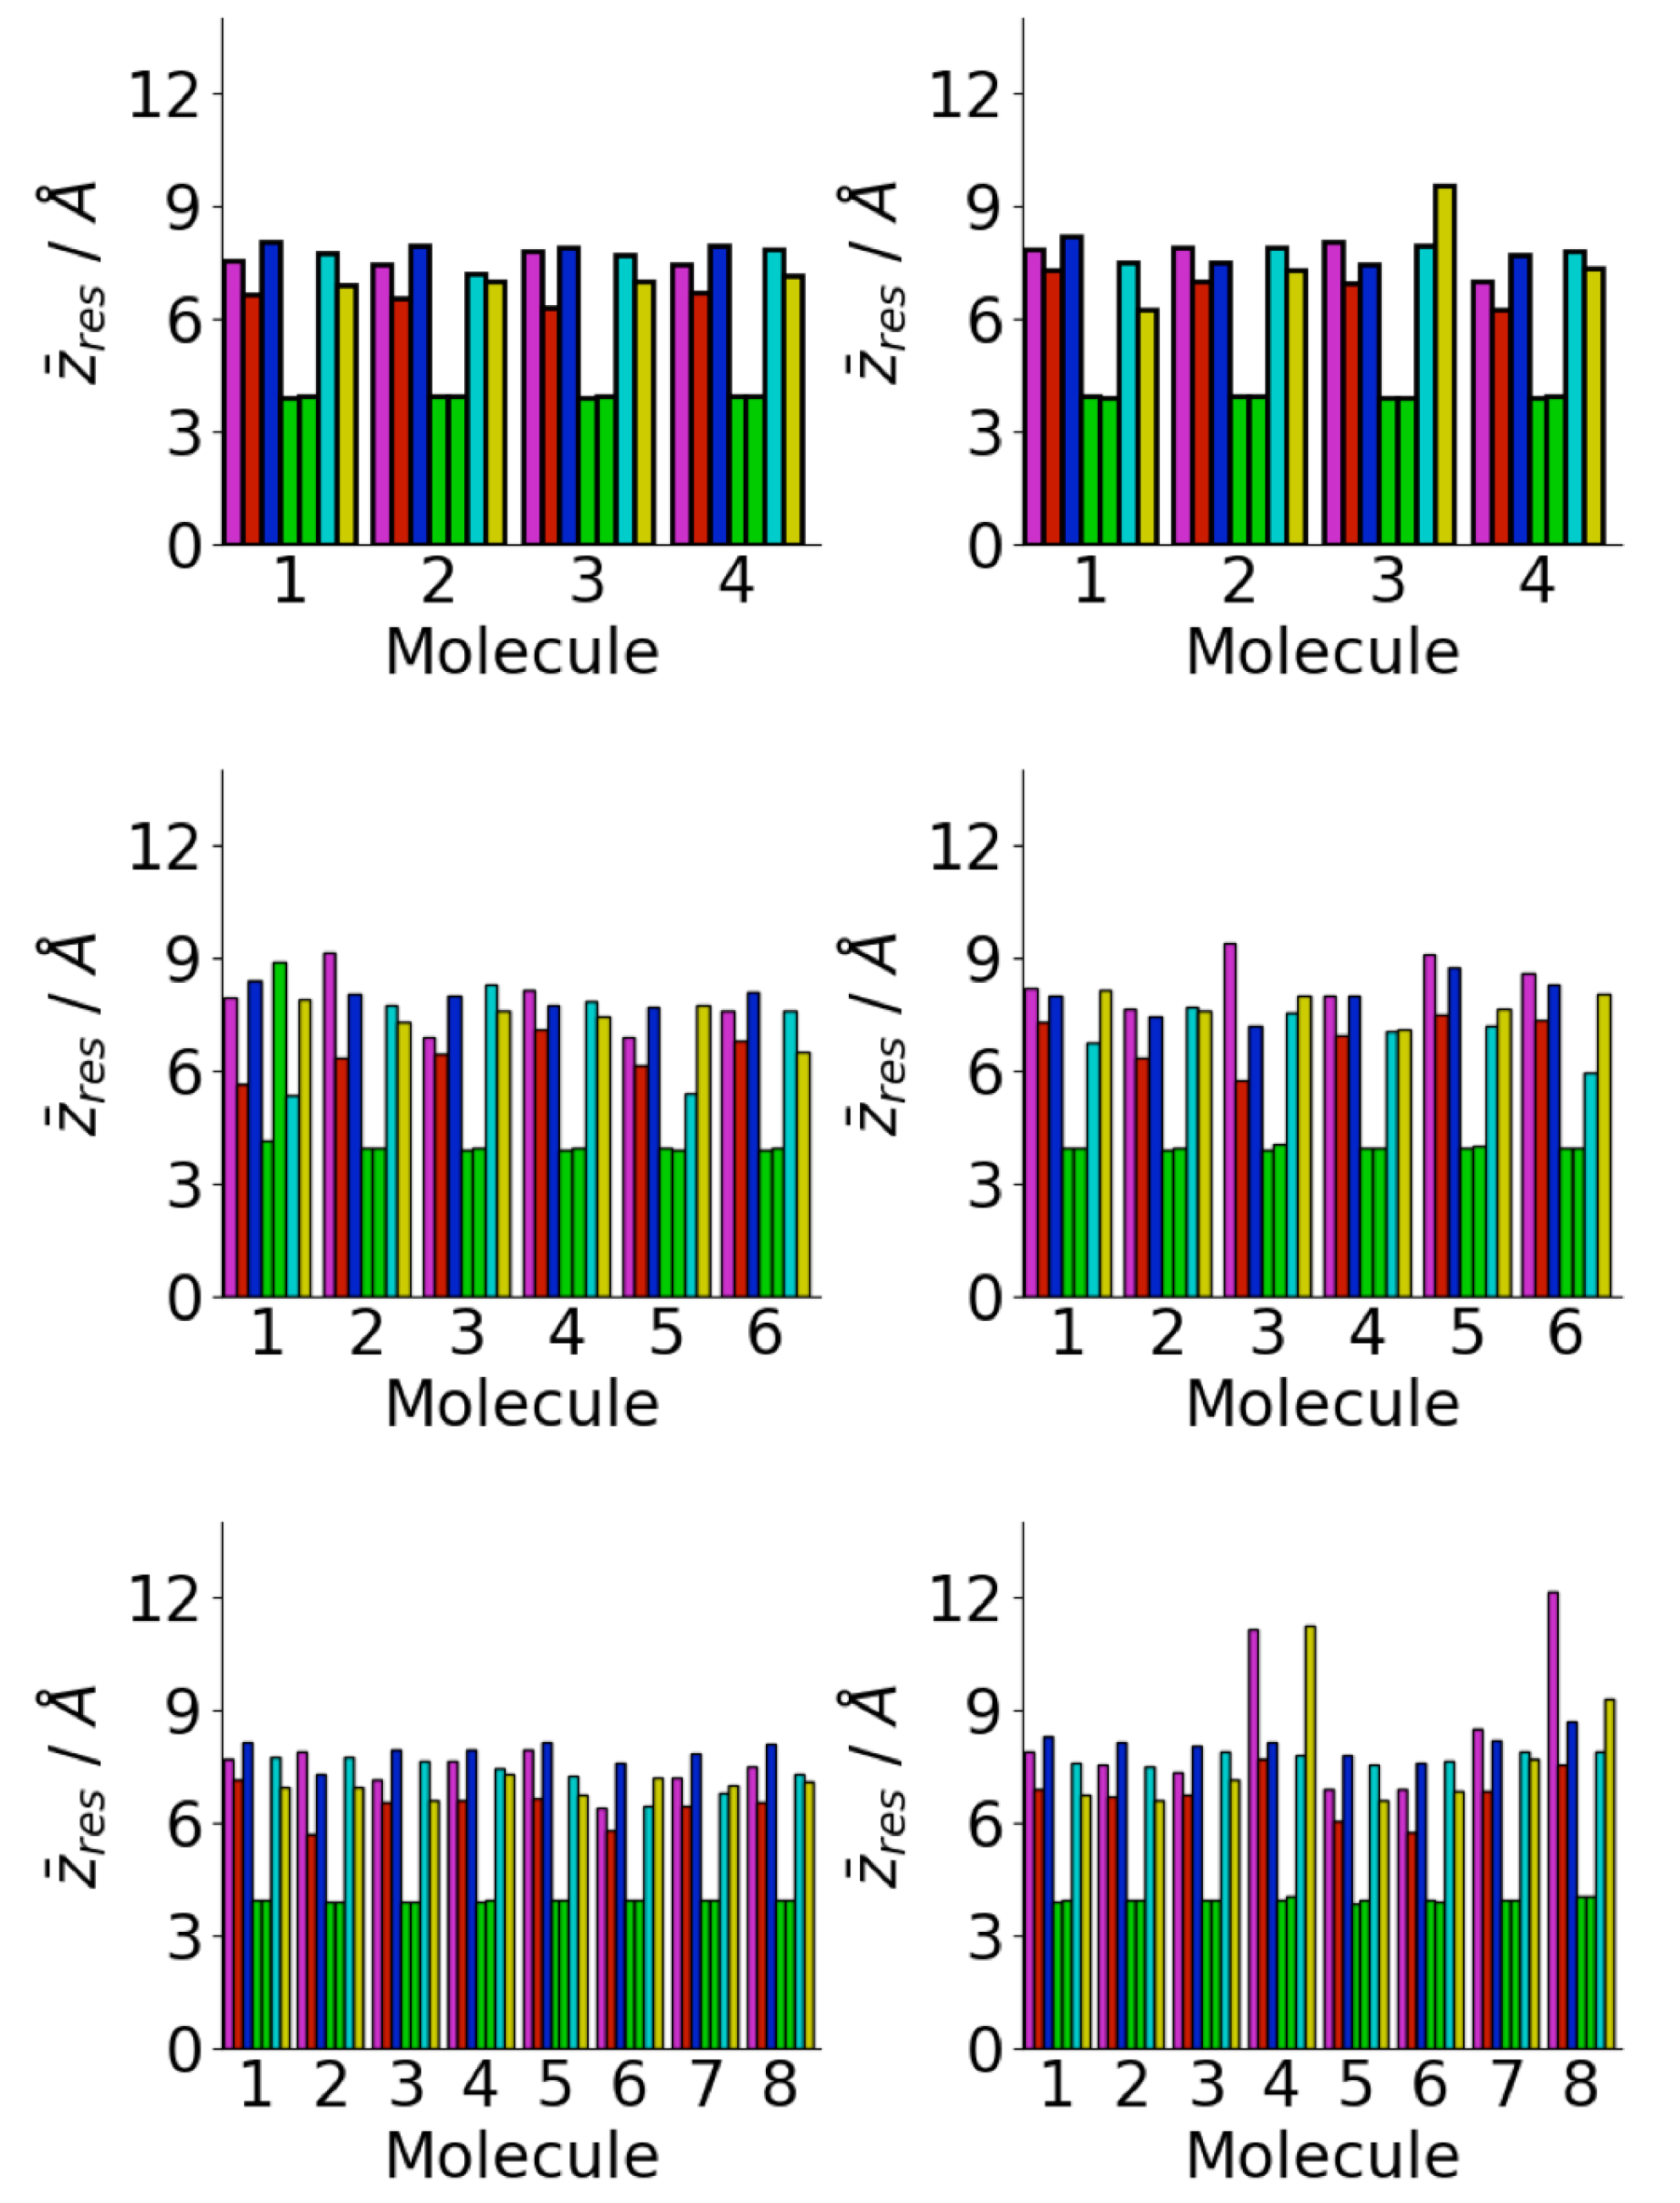
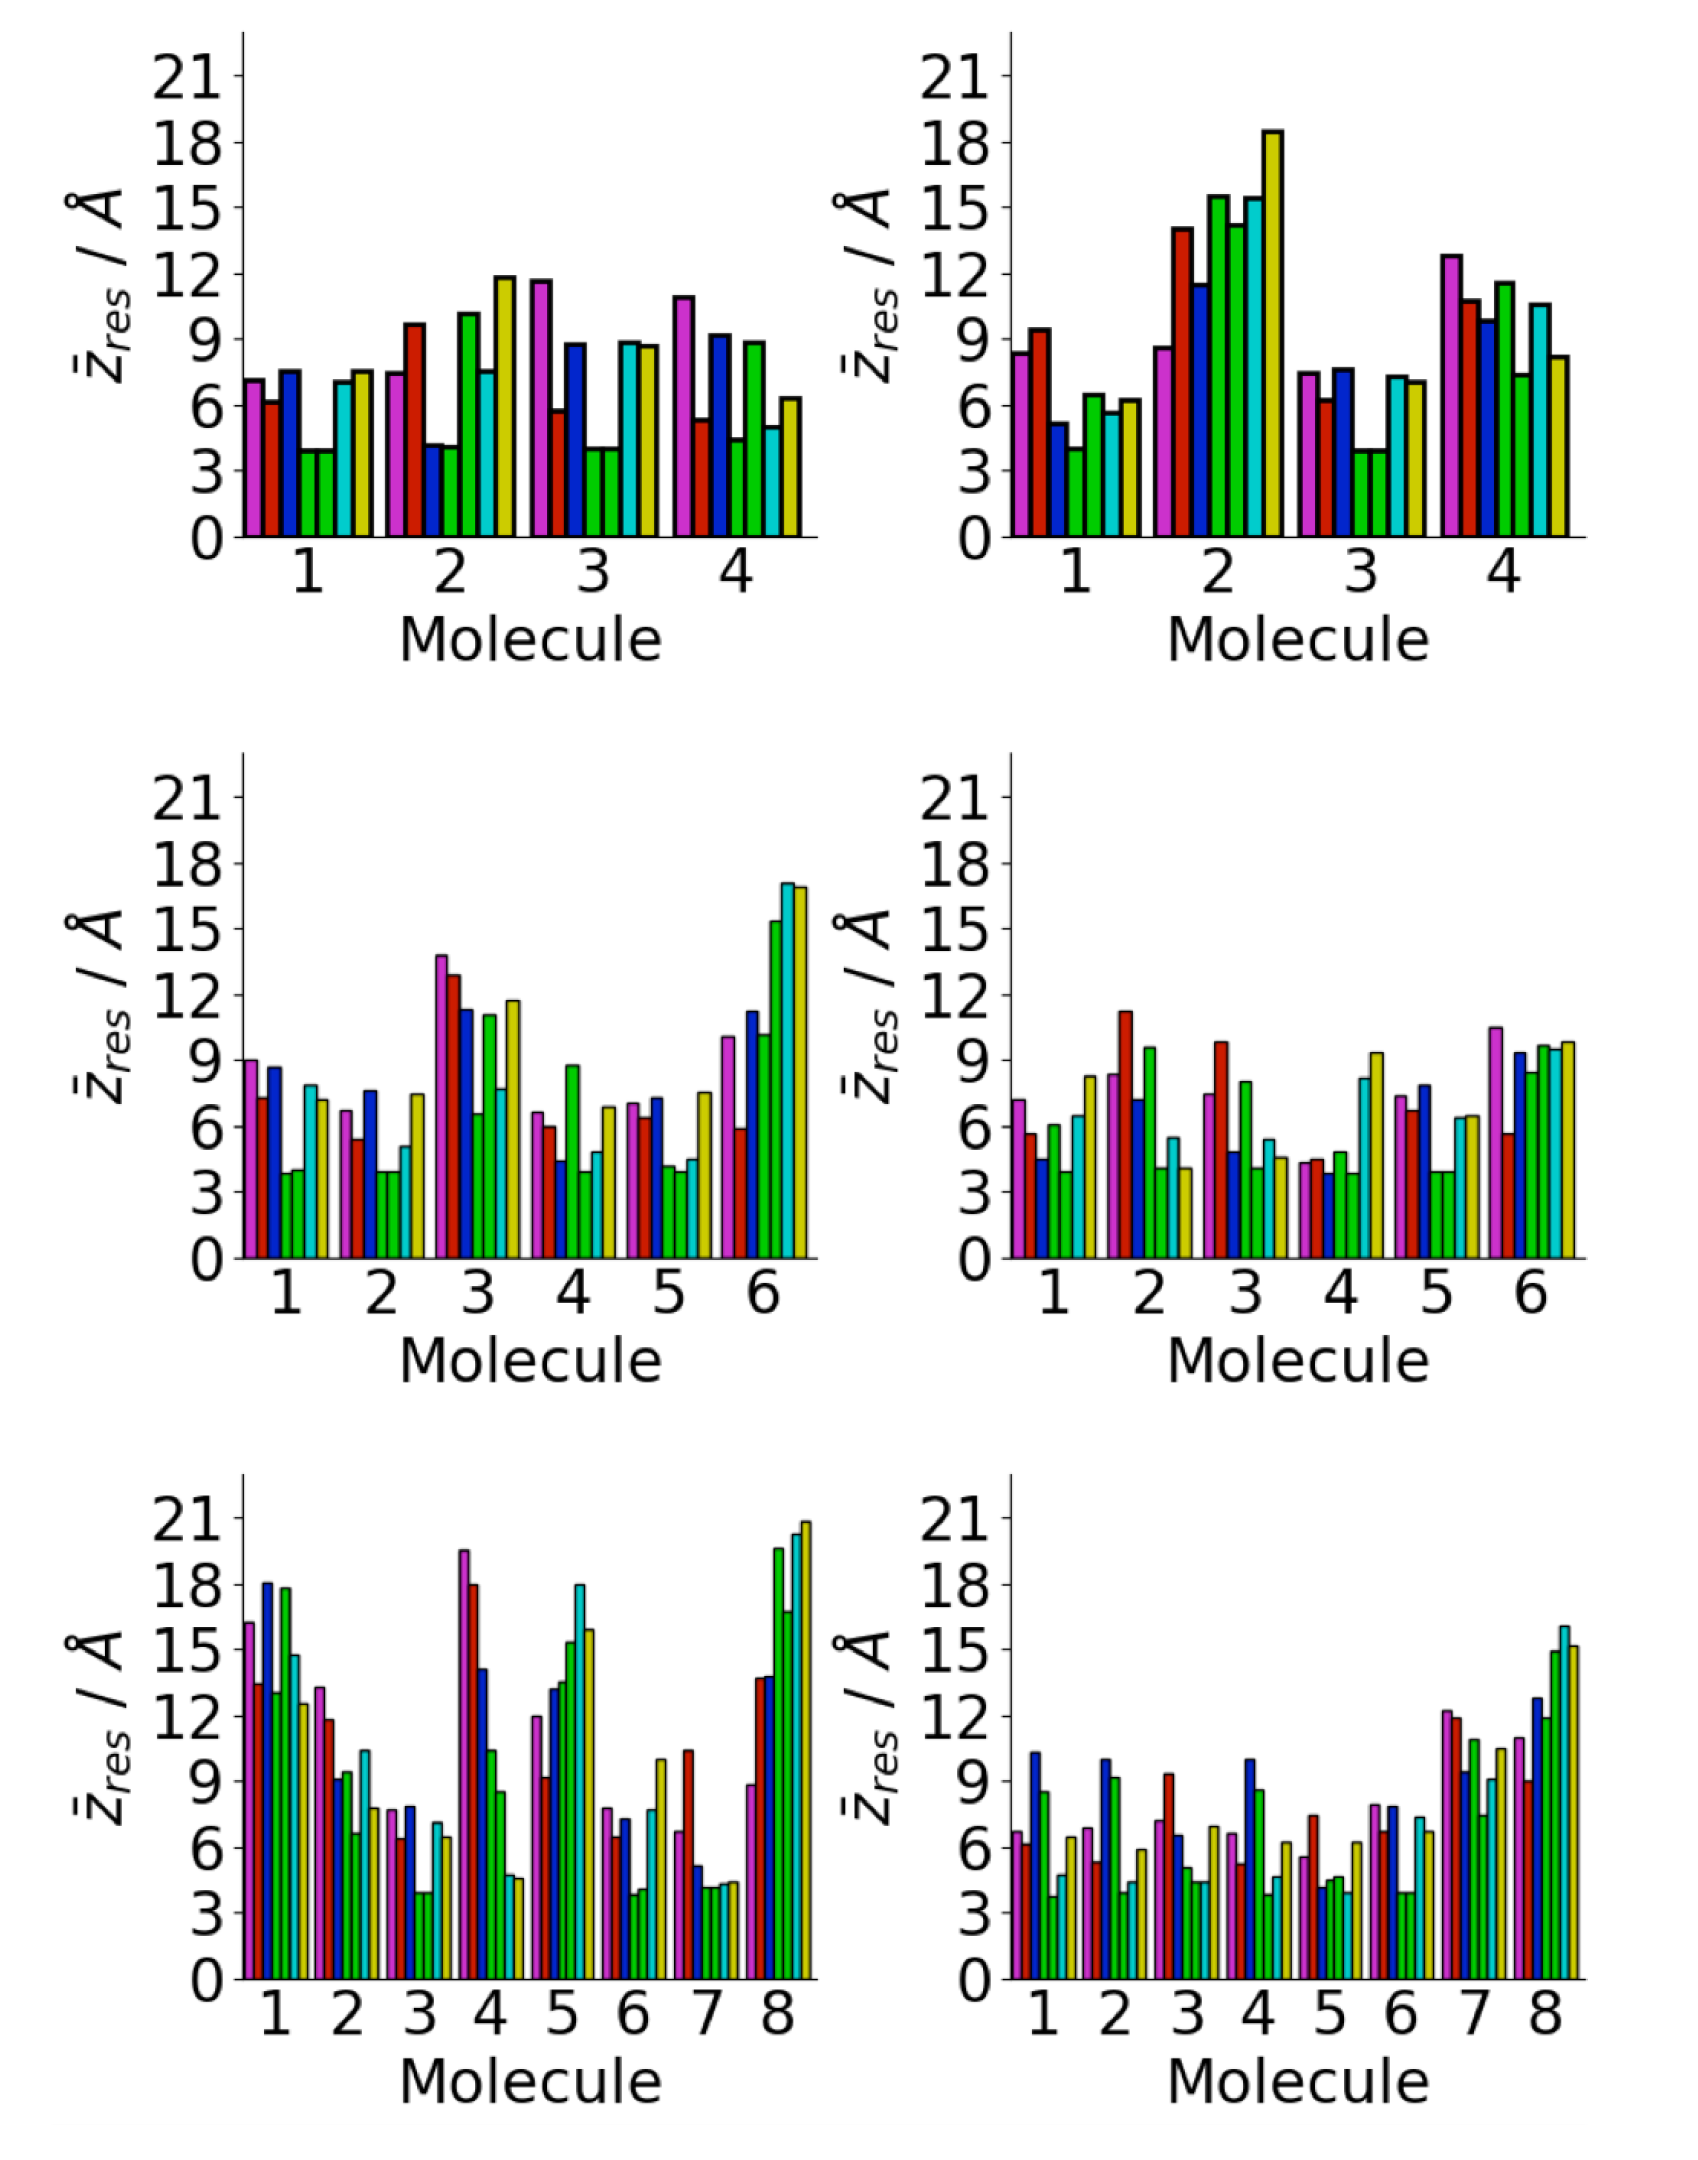
A major driving force for the oligomer structure on the gold surface is the strong adhesion of the phenylalanine residues to the gold surface [72,73]. This can be seen in the average residue center-of-mass z coordinates (Figure 6). In almost all cases, the two phenylalanine residues are in contact with the surface, consistent with the single molecule structure [34,40]. This increases the probability of contact between phenylalanine residues in different peptides. Across all the surface simulations, only one molecule is found without both phenylalanine residues in contact with the surface. The other residues are typically further from the surface, with the lysine and glutamic acid residues typically the furthest. This is consistent with the strong interaction between phenylalanine residues and the Au111 surface; previous calculations have found the adsorption-free energy of phenylalanine on Au111 kcal mol [72]. Other simulations have found strong attraction between gold surfaces and other aromatic residues such as tyrosine [35]. The interaction with the surface is weaker for the other residues and so these are typically found further from the surface. In particular, the lysine and glutamic acid residues are far from the surface, due to their highly hydrophilic nature, which increases their freedom to move and so increases the probability of contact between these (Figure 5c).
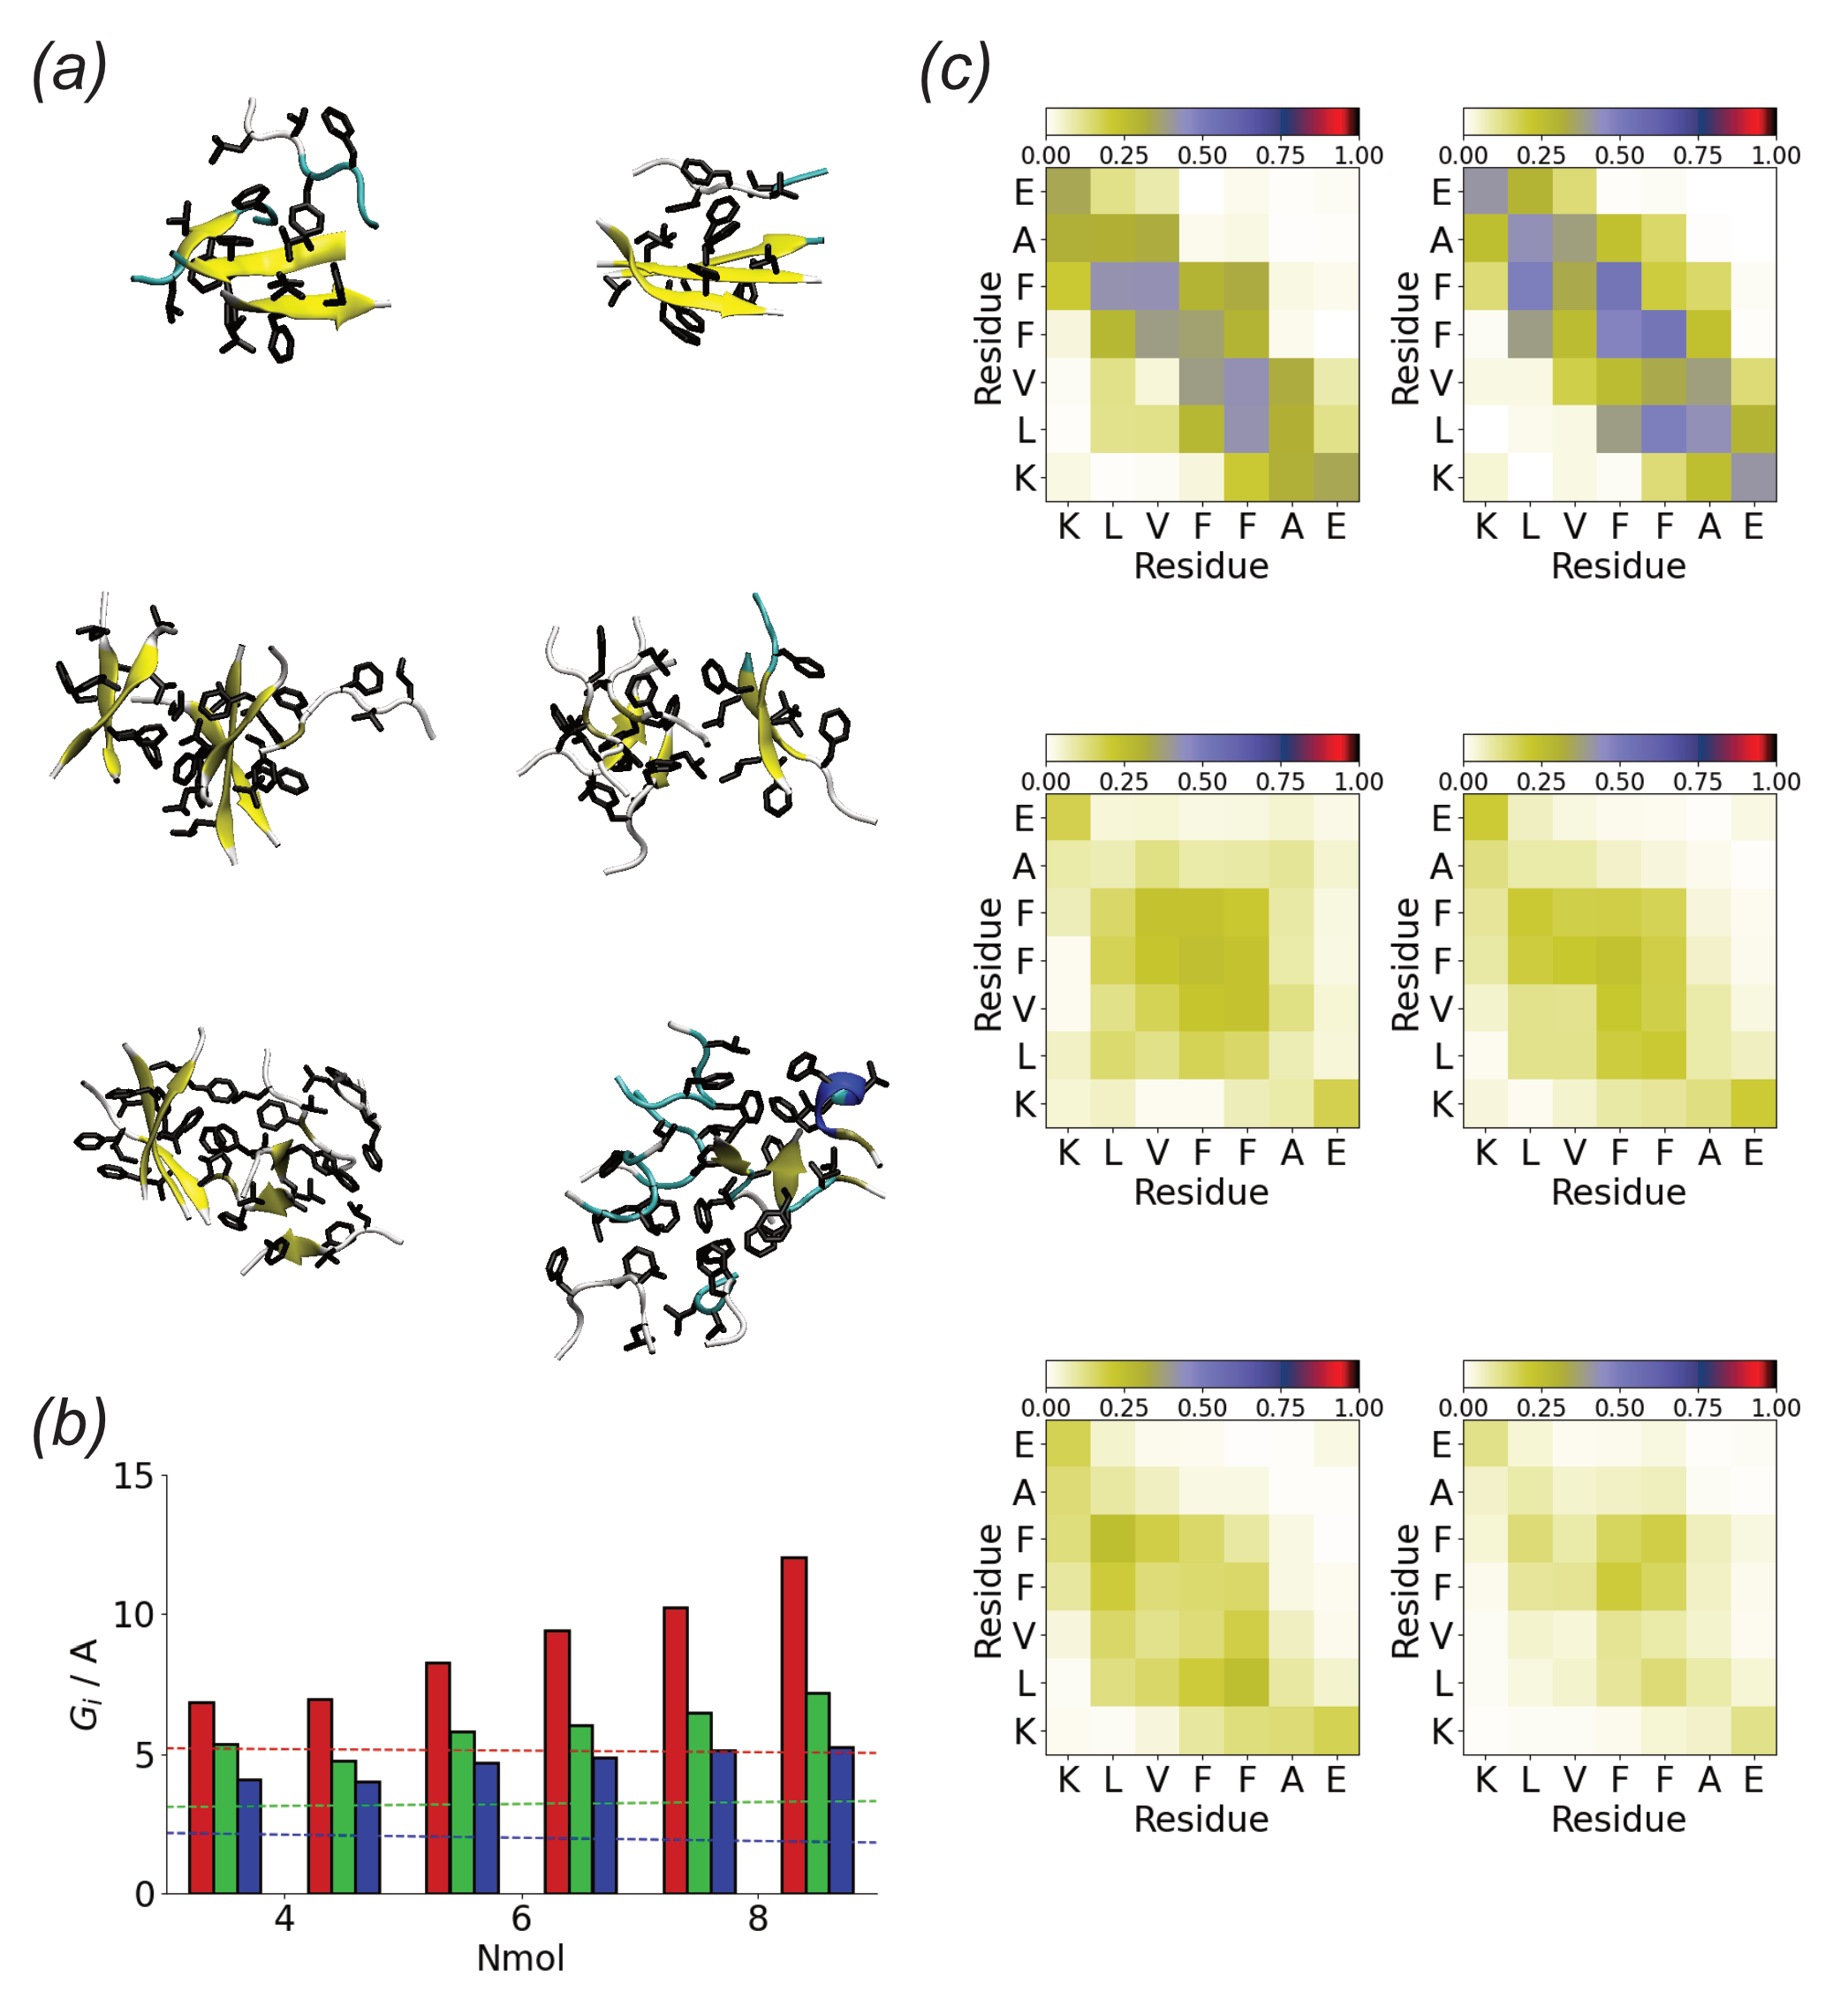
Compared to the Au111 surface in bulk solution A(16–22) forms compact aggregates (Figure 7a). In most cases, these are beta-strand-rich. The gyration tensor eigenvalues (Figure 7b) suggest these are typically elongated along one direction. The shorter two axes are comparable to the length of a single molecule, suggesting that the molecules lie normal to the long axis, similar to an amyloid fibril.
In comparison to the surface simulations, more contacts are found for peptide aggregates in solution (Figure 7c). These typically involve the hydrophobic core (LVFF) of the peptide, implying that this is driven primarily by the hydrophobic effect. The contact maps suggest that the peptides adopt anti-parallel alignment, consistent with the packing seen in fibrils formed by this peptide [70,74]. As for the surface simulations contacts between the termini due to the electrostatic attraction are found.
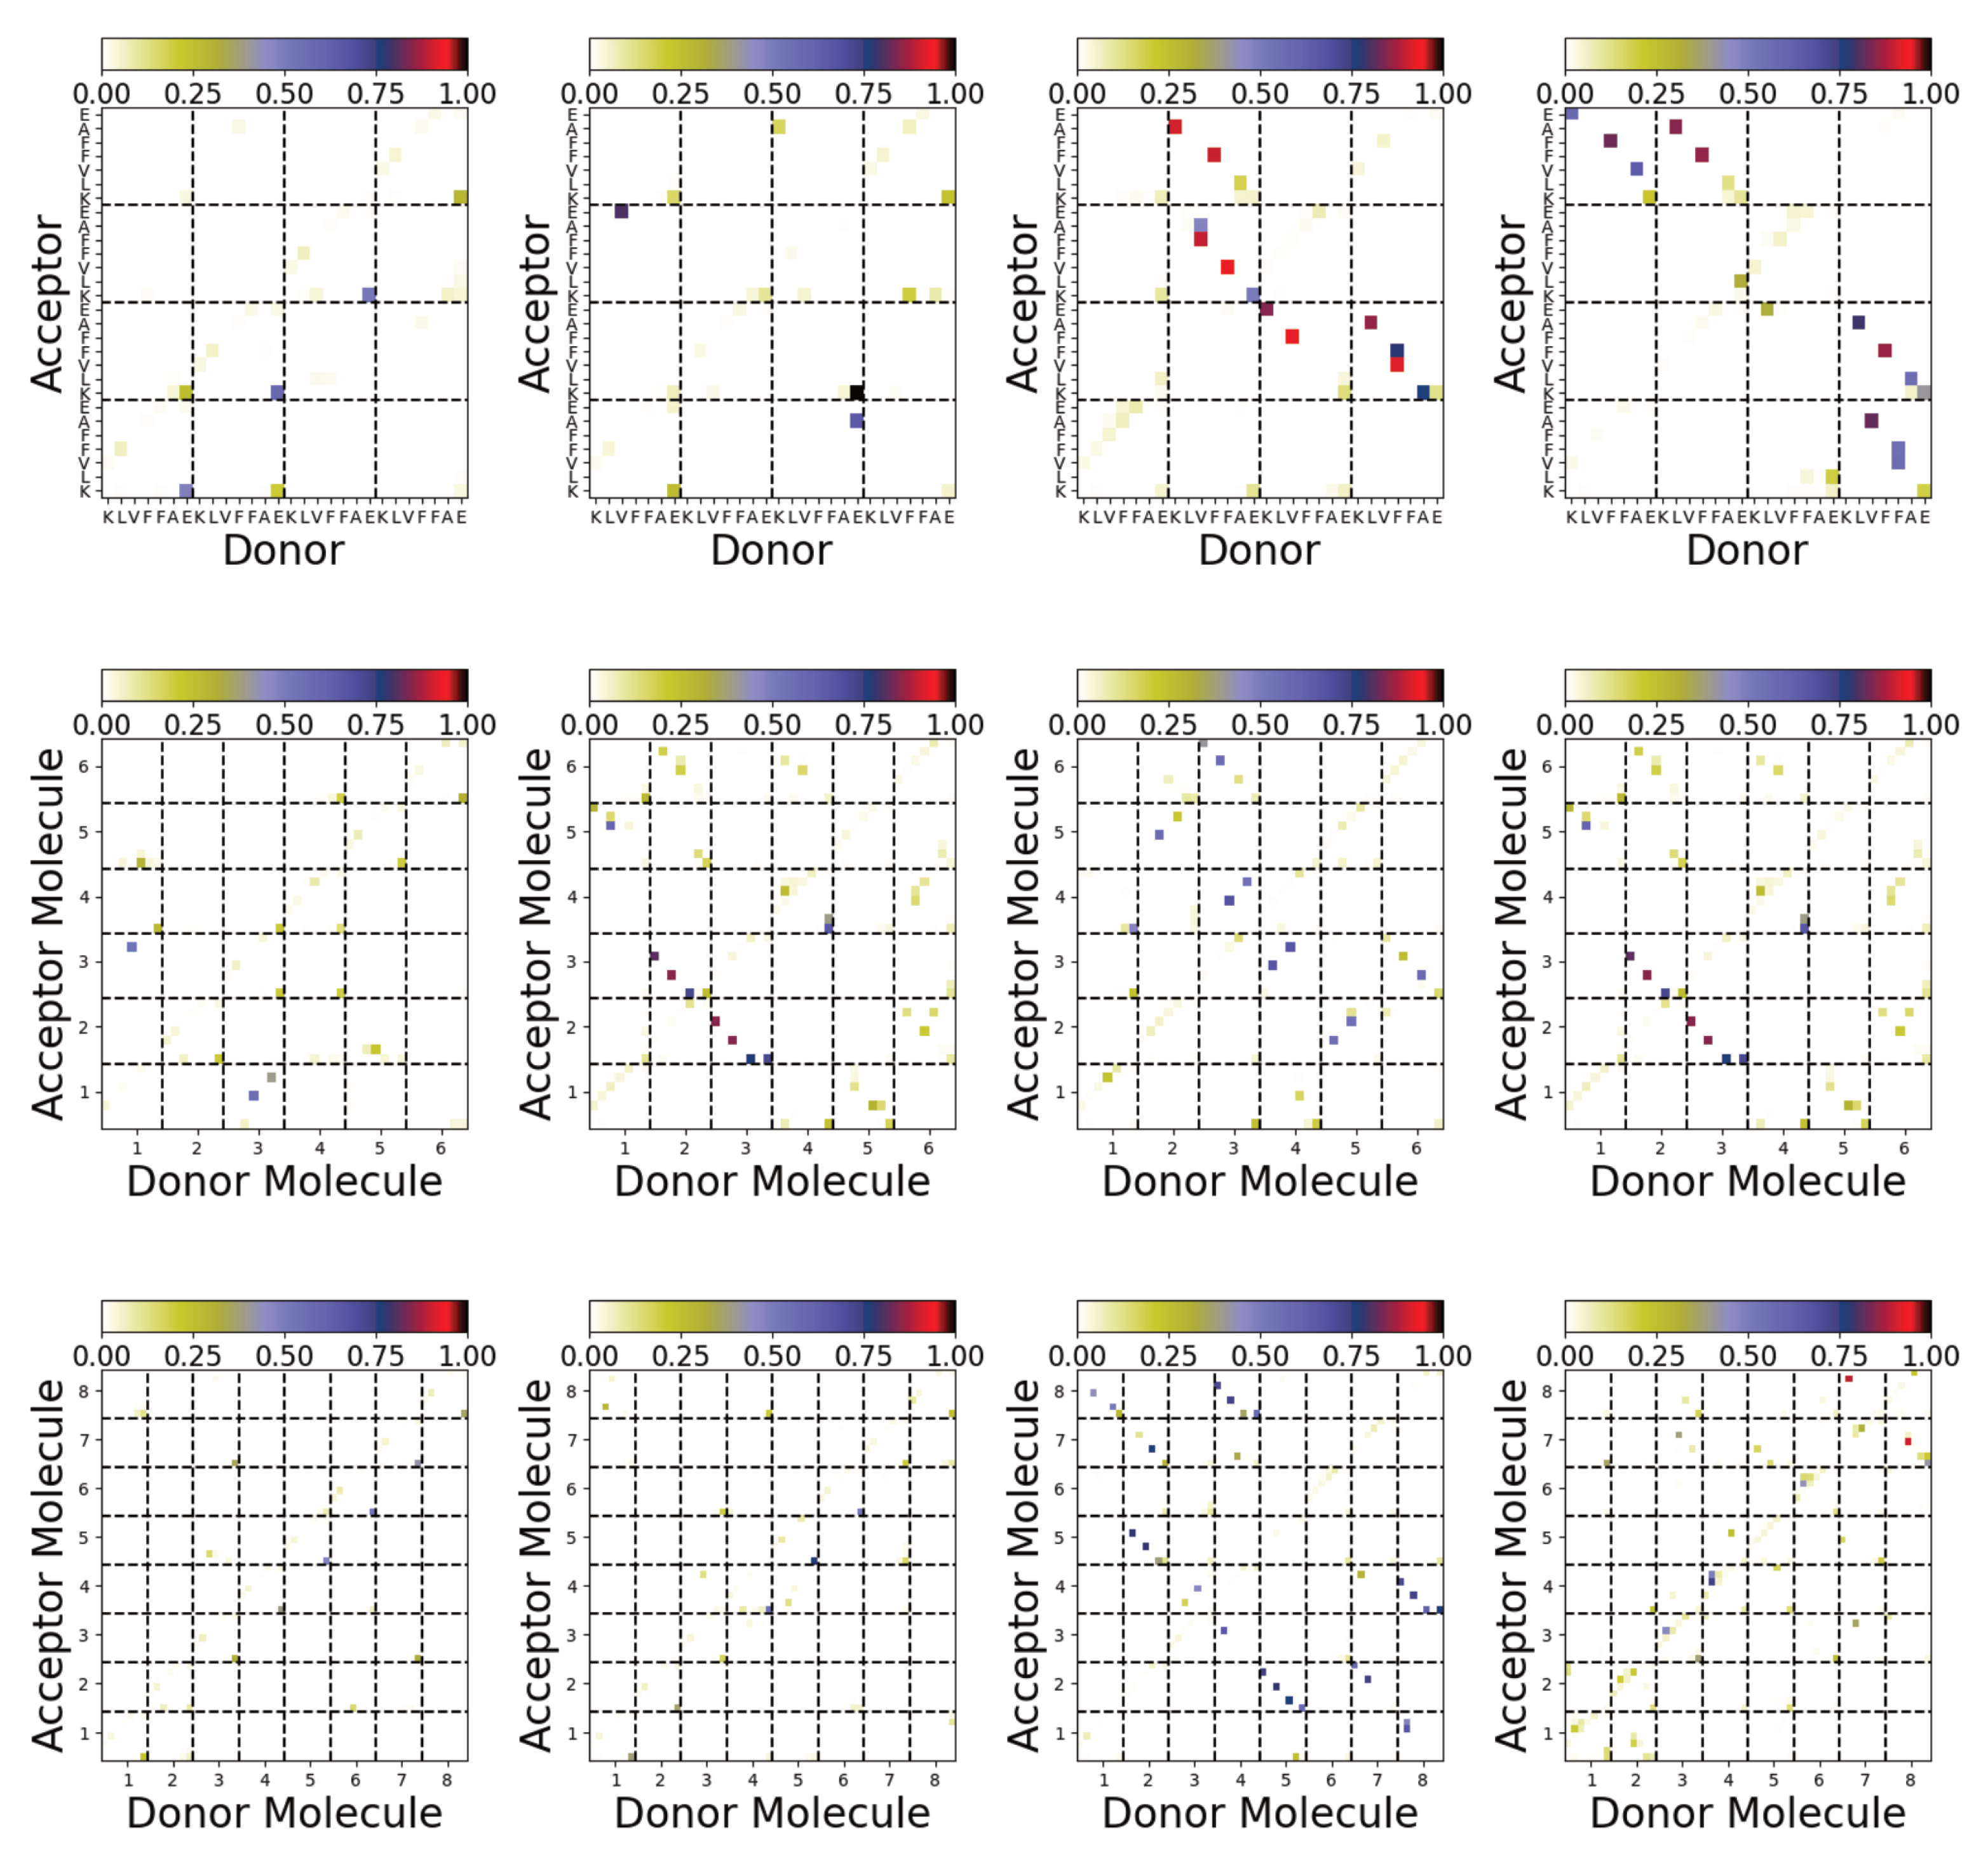
The different structures can also be characterised by the interpeptide hydrogen bonds formed (Figure 8). Significant differences between these are found between the aggregates formed on the surface and in solution. In most cases, only a small number of interpeptide hydrogen bonds are found for aggregates formed on the Au111 surface. More interpeptide hydrogen bonds are found in the bulk solution. Consistent with the contact maps (Figure 7b), these suggest antiparallel alignment of the molecules.
3.3. Oligomerization of A(16–22) on Surfaces Does Not Favour Formation of Fibril-Like Conformations
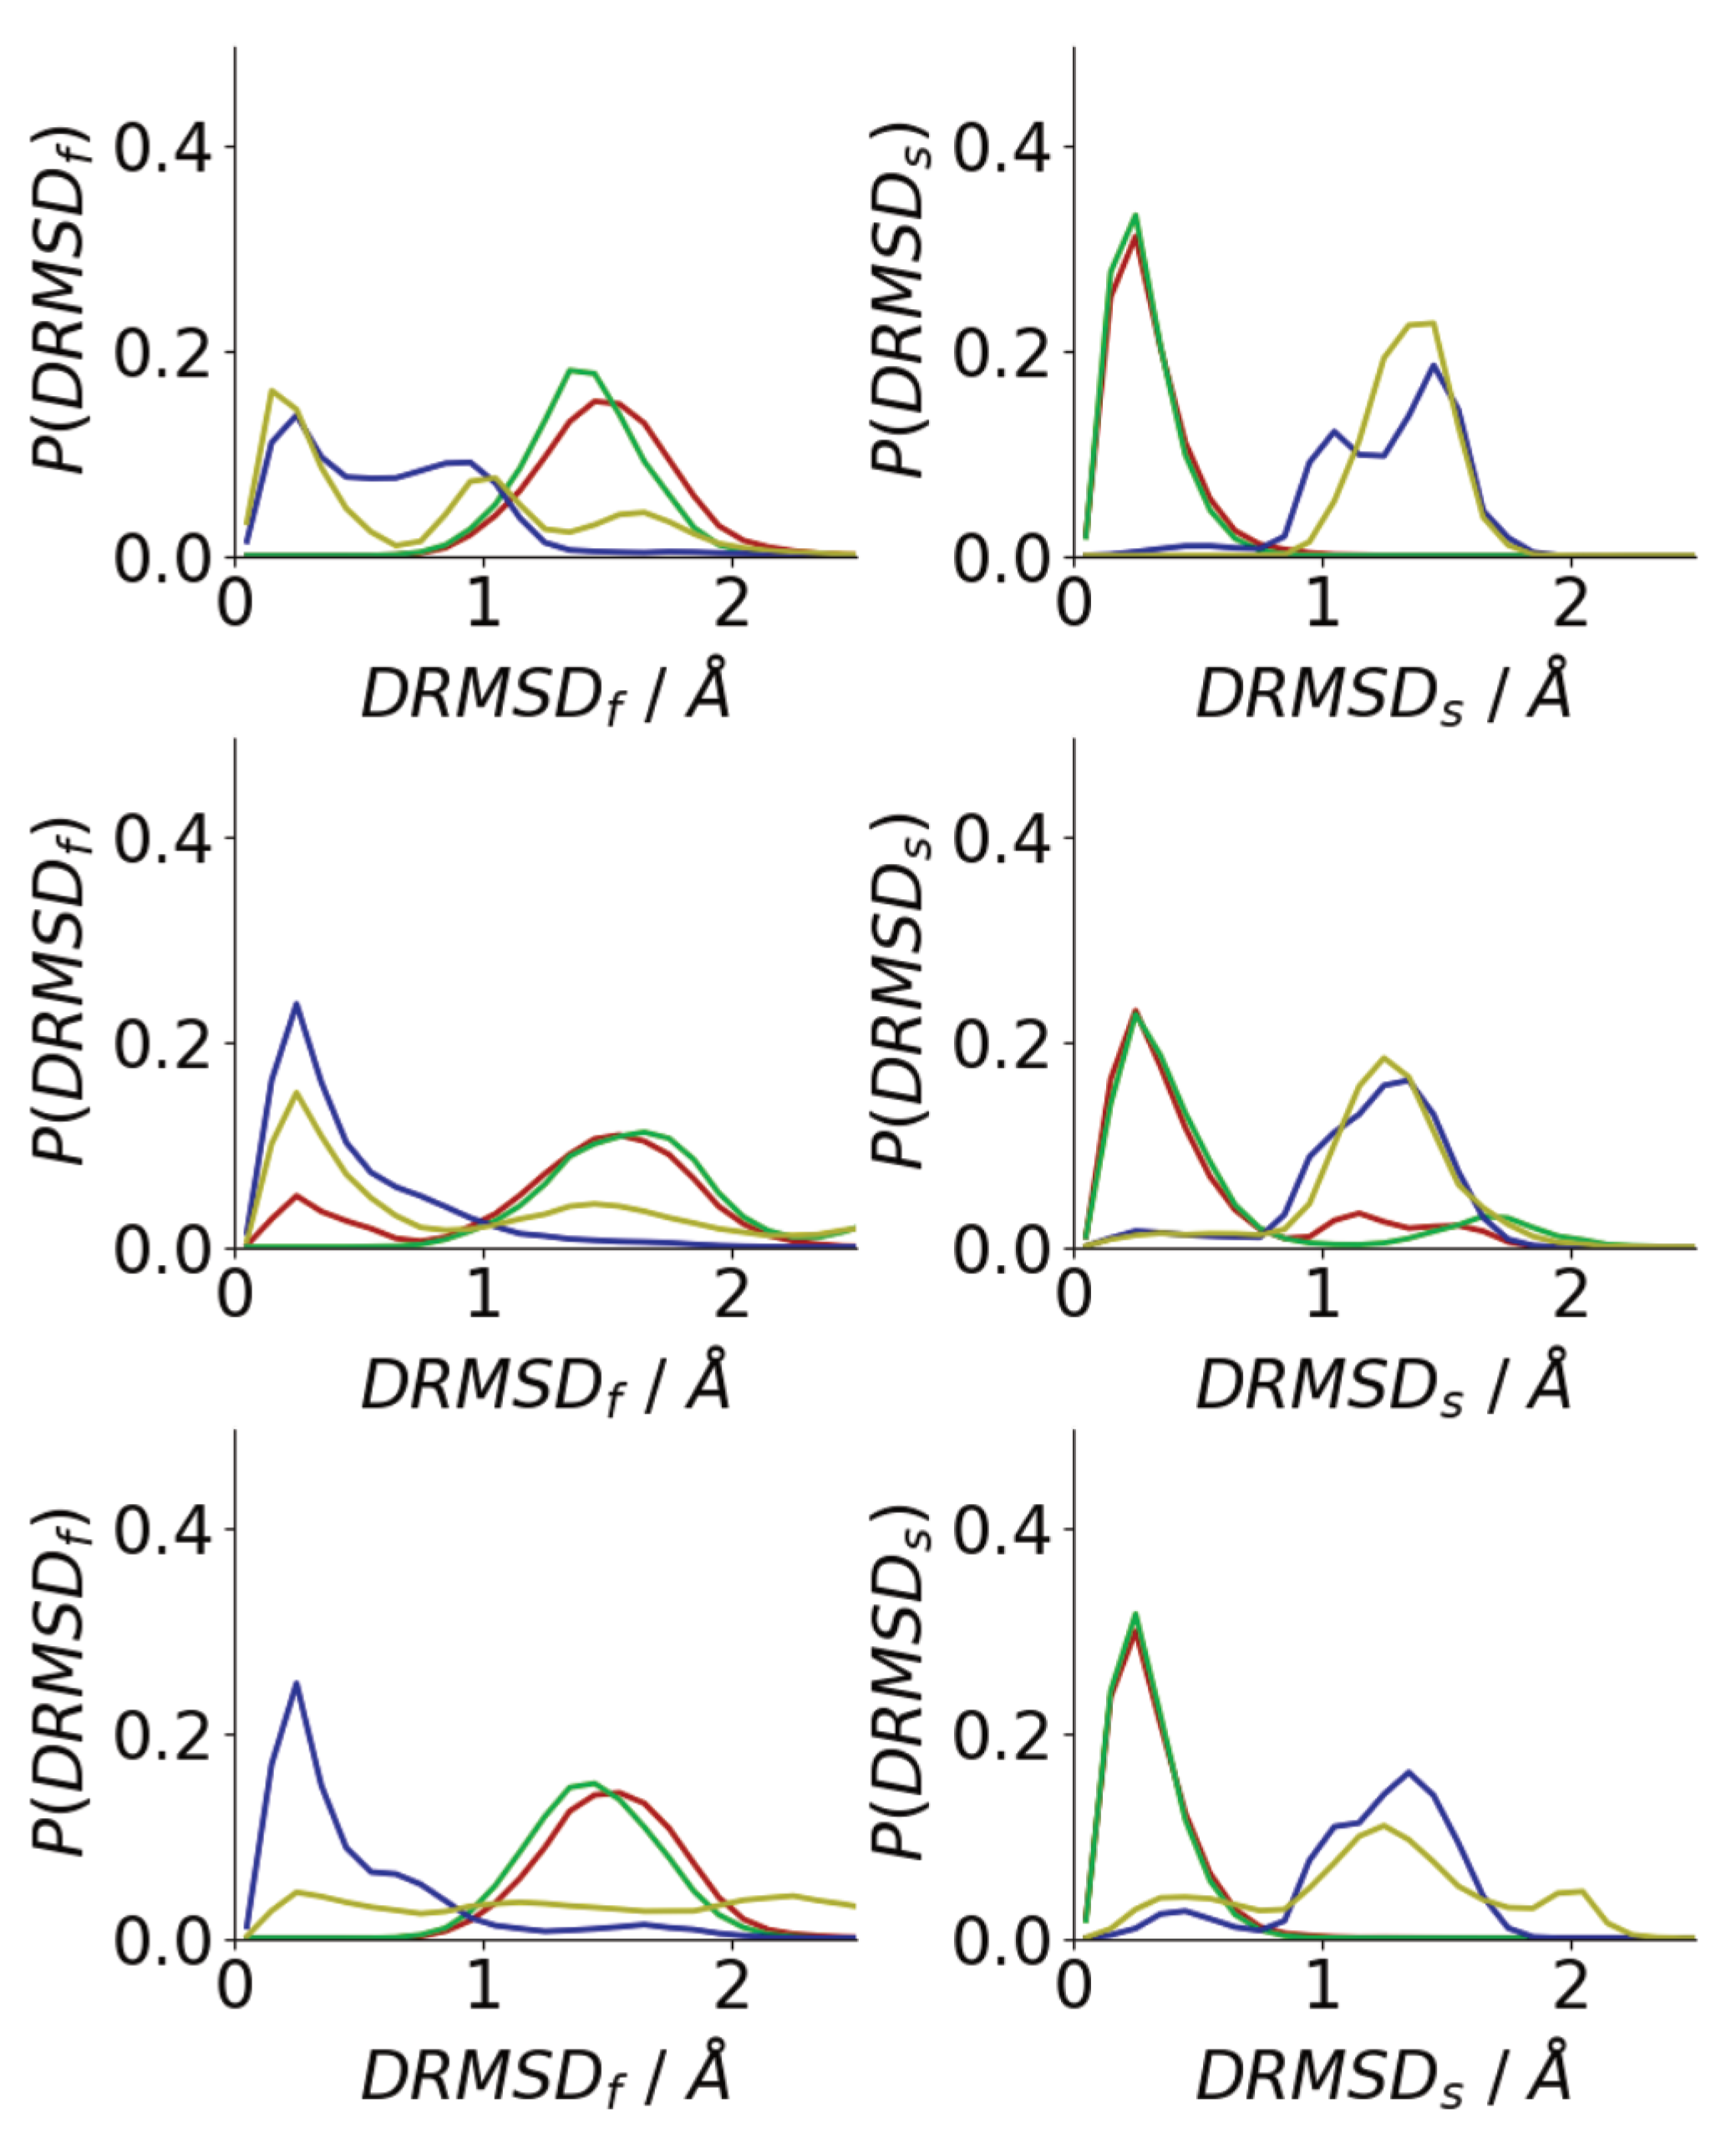
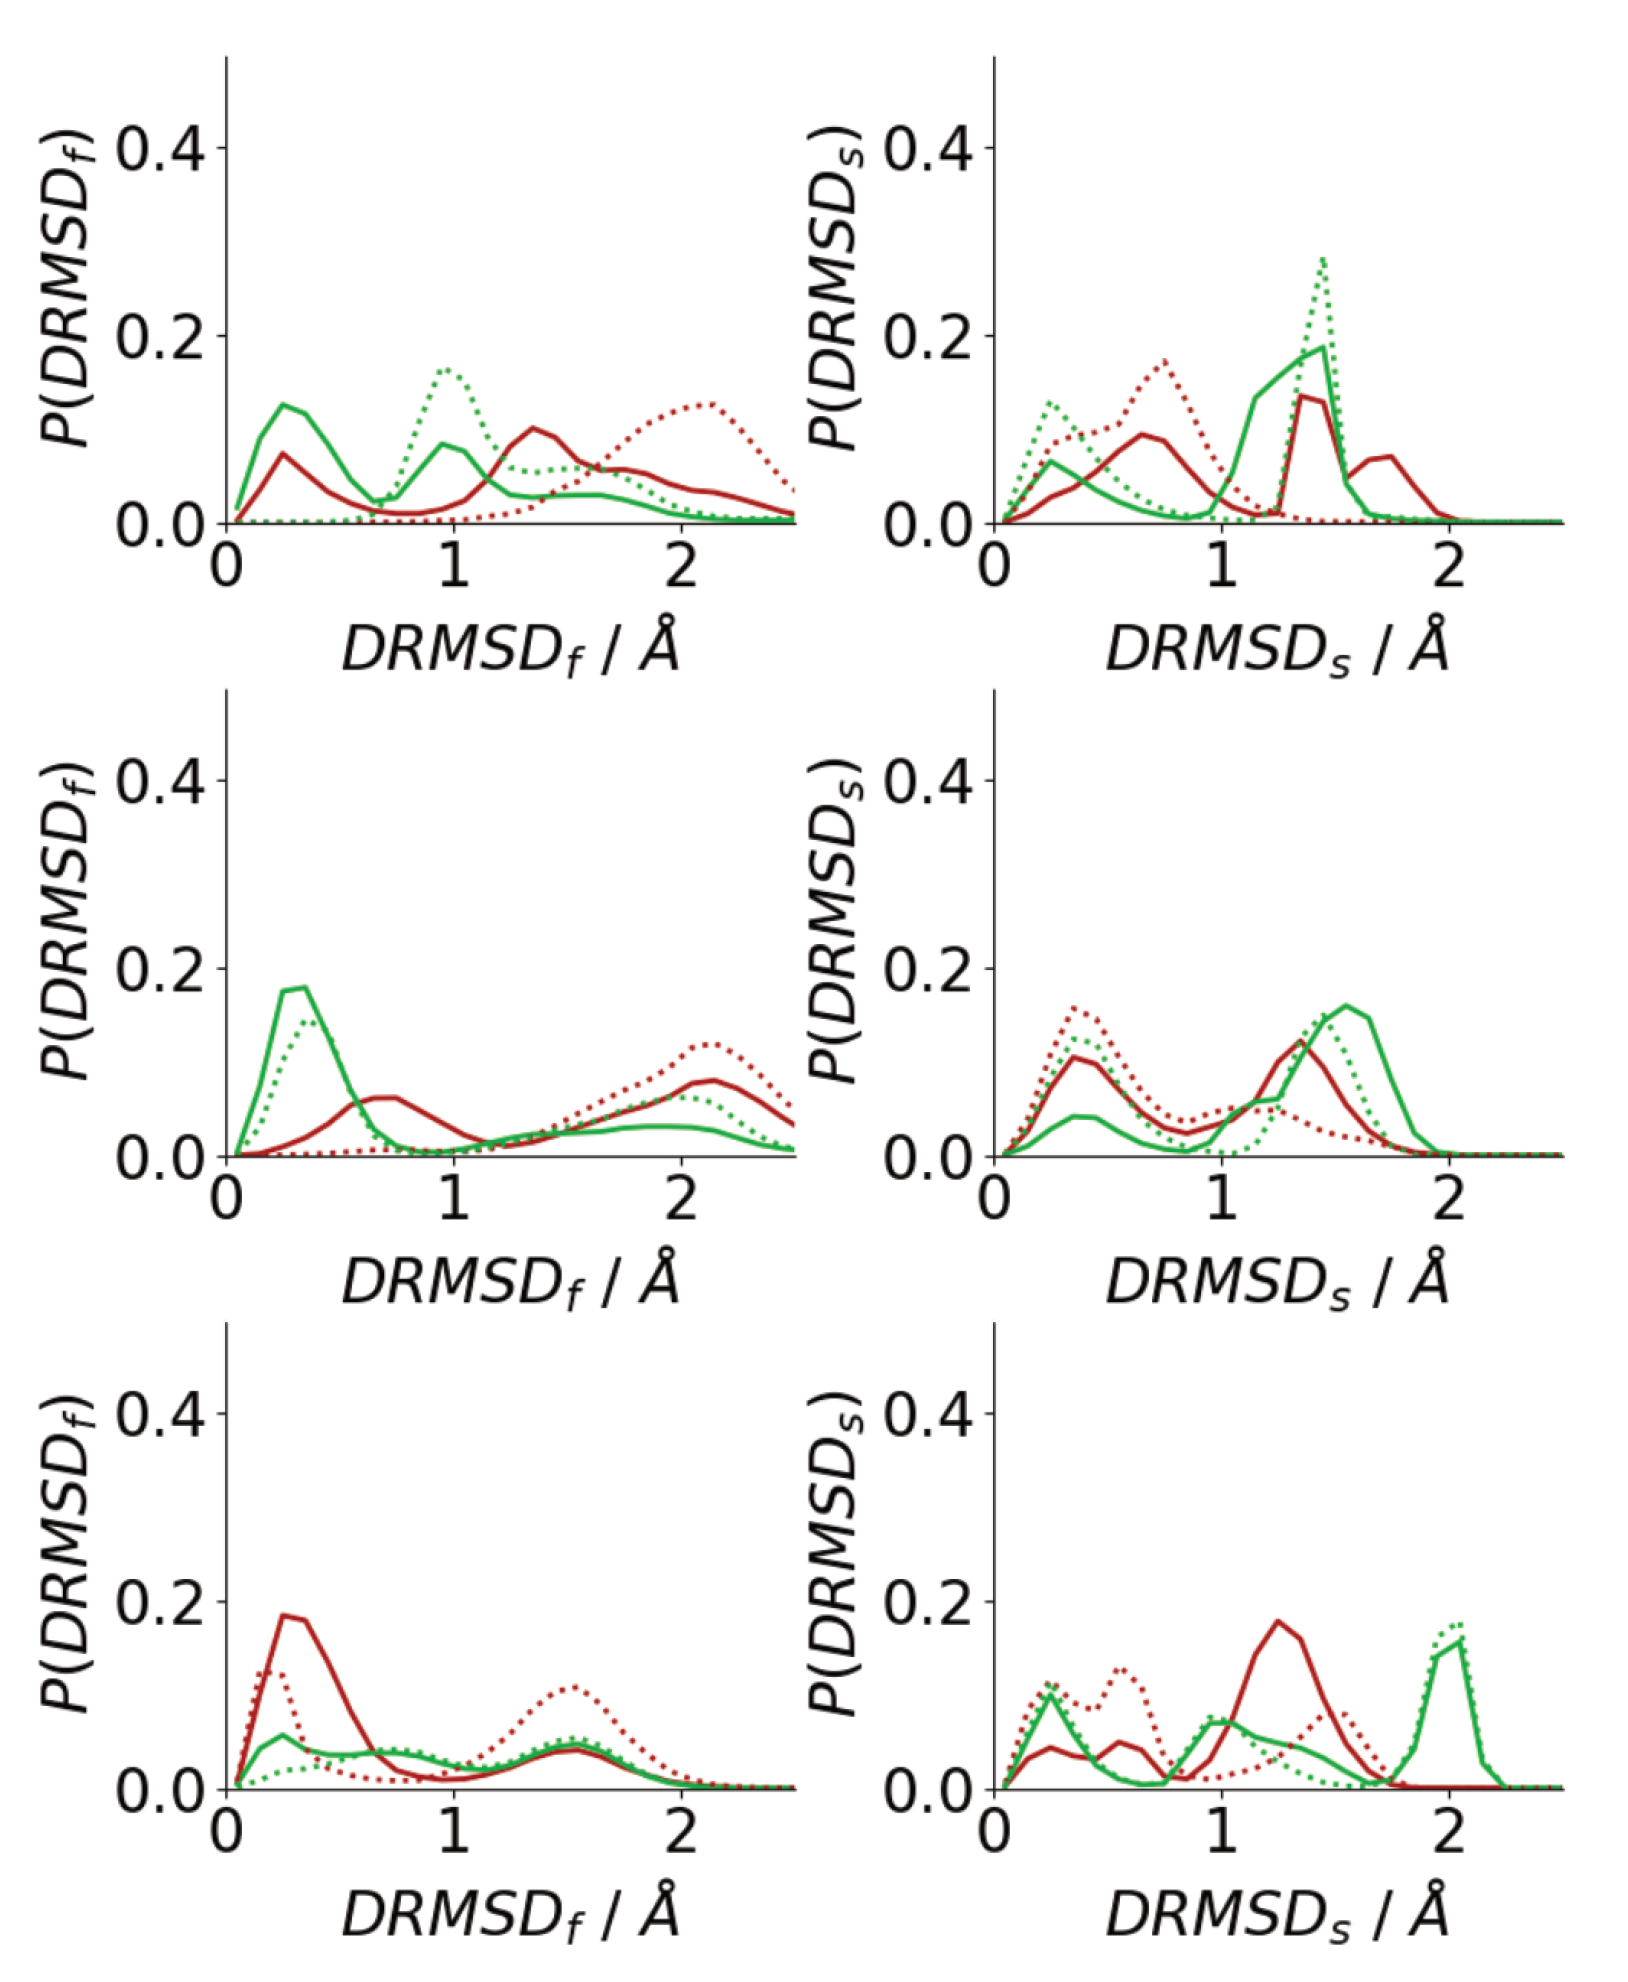
The simulation snapshots suggest that peptides in oligomers formed on surfaces and in solutions adopt very different conformations, with the peptides in solution oligomers adopting beta-strand-rich structures, similar to those in fibrils. To quantify this histograms of the DRMSD (Equation (1)) relative to fibril and surface conformations are shown in Figure 9. Generally, surface simulations have peaks in the at higher values than solution simulations, with being 0 for Å for almost all surface simulations. This shows that the Au111 surface favours conformations that are unlike those of fibrils, consistent with simulations of single peptides [34,40] The exception to this is for the first Nmol = 6 simulation, where one of the molecules has adopted a trans–conformation with only one phenylalanine residue in contact with the surface (Figure 6), which is more similar to the fibril conformation. The higher similarity between the peptide structure in solution and the fibril structure is consistent with the -strand rich structure seen in these simulations (Figure 7a), with the similarity to the fibril structure depending on the amount of -strand seen in the simulations.
By contrast, the peak in is found at low values for all the surface simulations, showing that, consistent with the simulation snapshots, the peptides adopt structures similar to the conformation of a single molecule on the Au111 surface. This shows that the inter-peptide interactions are not sufficiently strong to overcome the strong attraction between the phenylalanine residues and the surface. For the solution simulations, peptides typically adopt conformations that are unlike the surface conformation. As Nmol increases the probability of finding surface-like increases slightly, these are typically those found on the exterior of the aggregate.
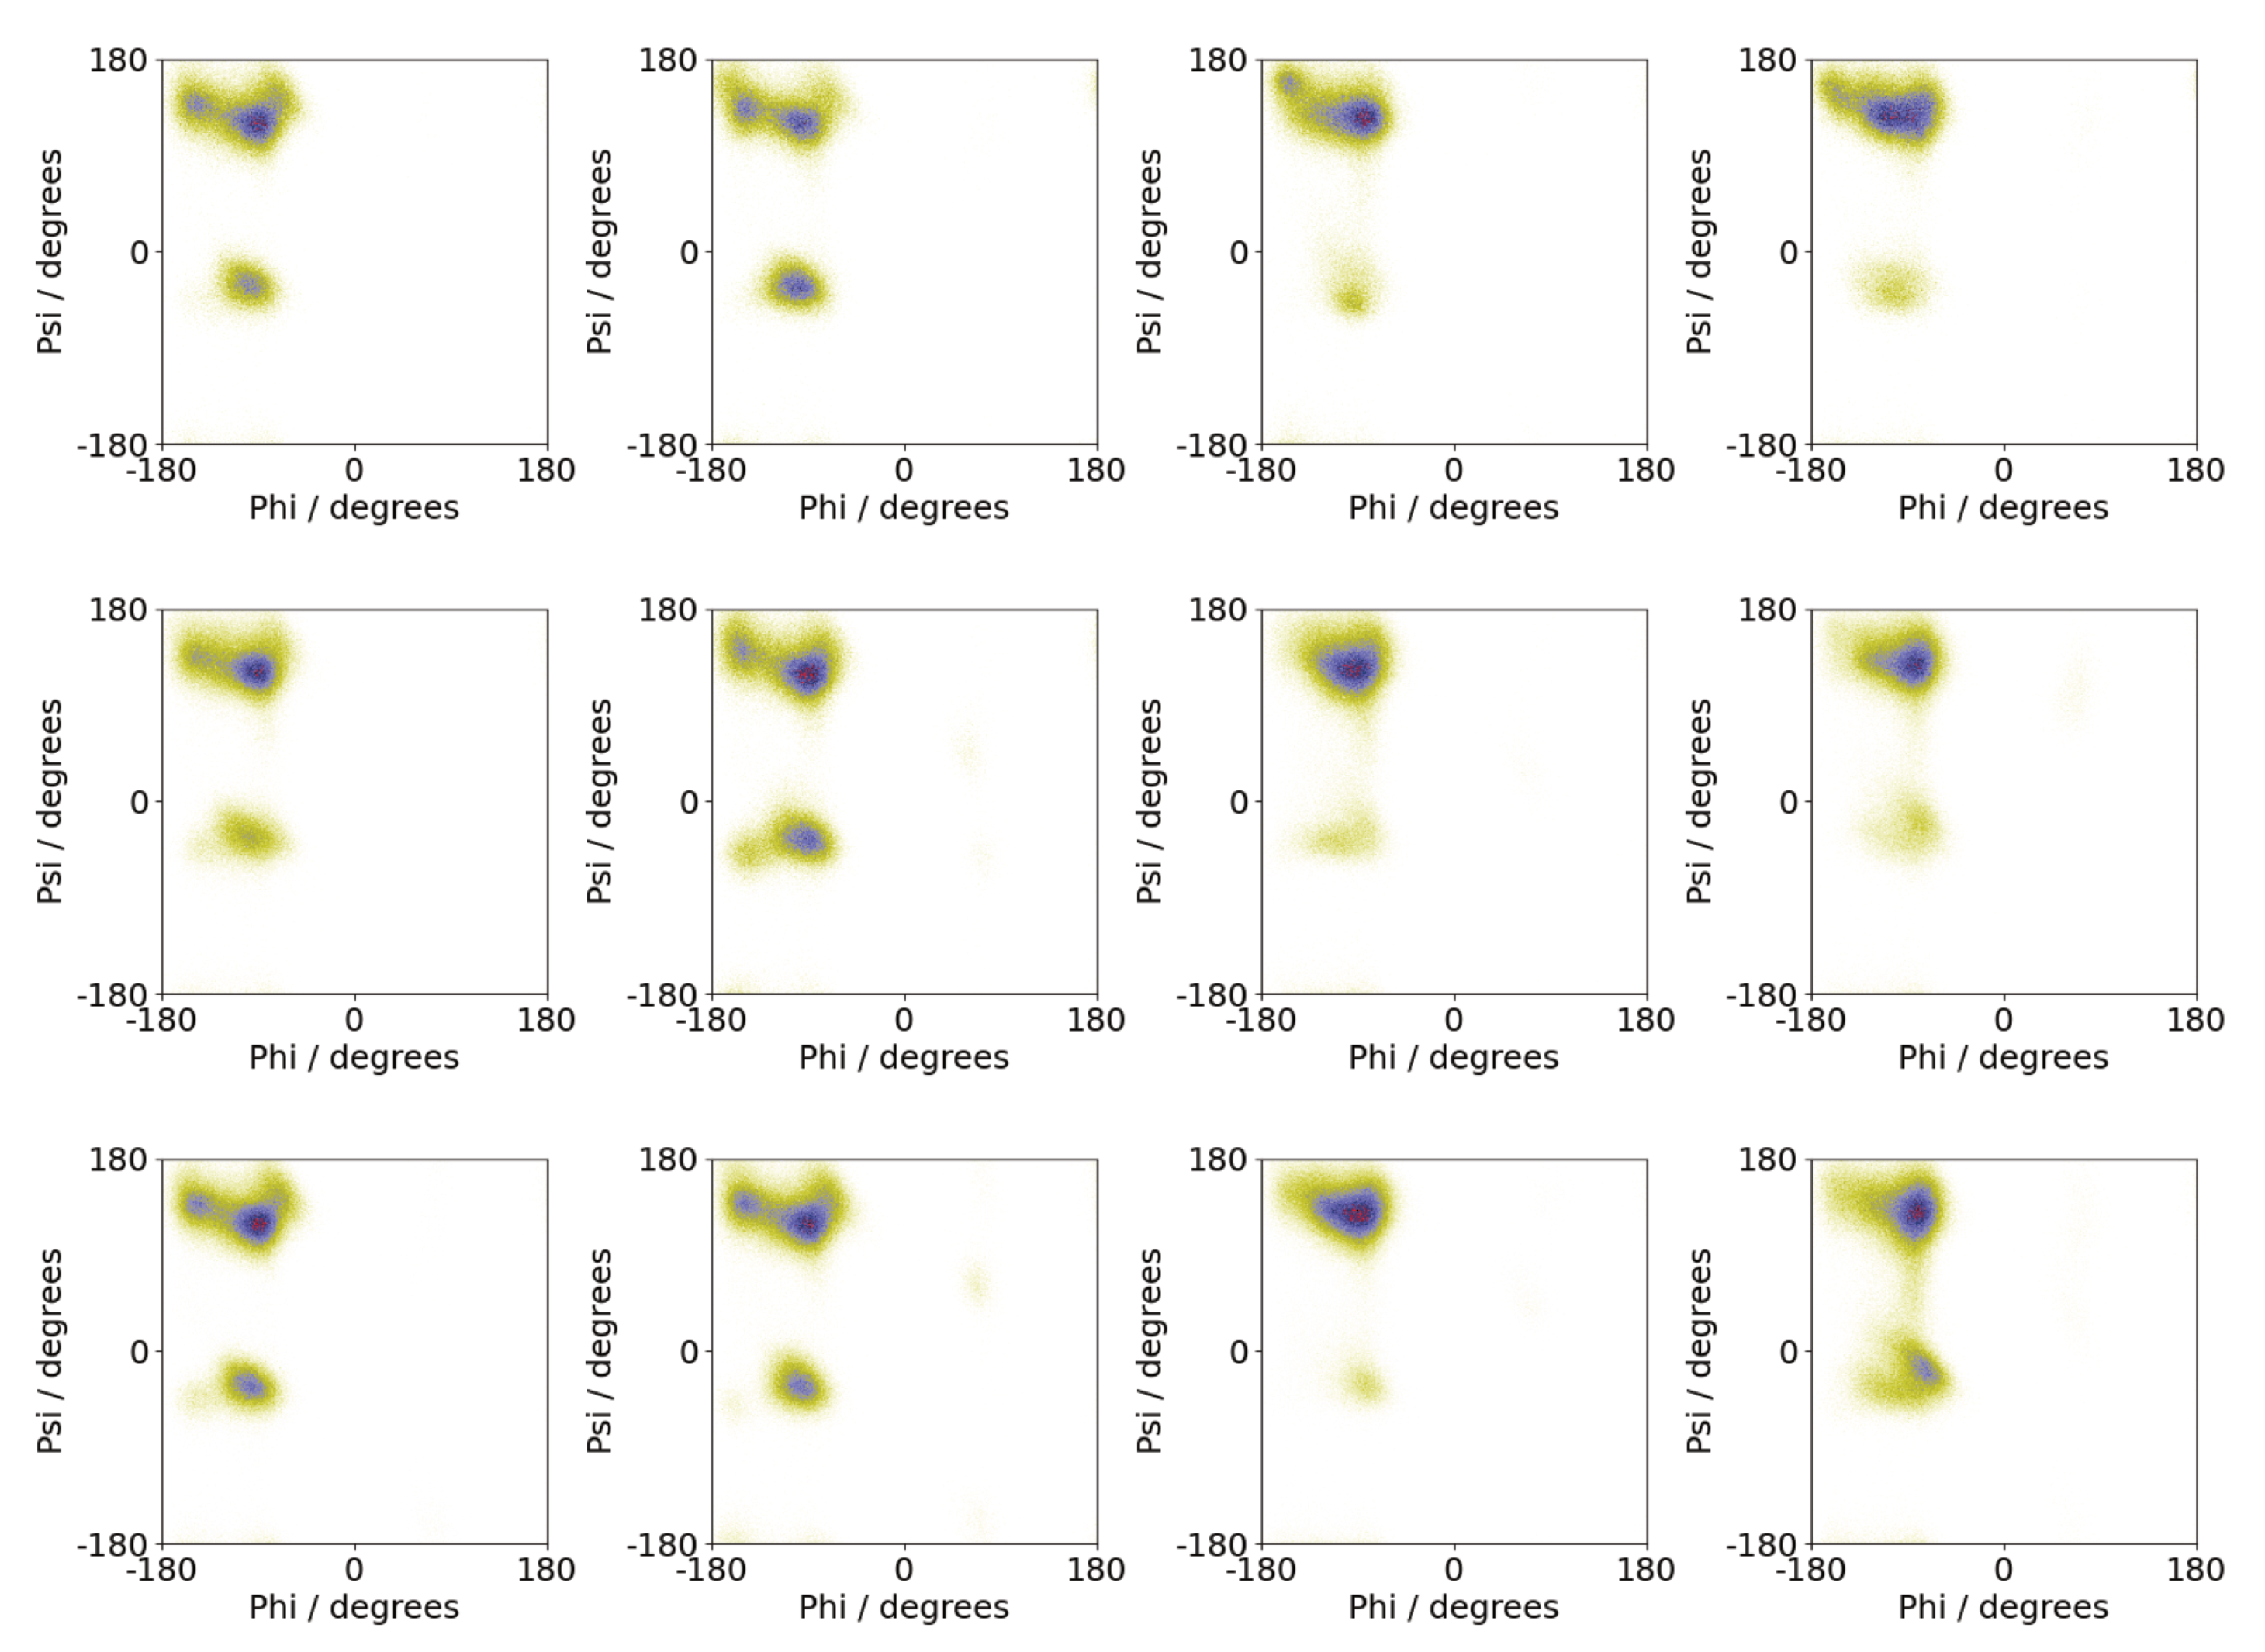
The specific differences between peptide conformations on surfaces and in solution can be seen by considering the backbone conformation in these environments. Shown in Figure 10 are Ramachandran plots from the different simulations. In the surface simulations, these are generally similar regardless of the number of molecules, suggesting that the peptide conformation is largely independent of oligomer size. While the largest population is found in the upper left quadrant, there is a significant population in the lower left quadrant, near the alpha-helix region. By contrast for most of the solution simulations, only the upper left quadrant is heavily occupied, consistent with a more beta-strand-rich conformation than the surface simulations. The exception to this is the second Nmol = 8 simulation where a disordered aggregate was found. For this case, a Ramachandran plot closer to that of the surface simulations is found.
3.4. Difference between Oligomers Formed on Surface and Adsorbed from Solution
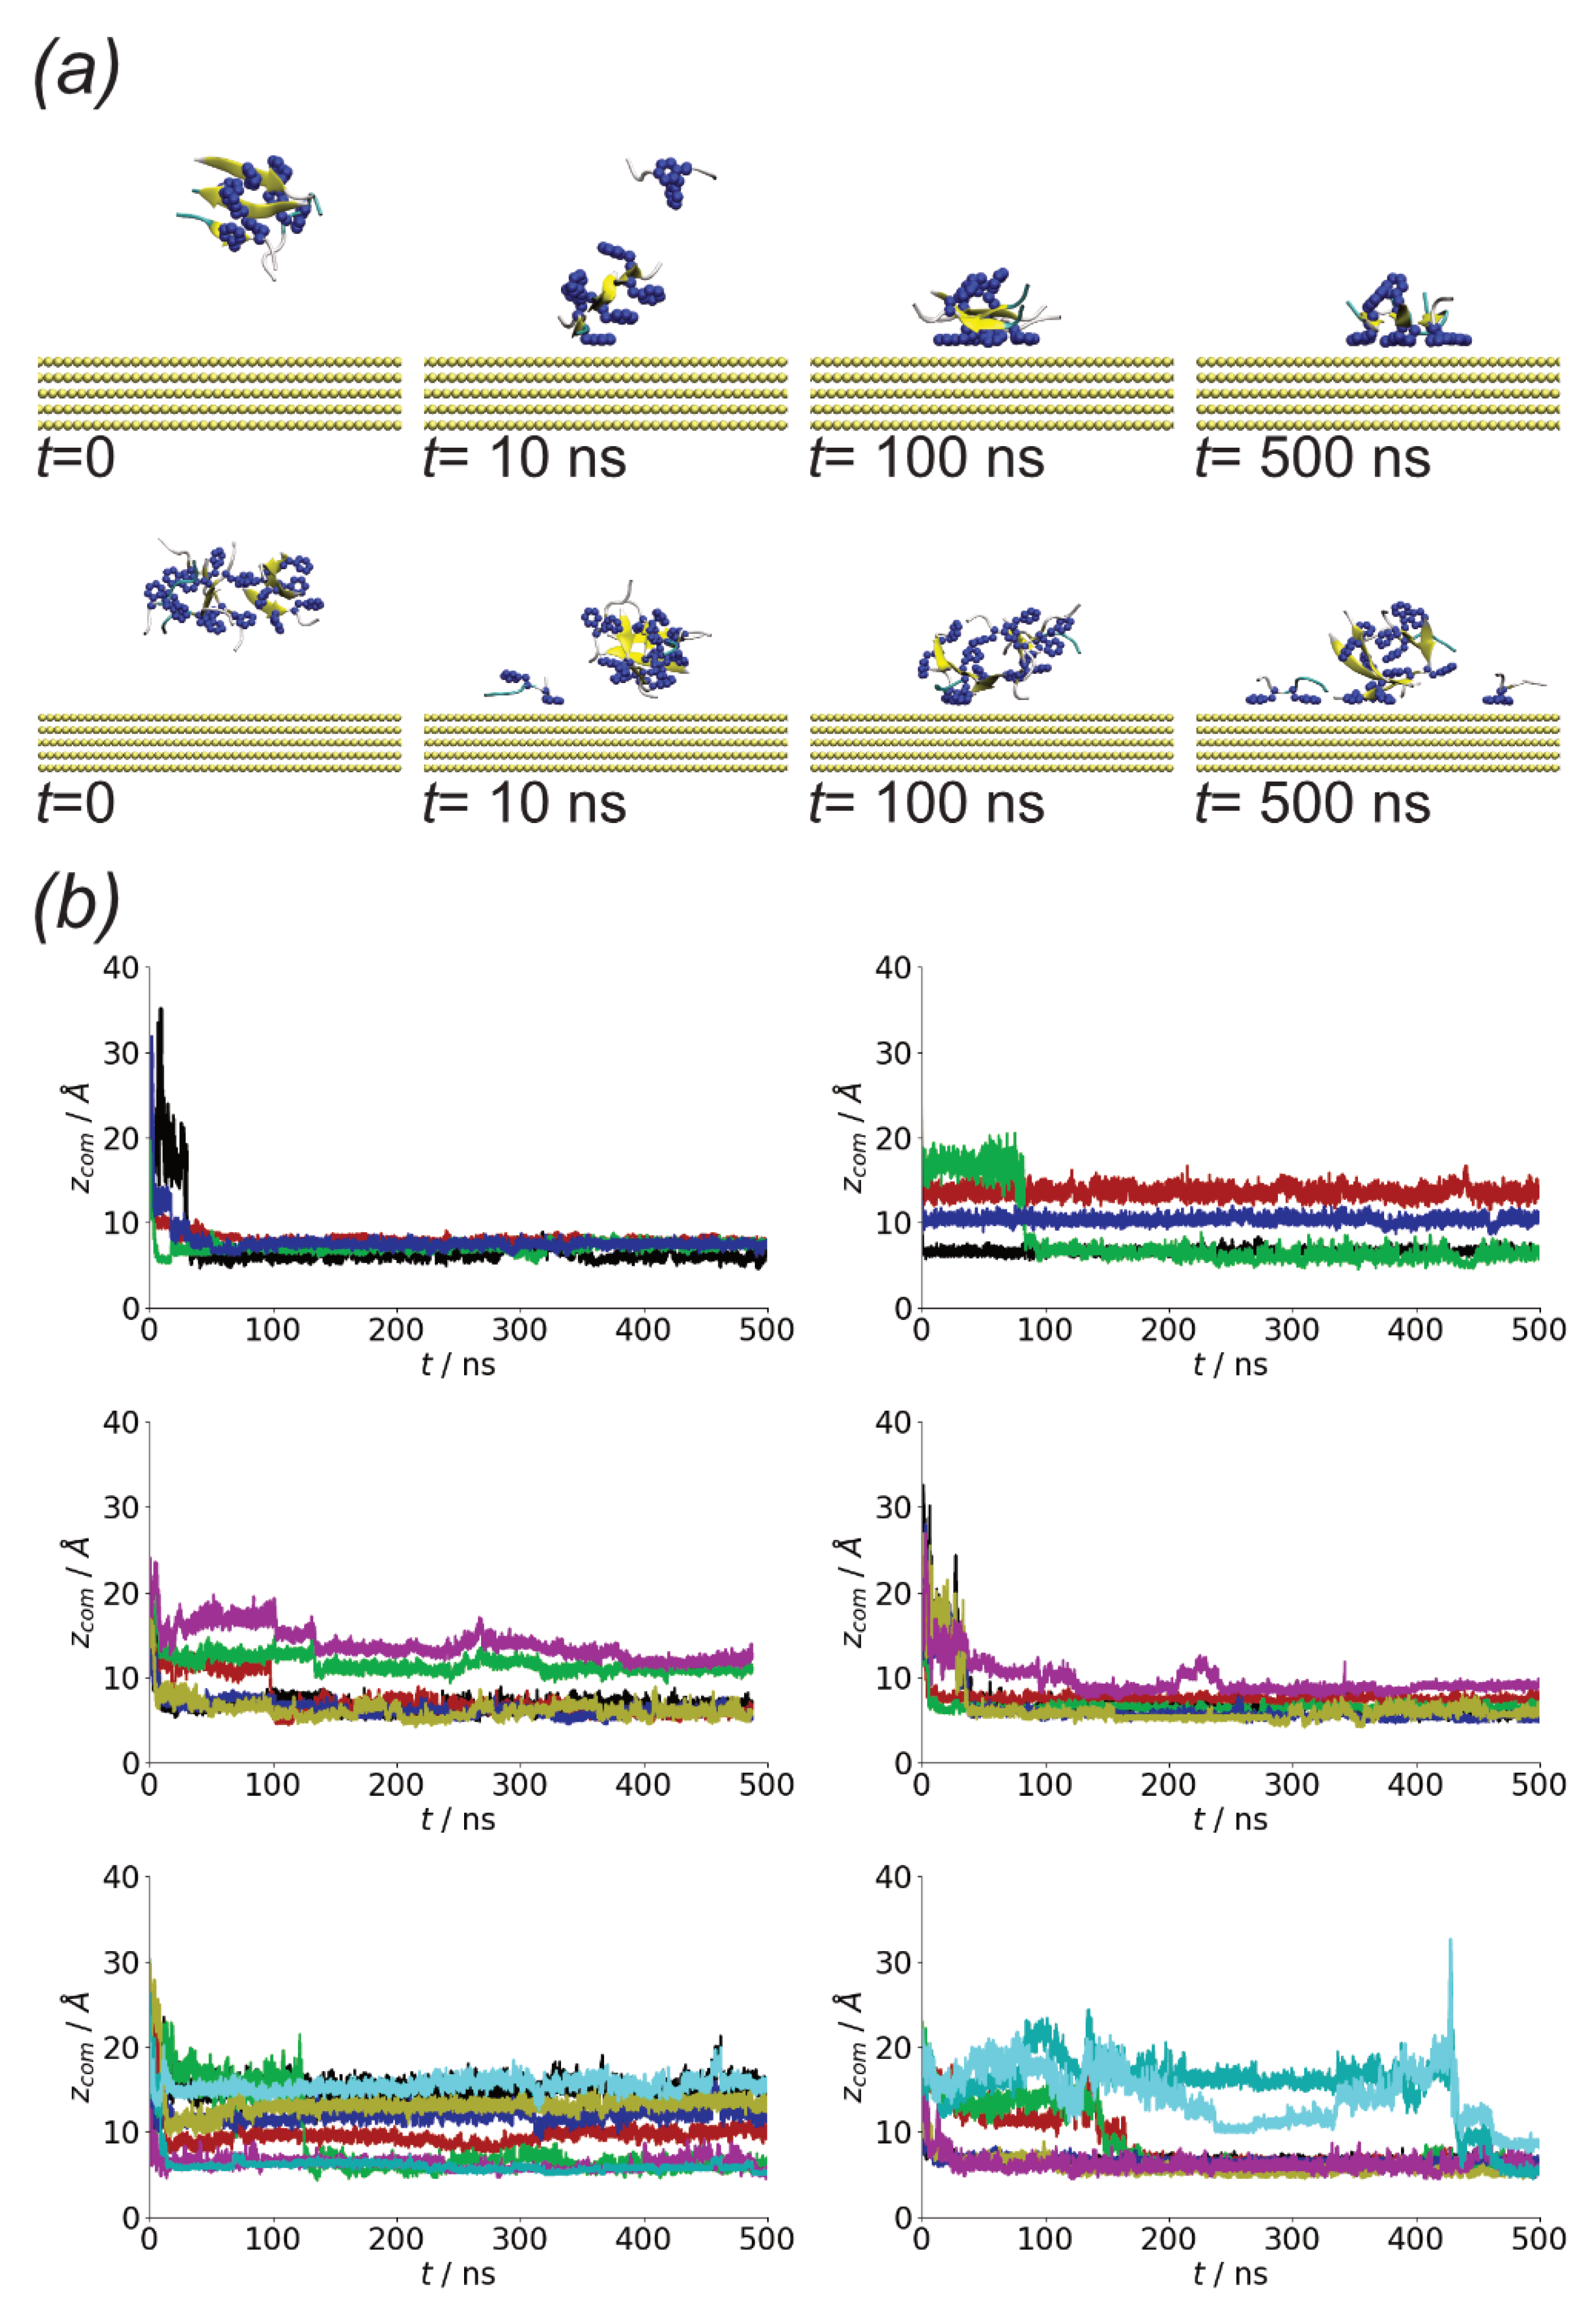
As A(16–22) aggregates rapidly in solution, it suggests that the adsorption of small aggregates onto surfaces can occur. Due to the differences in the structure of peptides in these compared to the monomer structure on the surface, this could lead to different oligomer structures as well as differences in peptide conformation within these. Starting from aggregates placed in the vicinity but not in contact with the surface in all cases these adsorb rapidly, indicating that in common with single peptide molecules there is a strong interaction with the surface. Note that during this initial adsorption, the peptides can detach from the oligomers, suggesting that the interaction with the surface is of comparable strength to the peptide–peptide interactions.
While rapid adsorption is seen in cases, the shape of the aggregate differs between the simulations. Notably, both monolayers, where all the peptides are in contact with the surface, and multilayer structures are found (Figure 11b). The adoption of different oligomer structures by amyloidogenic molecules on surfaces has been seen previously for amyloid beta oligomers on different self-assembled monolayers [49].
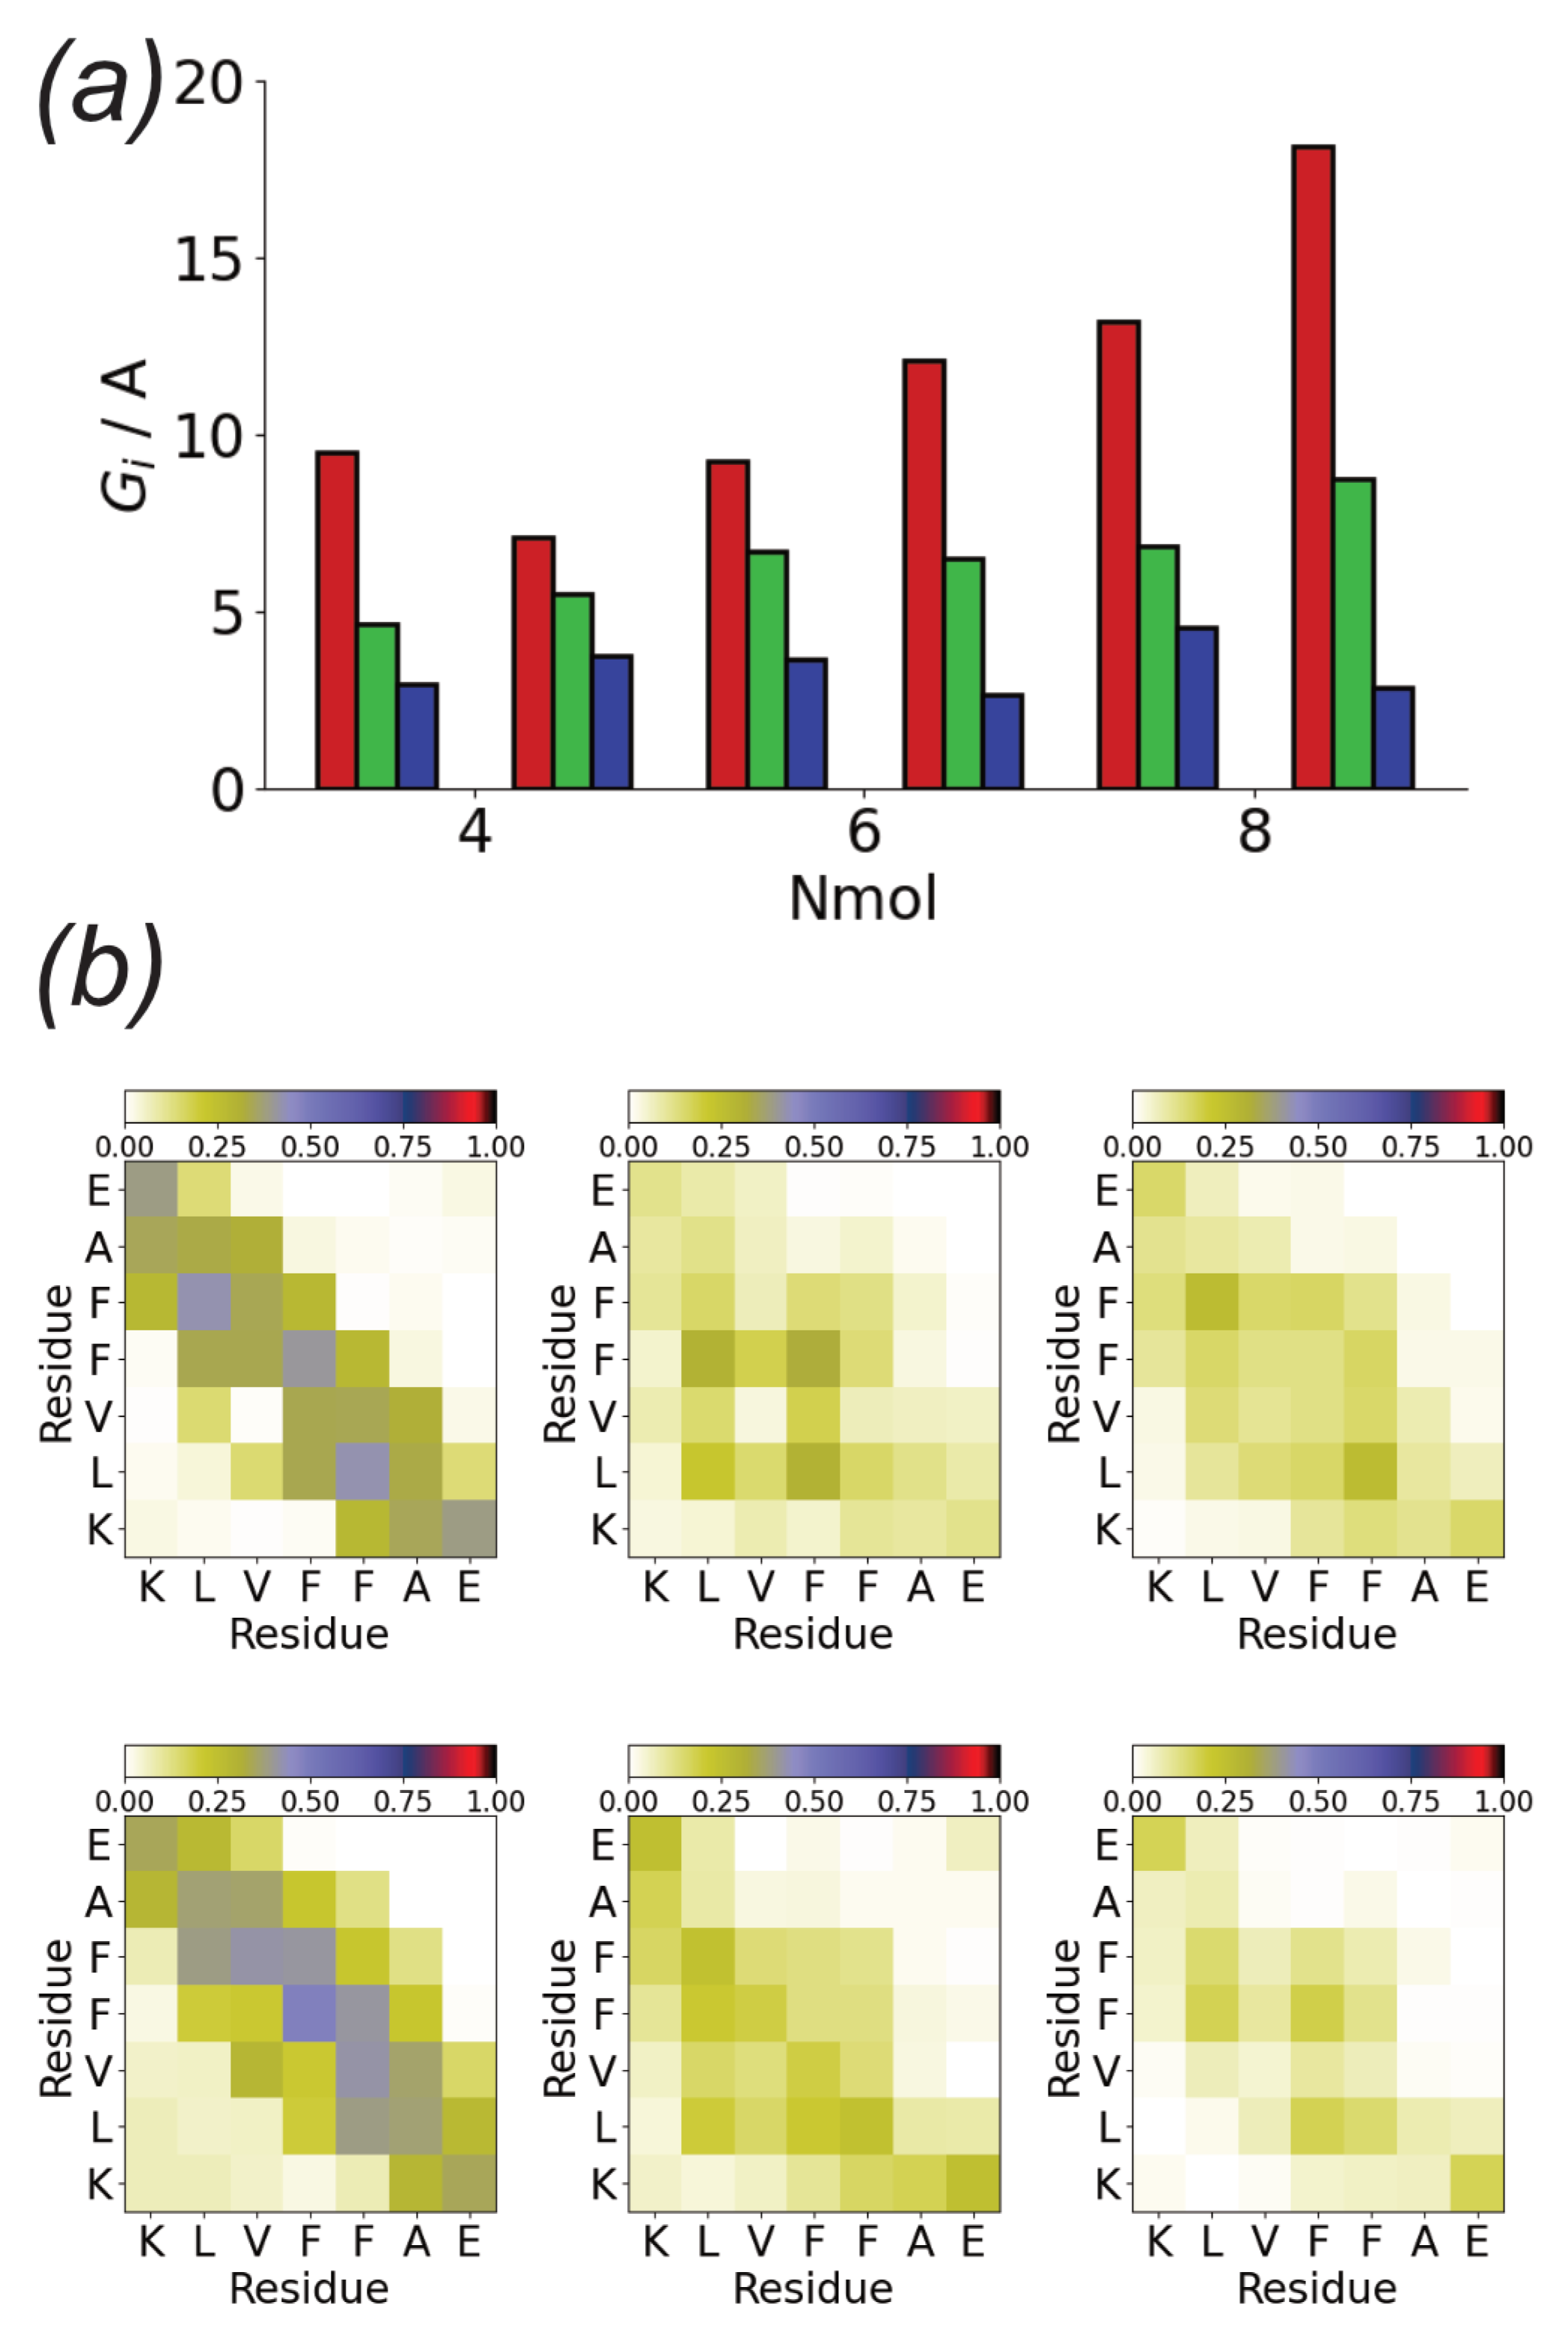
The change in aggregate shape can be quantified through the gyration tensor eigenvalues (Figure 12a). Notably, for simulations in which a monolayer forms is similar in value to that of the oligomers formed on surfaces (Figure 5b), while it is larger when a multilayer aggregate is found. and are typically larger then those for the solution aggregates. This change, however, is not always true with the oligomer structure in some cases (e.g., run2 for Nmol = 4) remaining similar to those for the solution simulation. The largest difference between the oligomer structure is found for Nmol = 8, run 2; this case corresponds to an oligomer without any beta-strand content, which may lead to weaker interpeptide interactions within the oligomer, allowing for greater changes in structure.
The differences in oligomer structure are also reflected in changes to the contacts between residues in the aggregates (Figure 12b). Simulations in which multilayer aggregates are formed are similar to those for aggregates in bulk solution, with many contacts between the hydrophobic core of the peptides. Fewer contacts are typically found for the monolayer aggregates, with contacts involving the phenylalanine residues being more prominent; this is similar to the contact maps for aggregates formed on the surface. In all cases, contacts between the charged termini are found, similar to the other oligomers.
Changes in the aggregate shape are reflected in the positions of individual residues with respect to the surface (Figure 13). As for the simulations starting from isolated peptides on the surface commonly phenylalanine residues are found near the surface. In a number of cases, both the phenylalanine residues for a particular peptide are in contact with the surface, suggesting that these adopt surface-like structures.
Changes to the single peptide conformation are also seen during the adsorption of the oligomer. Compared to bulk solution, there is a decrease in the probability of finding fibril-like structures and more surface-like conformations are found (Figure 14). This shift is largely due to the molecules lying closest to the surface, with the structural change driven by the strong interaction between the surface and phenylalanine residues.
4. Conclusions
Surfaces and interfaces have long been known to affect the aggregation and assembly of proteins and other biomolecules, with the formation of amyloid fibrils being a particularly important and interesting case. While the protein concentration on a surface is typically higher than in the bulk solution, which would naturally increase the aggregation rate, surfaces can both promote or inhibit the formation of fibrils. This suggests that the fibrillation process depends on details of the protein conformation on the surface and on the protein–surface interaction. To gain insight into this, in this paper molecular dynamics simulations were used to investigate the aggregation of the model amyloidogenic peptide, A(16–22), on gold surfaces and in bulk solution.
While aggregation on simulation timescales is seen in both surface and solution simulations, the structures of aggregates that were formed differed markedly. In particular, while the solution aggregates were typically rich in beta-strands, these were not found in the aggregates formed on surfaces. This suggests that despite the more rapid aggregation of peptides on the surface, fibril formation may be inhibited, consistent with experiment [34]. On the surface the peptide conformation in the oligomers is similar to that of isolated peptides [40], with the likelihood of them adopting fibril-like conformations small. The adoption of non-fibril-like conformations on surfaces may be a common feature of nanomaterial systems that can inhibit the formation of fibrils [75]. These differences in structure are driven both by the effect of the surface on peptide conformation and by the different interactions found between peptides. On the surface, the most common interactions are between phenylalanine residues, which are pinned to the surface, and between the charged termini. In solution, aggregation is largely driven by hydrophobic interactions [76]. Note that in the present study, the end termini are uncapped (as in previous simulations of the single peptide system [40]). As the two terminal residues in this peptide have charged side chains at neutral pH, charge–charge interactions would still be present if the peptide ends were capped, so qualitatively similar results may be expected in that case. Nonetheless, different end capping groups have been shown to affect the behaviour of peptides on surfaces [77] and this would be an interesting avenue for future work.
While there is some variation in the stability of the different sizes aggregates formed on the Au111 surface (Figure 2b), both the oligomer structures (Figure 5) and single peptide conformations (Figure 10) were similar for the different numbers of peptides. This suggests that the tendency of the surface to disfavour fibril formation holds regardless of the system size.
Aggregation in solution means that as well as adsorbing individually peptide aggregates can adsorb onto the surface. Simulations of aggregates show that these may also rapidly adsorb onto the surface. This is accompanied by changes in the structure of the aggregate and individual peptides. In some cases, they adopt monolayer structures with every peptide in contact with the surface, while in others multilayers are formed. This does not depend on the number of molecules in the aggregate. The structures of the peptides in the aggregates also change, with those in contact with the surface being more liable to adopt surface-like conformations.
As with all simulations the chosen starting conditions can affect the final results. From previous simulations of single peptides on the Au111 surface, the two phenylalanine residues are almost always found in contact with the surface so the conformation is likely to be a reasonable starting structure for the peptide. The weaker adsorption of the other residues onto the surfaces means that changes from the initial structure are seen in the simulation timescales as suggested by the histograms of the (Figure 9). The strong attraction for the phenylalanine residues for the surface is also seen in the oligomer adsorption simulations, where adsorption is through the phenylalanine residues and change of peptide structure to more surface-like conformations is seen.
While these simulations are consistent with the effect of gold surfaces on the fibrillation of A(16–22), as with all molecular dynamics studies the time and length scales that have been investigated are limited. In particular, the concentrations are far above those that would be found in typical experimental systems. The timescales of the simulations were also too short to see if aggregates adsorbed from solution onto surfaces would always completely transform to surface-like aggregates. To investigate this coarse-grained models [78] can be used to extend the accessible time scales. Markov state models [79] or kinetic Monte Carlo [80] models could also be used to give more quantitative information on the aggregation kinetics.
Funding
This research received no external funding.
Data Availability Statement
The data presented in this study are available in the article.
Acknowledgments
Computational facilities for this work were provided by the SFI/HEA funded Irish Centre for High End Computing.
Conflicts of Interest
The author declares no conflict of interest.
Appendix A. Time Evolution of Oligomer Size Distributions
To investigate this the oligomer size distributions were calculated for 50 ns intervals across the last 200 ns of the simulation. In most cases there is no systematic variation between these suggesting that the oligomer sizes had equilibrated within this time and that calculating averages across the final 100 ns of the simulation is valid.
Figure A1.
Evolution of oligomer size histograms for Nmol = 4 (top), Nmol = 6 (middle), and Nmol = 8 (bottom). The leftmost two columns are simulations on the Au111 surface and the rightmost two columns are from simulations in bulk solution. Red, green, blue, and gold denote histograms calculated for 300–350 ns, 350–400 ns, 400–450 ns, and 450–500 ns, respectively.

References
- Ke, P.C.; Zhou, R.; Serpell, L.C.; Riek, R.; Knowles, T.P.J.; Lashuel, H.A.; Gazit, E.; Hamley, I.W.; Davis, T.P.; Fändrich, M.; et al. Half a Century of Amyloids: Past, Present and Future. Chem. Soc. Rev. 2020, 49, 5473–5509. [Google Scholar] [CrossRef] [PubMed]
- Goedert, M.; Spillantini, M.G. A Century of Alzheimer’s Disease. Science 2006, 314, 777–781. [Google Scholar] [CrossRef] [PubMed]
- Knowles, T.P.J.; Vendruscolo, M.; Dobson, C.M. The Amyloid State and Its Association with Protein Misfolding Diseases. Nat. Rev. Mol. Cell Biol. 2014, 15, 384–396. [Google Scholar] [CrossRef] [PubMed]
- Sacchettini, J.C.; Kelly, J.W. Therapeutic Strategies for Human Amyloid Diseases. Nat. Rev. Drug Discov. 2002, 1, 267–275. [Google Scholar] [CrossRef] [PubMed]
- Knowles, T.P.J.; Mezzenga, R. Amyloid Fibrils as Building Blocks for Natural and Artificial Functional Materials. Adv. Mater. 2016, 28, 6546–6561. [Google Scholar] [CrossRef] [PubMed]
- Gebbink, M.F.; Claessen, D.; Bouma, B.; Dijkhuizen, L.; Wösten, H.A.B. Amyloids—A Functional Coat for Microorganisms. Nat. Rev. Microbiol. 2005, 3, 333–341. [Google Scholar] [CrossRef] [PubMed]
- Erskine, E.E.; MacPhee, C.E.; Stanley-Wall, N.R. Functional Amyloid and Other Protein Fibres in the Biofilm Matrix. J. Mol. Biol. 2018, 430, 3642–3656. [Google Scholar] [CrossRef]
- Maji, S.K.; Perrin, M.H.; Sawaya, M.R.; Jessberger, S.; Vadodaria, K.; Rissman, R.A.; Singru, P.S.; Nilsson, K.P.R.; Simon, R.; Schubert, D.; et al. Functional Amyloids As Natural Storage of Peptide Hormones in Pituitary Secretory Granules. Science 2009, 325, 328–332. [Google Scholar] [CrossRef]
- Li, C.; Qin, R.; Liu, R.; Miao, S.; Yang, P. Functional Amyloid Materials at Surfaces/Interfaces. Biomater. Sci. 2018, 6, 462–472. [Google Scholar] [CrossRef]
- Kasai, S.; Ohga, Y.; Mochizuki, M.; Nishi, N.; Kadoya, Y.; Nomizu, M. Multifunctional Peptide Fibrils for Biomedical Materials. Biopolym. Pept. Sci. Sect. 2004, 76, 27–33. [Google Scholar] [CrossRef]
- Liang, Y.; Guo, P.; Pingali, S.V.; Pabit, S.; Thiyagarajan, P.; Berland, K.M.; Lynn, D.G. Light Harvesting Antenna on an Amyloid Scaffold. Chem. Commun. 2008, 6522–6524. [Google Scholar] [CrossRef]
- Burke, K.A.; Yates, E.A.; Legleiter, J. Biophysical Insights into How Surfaces, Including Lipid Membranes, Modulate Protein Aggregation Related to Neurodegeneration. Front. Neurol. 2013, 4, 17. [Google Scholar] [CrossRef] [PubMed]
- Keller, A.; Grundmeier, G. Amyloid Aggregation at Solid-Liquid Interfaces: Perspectives of Studies Using Model Surfaces. Appl. Surf. Sci. 2020, 506, 144991. [Google Scholar] [CrossRef]
- Linse, S.; Cabaleiro-Lago, C.; Xue, W.F.; Lynch, I.; Lindman, S.; Thulin, E.; Radford, S.E.; Dawson, K.A. Nucleation of Protein Fibrillation by Nanoparticles. Proc. Natl. Acad. Sci. USA 2007, 104, 8691–8696. [Google Scholar] [CrossRef] [PubMed]
- John, T.; Gladytz, A.; Kubeil, C.; Martin, L.L.; Risselada, H.J.; Abel, B. Impact of Nanoparticles on Amyloid Peptide and Protein Aggregation: A Review with a Focus on Gold Nanoparticles. Nanoscale 2018, 10, 20894–20913. [Google Scholar] [CrossRef] [PubMed]
- Jean, L.; Lee, C.F.; Lee, C.; Shaw, M.; Vaux, D.J. Competing Discrete Interfacial Effects Are Critical for Amyloidogenesis. FASEB J. 2010, 24, 309–317. [Google Scholar] [CrossRef]
- Auer, S.; Trovato, A.; Vendruscolo, M. A Condensation-Ordering Mechanism in Nanoparticle-Catalyzed Peptide Aggregation. PLoS Comput. Biol. 2009, 5, e1000458. [Google Scholar] [CrossRef]
- Mahmoudi, M.; Lynch, I.; Ejtehadi, M.R.; Monopoli, M.P.; Bombelli, F.B.; Laurent, S. Protein-Nanoparticle Interactions: Opportunities and Challenges. Chem. Rev. 2011, 111, 5610–5637. [Google Scholar] [CrossRef]
- Mahmoudi, M.; Kalhor, H.R.; Laurent, S.; Lynch, I. Protein Fibrillation and Nanoparticle Interactions: Opportunities and Challenges. Nanoscale 2013, 5, 2570. [Google Scholar] [CrossRef]
- Shen, L.; Adachi, T.; Vanden Bout, D.; Zhu, X.Y. A Mobile Precursor Determines Amyloid-β Peptide Fibril Formation at Interfaces. J. Am. Chem. Soc. 2012, 134, 14172–14178. [Google Scholar] [CrossRef]
- Hajiraissi, R.; Hanke, M.; Yang, Y.; Duderija, B.; Gonzalez Orive, A.; Grundmeier, G.; Keller, A. Adsorption and Fibrillization of Islet Amyloid Polypeptide at Self-Assembled Monolayers Studied by QCM-D, AFM, and PM-IRRAS. Langmuir 2018, 34, 3517–3524. [Google Scholar] [CrossRef] [PubMed]
- Cheung, D.L. Effect of Surface Chemistry on Islet Amyloid Polypeptide Conformation. Biointerphases 2020, 15, 051001. [Google Scholar] [CrossRef] [PubMed]
- Vácha, R.; Linse, S.; Lund, M. Surface Effects on Aggregation Kinetics of Amyloidogenic Peptides. J. Am. Chem. Soc. 2014, 136, 11776–11782. [Google Scholar] [CrossRef]
- Radic, S.; Davis, T.P.; Ke, P.C.; Ding, F. Contrasting Effects of Nanoparticle–Protein Attraction on Amyloid Aggregation. RSC Adv. 2015, 5, 105489–105498. [Google Scholar] [CrossRef] [PubMed]
- Bhattacharya, S.; Xu, L.; Thompson, D. Revisiting the Earliest Signatures of Amyloidogenesis: Roadmaps Emerging from Computational Modeling and Experiment. WIREs Comput. Mol. Sci. 2018, 8, e1359. [Google Scholar] [CrossRef]
- Close, W.; Neumann, M.; Schmidt, A.; Hora, M.; Annamalai, K.; Schmidt, M.; Reif, B.; Schmidt, V.; Grigorieff, N.; Fändrich, M. Physical Basis of Amyloid Fibril Polymorphism. Nat. Commun. 2018, 9, 699. [Google Scholar] [CrossRef] [PubMed]
- Walsh, D.M.; Selkoe, D.J. Aβ Oligomers—A Decade of Discovery. J. Neurochem. 2007, 101, 1172–1184. [Google Scholar] [CrossRef]
- Taneja, V.; Verma, M.; Vats, A. Toxic Species in Amyloid Disorders: Oligomers or Mature Fibrils. Ann. Indian Acad. Neurol. 2015, 18, 138. [Google Scholar] [CrossRef]
- Hervás, R.; Oroz, J.; Galera-Prat, A.; Goñi, O.; Valbuena, A.; Vera, A.M.; Gómez-Sicilia, À.; Losada-Urzáiz, F.; Uversky, V.N.; Menéndez, M.; et al. Common Features at the Start of the Neurodegeneration Cascade. PLoS Biol. 2012, 10, e1001335. [Google Scholar] [CrossRef]
- Nagel-Steger, L.; Owen, M.C.; Strodel, B. An Account of Amyloid Oligomers: Facts and Figures Obtained from Experiments and Simulations. ChemBioChem 2016, 17, 657–676. [Google Scholar] [CrossRef]
- Ozboyaci, M.; Kokh, D.B.; Corni, S.; Wade, R.C. Modeling and Simulation of Protein-Surface Interactions: Achievements and Challenges. Q. Rev. Biophys. 2016, 49, 1–45. [Google Scholar] [CrossRef]
- Walsh, T.R. Pathways to Structure-Property Relationships of Peptide-Materials Interfaces: Challenges in Predicting Molecular Structures. Accounts Chem. Res. 2017, 50, 1617–1624. [Google Scholar] [CrossRef]
- Brancolini, G.; Corazza, A.; Vuano, M.; Fogolari, F.; Mimmi, M.C.; Bellotti, V.; Stoppini, M.; Corni, S.; Esposito, G. Probing the Influence of Citrate-Capped Gold Nanoparticles on an Amyloidogenic Protein. ACS Nano 2015, 9, 2600–2613. [Google Scholar] [CrossRef]
- Bellucci, L.; Ardèvol, A.; Parrinello, M.; Lutz, H.; Lu, H.; Weidner, T.; Corni, S. The Interaction with Gold Suppresses Fiber-like Conformations of the Amyloid β (16–22) Peptide. Nanoscale 2016, 8, 8737–8748. [Google Scholar] [CrossRef] [PubMed]
- Gladytz, A.; Abel, B.; Risselada, H.J. Gold-Induced Fibril Growth: The Mechanism of Surface-Facilitated Amyloid Aggregation. Angew. Chem. Int. Ed. 2016, 55, 11242–11246. [Google Scholar] [CrossRef] [PubMed]
- Bellucci, L.; Bussi, G.; Di Felice, R.; Corni, S. Fibrillation-Prone Conformations of the Amyloid-β-42 Peptide at the Gold/Water Interface. Nanoscale 2017, 9, 2279–2290. [Google Scholar] [CrossRef] [PubMed]
- Soltani, N.; Gholami, M.R. Increase in the β-Sheet Character of an Amyloidogenic Peptide upon Adsorption onto Gold and Silver Surfaces. ChemPhysChem 2017, 18, 526–536. [Google Scholar] [CrossRef]
- Wang, S.T.; Lin, Y.; Todorova, N.; Xu, Y.; Mazo, M.; Rana, S.; Leonardo, V.; Amdursky, N.; Spicer, C.D.; Alexander, B.D.; et al. Facet-Dependent Interactions of Islet Amyloid Polypeptide with Gold Nanoparticles: Implications for Fibril Formation and Peptide-Induced Lipid Membrane Disruption. Chem. Mater. 2017, 29, 1550–1560. [Google Scholar] [CrossRef]
- Tavanti, F.; Pedone, A.; Menziani, M.C. Disclosing the Interaction of Gold Nanoparticles with Aβ(1–40) Monomers through Replica Exchange Molecular Dynamics Simulations. Int. J. Mol. Sci. 2020, 22, 26. [Google Scholar] [CrossRef]
- Somers, K.P.; Cheung, D.L. The Amyloidogenic Peptide Amyloid Beta(16–22) Displays Facet Dependent Conformation on Metal Surfaces. Biophysica 2022, 2, 135–153. [Google Scholar] [CrossRef]
- Earl, D.J.; Deem, M.W. Parallel Tempering: Theory, Applications, and New Perspectives. Phys. Chem. Chem. Phys. 2005, 7, 3910–3916. [Google Scholar] [CrossRef] [PubMed]
- Laio, A.; Gervasio, F.L. Metadynamics: A Method to Simulate Rare Events and Reconstruct the Free Energy in Biophysics, Chemistry and Material Science. Rep. Prog. Phys. 2008, 71, 126601. [Google Scholar] [CrossRef]
- Ilie, I.M.; Caflisch, A. Simulation Studies of Amyloidogenic Polypeptides and Their Aggregates. Chem. Rev. 2019, 119, 6956–6993. [Google Scholar] [CrossRef] [PubMed]
- Strodel, B. Amyloid Aggregation Simulations: Challenges, Advances and Perspectives. Curr. Opin. Struct. Biol. 2021, 67, 145–152. [Google Scholar] [CrossRef] [PubMed]
- Matthes, D.; Gapsys, V.; Daebel, V.; De Groot, B.L. Mapping the Conformational Dynamics and Pathways of Spontaneous Steric Zipper Peptide Oligomerization. PLoS ONE 2011, 6, e19129. [Google Scholar] [CrossRef]
- Schor, M.; Mey, A.S.J.S.; Noé, F.; Macphee, C.E. Shedding Light on the Dock-Lock Mechanism in Amyloid Fibril Growth Using Markov State Models. J. Phys. Chem. Lett. 2015, 6, 1076–1081. [Google Scholar] [CrossRef] [PubMed]
- Srivastava, A.; Balaji, P.V. Molecular Events during the Early Stages of Aggregation of GNNQQNY: An All Atom MD Simulation Study of Randomly Dispersed Peptides. J. Struct. Biol. 2015, 192, 376–391. [Google Scholar] [CrossRef] [PubMed]
- Wang, Q.; Zhao, C.; Zhao, J.; Wang, J.; Yang, J.C.; Yu, X.; Zheng, J. Comparative Molecular Dynamics Study of Aβ Adsorption on the Self-Assembled Monolayers. Langmuir 2010, 26, 3308–3316. [Google Scholar] [CrossRef]
- Zhao, J.; Wang, Q.; Liang, G.; Zheng, J. Molecular Dynamics Simulations of Low-Ordered Alzheimer β-Amyloid Oligomers from Dimer to Hexamer on Self-Assembled Monolayers. Langmuir 2011, 27, 14876–14887. [Google Scholar] [CrossRef]
- Kang, S.g.; Li, H.; Huynh, T.; Zhang, F.; Xia, Z.; Zhang, Y.; Zhou, R. Molecular Mechanism of Surface-Assisted Epitaxial Self-Assembly of Amyloid-like Peptides. ACS Nano 2012, 6, 9276–9282. [Google Scholar] [CrossRef]
- John, T.; Adler, J.; Elsner, C.; Petzold, J.; Krueger, M.; Martin, L.L.; Huster, D.; Risselada, H.J.; Abel, B. Mechanistic Insights into the Size-Dependent Effects of Nanoparticles on Inhibiting and Accelerating Amyloid Fibril Formation. J. Colloid Interface Sci. 2022, 622, 804–818. [Google Scholar] [CrossRef]
- Gladytz, A.; Wagner, M.; Häupl, T.; Elsner, C.; Abel, B. Structure-Making Effects of Metal Nanoparticles in Amyloid Peptide Fibrillation. Part. Part. Syst. Charact. 2015, 32, 573–582. [Google Scholar] [CrossRef]
- Hamley, I.W. The Amyloid Beta Peptide: A Chemist’s Perspective. Role in Alzheimer’s and Fibrillization. Chem. Rev. 2012, 112, 5147–5192. [Google Scholar] [CrossRef] [PubMed]
- Fan, J.; Cheng, Y.; Sun, M. Functionalized Gold Nanoparticles: Synthesis, Properties and Biomedical Applications. Chem. Rec. 2020, 20, 1474–1504. [Google Scholar] [CrossRef]
- Martínez, L.; Andrade, R.; Birgin, E.G.; Martínez, J.M. PACKMOL: A Package for Building Initial Configurations for Molecular Dynamics Simulations. J. Comput. Chem. 2009, 30, 2157–2164. [Google Scholar] [CrossRef] [PubMed]
- Wright, L.B.; Rodger, P.M.; Corni, S.; Walsh, T.R. GolP-CHARMM: First-principles Based Force Fields for the Interaction of Proteins with Au(111) and Au(100). J. Chem. Theory Comput. 2013, 9, 1616–1630. [Google Scholar] [CrossRef] [PubMed]
- MacKerell, A.D.; Bashford, D.; Dunbrack, R.L.; Evanseck, J.D.; Field, M.J.; Fischer, S.; Gao, J.; Guo, H.; Ha, S.; Joseph-McCarthy, D.; et al. All-Atom Empirical Potential for Molecular Modeling and Dynamics Studies of Proteins †. J. Phys. Chem. 1998, 102, 3586–3616. [Google Scholar] [CrossRef]
- Bjelkmar, P.; Larsson, P.; Cuendet, M.A.; Hess, B.; Lindahl, E. Implementation of the {CHARMM} Force Field in {GROMACS}: Analysis of Protein Stability Effects from Correction Maps, Virtual Interaction Sites, and Water Models. J. Chem. Theory Comput. 2010, 6, 459–466. [Google Scholar] [CrossRef] [PubMed]
- Piana, S.; Lindorff-Larsen, K.; Shaw, D.E. How Robust Are Protein Folding Simulations with Respect to Force Field Parameterization? Biophys. J. 2011, 100, L47–L49. [Google Scholar] [CrossRef]
- Mark, P.; Nilsson, L. Structure and Dynamics of the TIP3P, SPC, and SPC/E Water Models at 298 K. J. Phys. Chem. 2001, 105, 9954–9960. [Google Scholar] [CrossRef]
- Iori, F.; Corni, S. Including Image Charge Effects in the Molecular Dynamics Simulations of Molecules on Metal Surfaces. J. Comput. Chem. 2008, 29, 1656–1666. [Google Scholar] [CrossRef]
- Bussi, G.; Donadio, D.; Parrinello, M. Canonical Sampling through Velocity Rescaling. J. Chem. Phys. 2007, 126, 014101. [Google Scholar] [CrossRef] [PubMed]
- Parrinello, M.; Rahman, A. Polymorphic Transitions in Single Crystals: A New Molecular Dynamics Method. J. Appl. Phys. 1981, 52, 7182–7190. [Google Scholar] [CrossRef]
- Essmann, U.; Perera, L.; Berkowitz, M.L.; Darden, T.; Lee, H.; Pedersen, L.G. A Smooth Particle Mesh Ewald Method. J. Chem. Phys. 1995, 103, 8577. [Google Scholar] [CrossRef]
- Hess, B.; Bekker, H.; Berendsen, H.J.C.; Fraaije, J.G.E.M. LINCS: A Linear Constraint Solver for Molecular Simulations. J. Comput. Chem. 1997, 18, 1463–1472. [Google Scholar] [CrossRef]
- Van Der Spoel, D.; Lindahl, E.; Hess, B.; Groenhof, G.; Mark, A.E.; Berendsen, H.J.C. GROMACS: Fast, Flexible, and Free. J. Comput. Chem. 2005, 26, 1701–1718. [Google Scholar] [CrossRef]
- Abraham, M.J.; Murtola, T.; Schulz, R.; Páll, S.; Smith, J.C.; Hess, B.; Lindahl, E. GROMACS: High Performance Molecular Simulations through Multi-Level Parallelism from Laptops to Supercomputers. SoftwareX 2015, 1–2, 19–25. [Google Scholar] [CrossRef]
- Michaud-Agrawal, N.; Denning, E.J.; Woolf, T.B.; Beckstein, O. MDAnalysis: A Toolkit for the Analysis of MolecularDynamics Simulations. J. Comput. Chem. 2011, 32, 2319–2327. [Google Scholar] [CrossRef]
- Humphrey, W.; Dalke, A.; Schulten, K. VMD: Visual Molecular Dynamics. J. Mol. Graph. 1996, 14, 33–38. [Google Scholar] [CrossRef]
- Colletier, J.P.; Laganowsky, A.; Landau, M.; Zhao, M.; Soriaga, A.B.; Goldschmidt, L.; Flot, D.; Cascio, D.; Sawaya, M.R.; Eisenberg, D. Molecular Basis for Amyloid-β Polymorphism. Proc. Natl. Acad. Sci. USA 2011, 108, 16938–16943. [Google Scholar] [CrossRef]
- Meisl, G.; Kirkegaard, J.B.; Arosio, P.; Michaels, T.C.T.; Vendruscolo, M.; Dobson, C.M.; Linse, S.; Knowles, T.P.J. Molecular Mechanisms of Protein Aggregation from Global Fitting of Kinetic Models. Nat. Protoc. 2016, 11, 252–272. [Google Scholar] [CrossRef] [PubMed]
- Palafox-Hernandez, J.P.; Tang, Z.; Hughes, Z.E.; Li, Y.; Swihart, M.T.; Prasad, P.N.; Walsh, T.R.; Knecht, M.R. Comparative Study of Materials-Binding Peptide Interactions with Gold and Silver Surfaces and Nanostructures: A Thermodynamic Basis for Biological Selectivity of Inorganic Materials. Chem. Mater. 2014, 26, 4960–4969. [Google Scholar] [CrossRef]
- Futera, Z.; Blumberger, J. Adsorption of Amino Acids on Gold: Assessing the Accuracy of the GolP-CHARMM Force Field and Parametrization of Au–S Bonds. J. Chem. Theory Comput. 2019, 15, 613–624. [Google Scholar] [CrossRef] [PubMed]
- Balbach, J.J.; Ishii, Y.; Antzutkin, O.N.; Leapman, R.D.; Rizzo, N.W.; Dyda, F.; Reed, J.; Tycko, R. Amyloid Fibril Formation by Aβ 16-22, a Seven-Residue Fragment of the Alzheimer’s β-Amyloid Peptide, and Structural Characterization by Solid State NMR. Biochemistry 2000, 39, 13748–13759. [Google Scholar] [CrossRef]
- Li, H.; Luo, Y.; Derreumaux, P.; Wei, G. Carbon Nanotube Inhibits the Formation of β-Sheet-Rich Oligomers of the Alzheimer’s Amyloid-β(16-22) Peptide. Biophys. J. 2011, 101, 2267–2276. [Google Scholar] [CrossRef] [PubMed]
- Tjernberg, L.O.; Näslund, J.; Lindqvist, F.; Johansson, J.; Karlström, A.R.; Thyberg, J.; Terenius, L.; Nordstedt, C. Arrest of -Amyloid Fibril Formation by a Pentapeptide Ligand. J. Biol. Chem. 1996, 271, 8545–8548. [Google Scholar] [CrossRef] [PubMed]
- Hajiraissi, R.; Hanke, M.; Gonzalez Orive, A.; Duderija, B.; Hofmann, U.; Zhang, Y.; Grundmeier, G.; Keller, A. Effect of Terminal Modifications on the Adsorption and Assembly of hIAPP(20–29). ACS Omega 2019, 4, 2649–2660. [Google Scholar] [CrossRef] [PubMed]
- Morriss-Andrews, A.; Shea, J.E. Simulations of Protein Aggregation: Insights from Atomistic and Coarse-Grained Models. J. Phys. Chem. Lett. 2014, 5, 1899–1908. [Google Scholar] [CrossRef]
- Illig, A.M.; Strodel, B. Performance of Markov State Models and Transition Networks on Characterizing Amyloid Aggregation Pathways from MD Data. J. Chem. Theory Comput. 2020, 16, 7825–7839. [Google Scholar] [CrossRef]
- Peter, E.K.; Shea, J.E. An Adaptive Bias – Hybrid MD/kMC Algorithm for Protein Folding and Aggregation. Phys. Chem. Chem. Phys. 2017, 19, 17373–17382. [Google Scholar] [CrossRef]
Figure 1.
Initial peptide conformations for solution (left) and Au111 surface (right). Backbone secondary structure shown in cartoon form, with white denoting coil and turquoise turn.
Figure 1.
Initial peptide conformations for solution (left) and Au111 surface (right). Backbone secondary structure shown in cartoon form, with white denoting coil and turquoise turn.

Figure 2.
(a) Variation in largest oligomer size for Nmol = 4 (left), Nmol = 6 (middle), and Nmol = 8 (right) simulations. Red and green denote surface simulations and blue and gold denote solution simulations. (b) Histograms of oligomer sizes for Nmol = 4 (left), Nmol = 6 (middle), and. Nmol = 8 (right) simulations, calculated over the last 100 ns of each simulation. Colours as in (a).

Figure 3.
Snapshots showing evolution of oligomer structure of A(16–22) on Au111 surface. (Top) panel shows Nmol = 4, (bottom) Nmol = 8. In all snapshots phenylalanine, glutamic acid, and lysine residues highlighted in blue, red, and green, respectively.
Figure 3.
Snapshots showing evolution of oligomer structure of A(16–22) on Au111 surface. (Top) panel shows Nmol = 4, (bottom) Nmol = 8. In all snapshots phenylalanine, glutamic acid, and lysine residues highlighted in blue, red, and green, respectively.

Figure 4.
Snapshots showing evolution of oligomer structure of A(16–22) in bulk solution. (Top) panel shows Nmol = 4, (bottom) Nmol = 8. In all snapshots hydrophobic residues are highlighted.
Figure 4.
Snapshots showing evolution of oligomer structure of A(16–22) in bulk solution. (Top) panel shows Nmol = 4, (bottom) Nmol = 8. In all snapshots hydrophobic residues are highlighted.

Figure 5.
(a) End simulation snapshots for A(16–22) on Au111 surface for Nmol = 4 (top), Nmol = 6 (middle), and Nmol = 8 (bottom). In all cases, phenylalanine, glutamic acid, and lysine residues are highlighted in blue, reg, and green, respectively; (b) Oligomer gyration tensor eigenvalues for A(16–22) on Au111 surface. Red, green, and blue denote , , and , respectively. Dashed lines show gyration tensor eigenvalues for single molecules; (c) Residue-residue contact maps for Nmol = 4 (top), Nmo l= 6 (middle), and Nmol = 8 (bottom) for A(16–22) on Au111 surface.

Figure 6.
Residue centre-of-mass average z coordinates for A(16–22) on Au111 surface for Nmol = 4 (top), Nmol = 6 (middle), and Nmol = 8 (right). Magenta, red, blue, green, cyan, and gold denote lysine, leucine, valine, phenylalanine, alanine, and glutamic acid residues, respectively.
Figure 6.
Residue centre-of-mass average z coordinates for A(16–22) on Au111 surface for Nmol = 4 (top), Nmol = 6 (middle), and Nmol = 8 (right). Magenta, red, blue, green, cyan, and gold denote lysine, leucine, valine, phenylalanine, alanine, and glutamic acid residues, respectively.

Figure 7.
(a) End simulation snapshots for A(16–22) in solution for Nmol = 4 (top), Nmol = 6 (middle), and Nmol = 8 (bottom). In all cases, the peptide backbone represented in the cartoon and hydrophobic residues are highlighted; (b) Oligomer gyration tensor eigenvalues for A(16–22) in solution. Red, green, and blue denote , , and , respectively. Dashed lines show gyration tensor eigenvalues for single molecules; (c) Residue-residue contact maps for Nmol = 4 (top), Nmol = 6 (middle), and Nmol = 8 (bottom) for A(16–22) in solution.

Figure 8.
Hydrogen bonding maps from simulations of A(16–22) for Nmol = 4 (top), Nmol = 6 (middle), and Nmol = 8 (bottom). The leftmost two columns are simulations on the Au111 surface and the rightmost two columns are from simulations in bulk solution.
Figure 8.
Hydrogen bonding maps from simulations of A(16–22) for Nmol = 4 (top), Nmol = 6 (middle), and Nmol = 8 (bottom). The leftmost two columns are simulations on the Au111 surface and the rightmost two columns are from simulations in bulk solution.

Figure 9.
Histograms of DRMSD between fibril (left) and surface (right) for Nmol = 4 (top), Nmol = 6 (middle), and Nmol = 8 (bottom). Red and green denote surface simulations and blue and gold denote solution simulations.
Figure 9.
Histograms of DRMSD between fibril (left) and surface (right) for Nmol = 4 (top), Nmol = 6 (middle), and Nmol = 8 (bottom). Red and green denote surface simulations and blue and gold denote solution simulations.

Figure 10.
Ramachandran plots from simulations of A(16–22) for Nmol = 4 (top), Nmol = 6 (middle), and Nmol = 8 (bottom). The leftmost two columns are simulations on the Au111 surface and the rightmost two columns are from simulations in bulk solution.
Figure 10.
Ramachandran plots from simulations of A(16–22) for Nmol = 4 (top), Nmol = 6 (middle), and Nmol = 8 (bottom). The leftmost two columns are simulations on the Au111 surface and the rightmost two columns are from simulations in bulk solution.

Figure 11.
(a) Simulation snapshots for oligomer adsorption, taken from Nmol = 4 run1 (top) and Nmol = 8, run1 (bottom). (b) Protein centre-of-mass z coordinates from (top to bottom) Nmol = 4, Nmol = 6, and Nmol = 8. Left and right-hand columns show runs 1 and 2 for each system, respectively.
Figure 11.
(a) Simulation snapshots for oligomer adsorption, taken from Nmol = 4 run1 (top) and Nmol = 8, run1 (bottom). (b) Protein centre-of-mass z coordinates from (top to bottom) Nmol = 4, Nmol = 6, and Nmol = 8. Left and right-hand columns show runs 1 and 2 for each system, respectively.

Figure 12.
(a) Gyration tensor eigenvalues for aggregate adsorption simulations. Red, green, and blue denote , , and , respectively. (b) Contact maps for aggregate adsorption simulations for Nmol = 4 (top), Nmol = 6 (middle), and Nmol = 8 (bottom). Left and right-hand columns show runs 1 and 2 for each system, respectively.

Figure 13.
Residue centre-of-mass average z coordinates for aggregate adsorption simulations for A(16–22) on Au111 surface for Nmol = 4 (top), Nmol = 6 (middle), and Nmol = 8 (right). Magenta, red, blue, green, cyan, and gold denote lysine, leucine, valine, phenylalanine, alanine, and glutamic acid residues, respectively.

Figure 14.
Histograms of DRMSD between fibril (left) and surface (right) for Nmol = 4 (top), Nmol = 6 (middle), and Nmol = 8 (bottom). Solid lines denote histograms calculated for all peptides, dotted lines those calculated for peptides in contact with the surface.
Figure 14.
Histograms of DRMSD between fibril (left) and surface (right) for Nmol = 4 (top), Nmol = 6 (middle), and Nmol = 8 (bottom). Solid lines denote histograms calculated for all peptides, dotted lines those calculated for peptides in contact with the surface.

Disclaimer/Publisher’s Note: The statements, opinions and data contained in all publications are solely those of the individual author(s) and contributor(s) and not of MDPI and/or the editor(s). MDPI and/or the editor(s) disclaim responsibility for any injury to people or property resulting from any ideas, methods, instructions or products referred to in the content. |
© 2023 by the author. Licensee MDPI, Basel, Switzerland. This article is an open access article distributed under the terms and conditions of the Creative Commons Attribution (CC BY) license (https://creativecommons.org/licenses/by/4.0/).
Share and Cite
MDPI and ACS Style
Cheung, D.L. Aggregation of an Amyloidogenic Peptide on Gold Surfaces. Biomolecules 2023, 13, 1261. https://doi.org/10.3390/biom13081261
AMA Style
Cheung DL. Aggregation of an Amyloidogenic Peptide on Gold Surfaces. Biomolecules. 2023; 13(8):1261. https://doi.org/10.3390/biom13081261
Chicago/Turabian StyleCheung, David L. 2023. "Aggregation of an Amyloidogenic Peptide on Gold Surfaces" Biomolecules 13, no. 8: 1261. https://doi.org/10.3390/biom13081261
Note that from the first issue of 2016, this journal uses article numbers instead of page numbers. See further details here.