
The IP6K Inhibitor LI-2242 Ameliorates Diet-Induced Obesity, Hyperglycemia, and Hepatic Steatosis in Mice by Improving Cell Metabolism and Insulin Signaling
 and
and 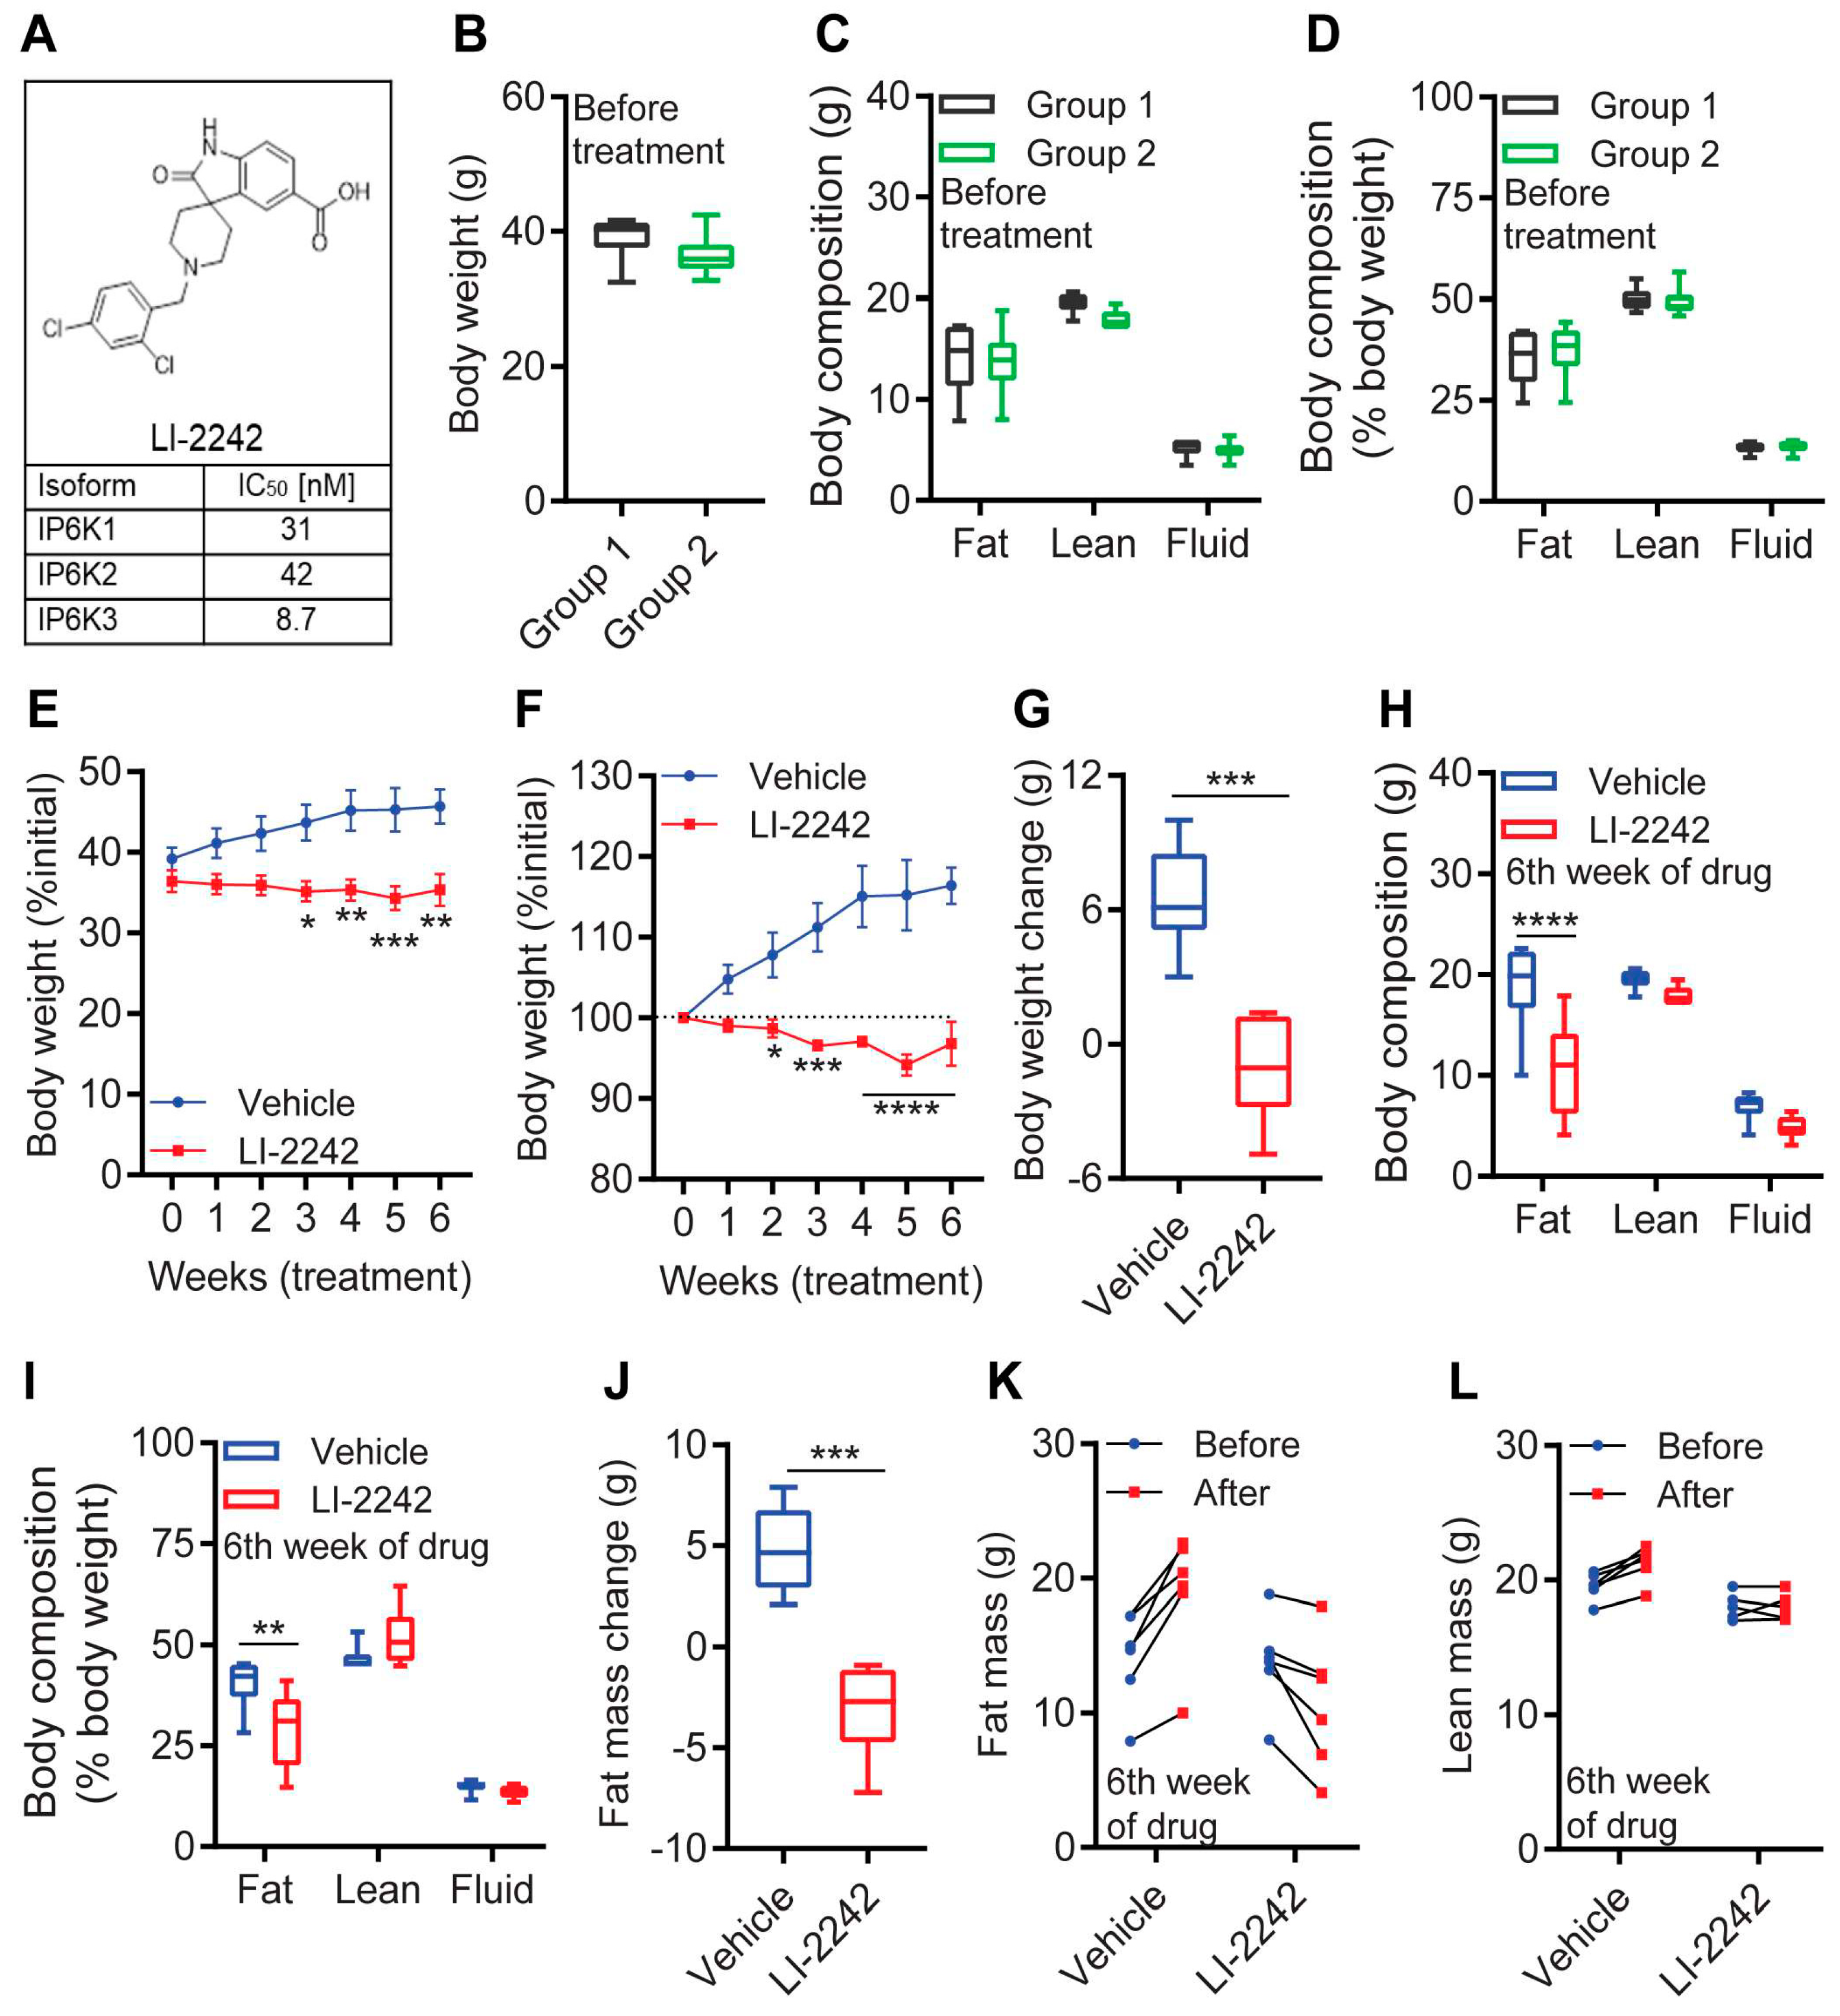
Abstract
:1. Introduction
2. Materials and Methods
3. Results
3.1. LI-2242 Ameliorates Obesity in DIO Mice via a Specific Reduction in Body Fat
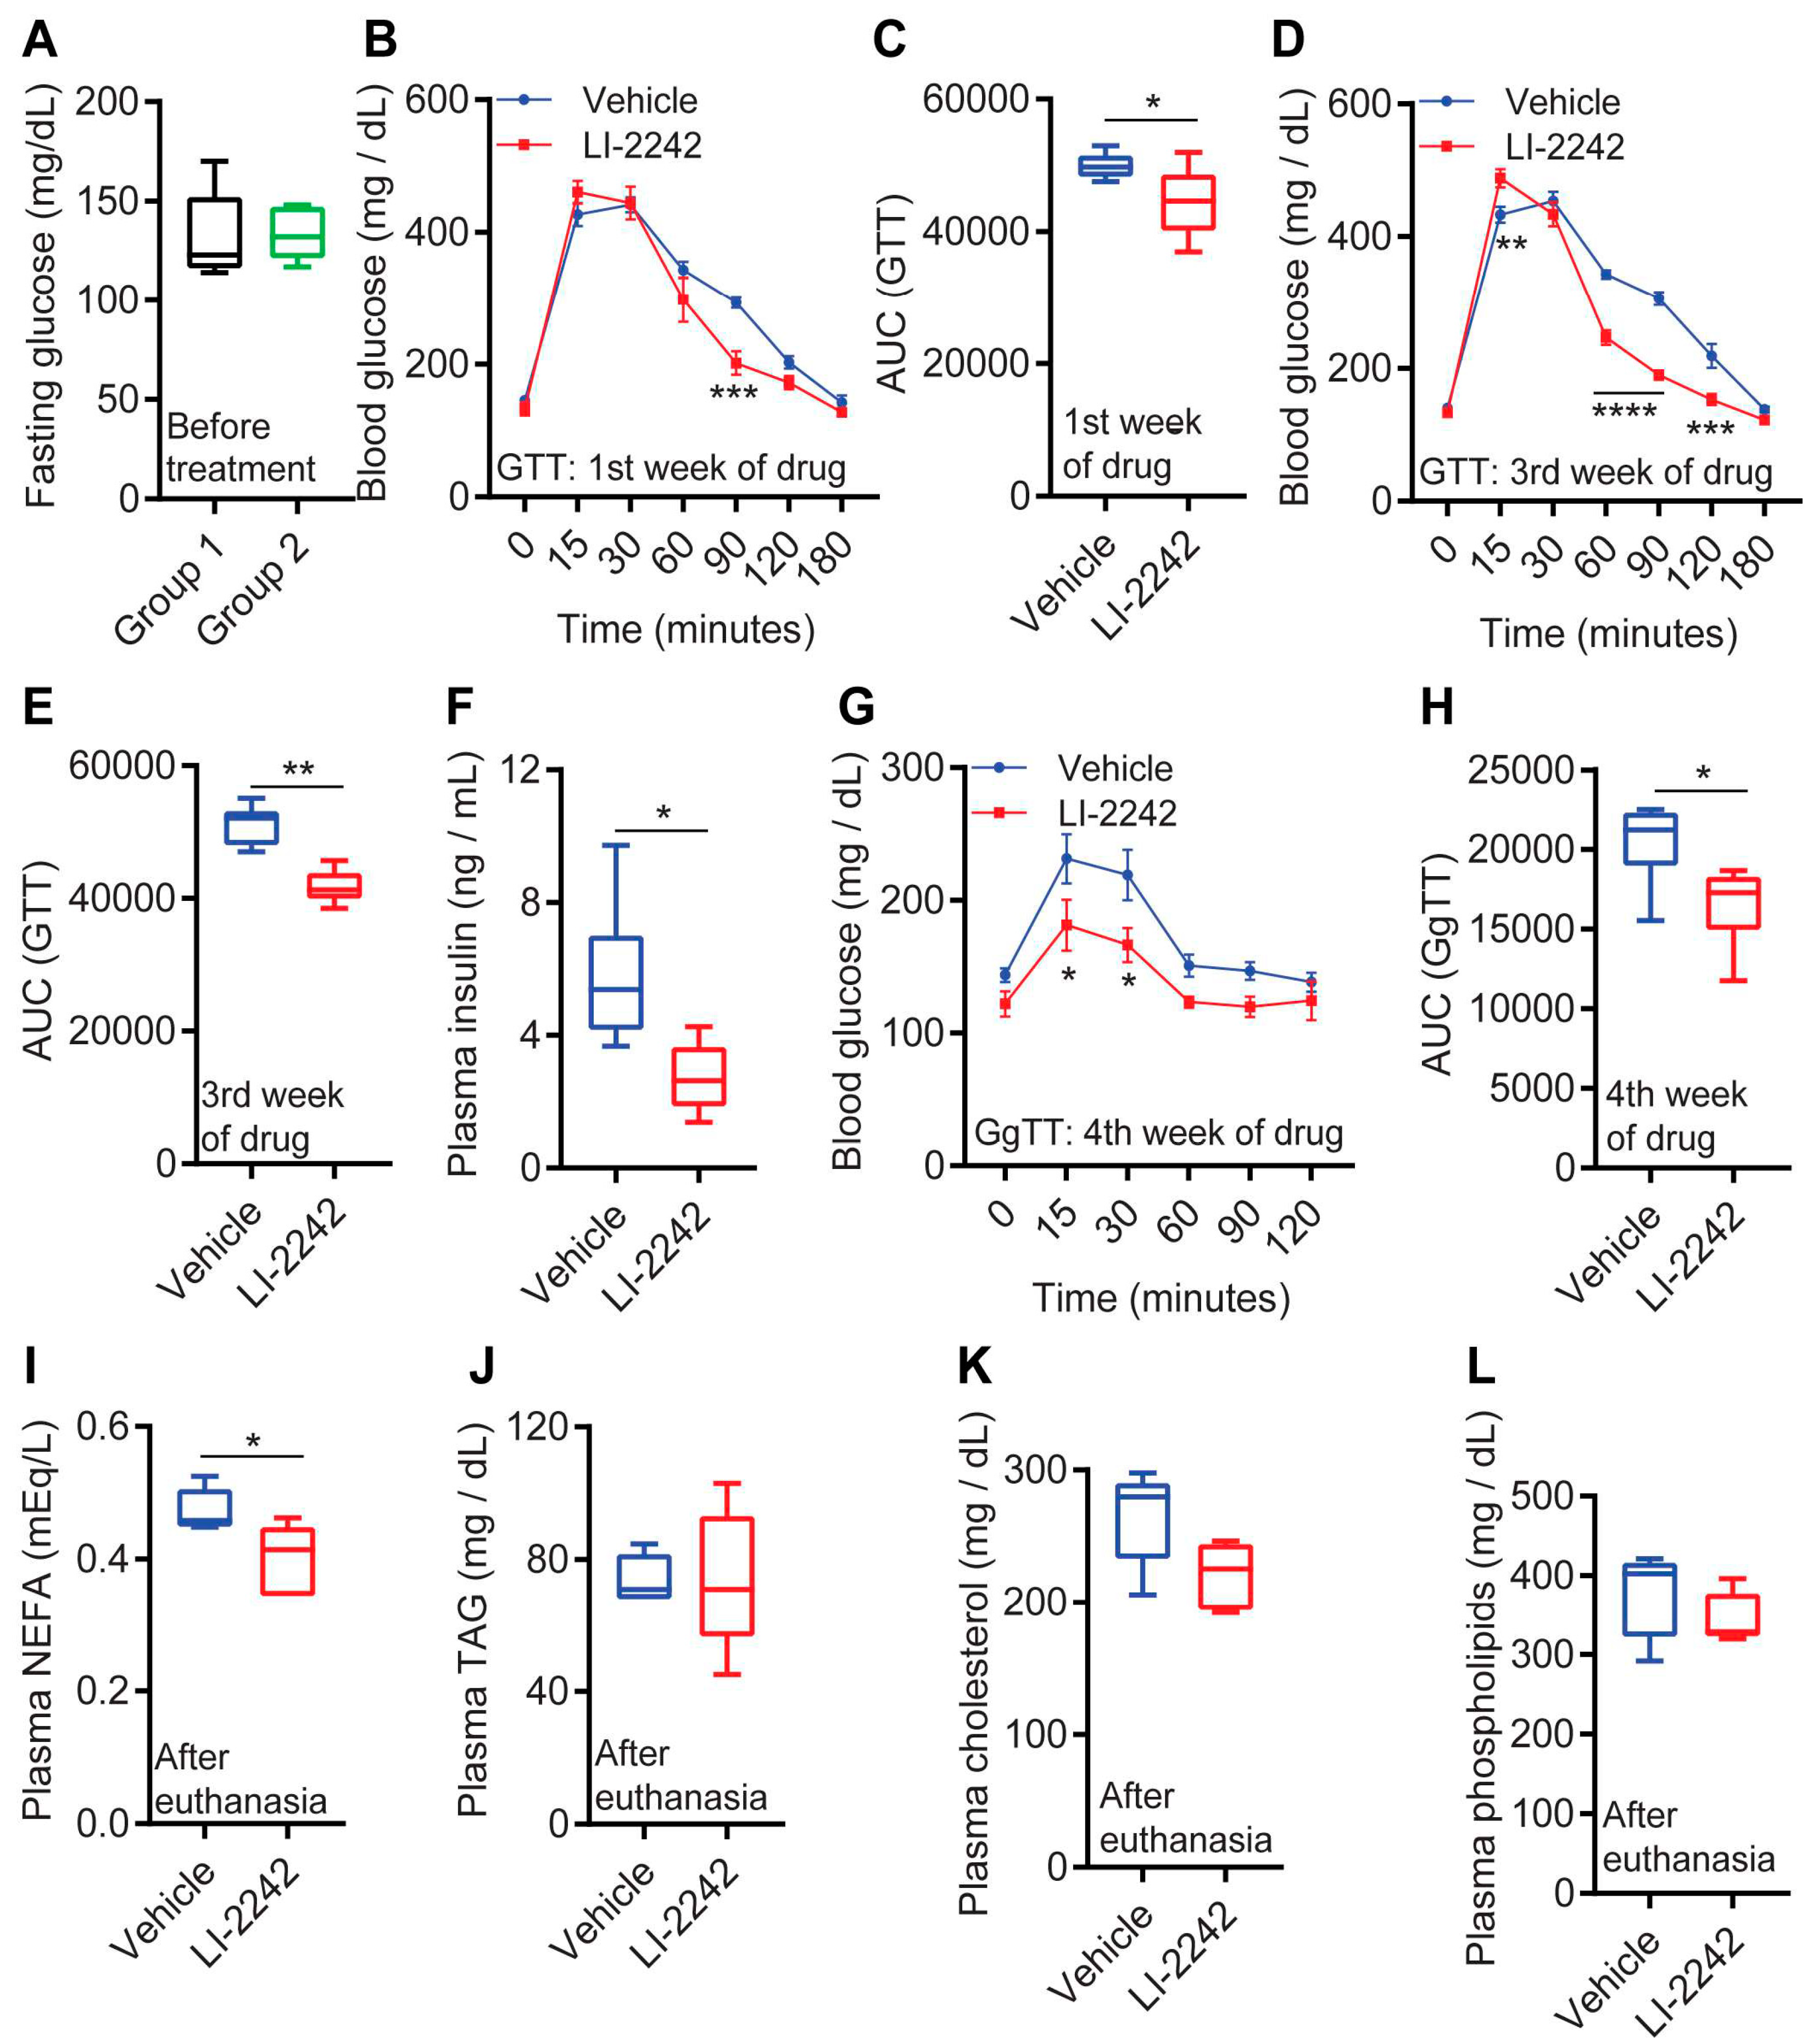
3.2. LI-2242 Improves Glycemic Parameters in DIO Mice
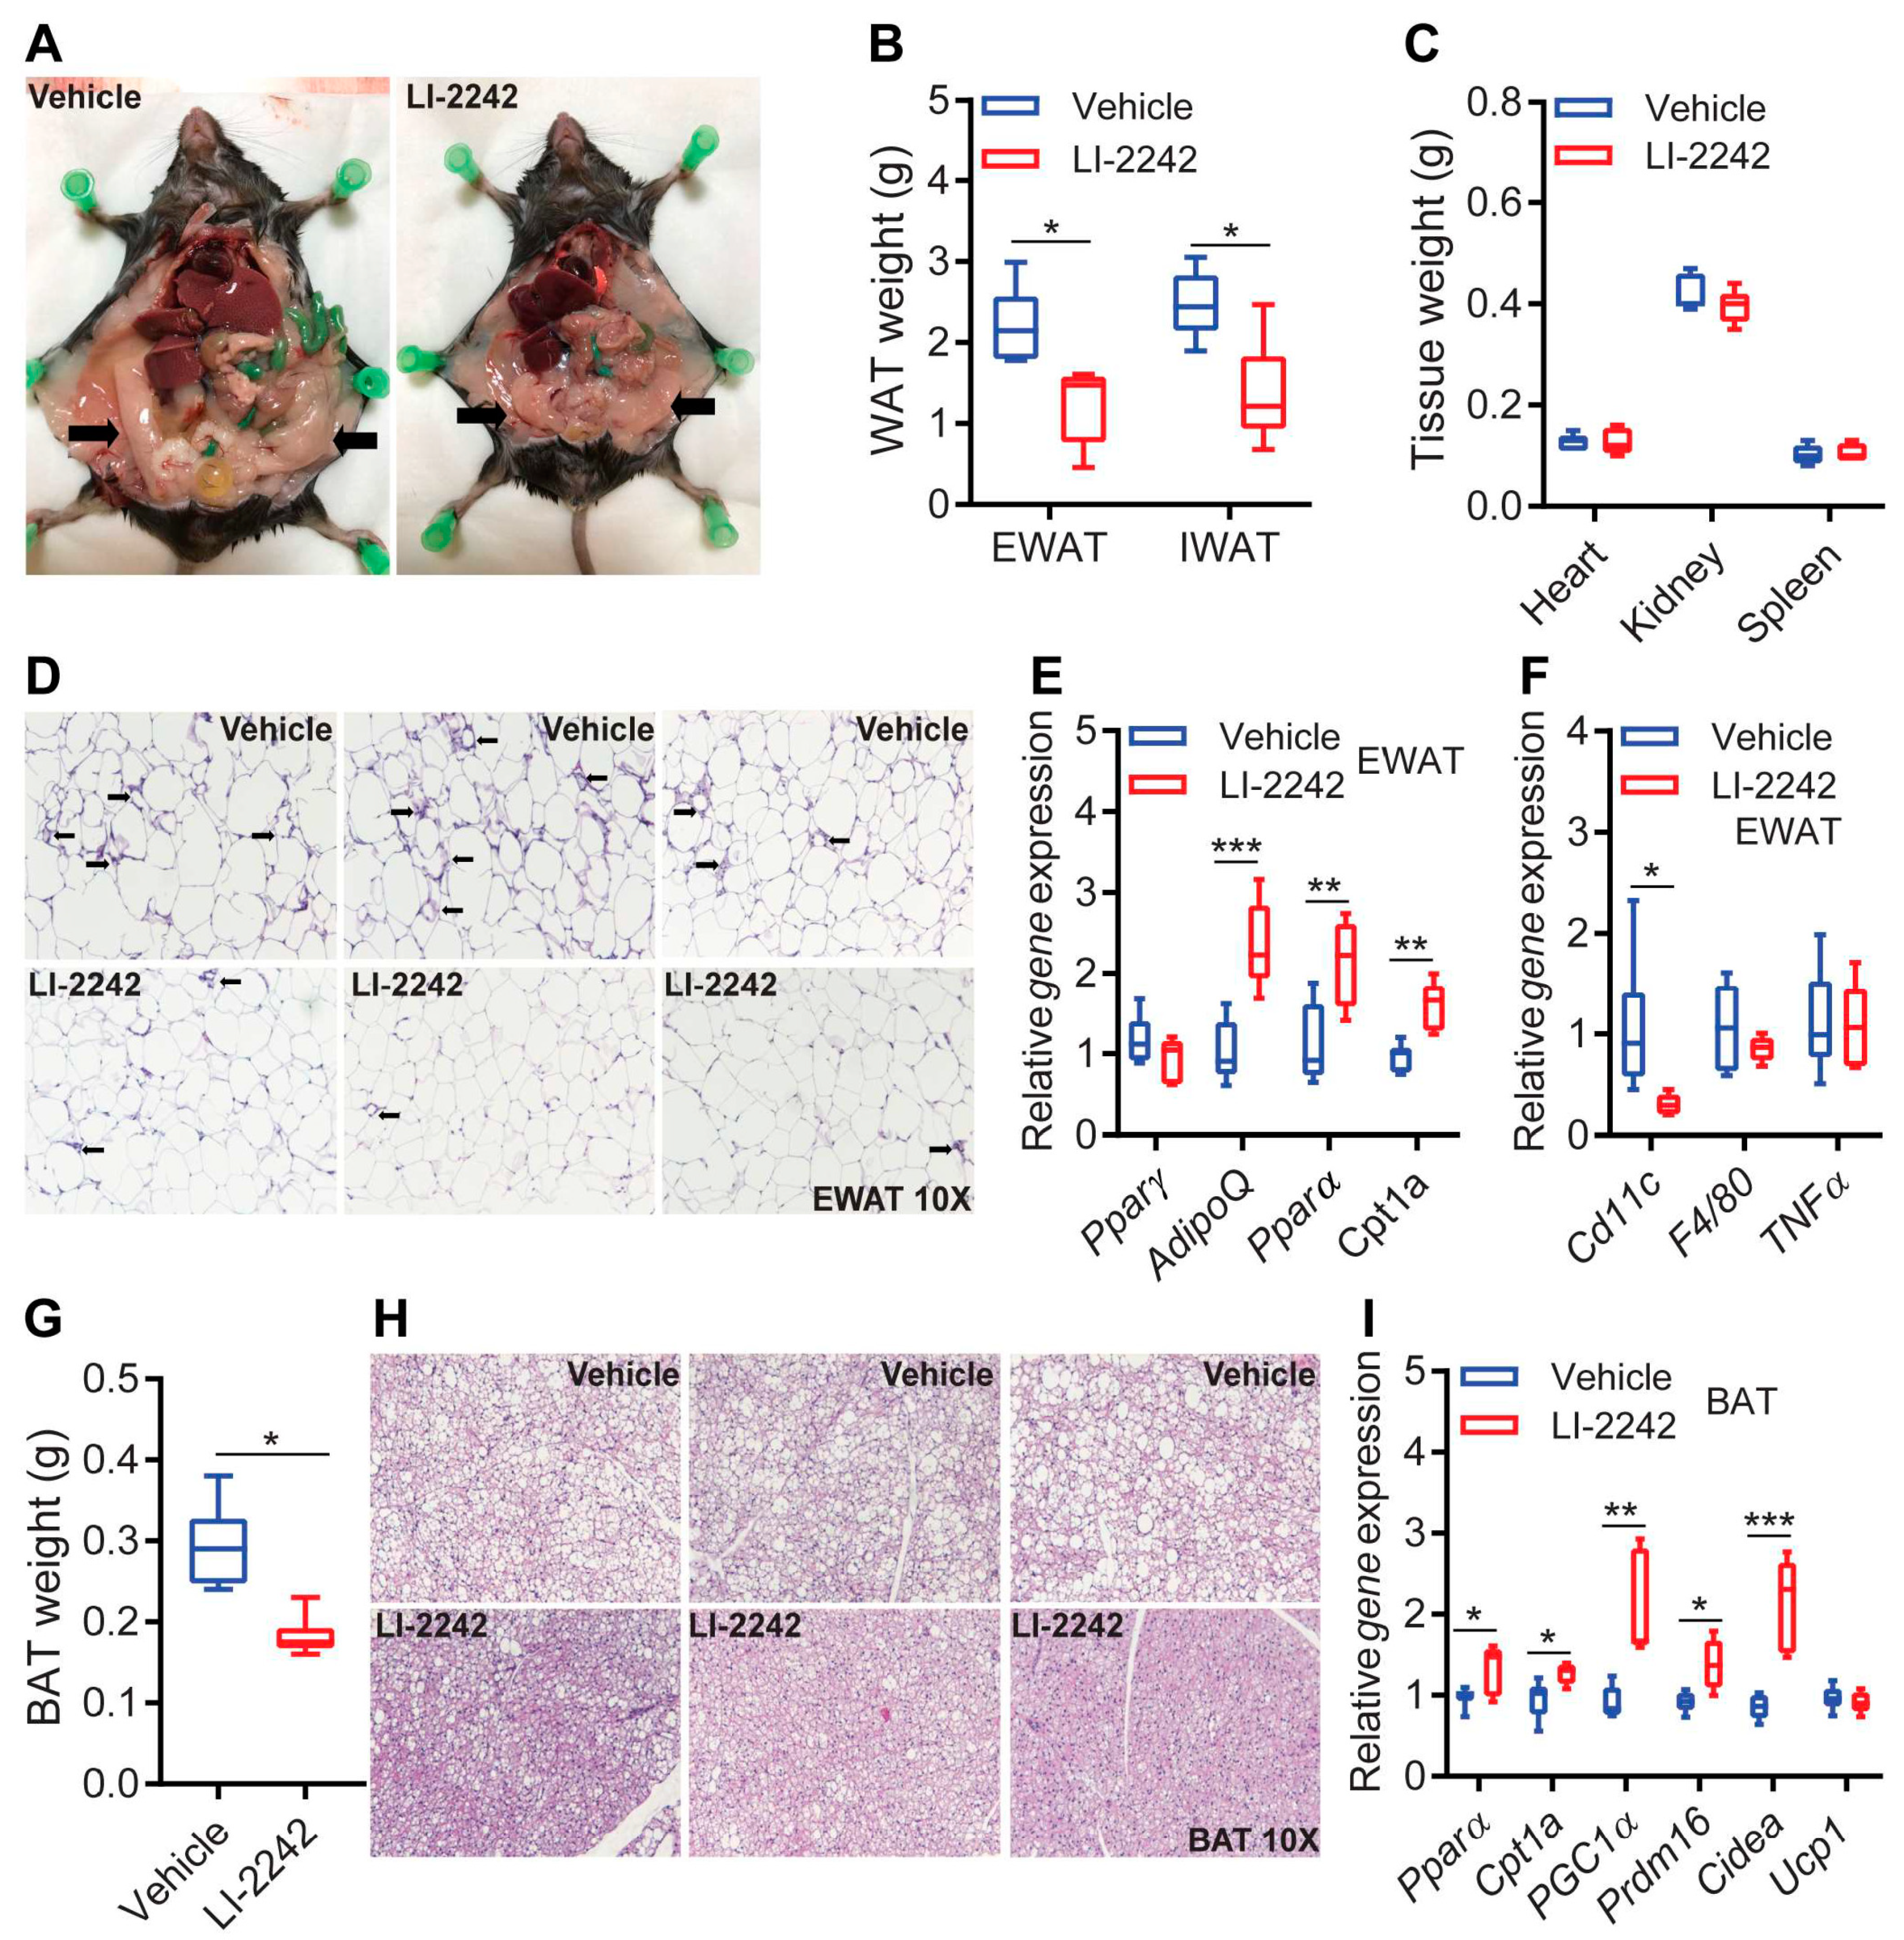
3.3. LI-2242 Treatment Improves Metabolic Parameters in the Adipose Tissue of DIO Mice
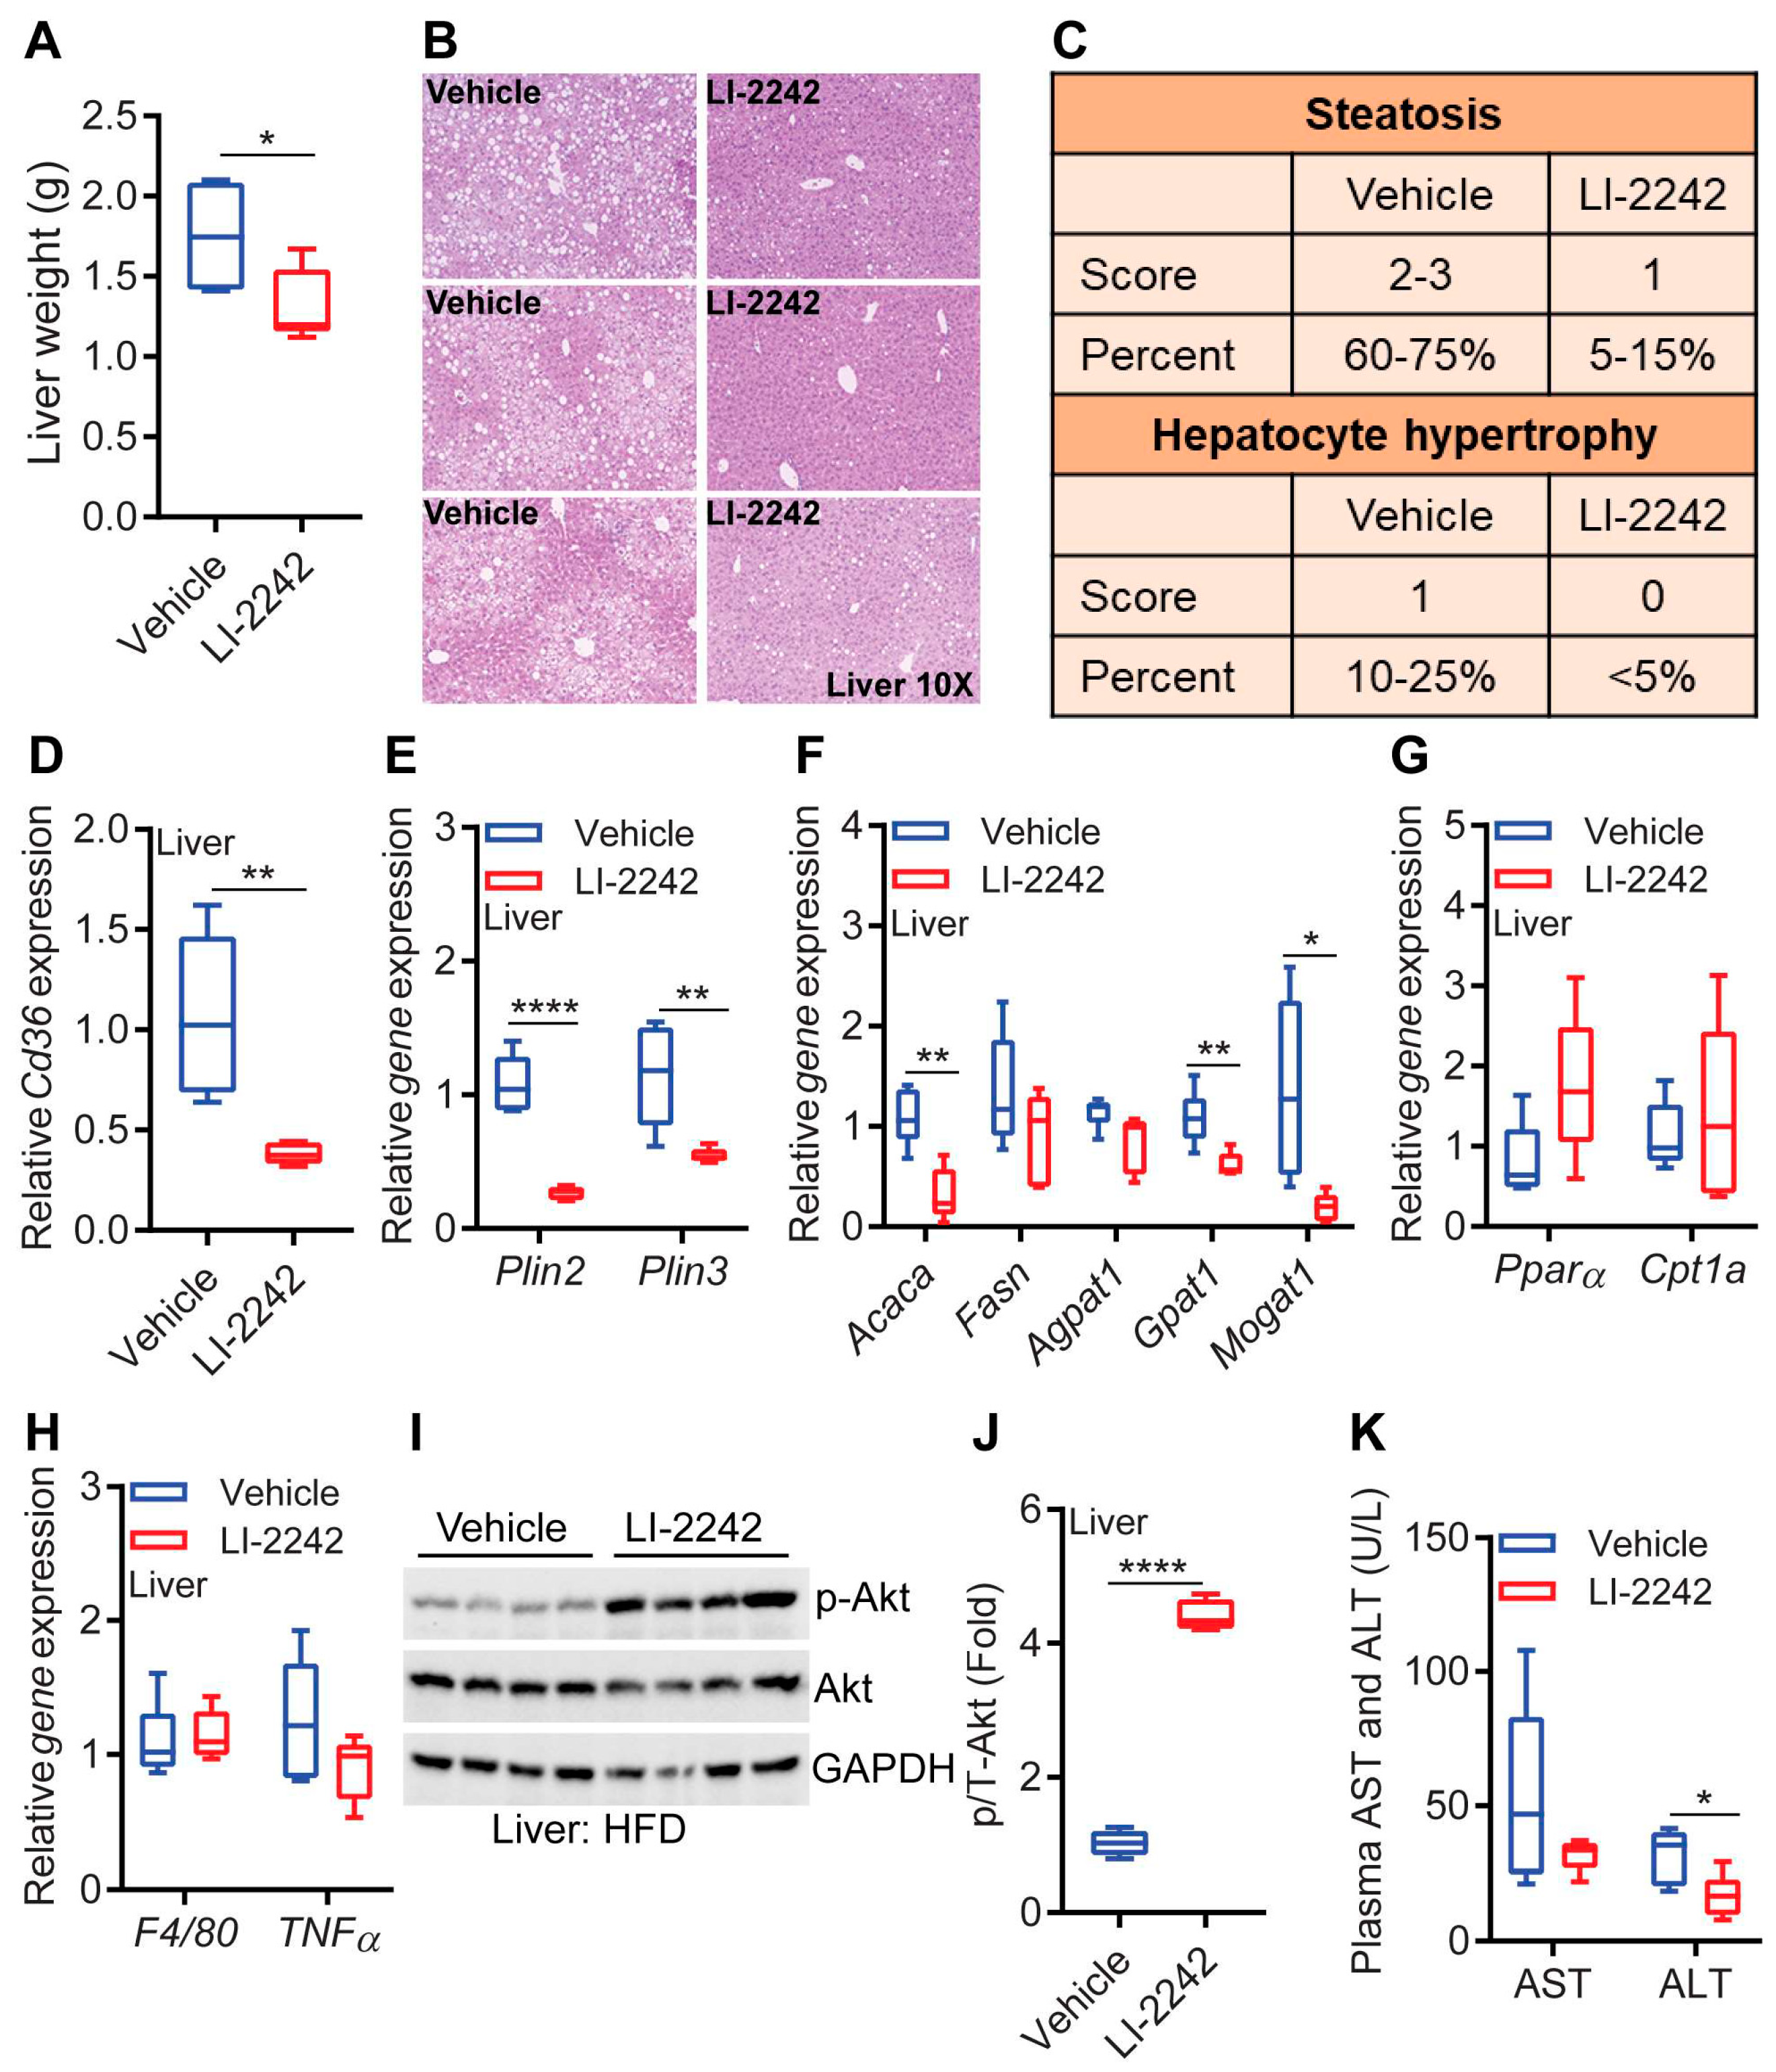
3.4. LI-2242 Treatment Ameliorates Steatosis, Insulin Resistance, and Injury of the Liver in DIO Mice
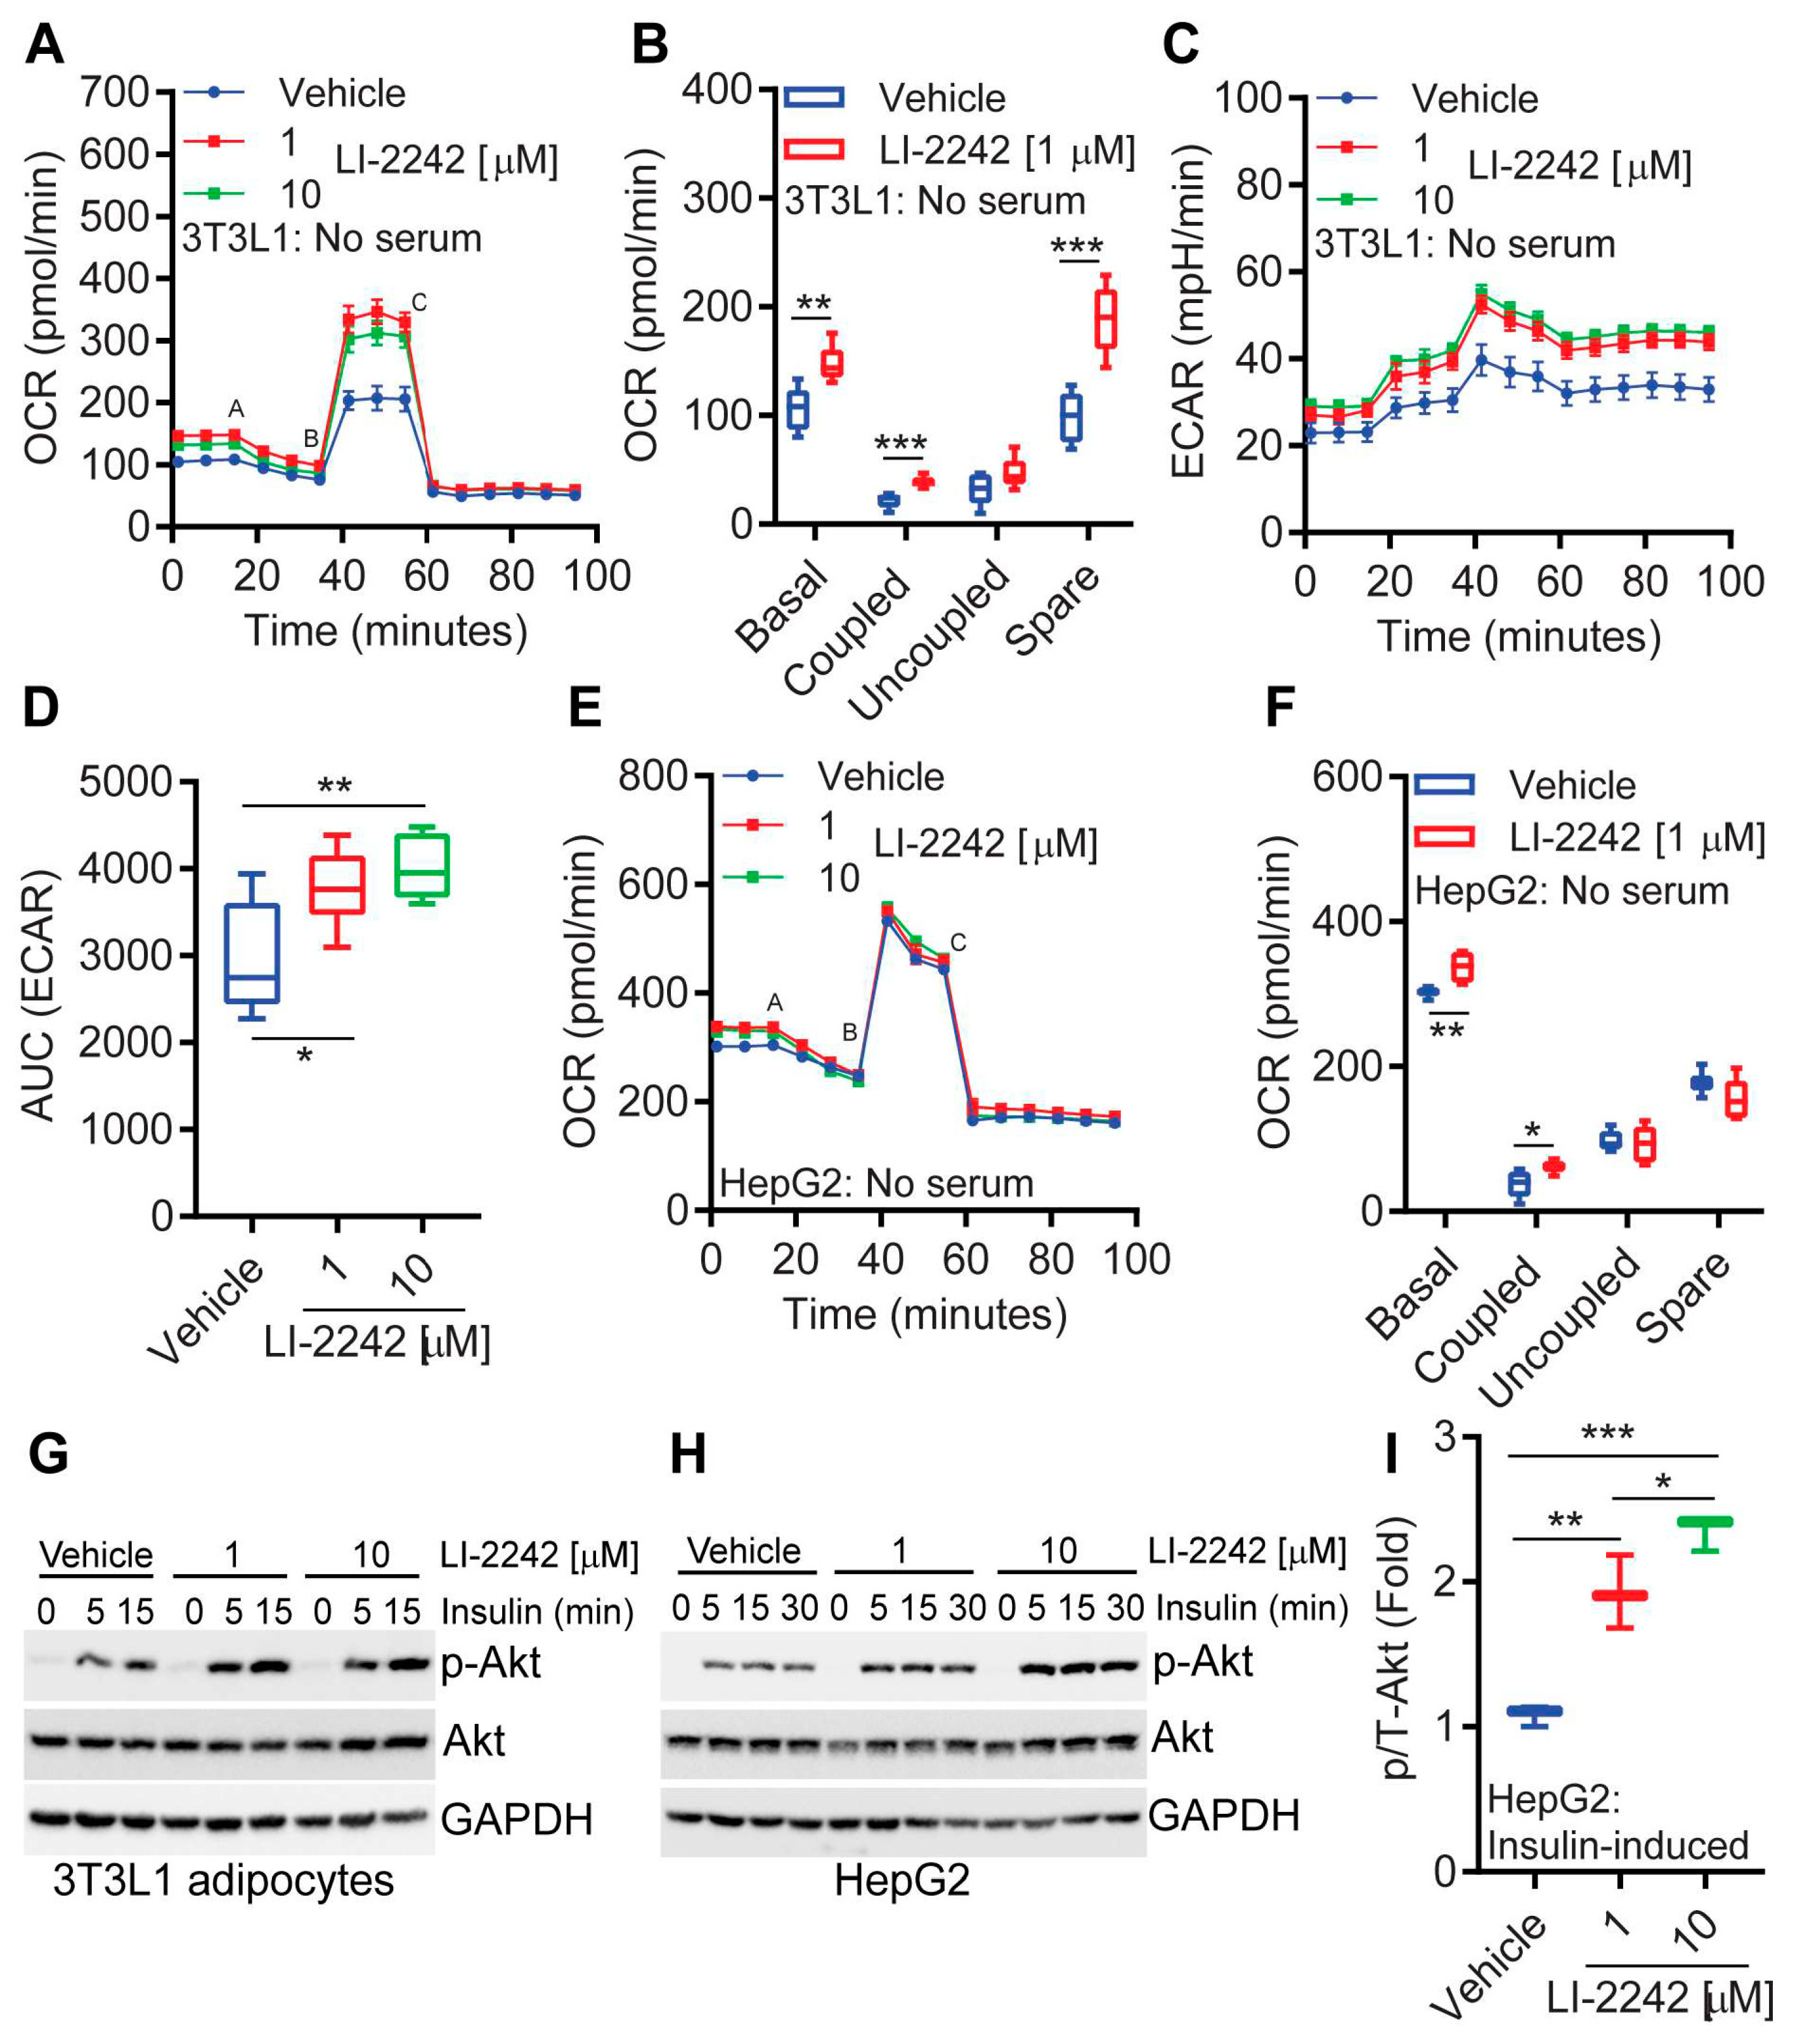
3.5. LI-2242 Alters the Metabolic Parameters of 3T3L1 Adipocytes and HepG2 Hepatocytes
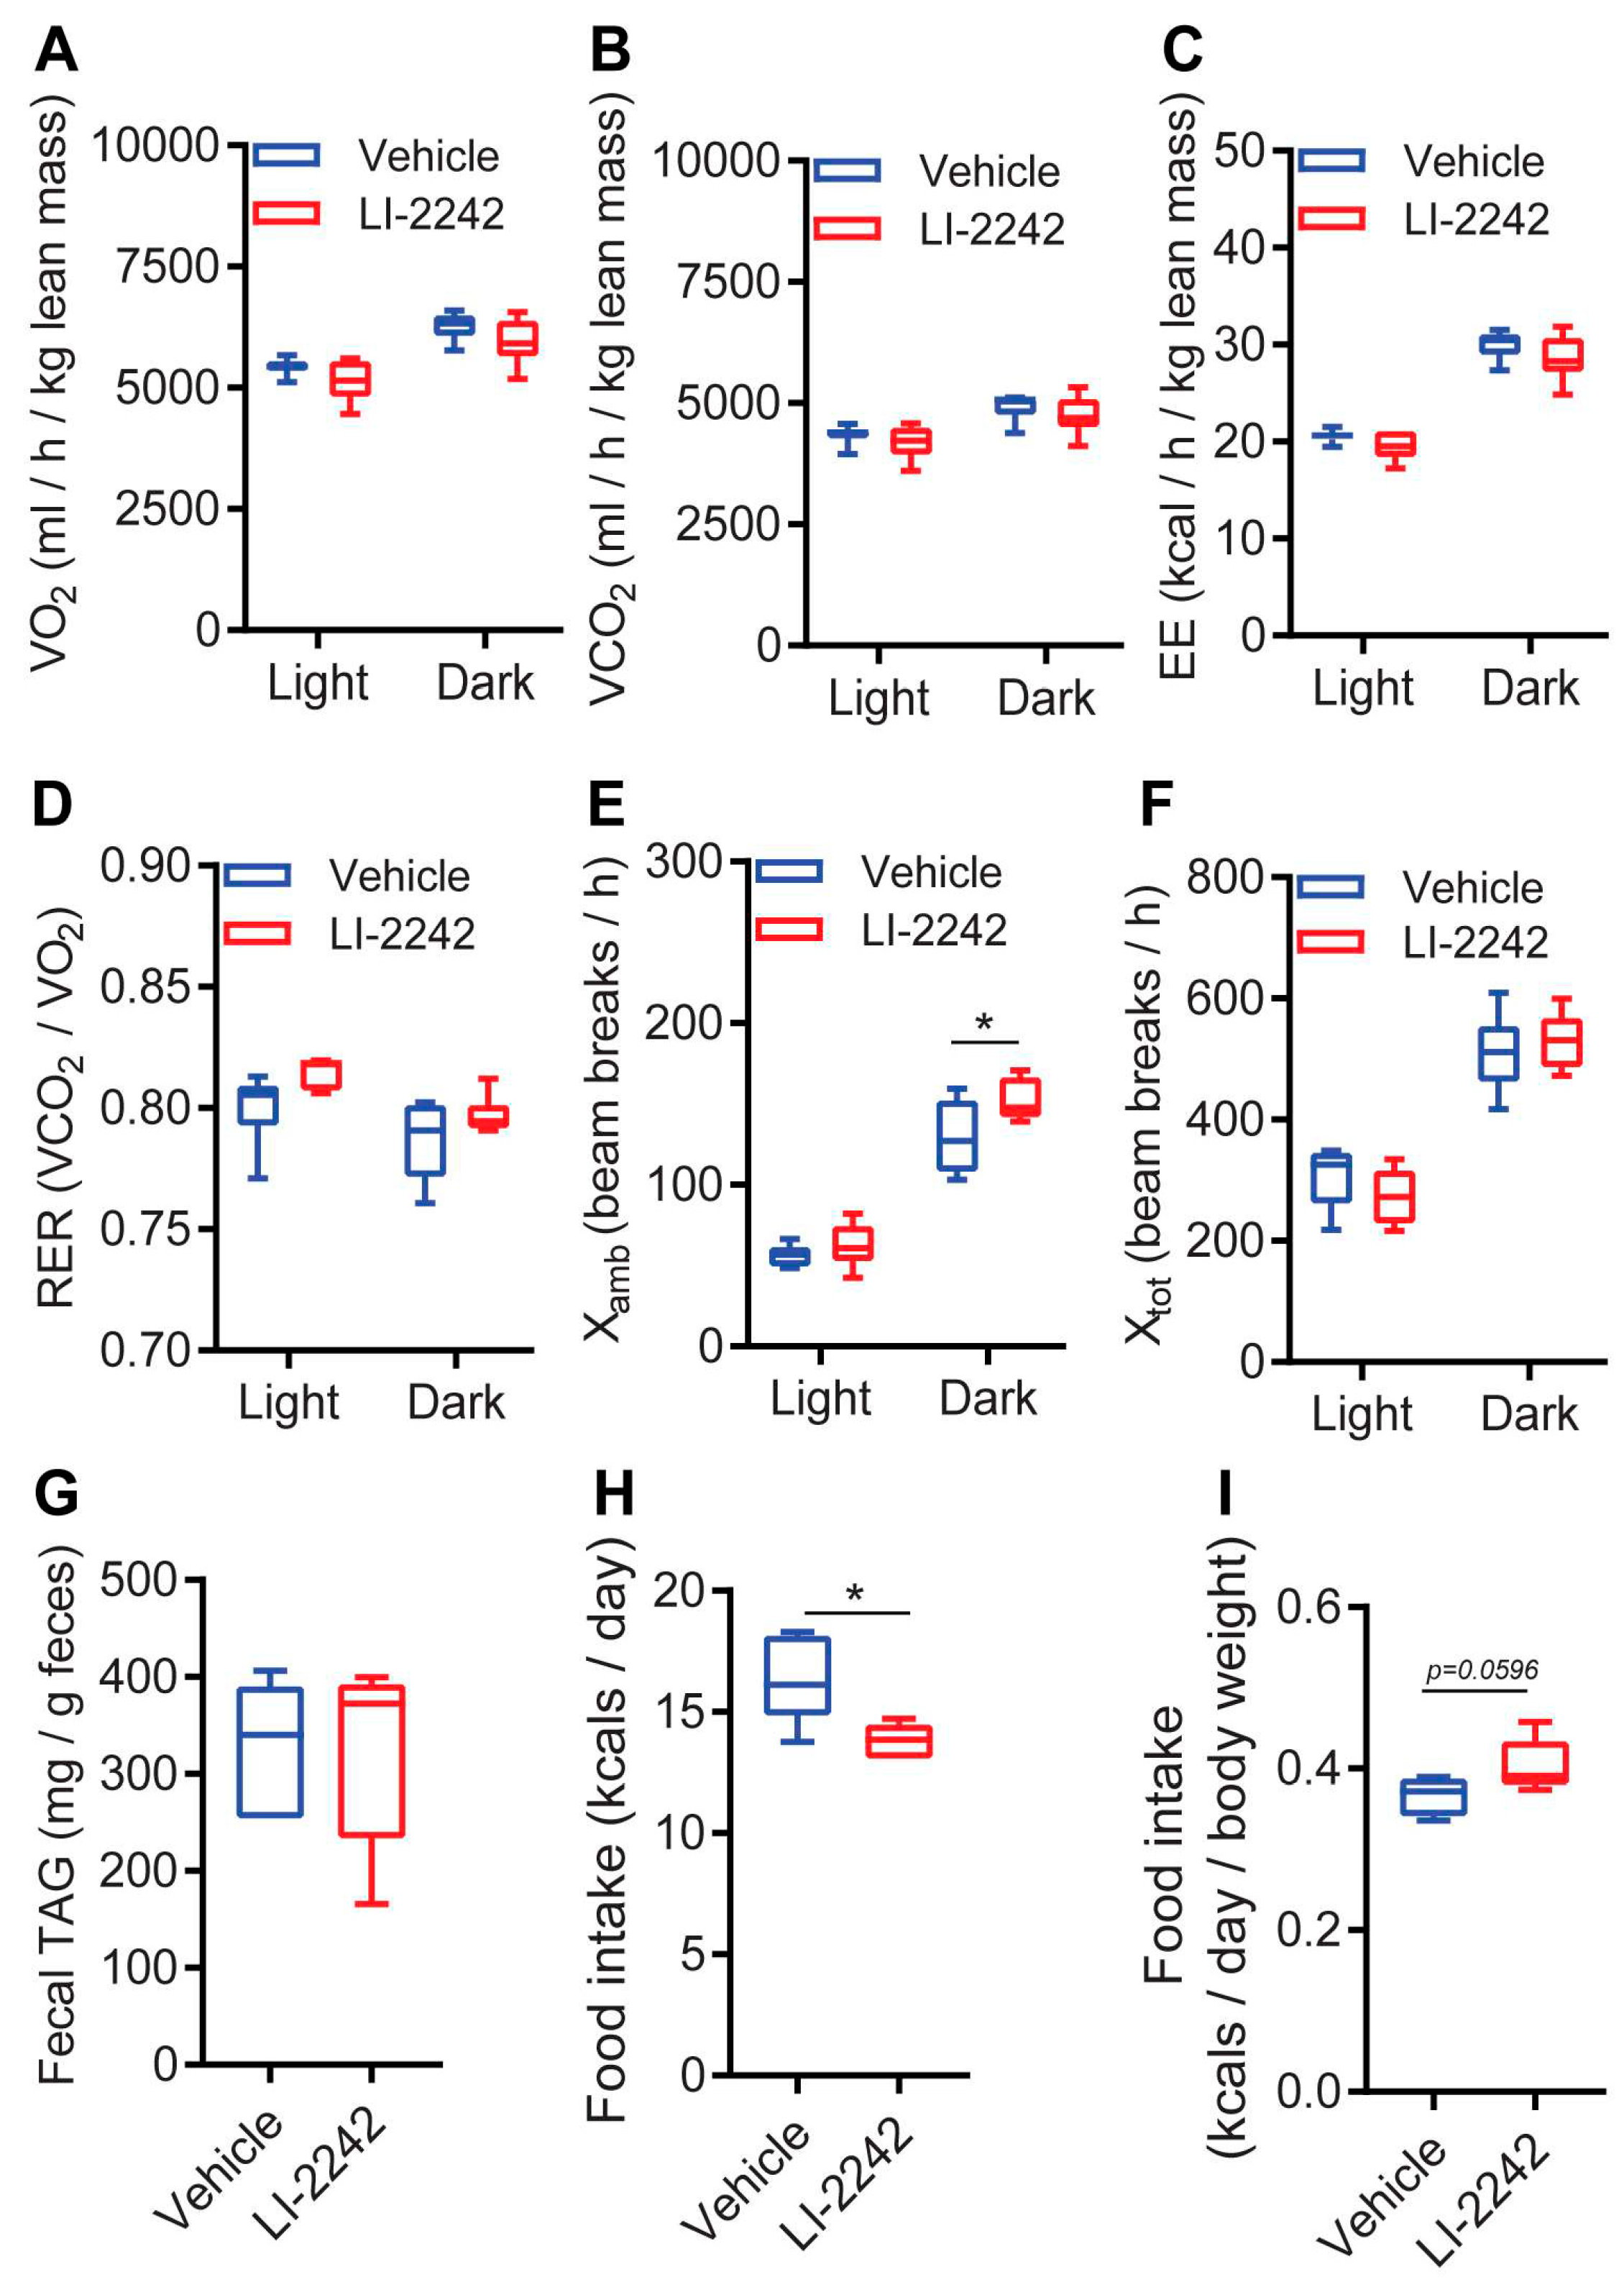
3.6. Profiles of the Intake, Absorption, and Expenditure of Energy for LI-2242 Treated Mice
4. Discussion
5. Conclusions
Supplementary Materials
Author Contributions
Funding
Institutional Review Board Statement
Data Availability Statement
Acknowledgments
Conflicts of Interest
References
- Friedman, S.L.; Neuschwander-Tetri, B.A.; Rinella, M.; Sanyal, A.J. Mechanisms of NAFLD development and therapeutic strategies. Nat. Med. 2018, 24, 908–922. [Google Scholar] [CrossRef] [PubMed]
- Loomba, R.; Friedman, S.L.; Shulman, G.I. Mechanisms and disease consequences of nonalcoholic fatty liver disease. Cell 2021, 184, 2537–2564. [Google Scholar] [CrossRef] [PubMed]
- Estes, C.; Razavi, H.; Loomba, R.; Younossi, Z.; Sanyal, A.J. Modeling the epidemic of nonalcoholic fatty liver disease demonstrates an exponential increase in burden of disease. Hepatology 2018, 67, 123–133. [Google Scholar] [CrossRef] [PubMed]
- Ramasamy, A.; Laliberté, F.; Aktavoukian, S.A.; Lejeune, D.; DerSarkissian, M.; Cavanaugh, C.; Smolarz, B.G.; Ganguly, R.; Duh, M.S. Direct and Indirect Cost of Obesity Among the Privately Insured in the United States: A Focus on the Impact by Type of Industry. J. Occup. Environ. Med. 2019, 61, 877–886. [Google Scholar] [CrossRef]
- Vilar-Gomez, E.; Martinez-Perez, Y.; Calzadilla-Bertot, L.; Torres-Gonzalez, A.; Gra-Oramas, B.; Gonzalez-Fabian, L.; Romero-Gomez, M. Weight Loss Through Lifestyle Modification Significantly Reduces Features of Nonalcoholic Steatohepatitis. Gastroenterology 2015, 149, 367–378. [Google Scholar] [CrossRef]
- Kim, G.W.; Lin, J.E.; Blomain, E.S.; Waldman, S.A. Antiobesity pharmacotherapy: New drugs and emerging targets. Clin. Pharm. Pharmacol. Ther. 2014, 95, 53–66. [Google Scholar] [CrossRef]
- Sumithran, P.; Proietto, J. Benefit-Risk Assessment of Orlistat in the Treatment of Obesity. Drug. Saf. 2014, 37, 597–608. [Google Scholar] [CrossRef]
- Rodgers, R.J.; Tschöp, M.H.; Wilding, J. Anti-obesity drugs: Past, present and future. Dis. Model. Mech. 2012, 5, 621–626. [Google Scholar] [CrossRef]
- Tesfay, M.; Goldkamp, W.J.; Neuschwander-Tetri, B.A. NASH: The Emerging Most Common Form of Chronic Liver Disease. Mo. Med. 2018, 115, 225–229. [Google Scholar]
- Sumida, Y.; Okanoue, T.; Nakajima, A.; Japan Study Group of NAFLD (JSG-NAFLD). Phase 3 drug pipelines in the treatment of NASH. Hepatol. Res. 2019, 49, 1256–1262. [Google Scholar] [CrossRef]
- Aaseth, J.; Ellefsen, S.; Alehagen, U.; Sundfør, T.M.; Alexander, J. Diets and drugs for weight loss and health in obesity-An update. Biomed. Pharmacother. 2021, 140, 111789. [Google Scholar] [CrossRef] [PubMed]
- Neuschwander-Tetri, B.A. Therapeutic Landscape for NAFLD in 2020. Gastroenterology 2020, 158, 1984–1998. [Google Scholar] [CrossRef] [PubMed]
- Berkovic, M.C.; Rezic, T.; Bilic-Curcic, I.; Mrzljak, A. Semaglutide might be a key for breaking the vicious cycle of metabolically associated fatty liver disease spectrum? World J. Clin. Cases 2022, 10, 6759–6768. [Google Scholar] [CrossRef] [PubMed]
- Chakraborty, A. The inositol pyrophosphate pathway in health and diseases. Biol. Rev. Camb. Philos. Soc. 2018, 93, 1203–1227. [Google Scholar] [CrossRef]
- Mukherjee, S.; Haubner, J.; Chakraborty, A. Targeting the Inositol Pyrophosphate Biosynthetic Enzymes in Metabolic Diseases. Molecules 2020, 25, 1403. [Google Scholar] [CrossRef]
- Zhu, Q.; Ghoshal, S.; Rodrigues, A.; Gao, S.; Asterian, A.; Kamenecka, T.M.; Barrow, J.C.; Chakraborty, A. Adipocyte-specific deletion of Ip6k1 reduces diet-induced obesity by enhancing AMPK-mediated thermogenesis. J. Clin. Investig. 2016, 126, 4273–4288. [Google Scholar] [CrossRef]
- Zhu, Q.; Ghoshal, S.; Tyagi, R.; Chakraborty, A. Global IP6K1 deletion enhances temperature modulated energy expenditure which reduces carbohydrate and fat induced weight gain. Mol. Metab. 2017, 6, 73–85. [Google Scholar] [CrossRef]
- Ghoshal, S.; Tyagi, R.; Zhu, Q.; Chakraborty, A. Inositol hexakisphosphate kinase-1 interacts with perilipin1 to modulate lipolysis. Int. J. Biochem. Cell. Biol. 2016, 78, 149–155. [Google Scholar] [CrossRef]
- Chakraborty, A.; Koldobskiy, M.A.; Bello, N.T.; Maxwell, M.; Potter, J.J.; Juluri, K.R.; Maag, D.; Kim, S.; Huang, A.S.; Dailey, M.J.; et al. Inositol pyrophosphates inhibit Akt signaling, thereby regulating insulin sensitivity and weight gain. Cell 2010, 143, 897–910. [Google Scholar] [CrossRef]
- Boregowda, S.V.; Ghoshal, S.; Booker, C.N.; Krishnappa, V.; Chakraborty, A.; Phinney, D.G. IP6K1 Reduces Mesenchymal Stem/Stromal Cell Fitness and Potentiates High Fat Diet-Induced Skeletal Involution. Stem Cells 2017, 35, 1973–1983. [Google Scholar] [CrossRef]
- Mukherjee, S.; Chakraborty, M.; Ulmasov, B.; McCommis, K.; Zhang, J.; Carpenter, D.; Msengi, E.N.; Haubner, J.; Guo, C.; Pike, D.P.; et al. Pleiotropic actions of IP6K1 mediate hepatic metabolic dysfunction to promote nonalcoholic fatty liver disease and steatohepatitis. Mol. Metab. 2021, 54, 101364. [Google Scholar] [CrossRef]
- Ghoshal, S.; Mukherjee, S.; Chakraborty, M.; Msengi, E.N.; Haubner, J.; Chakraborty, A. Whole Body Ip6k1 Deletion Protects Mice from Age-Induced Weight Gain, Insulin Resistance and Metabolic Dysfunction. Int. J. Mol. Sci. 2022, 23, 2059. [Google Scholar] [CrossRef] [PubMed]
- Chang, Y.-T.; Choi, G.; Bae, Y.-S.; Burdett, M.; Moon, H.-S.; Lee, J.W.; Gray, N.S.; Schultz, P.G.; Meijer, L.; Chung, S.-K.; et al. Purine-based inhibitors of inositol-1,4,5-trisphosphate-3-kinase. Chembiochem 2002, 3, 897–901. [Google Scholar] [CrossRef]
- Padmanabhan, U.; Dollins, D.E.; Fridy, P.C.; York, J.D.; Downes, C.P. Characterization of a selective inhibitor of inositol hexakisphosphate kinases: Use in defining biological roles and metabolic relationships of inositol pyrophosphates. J. Biol. Chem. 2009, 284, 10571–10582. [Google Scholar] [CrossRef]
- Ghoshal, S.; Zhu, Q.; Asteian, A.; Lin, H.; Xu, H.; Ernst, G.; Barrow, J.C.; Xu, B.; Cameron, M.D.; Kamenecka, T.M.; et al. TNP [N2-(m-Trifluorobenzyl), N6-(p-nitrobenzyl)purine] ameliorates diet induced obesity and insulin resistance via inhibition of the IP6K1 pathway. Mol. Metab. 2016, 5, 903–917. [Google Scholar] [CrossRef] [PubMed]
- Nwosu, Z.C.; Megger, D.A.; Hammad, S.; Sitek, B.; Roessler, S.; Ebert, M.P.; Meyer, C.; Dooley, S. Identification of the Consistently Altered Metabolic Targets in Human Hepatocellular Carcinoma. Cell. Mol. Gastroenterol. Hepatol. 2017, 4, 303–323.e1. [Google Scholar] [CrossRef] [PubMed]
- Shears, S.B. Towards pharmacological intervention in inositol pyrophosphate signalling. Biochem. Soc. Trans. 2016, 44, 191–196. [Google Scholar] [CrossRef] [PubMed]
- Stork, C.J.; Li, Y.V. Zinc release from thapsigargin/IP3-sensitive stores in cultured cortical neurons. J. Mol. Signal. 2010, 5, 5. [Google Scholar] [CrossRef] [PubMed]
- Eva, R.; Bouyoucef-Cherchalli, D.; Patel, K.; Cullen, P.J.; Banting, G. IP3 3-kinase opposes NGF driven neurite outgrowth. PLoS ONE 2012, 7, e32386. [Google Scholar] [CrossRef] [PubMed]
- Sekar, M.C.; Shahiwala, K.; Leloup, L.; Wells, A. Modulation of Epidermal Growth Factor Stimulated ERK Phosphorylation and Cell Motility by Inositol Trisphosphate Kinase. J. Pharm. Sci. Pharm. Pharmacol. 2014, 1, 160–164. [Google Scholar] [CrossRef]
- Puhl-Rubio, A.C.; Stashko, M.A.; Wang, H.; Hardy, P.B.; Tyagi, V.; Li, B.; Wang, X.; Kireev, D.; Jessen, H.J.; Frye, S.V.; et al. Use of Protein Kinase-Focused Compound Libraries for the Discovery of New Inositol Phosphate Kinase Inhibitors. SLAS Discov. 2018, 23, 982–988. [Google Scholar] [CrossRef] [PubMed]
- Wormald, M.M.; Ernst, G.; Wei, H.; Barrow, J.C. Wormald, M.M.; Ernst, G.; Wei, H.; Barrow, J.C. Synthesis and characterization of novel isoform-selective IP6K1 inhibitors. Bioorg Med. Chem. Lett. 2019, 29, 126628. [Google Scholar] [CrossRef] [PubMed]
- Liao, G.; Ye, W.; Heitmann, T.; Ernst, G.; DePasquale, M.; Xu, L.; Wormald, M.; Hu, X.; Ferrer, M.; Harmel, R.K.; et al. Identification of Small-Molecule Inhibitors of Human Inositol Hexakisphosphate Kinases by High-Throughput Screening. ACS Pharm. Pharmacol.Transl. Sci. 2021, 4, 780–789. [Google Scholar] [CrossRef] [PubMed]
- Moritoh, Y.; Abe, S.-I.; Akiyama, H.; Kobayashi, A.; Koyama, R.; Hara, R.; Kasai, S.; Watanabe, M. The enzymatic activity of inositol hexakisphosphate kinase controls circulating phosphate in mammals. Nat. Commun. 2021, 12, 4847. [Google Scholar] [CrossRef]
- Lee, S.; Park, B.B.; Kwon, H.; Kim, V.; Jeon, J.S.; Lee, R.; Subedi, M.; Lim, T.; Ha, H.; An, D.; et al. TNP and its analogs: Modulation of IP6K and CYP3A4 inhibition. J. Enzym. Inhib. Med. Chem. 2022, 37, 269–279. [Google Scholar] [CrossRef]
- Aune, U.L.; Ruiz, L.; Kajimura, S. Isolation and differentiation of stromal vascular cells to beige/brite cells. J. Vis. Exp. 2013, 73, e50191. [Google Scholar]
- Yu, H.; Rimbert, A.; Palmer, A.E.; Toyohara, T.; Xia, Y.; Xia, F.; Ferreira, L.M.; Chen, Z.; Chen, T.; Loaiza, N.; et al. GPR146 Deficiency Protects against Hypercholesterolemia and Atherosclerosis. Cell 2019, 179, 1276–1288.e14. [Google Scholar] [CrossRef]
- Liang, W.; Menke, A.L.; Driessen, A.; Koek, G.H.; Lindeman, J.H.; Stoop, R.; Havekes, L.M.; Kleemann, R.; van den Hoek, A.M. Establishment of a general NAFLD scoring system for rodent models and comparison to human liver pathology. PLoS ONE 2014, 9, e1159. [Google Scholar] [CrossRef]
- Cohen, P.; Kajimura, S. The cellular and functional complexity of thermogenic fat. Nat. Rev. Mol. Cell. Biol. 2021, 22, 393–409. [Google Scholar] [CrossRef]
- Kim, N.R.; David, K.; Corbeels, K.; Khalil, R.; Antonio, L.; Schollaert, D.; Deboel, L.; Ohlsson, C.; Gustafsson, J.; Vangoitsenhoven, R.; et al. Testosterone Reduces Body Fat in Male Mice by Stimulation of Physical Activity Via Extrahypothalamic ERα Signaling. Endocrinology 2021, 162, bqab045. [Google Scholar] [CrossRef]
- Nagpal, L.; Kornberg, M.D.; Albacarys, L.K.; Snyder, S.H. Inositol hexakisphosphate kinase-2 determines cellular energy dynamics by regulating creatine kinase-B. Proc. Natl. Acad. Sci. USA 2021, 118, e2020695118. [Google Scholar] [CrossRef] [PubMed]
- Rojas, T.; Cheng, W.; Gao, Z.; Liu, X.; Wang, Y.; Malla, A.P.; Chin, A.C.; Romer, L.H.; Snyder, S.H.; Fu, C. Inositol hexakisphosphate kinase 3 promotes focal adhesion turnover via interactions with dynein intermediate chain 2. Proc. Natl. Acad. Sci. USA 2019, 116, 3278–3287. [Google Scholar] [CrossRef] [PubMed]
- Nagpal, L.; Fu, C.; Snyder, S.H. Inositol Hexakisphosphate Kinase-2 in Cerebellar Granule Cells Regulates Purkinje Cells and Motor Coordination via Protein 4. J. Neurosci. 2018, 38, 7409–7419. [Google Scholar] [CrossRef] [PubMed]
- Kim, M.-G.; Zhang, S.; Park, H.; Park, S.J.; Kim, S.; Chung, C. Inositol hexakisphosphate kinase-1 is a key mediator of prepulse inhibition and short-term fear memory. Mol. Brain 2020, 13, 72. [Google Scholar] [CrossRef]
- Chakraborty, A.; Latapy, C.; Xu, J.; Snyder, S.H.; Beaulieu, J.-M. Inositol hexakisphosphate kinase-1 regulates behavioral responses via GSK3 signaling pathways. Mol. Psychiatry 2014, 19, 284–293. [Google Scholar] [CrossRef]
- Moritoh, Y.; Oka, M.; Yasuhara, Y.; Hozumi, H.; Iwachidow, K.; Fuse, H.; Tozawa, R. Inositol Hexakisphosphate Kinase 3 Regulates Metabolism and Lifespan in Mice. Sci. Rep. 2016, 6, 32072. [Google Scholar] [CrossRef]
- Ito, M.; Fujii, N.; Kohara, S.; Hori, S.; Tanaka, M.; Wittwer, C.; Kikuchi, K.; Iijima, T.; Kakimoto, Y.; Hirabayashi, K.; et al. Inositol pyrophosphate profiling reveals regulatory roles of IP6K2-dependent enhanced IP(7) metabolism in the enteric nervous system. J. Biol. Chem. 2023, 299, 102928. [Google Scholar] [CrossRef]
- Wang, M.; Tian, X.; Leung, L.; Wang, J.; Houvig, N.; Xiang, J.; Saiah, E.; Hahm, S.; Suri, V.; Xu, X. Comparative pharmacokinetics and metabolism studies in lean and diet- induced obese mice: An animal efficacy model for 11β-hydroxysteroid dehydrogenase type 1 (11β-HSD1) inhibitors. Drug. Metab. Lett. 2011, 5, 55–63. [Google Scholar] [CrossRef]
- Zhou, Y.; Mukherjee, S.; Huang, D.; Chakraborty, M.; Gu, C.; Zong, G.; Stashko, M.A.; Pearce, K.H.; Shears, S.B.; Chakraborty, A.; et al. Development of Novel IP6K Inhibitors for the Treatment of Obesity and Obesity-Induced Metabolic Dysfunctions. J. Med. Chem. 2022, 65, 6869–6887. [Google Scholar] [CrossRef]
- Hou, Q.; Liu, F.; Chakraborty, A.; Jia, Y.; Prasad, A.; Yu, H.; Zhao, L.; Ye, K.; Snyder, S.H.; Xu, Y.; et al. Inhibition of IP6K1 suppresses neutrophil-mediated pulmonary damage in bacterial pneumonia. Sci. Transl. Med. 2018, 10, eaal4045. [Google Scholar] [CrossRef]
- Ghosh, S.; Shukla, D.; Suman, K.; Lakshmi, B.J.; Manorama, R.; Kumar, S.; Bhandari, R. Inositol hexakisphosphate kinase 1 maintains hemostasis in mice by regulating platelet polyphosphate levels. Blood 2013, 122, 1478–1486. [Google Scholar] [CrossRef] [PubMed]
- Boregowda, S.V.; Nanjappa, M.K.; Booker, C.N.; Strivelli, J.; Supper, V.M.; Cooke, P.S.; Phinney, D.G. Pharmacological Inhibition of Inositol Hexakisphosphate Kinase 1 Protects Mice against Obesity-Induced Bone Loss. Biology 2022, 11, 1257. [Google Scholar] [CrossRef] [PubMed]
- Sun, D.; Li, S.; Wu, H.; Zhang, M.; Zhang, X.; Wei, L.; Qin, X.; Gao, E. Oncostatin M (OSM) protects against cardiac ischaemia/reperfusion injury in diabetic mice by regulating apoptosis, mitochondrial biogenesis and insulin sensitivity. J. Cell. Mol. Med. 2015, 19, 1296–1307. [Google Scholar] [CrossRef] [PubMed]


Disclaimer/Publisher’s Note: The statements, opinions and data contained in all publications are solely those of the individual author(s) and contributor(s) and not of MDPI and/or the editor(s). MDPI and/or the editor(s) disclaim responsibility for any injury to people or property resulting from any ideas, methods, instructions or products referred to in the content. |
© 2023 by the authors. Licensee MDPI, Basel, Switzerland. This article is an open access article distributed under the terms and conditions of the Creative Commons Attribution (CC BY) license (https://creativecommons.org/licenses/by/4.0/).
Share and Cite
Mukherjee, S.; Chakraborty, M.; Haubner, J.; Ernst, G.; DePasquale, M.; Carpenter, D.; Barrow, J.C.; Chakraborty, A. The IP6K Inhibitor LI-2242 Ameliorates Diet-Induced Obesity, Hyperglycemia, and Hepatic Steatosis in Mice by Improving Cell Metabolism and Insulin Signaling. Biomolecules 2023, 13, 868. https://doi.org/10.3390/biom13050868
Mukherjee S, Chakraborty M, Haubner J, Ernst G, DePasquale M, Carpenter D, Barrow JC, Chakraborty A. The IP6K Inhibitor LI-2242 Ameliorates Diet-Induced Obesity, Hyperglycemia, and Hepatic Steatosis in Mice by Improving Cell Metabolism and Insulin Signaling. Biomolecules. 2023; 13(5):868. https://doi.org/10.3390/biom13050868
Chicago/Turabian StyleMukherjee, Sandip, Molee Chakraborty, Jake Haubner, Glen Ernst, Michael DePasquale, Danielle Carpenter, James C. Barrow, and Anutosh Chakraborty. 2023. "The IP6K Inhibitor LI-2242 Ameliorates Diet-Induced Obesity, Hyperglycemia, and Hepatic Steatosis in Mice by Improving Cell Metabolism and Insulin Signaling" Biomolecules 13, no. 5: 868. https://doi.org/10.3390/biom13050868