
Fatty Acid Profiles of Some Siberian Bryophytes and Prospects of Their Use in Chemotaxonomy


 , and
, and 
Abstract
:1. Introduction
2. Materials and Methods
2.1. Sampling
2.2. Fatty Acid Analysis
2.3. Statistical Analysis
3. Results
3.1. FA Composition
3.2. MDA Results
4. Discussion
Supplementary Materials
Author Contributions
Funding
Institutional Review Board Statement
Informed Consent Statement
Data Availability Statement
Conflicts of Interest
References
- Ignatov, M.S.; Ignatova, E.A. Moss Flora of the Middle European Russia. Vol. 1: Sphagnaceae-Hedwigiaceae; KMK Scientific Press Ltd.: Moscow, Russia, 2003; p. 608. [Google Scholar]
- Porley, R.; Hodgetts, N. Mosses and Liverworts; HarperCollins Publishers: London UK, 2005; p. 495. [Google Scholar]
- Ohlrogge, J.; Thrower, N.; Mhaske, V.; Stymne, S.; Baxter, M.; Yang, W.; Liu, J.; Shaw, K.; Shorrosh, B.; Zhang, M.; et al. PlantFAdb: A resource for exploring hundreds of plant fatty acid structures synthesized by thousands of plants and their phylogenetic relationships. Plant J. 2018, 96, 1299–1308. [Google Scholar] [CrossRef] [PubMed] [Green Version]
- Lu, Y.; Eiriksson, F.F.; Thorsteinsdóttir, M.; Simonsen, H.T. Valuable fatty acids in Bryophytes-production, biosynthesis, analysis and applications. Plants 2019, 8, 524. [Google Scholar] [CrossRef] [PubMed] [Green Version]
- Hansen, C.E.; Rossi, P. Arachidonic and eicosapentaenoic acids in Brachytheciaceae and Hypnaceae moss species. Phytochemistry 1990, 29, 3749–3754. [Google Scholar] [CrossRef]
- Pejin, B.; Vujisic, L.; Sabovljevic, M.; Tesevic, V.; Vajs, V. The moss Mnium hornum, a promising source of arachidonic acid. Chem. Nat. Compd. 2012, 48, 120–121. [Google Scholar] [CrossRef]
- Dembitsky, V.M.; Rezanka, T. Distribution of diacylglycerylhomoserines, phospholipids and fatty acids in thirteen moss species from Southwestern Siberia. Biochem. Syst. Ecol. 1995, 23, 71–78. [Google Scholar] [CrossRef]
- Kalacheva, G.S.; Sushchik, N.N.; Gladyshev, M.I.; Makhutova, O.N. Seasonal dynamics of fatty acids in the lipids of water moss Fontinalis antipyretica from the Yenisei river. Russ. J. Plant Physiol. 2009, 56, 795–807. [Google Scholar] [CrossRef]
- Kajikawa, M.; Matsui, K.; Ochiai, M.; Tanaka, Y.; Kita, Y.; Ishimoto, M.; Kohzu, Y.; Shoji, S.-I.; Yamato, K.; Ohyama, K.; et al. Production of arachidonic and eicosapentaenoic acids in plants using bryophyte fatty acid Δ6-desaturase, Δ6-elongase, and Δ5-desaturase genes. Biosci. Biotechnol. Biochem. 2008, 72, 435–444. [Google Scholar] [CrossRef] [PubMed]
- Sarkar, P.M.; Raha, B.A.; Datta, J.; Mitra, S. Chemotaxonomic and evolutionary perspectives of Bryophyta based on multivariate analysis of fatty acid fingerprints of Eastern Himalayan mosses. Protoplasma 2022, 259, 1125–1137. [Google Scholar] [CrossRef]
- Ponce de León, I.; Hamberg, M.; Castresana, C. Oxylipins in moss development and defense. Front. Plant Sci. 2015, 6, 483. [Google Scholar] [CrossRef] [PubMed] [Green Version]
- Gao, Y.; Wang, W.; Zhang, T.; Gong, Z.; Zhao, H.; Han, G. -Z. Out of Water: The Origin and Early Diversification of Plant R-Genes. Plant Physiol. 2018, 177, 82–89. [Google Scholar] [CrossRef] [Green Version]
- Ortiz, D.; Dodds, P.N. Plant NLR Origins Traced Back to Green Algae. Trends Plant Sci. 2018, 23, 651–654. [Google Scholar] [CrossRef] [PubMed]
- Makhutova, O.N.; Sushchik, N.N.; Gladyshev, M.I. Fatty acid—Markers as foodweb tracers in inland waters. In Encyclopedia of Inland Waters, 2nd ed.; Mehner, T., Tockner, K., Eds.; ELSEVIER: Amsterdam, The Netherlands, 2022; pp. 713–726. [Google Scholar]
- Anterola, A.; Göbel, C.; Hornung, E.; Sellhorn, G.; Feussner, I.; Grimes, H. Physcomitrella patens has lipoxygenases for both eicosanoid and octadecanoid pathways. Phytochemistry 2009, 70, 40–52. [Google Scholar] [CrossRef] [PubMed]
- Resemann, H.C.; Lewandowska, M.; Gï Mann, J.; Feussner, I. Membrane lipids, waxes and oxylipins in the moss model organism Physcomitrella patens. Plant Cell Physiol. 2019, 60, 1166–1175. [Google Scholar] [CrossRef] [Green Version]
- Duhin, A.; Machado, R.A.R.; Turlings, T.C.J.; Röder, G. Early land plants: Plentiful but neglected nutritional resources for herbivores? Ecol. Evol. 2022, 12, e9617. [Google Scholar] [CrossRef] [PubMed]
- Imada, Y.; Kawakita, A.; Kato, M. Allopatric distribution and diversification without niche shift in a bryophyte-feeding basal moth lineage (Lepidoptera: Micropterigidae). Proc. Biol. Sci. 2011, 278, 3026–3033. [Google Scholar] [CrossRef] [PubMed] [Green Version]
- Croisier, E.; Rempt, M.; Pohnert, G. Survey of volatile oxylipins and their biosynthetic precursors in bryophytes. Phytochemistry 2010, 71, 574–580. [Google Scholar] [CrossRef] [PubMed]
- Gladyshev, M.I.; Sushchik, N.N.; Makhutova, O.N. Production of EPA and DHA in aquatic ecosystems and their transfer to the land. Prostaglandins Other Lipid Mediat. 2013, 107, 117–126. [Google Scholar] [CrossRef] [PubMed]
- Saini, R.K.; Keum, Y.S. Omega-3 and omega-6 polyunsaturated fatty acids: Dietary sources, metabolism, and significance—A review. Life Sci. 2018, 203, 255–267. [Google Scholar] [CrossRef]
- Badami, R.C.; Patil, K.B. Structure and occurrence of unusual fatty acids in minor seed oils. Prog. Lipid Res. 1981, 19, 119–153. [Google Scholar] [CrossRef] [PubMed]
- Mitra, S. High content of dicranin in Anisothecium spirale (Mitt.) Broth., a moss from Eastern Himalayas and its chemotaxonomic significance. Lipids 2017, 52, 173–178. [Google Scholar] [CrossRef]
- Pejin, B.; Bianco, A.; Newmaster, S.; Sabovljevic, M.; Vujisic, L.; Tesevic, V.; Vajs, V.; De Rosa, S. Fatty acids of Rhodobryum ontariense (Bryaceae). Nat. Prod. Res. 2012, 26, 696–702. [Google Scholar] [CrossRef] [PubMed]
- Konh, G.; Demmerle, S.; Vandekerkhove, O.; Hartmann, E.; Beutelmann, P. Distribution and chemotaxonomic significance of acetylenic fatty acids in mosses of the Dicranales. Phytochemistry 1987, 26, 2271–2275. [Google Scholar]
- Lu, Y.; Eiriksson, F.; Thorsteinsdottir, M.; Cronberg, N.; Simonsen, H. Lipidomes of Icelandic bryophytes and screening of high contents of polyunsaturated fatty acids by using lipidomics approach. Phytochemistry 2023, 206, 113560. [Google Scholar] [CrossRef] [PubMed]
- Kohn, G.; Vandekerkhove, O.; Hartmann, E.; Beutelmann, P. Acetylenic fatty acids in the Ricciaceae (Hepaticae). Phytochemistry 1988, 27, 1049–1051. [Google Scholar] [CrossRef]
- Karunen, P. The role of neutral lipids in the physiology and ecology of subarctic Dicranum elongatum. Can. J. Bot. 1981, 59, 1902–1909. [Google Scholar] [CrossRef]
- Chowdhuri, S.R.; Raha, A.B.; Mitra, S.; Datta, J.; Sarkar, M.P. “Dicranin” in the membrane phospholipids of a Dicranaceae and Pottiaceae moss member of the Eastern Himalayan biodiversity hotspot. Lipids 2018, 53, 539–545. [Google Scholar] [CrossRef] [PubMed]
- Sperling, P.; Lee, M.; Girke, T.; Zähringer, U.; Stymne, S.; Heinz, E. A bifunctional delta-fatty acyl acetylenase/desaturase from the moss Ceratodon purpureus. A new member of the cytochrome b5 superfamily. Eur. J. Biochem. 2000, 267, 3801–3811. [Google Scholar] [CrossRef] [PubMed]
- Rempt, M.; Pohnert, G. Novel acetylenic oxylipins from the moss Dicranum scoparium with antifeeding activity against herbivorous slugs. Angew. Chem. Int. Ed. Engl. 2010, 49, 4755–4758. [Google Scholar] [CrossRef] [PubMed]
- Ignatova, E.A.; Kuznetsova, O.I.; Fedosov, V.E.; Ignatov, M.S. On the genus Hedwigia (Hedwigiaceae, Bryophyta) in Russia. Arctoa 2016, 25, 241–277. [Google Scholar] [CrossRef] [Green Version]
- Crandall Stotler, B.; Stotler, R.E.; Long, D.G. Phylogeny and classification of the Marchantiophyta. Edinburgh J. B. 2009, 66, 155–198. [Google Scholar] [CrossRef]
- Fedosov, E.V.; Fedorova, V.A.; Fedosov, E.A.; Ignatov, S.M. Phylogenetic inference and peristome evolution in haplolepideous mosses, focusing on Pseudoditrichaceae and Ditrichaceae sl. Bot. J. Linn. Soc. 2016, 181, 139–155. [Google Scholar] [CrossRef] [Green Version]
- Fedosov, E.V.; Fedorova, V.A.; Larraín, J.; Santos, B.M.; Stech, M.; Kučera, J.; Brinda, J.C.; Tubanova, D.; Konrat, M.V.; Ignatova, E.A.; et al. Unity in diversity: Phylogenetics and taxonomy of Rhabdoweisiaceae (Dicranales, Bryophyta). Bot. J. Linn. Soc. 2021, 195, 545–567. [Google Scholar] [CrossRef]
- Kučera, J.; Kuznetsova, O.I.; Manukjanová, A.; Ignatov, M.S. A phylogenetic revision of the genus Hypnum: Towards completion. Taxon 2019, 68, 628–660. [Google Scholar] [CrossRef]
- Ignatov, M.S.; Fedorova, A.V.; Fedosov, V.E. On the taxonomy of Anomodontaceae and Heterocladium (Bryophyta). Arctoa 2019, 28, 75–102. [Google Scholar] [CrossRef] [Green Version]
- Piñeiro-Vidal, M.; Pazos, F.; Santos, Y. Fatty acid analysis as a chemotaxonomic tool for taxonomic and epidemiological characterization of four fish pathogenic Tenacibaculum species. Lett. Appl. Microbiol. 2008, 46, 548–554. [Google Scholar] [CrossRef]
- Isaacs, M.J.; Ramadoss, D.; Parab, A.S.; Manohar, C.S. Evaluating the bacterial diversity from the Southwest Coast of India using fatty acid methyl ester profiles. Curr. Microbiol. 2021, 78, 649–658. [Google Scholar] [CrossRef]
- De Kluijver, A.; Nierop, K.G.J.; Morganti, T.M.; Bart, M.C.; Slaby, B.M.; Hanz, U.; de Goeij, J.M.; Mienis, F.; Middelburg, J.J. Bacterial precursors and unsaturated long-chain fatty acids are biomarkers of North-Atlantic deep-sea demosponges. PLoS ONE 2021, 16, e0241095. [Google Scholar] [CrossRef]
- Lang, I.; Hodac, L.; Friedl, T.; Feussner, I. Fatty acid profiles and their distribution patterns in microalgae: A comprehensive analysis of more than 2000 strains from the SAG culture collection. BMC Plant Biol. 2011, 11, 124. [Google Scholar] [CrossRef] [Green Version]
- Stamenković, M.; Steinwall, E.; Nilsson, A.K.; Wulff, A. Fatty acids as chemotaxonomic and ecophysiological traits in green microalgae (desmids, Zygnematophyceae, Streptophyta): A discriminant analysis approach. Phytochemistry 2020, 170, 12200. [Google Scholar] [CrossRef]
- Wołczańska, A.; Christie, W.W.; Fuchs, B.; Galuska, C.E.; Kowalczyk, B.; Palusińska-Szysz, M. Fatty acid composition and lipid profiles as chemotaxonomic markers of phytopathogenic fungi Puccinia malvacearum and P. glechomatis. Fungal. Biol. 2021, 125, 869–878. [Google Scholar] [CrossRef]
- Wolff, R.; Deluc, L.; Marpeau, A. Chemotaxonomic differentiation of conifer families and genera based on the seed oil fatty acid compositions: Multivariate analyses. Trees 1997, 12, 57–65. [Google Scholar] [CrossRef]
- Guerin, C.; Serret, J.; Montúfar, R.; Vaissayre, V.; Bastos-Siqueira, A.; Durand-Gasselin, T.; Tregear, J.; Morcillo, F.; Dussert, S. Palm seed and fruit lipid composition: Phylogenetic and ecological perspectives. Ann. Bot. 2020, 125, 157–172. [Google Scholar] [CrossRef] [PubMed]
- Vidigal, P.; Duarte, B.; Cavaco, A.R.; Caçador, I.; Figueiredo, A.; Matos, A.R.; Viegas, W.; Monteiro, F. Preliminary diversity assessment of an undervalued tropical bean (Lablab purpureus (L.) Sweet) through fatty acid profiling. Plant Physiol. Biochem. 2018, 132, 508–514. [Google Scholar] [CrossRef]
- Taipale, S.J.; Hiltunen, M.; Vuorio, K.; Peltomaa, E. Suitability of phytosterols alongside fatty acids as chemotaxonomic biomarkers for phytoplankton. Front. Plant Sci. 2016, 7, 212. [Google Scholar] [CrossRef] [PubMed]
- Jónasdóttir, S.H. Fatty acid profiles and production in marine phytoplankton. Mar. Drugs 2019, 17, 151. [Google Scholar] [CrossRef] [PubMed] [Green Version]
- Wolff, R.L.; Lavialleb, O.; Pédronoa, F.; Pasquiera, E.; Deluca, L.; Marpeauc, G.A.; Aitzetmüllerd, K. Fatty acid composition of Pinaceae as Taxonomic Markers. Lipids 2001, 36, 439–451. [Google Scholar] [CrossRef] [PubMed]
- Wolff, R.L.; Lavialle, O.; Pédrono, F.; Pasquiera, E.; Destaillats, F.; Marpeauc, G.A.; Angers, P.; Aitzetmüllerd, K. Abietoid seed fatty acid composition—A review of the genera Abies, Cedrus, Hesperopeuce, Keteleeria, Pseudolarix, and Tsuga and preliminary inferences on the taxonomy of Pinaceae. Lipids 2002, 37, 17–26. [Google Scholar] [CrossRef]
- Potemkin, A.D.; Sofronova, E.V. Liverworts and hornworts of Russia; Boston-Spectr: Saint Petersburg, Russia, 2009; Volume 1, p. 368. [Google Scholar]
- Ignatov, M.S.; Afonina, O.M.; Ignatova, E.A. Check-list of mosses of East Europe and North Asia. Arctoa 2006, 15, 1–130. [Google Scholar] [CrossRef] [Green Version]
- Christie, W.W.; Han, X. Gas chromatographic analysis of fatty acid derivatives. In Lipid Analysis, Isolation, Separation, Identification, and Lipidomic Analysis; Woodhead Publishing Ltd.: Cambridge, UK, 2010; pp. 159–180. [Google Scholar]
- Kainz, M.; Perga, M.-E.; Arts, M.T.; Mazumder, A. Essential fatty acid concentrations of different seston sizes and zooplankton: A field study of monomictic coastal lakes. J. Plankton Res. 2009, 31, 635–645. [Google Scholar] [CrossRef] [Green Version]
- Torres-Ruiz, M.; Wehr, J.D. Complementary information from fatty acid and nutrient stoichiometry data improve stream food web analyses. Hydrobiologia 2020, 847, 629–645. [Google Scholar] [CrossRef]
- Matos, T.M.; Peralta, D.F.; Roma, L.P.; dos Santos, D.Y.A. The morphology and chemical composition of cuticular waxes in some Brazilian liverworts and mosses. J. Bryol. 2021, 43, 129–137. [Google Scholar] [CrossRef]
- Xu, S.-J.; Jiang, P.-A.; Wang, Z.-W.; Wang, Y. Crystal structures and chemical composition of leaf surface wax depositions on the desert moss Syntrichia caninervis. Biochem. Syst. Ecol. 2009, 37, 723–730. [Google Scholar] [CrossRef]
- Liu, Y.; Johnson, M.G.; Cox, C.J.; Medina, R.; Devos, N.; Vanderpoorten, A.; Hedenäs, L.; Bell, N.E.; Shevock, J.R.; Aguero, B.; et al. Resolution of the ordinal phylogeny of mosses using targeted exons from organellar and nuclear genomes. Nat. Communun. 2019, 10, 1485. [Google Scholar] [CrossRef] [Green Version]
- Ignatov, M.S.; Ignatova, E.A. Moss Flora of Russia; Vol. 5. Hypopterygiales—Hypnales (Plagiotheciaceae—Brachytheciaceae); Ignatov, M.S., Ed.; KMK: Moscow, Russia, 2020; p. 599. [Google Scholar]
- Johnson, M.G.; Malley, C.; Goffinet, B.; Shaw, A.J.; Wickett, N.J. A phylotranscriptomic analysis of gene family expansion and evolution in the largest order of pleurocarpous mosses (Hypnales, Bryophyta). Mol. Phylogenet. Evol. 2016, 98, 29–40. [Google Scholar] [CrossRef] [PubMed] [Green Version]
- Villarreal, J.C.; Crandall-Stotler, B.J.; Hart, M.L.; Long, D.G.; Forrest, L.L. Divergence times and the evolution of morphological complexity in an early land plant lineage (Marchantiopsida) with a slow molecular rate. New Phytol. 2016, 209, 1734–1746. [Google Scholar] [CrossRef]
- Sewon, P. Fatty acyl composition of monogalactosyldiacyl glycerols in Bryophyta. Phytochemistry 1992, 31, 346–349. [Google Scholar] [CrossRef]
- Takemura, M.; Hamada, T.; Kida, H.; Ohyama, K. Cold-induced accumulation of ω-3 polyunsaturated fatty acid in a liverwort, Marchantia polymorpha L. Biosci. Biotechnol. Biochem. 2012, 76, 785–790. [Google Scholar] [CrossRef] [PubMed] [Green Version]
- Saruwatari, M.; Takio, S.; Ono, K. Low temperature-induced accumulation of eicosapentaenoic acids in Marchantia polymorpha cells. Phytochemistry 1999, 52, 367–372. [Google Scholar] [CrossRef]
- Anderson, W.H.; Gellerman, J.K.; Schlenk, H. Arachidonic and eicosapentaenoic acids in developing gametophores and sporophytes of the moss, Mnium cuspidatum. Lipids 1972, 7, 710–714. [Google Scholar] [CrossRef]
- Gellerman, J.L.; Anderson, W.H.; Schlenk, H. Highly unsaturated lipids of Mnium, Polytrichum, Marchantia, and Matteuccia. Bryologist 1972, 75, 550–557. [Google Scholar] [CrossRef]
- Yu, Y.; Yang, J.; Ma, W.-Z.; Pressel, S.; Liu, H.; Wu, Y.-H.; Schneider, H. Chloroplast phylogenomics of liverworts: A reappraisal of the backbone phylogeny of liverworts with emphasis on Ptilidiales. Cladistics 2020, 36, 184–193. [Google Scholar] [CrossRef] [PubMed]
- Shaw, J.; Renzaglia, K. Phylogeny and diversification of bryophytes. Am. J. Bot. 2004, 91, 1557–1581. [Google Scholar] [CrossRef] [PubMed]
- Karunen, P.; Aro, E.-M. Fatty acid composition of polar lipids in Ceratodon purpureus and Pleurozium schreberi. Physiol. Plant. 1979, 45, 265–269. [Google Scholar] [CrossRef]


| Division | Class | Order | Species | n |
|---|---|---|---|---|
| Marchantiophyta 1 | Marchantiopsida | Marchantiales | Marchantia polymorpha L. (9001 KRSU) 3 | 7 |
| Conocephalum conicum (L.) Dumort. (9002 KRSU) | 4 | |||
| Jungermanniopsida | Metzgeriales | Metzgeria pubescens (Schrank) Raddi (9011 KRSU) | 5 | |
| Ptilidiales | Ptilidium ciliare (L.) Hampe (9006 KRSU) | 5 | ||
| Jungermanniales | Plagiochila porelloides (Torr. ex Nees) Lindenb (9009 KRSU) | 4 | ||
| Bryophyta 2 | Polytrichopsida | Polytrichales | Polytrichum commune Hedw. (9046 KRSU) | 1 |
| Polytrihastrum longisetum (Sw. ex Brid.) G.L.Sm. (9045 KRSU) | 1 | |||
| Bryopsida | Dicranales | Dicranum viride (Sull. &Lesq.) Lindb. (9049 KRSU) | 1 | |
| D. polysetum Sw. (9030 KRSU) | 2 | |||
| D. fuscescens Turner (9043 KRSU) | 1 | |||
| Bryales | Rhodobryium roseum (Hedw.) Limpr. (9038 KRSU) | 3 | ||
| Plagiomnium confertidens (Lindb. & Arnell) T.J.Kop. (9027 KRSU) | 3 | |||
| Hypnales | Anomodon attenuatus (Hedw.) Huebener (9033 KRSU) | 1 | ||
| Brachythecium rivulare Bruch et al. (9019 KRSU) | 1 | |||
| Entodon schleicheri (Schimp.) Demet. (9050 KRSU) | 1 | |||
| Climacium dendroides (Hedw.) F.Weber & D. Mohr (9020 KRSU) | 1 | |||
| Cratoneuron filicinum (Hedw.) Spruce (9018 KRSU) | 1 | |||
| Neckera pennata Hedw. (9040 KRSU) | 1 | |||
| Rhytidium rugosum (Hedw.) Kindb. (9025 KRSU) | 1 | |||
| Thuidium assimile (Mitt.) A.Jaeger (9015 KRSU) | 3 |
| Fatty Acid | Dicranum spp. | Plagiomnium confertidens | Rhodobrium roseum | Thuidium assimile | Ptilidium ciliare | Conocephalum conicum | Metzgeria pubescens | Marchantia polymorpha | Plagiochila porelloides |
|---|---|---|---|---|---|---|---|---|---|
| 9:0 * | <0.1 ± <0.1 | <0.1 ± <0.1 | <0.1 ± <0.1 | <0.1 ± <0.1 | <0.1 ± <0.1 | 0.5 ± 0.1 | <0.1 ± <0.1 | <0.1 ± <0.1 | <0.1 ± <0.1 |
| 12:0 | <0.1 ± <0.1 A | <0.1 ± <0.1 AB | <0.1 ± <0.1 AB | <0.1 ± <0.1 AB | 0.1 ± <0.1 AB | 0.2 ± <0.1 B | 0.1 ± <0.1 AB | 0.1 ± <0.1 AB | <0.1 ± <0.1 AB |
| 14:0 | 0.2 ± 0.1 A | 0.4 ± 0.1 AB | <0.1 ± <0.1 A | 0.3 ± 0.1 AB | 0.4 ± 0.1 AB | 0.9 ± 0.1 BC | 0.5 ± <0.1 AB | 1.1 ± 0.2 C | 0.3 ± <0.1 A |
| 15:0 | 0.2 ± 0.1 AB | 0.2 ± <0.1 AB | <0.1 ± <0.1 A | 0.2 ± <0.1 AB | 0.5 ± <0.1 ABD | 0.5 ± <0.1 BD | 1.2 ± 0.1 C | 0.7 ± 0.1 D | 0.4 ± <0.1 ABD |
| 16:0 * | 6.5 ± 0.5 | 14.7 ± 1.6 | 7.4 ± 1.9 | 13.0 ± 0.4 | 13.6 ± 0.6 | 29.0 ± 0.9 | 19.4 ± 0.2 | 22.5 ± 0.8 | 19.0 ± 0.2 |
| 16:1n–9 | 0.1 ± 0.0 A | 0.7 ± 0.1 AB | 0.2 ± <0.1 AC | 0.2 ± 0.1 AC | 0.5 ± <0.1 AB | 0.6 ± <0.1 AB | 0.3 ± <0.1 A | 0.9 ± 0.2 BC | 1.1 ± <0.1 B |
| 16:1n–7 | 0.1 ± <0.1 A | 0.8 ± 0.4 AB | 0.1 ± <0.1 AC | 0.4 ± 0.1 AD | 0.4 ± 0.1 AD | 0.9 ± 0.1 BD | 0.9 ± 0.1 BD | 1.3 ± 0.2 B | 0.5 ± <0.1 ACD |
| tr16:1 * | 0.1 ± <0.1 | 0.5 ± <0.1 | 0.1 ± 0.1 | 0.3 ± 0.1 | 0.3 ± <0.1 | 0.3 ± <0.1 | 1.0 ± <0.1 | 0.5 ± 0.1 | 0.4 ± <0.1 |
| 16:2n–6 * | 0.2 ± 0.1 | 0.3 ± 0.1 | 0.4 ± 0.2 | 0.4 ± 0.1 | 0.4 ± <0.1 | 0.3 ± <0.1 | 4.2 ± 0.3 | 0.6 ± 0.1 | 2.4 ± 0.1 |
| 17:0 | 0.2 ± 0.1 | 0.3 ± 0.1 | <0.1 ± <0.1 | 0.2 ± <0.1 | 0.2 ± <0.1 | 0.2 ± <0.1 | 0.2 ± <0.1 | 0.2 ± <0.1 | 0.2 ± <0.1 |
| 16:3n–3 | 0.3 ± 0.1 A | 0.8 ± 0.1 AB | 3.1 ± 0.7 ABC | 0.7 ± 0.3 AB | 3.7 ± 0.1 BC | 4.9 ± 0.2 CD | 6.8 ± 0.2 D | 6.6 ± 0.9 D | 4.8 ± 0.1 CD |
| 18:0 * | 1.4 ± 0.6 | 4.5 ± 1.2 | 0.4 ± 0.1 | 0.9 ± 0.1 | 1.1 ± 0.1 | 4.1 ± 0.8 | 0.7 ± <0.1 | 1.5 ± 0.2 | 1.6 ± 0.2 |
| 18:1n–9 | 2.8 ± 0.4 AB | 5.1 ± 1.6 ABC | 0.7 ± 0.2 A | 2.5 ± 1.4 AB | 5.1 ± 0.4 BCD | 7.5 ± 0.3 C | 1.3 ± 0.1 A | 6.0 ± 1.0 BC | 2.3 ± 0.2 AD |
| 18:1n–7 * | 0.6 ± 0.1 | 2.5 ± <0.1 | 0.8 ± 0.4 | 0.7 ± 0.3 | 1.1 ± <0.1 | 1.5 ± 0.1 | 1.3 ± 0.1 | 5.1 ± 0.8 | 2.8 ± 0.1 |
| 18:2n–6 | 8.6 ± 0.7 A | 7.1 ± 0.5 A | 4.4 ± 1.1 A | 16.4 ± 0.2 B | 29.1 ± 0.7 C | 8.3 ± 0.2 A | 38.5 ± 0.2 D | 10.3 ± 1.7 AB | 26.0 ± 0.2 C |
| 18:3n–6 | 1.9 ± 0.2 A | 1.6 ± <0.1 AB | 1.4 ± 0.1 ABC | 1.1 ± <0.1 BCD | 1.0 ± <0.1 CD | 1.2 ± <0.1 BC | 0.4 ± <0.1 E | 0.7 ± 0.1 DE | 0.6 ± <0.1 DE |
| 18:3n–3 | 14.4 ± 2.1 AC | 17.4 ± 0.5 AB | 16.3 ± 2.1 AB | 25.1 ± 1.1 B | 16.6 ± 0.4 AB | 14.6 ± 0.8 A | 7.5 ± 0.3 C | 21.2 ± 2.0 B | 20.3 ± 0.4 AB |
| 18:4n–3 | 1.2 ± 0.2 A | 0.3 ± <0.1 BCD | 1.7 ± 0.1 A | 0.3 ± <0.1 BD | 0.1 ± <0.1 BD | 0.5 ± <0.1 BC | <0.1 ± <0.1 D | 0.8 ± 0.1 C | <0.1 ± <0.1 D |
| 20:0 | 1.0 ± 0.5 AB | 1.4 ± <0.1 B | 0.1 ± <0.1 AC | 0.8 ± 0.1 ABC | 0.3 ± <0.1 AC | 0.7 ± <0.1 ABC | 0.3 ± <0.1 AC | 0.6 ± 0.1 ABC | 0.1 ± <0.1 C |
| 20:1n–9 * | <0.1 ± <0.1 | 0.1 ± 0.1 | 0.1 ± <0.1 | <0.1 ± <0.1 | 0.5 ± <0.1 | 0.3 ± 0.1 | <0.1 ± <0.1 | <0.1 ± <0.1 | <0.1 ± <0.1 |
| 20:2n–6 * | <0.1 ± <0.1 | 0.2 ± <0.1 | 0.2 ± 0.2 | 0.2 ± 0.1 | 1.8 ± 0.1 | 0.2 ± <0.1 | 0.1 ± <0.1 | 0.3 ± <0.1 | 0.2 ± <0.1 |
| 6a,9,12–18:3 * | 3.4 ± 0.6 | 0.2 ± 0.2 | 6.9 ± 4.3 | <0.1 ± <0.1 | <0.1 ± <0.1 | <0.1 ± <0.1 | <0.1 ± <0.1 | <0.1 ± <0.1 | <0.1 ± <0.1 |
| 20:3n–6 | 0.4 ± 0.1 AC | 0.7 ± <0.1 AB | 0.9 ± 0.3 BD | 1.2 ± 0.4 B | 1.0 ± <0.1 B | 0.6 ± <0.1 ADC | 0.1 ± <0.1 E | 0.3 ± <0.1 CE | 0.2 ± <0.1 CE |
| 20:4n–6 | 8.7 ± 1.0 A | 25.1 ± 3.5 B | 8.3 ± 2.8 AD | 22.8 ± 2.1 B | 15.7 ± 0.3 C | 8.1 ± 0.6 A | 12.8 ± 0.2 CD | 3.7 ± 0.2 E | 8.3 ± <0.1 |
| 6a,9,12,15–18:4 * | 45.5 ± 5.9 | 0.9 ± 0.9 | 42.4 ± 6.5 | <0.1 ± <0.1 | <0.1 ± <0.1 | <0.1 ± <0.1 | <0.1 ± <0.1 | <0.1 ± <0.1 | <0.1 ± <0.1 |
| 20:3n–3 | <0.1 ± <0.1 A | 0.2 ± 0.2 ABC | <0.1 ± <0.1 A | 0.4 ± 0.1 BC | 0.3 ± <0.1 BC | 0.2 ± <0.1 AB | <0.1 ± <0.1 A | 0.4 ± 0.1 C | 0.2 ± <0.1 AB |
| 20:4n–3 | 0.2 ± 0.1 AC | 0.1 ± <0.1 ABC | 0.3 ± 0.2 AC | 0.2 ± 0.1 AC | 0.1 ± <0.1 AB | 0.2 ± <0.1 AC | <0.1 ± <0.1 B | 0.3 ± <0.1 C | 0.3 ± <0.1 C |
| 20:5n–3 | 0.9 ± 0.1 AD | 7.4 ± 1.6 BC | 2.4 ± 0.5 ABD | 6.1 ± <0.1 ABC | 1.6 ± <0.1 AD | 8.0 ± 0.5 BC | 0.2 ± <0.1 D | 10.3 ± 1.5 C | 6.7 ± 0.2 BC |
| 22:0 | 0.3 ± 0.2 AC | 1.6 ± 0.2 B | 0.1 ± 0.1 AC | 1.1 ± 0.1 B | 1.4 ± 0.1 B | 1.3 ± <0.1 B | 0.1 ± <0.1 C | 0.5 ± 0.1 A | <0.1 ± <0.1 C |
| 23:1 * | <0.1 ± <0.1 | <0.1 ± <0.1 | <0.1 ± <0.1 | <0.1 ± <0.1 | <0.1 ± <0.1 | 0.2 ± <0.1 | <0.1 ± <0.1 | 0.1 ± <0.1 | <0.1 ± <0.1 |
| 22:4n–6 * | <0.1 ± <0.1 | 0.1 ± <0.1 | 0.1 ± <0.1 | 0.7 ± <0.1 | 0.1 ± <0.1 | <0.1 ± <0.1 | <0.1 ± <0.1 | <0.1 ± <0.1 | <0.1 ± <0.1 |
| 22:5n–3 * | <0.1 ± <0.1 | <0.1 ± <0.1 | <0.1 ± <0.1 | 0.7 ± 0.1 | <0.1 ± <0.1 | <0.1 ± <0.1 | <0.1 ± <0.1 | <0.1 ± <0.1 | <0.1 ± <0.1 |
| 24:0 | 0.4 ± 0.2 AD | 3.0 ± 0.8 B | 1.0 ± 0.5 ACD | 1.7 ± 0.2 AB | 1.7 ± 0.2 BC | 1.5 ± 0.1 AB | 0.5 ± <0.1 AD | 1.3 ± 0.3 AC | <0.1 ± <0.1 D |
| 24:1 * | <0.1 ± <0.1 | <0.1 ± <0.1 | <0.1 ± <0.1 | 0.2 ± 0.1 | <0.1 ± <0.1 | 1.3 ± 0.1 | <0.1 ± <0.1 | 1.0 ± 0.1 | 0.1 ± <0.1 |
| 25:0 * | <0.1 ± <0.1 | 0.1 ± <0.1 | <0.1 ± <0.1 | 0.1 ± <0.1 | <0.1 ± <0.1 | <0.1 ± <0.1 | <0.1 ± <0.1 | <0.1 ± <0.1 | <0.1 ± <0.1 |
| 25:1 * | <0.1 ± <0.1 | <0.1 ± <0.1 | <0.1 ± <0.1 | <0.1 ± <0.1 | 0.5 ± 0.1 | <0.1 ± <0.1 | 0.3 ± <0.1 | <0.1 ± <0.1 | 0.3 ± <0.1 |
| 26:0 * | <0.1 ± <0.1 | 1.4 ± 0.2 | <0.1 ± <0.1 | 0.4 ± 0.1 | 0.5 ± 0.1 | <0.1 ± <0.1 | 0.2 ± <0.1 | 0.1 ± 0.1 | <0.1 ± <0.1 |
| EPA | 0.3 ± <0.1 | 1.2 ± 0.5 | 1.3 ± 0.1 | 0.9 ± 0.1 | no data | 3.8 ± 0.4 | 0.1 ± <0.1 | 5.4 ± 0.8 | no data |
| Fatty Acid | Anamodon attenuatus | Brachythecium rivulare | Entodon schleicherii | Climacium dendroides | Cratoneuron filicinum | Neckera pennata | Rhytidium rugosum | Polytrichum commune | Polytrihastrum longisetum |
|---|---|---|---|---|---|---|---|---|---|
| 9:0 | 0.0 | 0.0 | 0.0 | 0.0 | 0.0 | 0.0 | 0.0 | 0.0 | 0.0 |
| 12:0 | 0.0 | 0.0 | 0.0 | 0.0 | 0.0 | 0.0 | 0.0 | 0.0 | 0.0 |
| 14:0 | 0.2 | 0.2 | 0.0 | 0.2 | 0.1 | 0.3 | 0.1 | 1.6 | 0.3 |
| 15:0 | 0.2 | 0.3 | 0.2 | 0.1 | 0.2 | 0.2 | 0.1 | 0.2 | 0.1 |
| 16:0 | 11.5 | 14.6 | 12.8 | 8.1 | 12.3 | 9.2 | 7.6 | 12.5 | 11.5 |
| 16:1n–9 | 0.2 | 0.1 | 0.1 | 0.2 | 0.1 | 0.2 | 0.1 | 0.2 | 0.4 |
| 16:1n–7 | 0.3 | 0.4 | 0.2 | 0.1 | 0.4 | 0.5 | 0.2 | 0.3 | 0.4 |
| tr16:1 | 0.3 | 0.7 | 0.3 | 0.6 | 0.7 | 0.6 | 0.2 | 0.2 | 0.1 |
| 16:2n–6 | 0.3 | 0.1 | 0.0 | 0.5 | 0.1 | 0.6 | 0.3 | 1.6 | 1.5 |
| 17:0 | 0.1 | 0.2 | 0.1 | 0.2 | 0.1 | 0.2 | 0.1 | 0.2 | 0.2 |
| 16:3n–3 | 0.5 | 0.3 | 0.1 | 1.2 | 1.7 | 1.7 | 1.0 | 4.4 | 2.9 |
| 18:0 | 0.5 | 1.0 | 0.7 | 1.2 | 1.7 | 0.7 | 0.4 | 1.1 | 1.9 |
| 18:1n–9 | 5.0 | 3.4 | 1.2 | 3.6 | 5.9 | 6.5 | 7.8 | 2.7 | 2.4 |
| 18:1n–7 | 1.2 | 1.2 | 0.7 | 0.6 | 1.1 | 2.2 | 1.3 | 1.1 | 1.8 |
| 18:2n–6 | 18.5 | 9.8 | 7.1 | 17.3 | 10.3 | 22.4 | 21.3 | 12.8 | 14.6 |
| 18:3n–6 | 0.9 | 0.9 | 0.7 | 3.9 | 1.0 | 2.5 | 2.0 | 0.8 | 0.8 |
| 18:3n–3 | 17.9 | 15.8 | 21.0 | 26.0 | 22.2 | 18.7 | 18.6 | 33.6 | 30.3 |
| 18:4n–3 | 0.2 | 0.2 | 0.2 | 1.5 | 0.8 | 0.7 | 1.6 | 0.1 | 0.1 |
| 20:0 | 0.1 | 0.1 | 0.2 | 1.1 | 0.2 | 0.6 | 0.2 | 1.4 | 3.2 |
| 20:1n–9 | 0.2 | 0.1 | 0.0 | 0.2 | 0.1 | 0.2 | 0.4 | 0.2 | 0.1 |
| 20:2n–6 | 0.6 | 0.1 | 0.2 | 0.4 | 0.1 | 0.4 | 1.0 | 0.3 | 0.3 |
| 6a,9,12–18:3 | 0.0 | 0.0 | 0.0 | 0.0 | 0.2 | 0.0 | 0.0 | 0.0 | 0.0 |
| 20:3n–6 | 1.6 | 0.9 | 1.7 | 0.7 | 0.9 | 1.3 | 3.4 | 1.1 | 0.6 |
| 20:4n–6 | 27.9 | 18.8 | 24.3 | 19.3 | 13.5 | 17.9 | 14.4 | 14.0 | 14.9 |
| 6a,9,12,15–18:4 | 0.0 | 0.0 | 0.0 | 0.0 | 2.1 | 0.0 | 0.0 | 0.0 | 0.0 |
| 20:3n–3 | 0.4 | 0.3 | 0.9 | 0.5 | 0.0 | 0.4 | 0.5 | 0.7 | 0.7 |
| 20:4n–3 | 0.2 | 0.3 | 0.6 | 0.2 | 0.5 | 0.3 | 1.2 | 0.2 | 0.1 |
| 20:5n–3 | 7.5 | 21.8 | 20.4 | 7.7 | 16.5 | 8.0 | 13.2 | 2.9 | 2.8 |
| 22:0 | 0.0 | 0.2 | 0.5 | 2.0 | 0.4 | 0.5 | 0.5 | 1.9 | 3.0 |
| 23:1 | 0.5 | 0.1 | 0.0 | 0.0 | 0.0 | 0.0 | 0.0 | 0.0 | 0.0 |
| 22:4n–6 | 0.0 | 0.0 | 0.0 | 0.1 | 0.0 | 0.2 | 0.1 | 0.2 | 0.2 |
| 22:5n–3 | 0.0 | 0.1 | 0.1 | 0.1 | 3.5 | 0.1 | 0.1 | 0.0 | 0.1 |
| 24:0 | 1.4 | 1.5 | 3.2 | 0.8 | 1.9 | 1.2 | 0.6 | 2.0 | 1.9 |
| 24:1 | 0.7 | 0.1 | 0.3 | 0.0 | 0.2 | 0.6 | 0.6 | 0.5 | 0.6 |
| 25:0 | 0.2 | 0.1 | 0.2 | 0.0 | 0.0 | 0.0 | 0.0 | 0.0 | 0.0 |
| 25:1 | 0.0 | 0.0 | 0.0 | 0.0 | 0.0 | 0.0 | 0.0 | 0.0 | 0.0 |
| 26:0 | 0.3 | 0.3 | 0.8 | 0.2 | 0.5 | 0.3 | 0.1 | 0.4 | 1.1 |
| EPA | 1.1 | 2.6 | 4.0 | 1.6 | 1.9 | 1.3 | 4.4 | 0.5 | 0.1 |
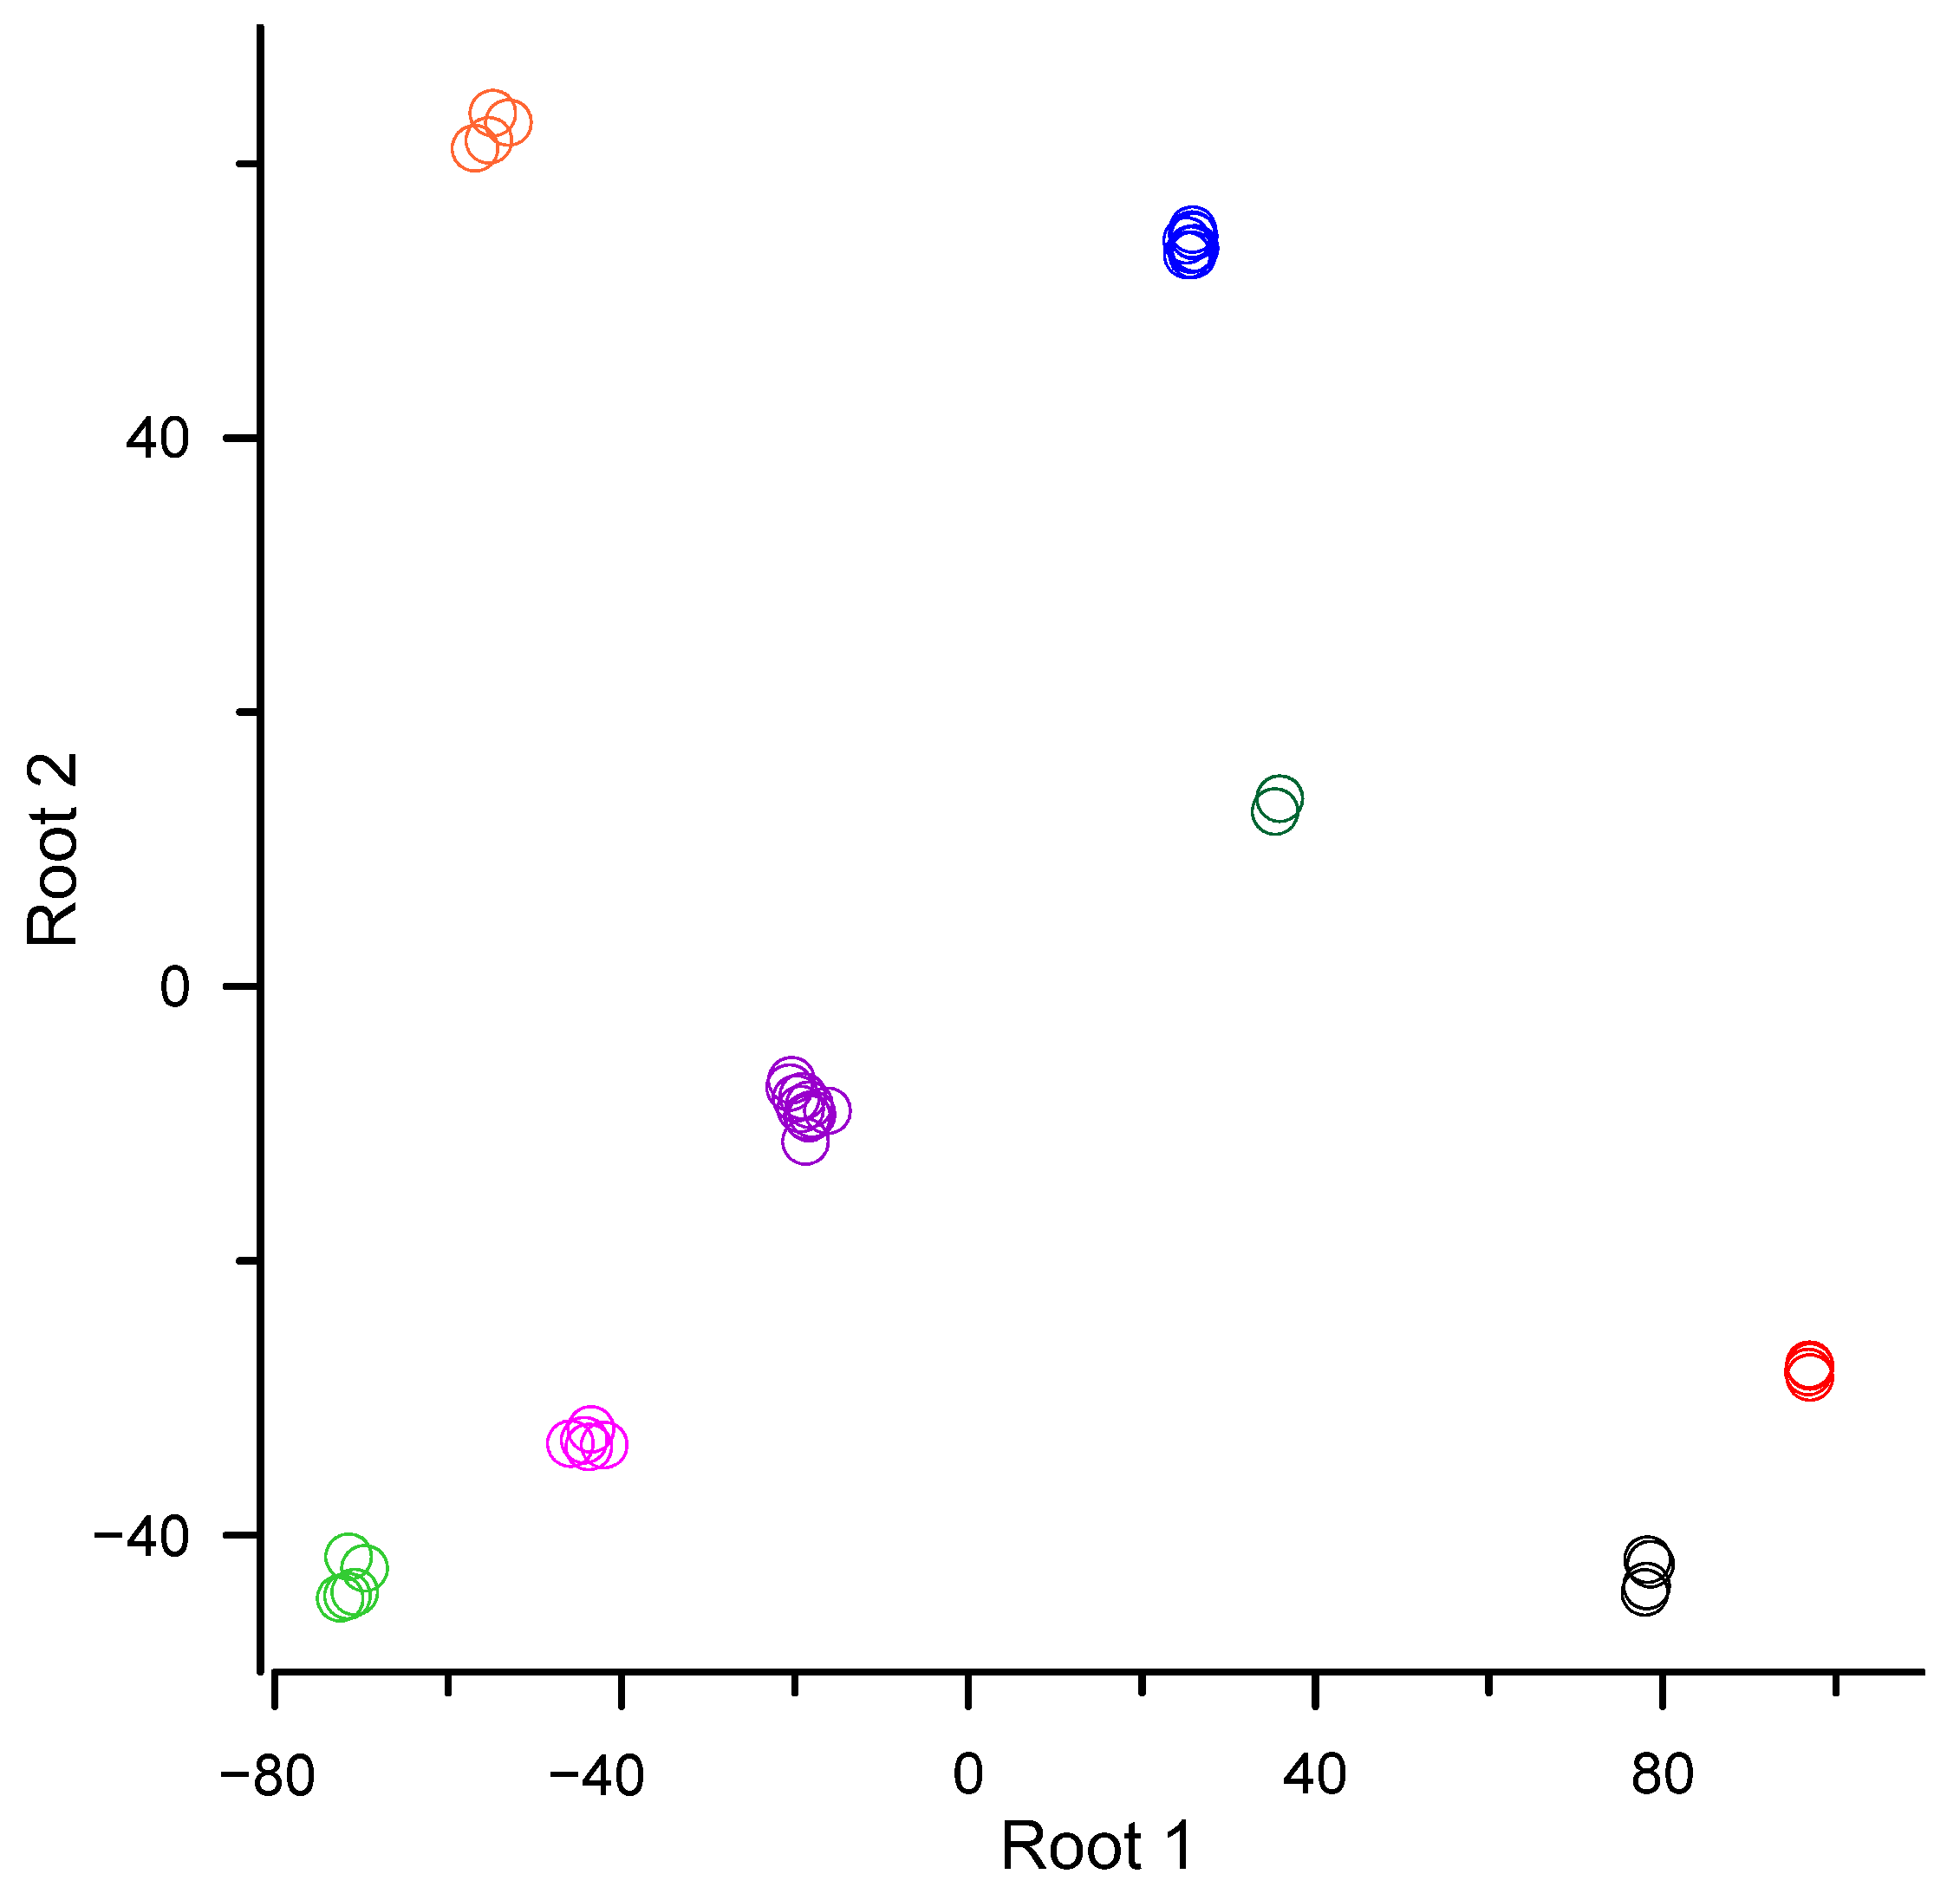
| Root 1 | Root 2 | |
|---|---|---|
| Canonical R | 0.9998 | 0.9997 |
| Chi−square | 959 | 764 |
| Degree of freedom | 210 | 174 |
| p | <0.0001 | 0.0001 |
| Means of canonical variables: | ||
| order Dicranales (Bryophyta) | 78.2 | −42.9 |
| order Bryales (Bryophyta) | 96.9 | −28.0 |
| order Hypnales (Bryophyta) | 25.7 | 54.1 |
| order Polytrichales (Bryophyta) | 35.6 | 13.2 |
| order Ptilidiales (Marchantiophyta) | −71.2 | −43.4 |
| order Marchantiales (Marchantiophyta) | −18.9 | −8.8 |
| order Metzgeriales (Marchantiophyta) | −43.9 | −33.1 |
| order Jungermanniales (Marchantiophyta) | −55.0 | 62.4 |
| Factor structure coefficients: | ||
| 12:0 | −0.009 | −0.007 |
| 14:0 | −0.011 | −0.008 |
| 15:0 | −0.031 | −0.017 |
| 16:0 | −0.027 | <0.001 |
| 16:1n–9 | −0.017 | 0.001 |
| tr16:1 | −0.014 | 0.002 |
| 16:2n–6 | −0.032 | <0.001 |
| 17:0 | −0.002 | −0.002 |
| 16:3n–3 | −0.033 | −0.014 |
| 18:0 | 0.001 | −0.002 |
| 18:1n–9 | −0.004 | <0.001 |
| 18:1n–7 | −0.007 | 0.003 |
| 18:2n–6 | −0.036 | −0.001 |
| 18:3n–6 | 0.015 | 0.001 |
| 18:3n–3 | 0.006 | 0.023 |
| 18:4n–3 | 0.022 | −0.005 |
| 20:0 | 0.008 | −0.004 |
| 20:2n–6 | −0.026 | −0.001 |
| 6a,9,12–18:3 | 0.021 | −0.015 |
| 20:3n–6 | 0.011 | 0.015 |
| 20:4n–6 | 0.007 | 0.010 |
| 6a,9,12,15–18:4 | 0.027 | −0.020 |
| 20:3n–3 | −0.007 | 0.018 |
| 20:4n–3 | 0.009 | 0.022 |
| 20:5n–3 | 0.004 | 0.033 |
| 22:0 | 0.003 | −0.008 |
| 22:4n–6 | 0.007 | 0.007 |
| 22:5n–3 | 0.003 | 0.013 |
| 25:0 | 0.005 | 0.007 |
| 26:0 | 0.003 | −0.001 |
Disclaimer/Publisher’s Note: The statements, opinions and data contained in all publications are solely those of the individual author(s) and contributor(s) and not of MDPI and/or the editor(s). MDPI and/or the editor(s) disclaim responsibility for any injury to people or property resulting from any ideas, methods, instructions or products referred to in the content. |
© 2023 by the authors. Licensee MDPI, Basel, Switzerland. This article is an open access article distributed under the terms and conditions of the Creative Commons Attribution (CC BY) license (https://creativecommons.org/licenses/by/4.0/).
Share and Cite
Filippova, I.P.; Makhutova, O.N.; Guseynova, V.E.; Gladyshev, M.I. Fatty Acid Profiles of Some Siberian Bryophytes and Prospects of Their Use in Chemotaxonomy. Biomolecules 2023, 13, 840. https://doi.org/10.3390/biom13050840
Filippova IP, Makhutova ON, Guseynova VE, Gladyshev MI. Fatty Acid Profiles of Some Siberian Bryophytes and Prospects of Their Use in Chemotaxonomy. Biomolecules. 2023; 13(5):840. https://doi.org/10.3390/biom13050840
Chicago/Turabian StyleFilippova, Irina P., Olesia N. Makhutova, Valeriya E. Guseynova, and Michail I. Gladyshev. 2023. "Fatty Acid Profiles of Some Siberian Bryophytes and Prospects of Their Use in Chemotaxonomy" Biomolecules 13, no. 5: 840. https://doi.org/10.3390/biom13050840