
Evolution of the Immunoglobulin Isotypes—Variations of Biophysical Properties among Animal Classes
 and
and 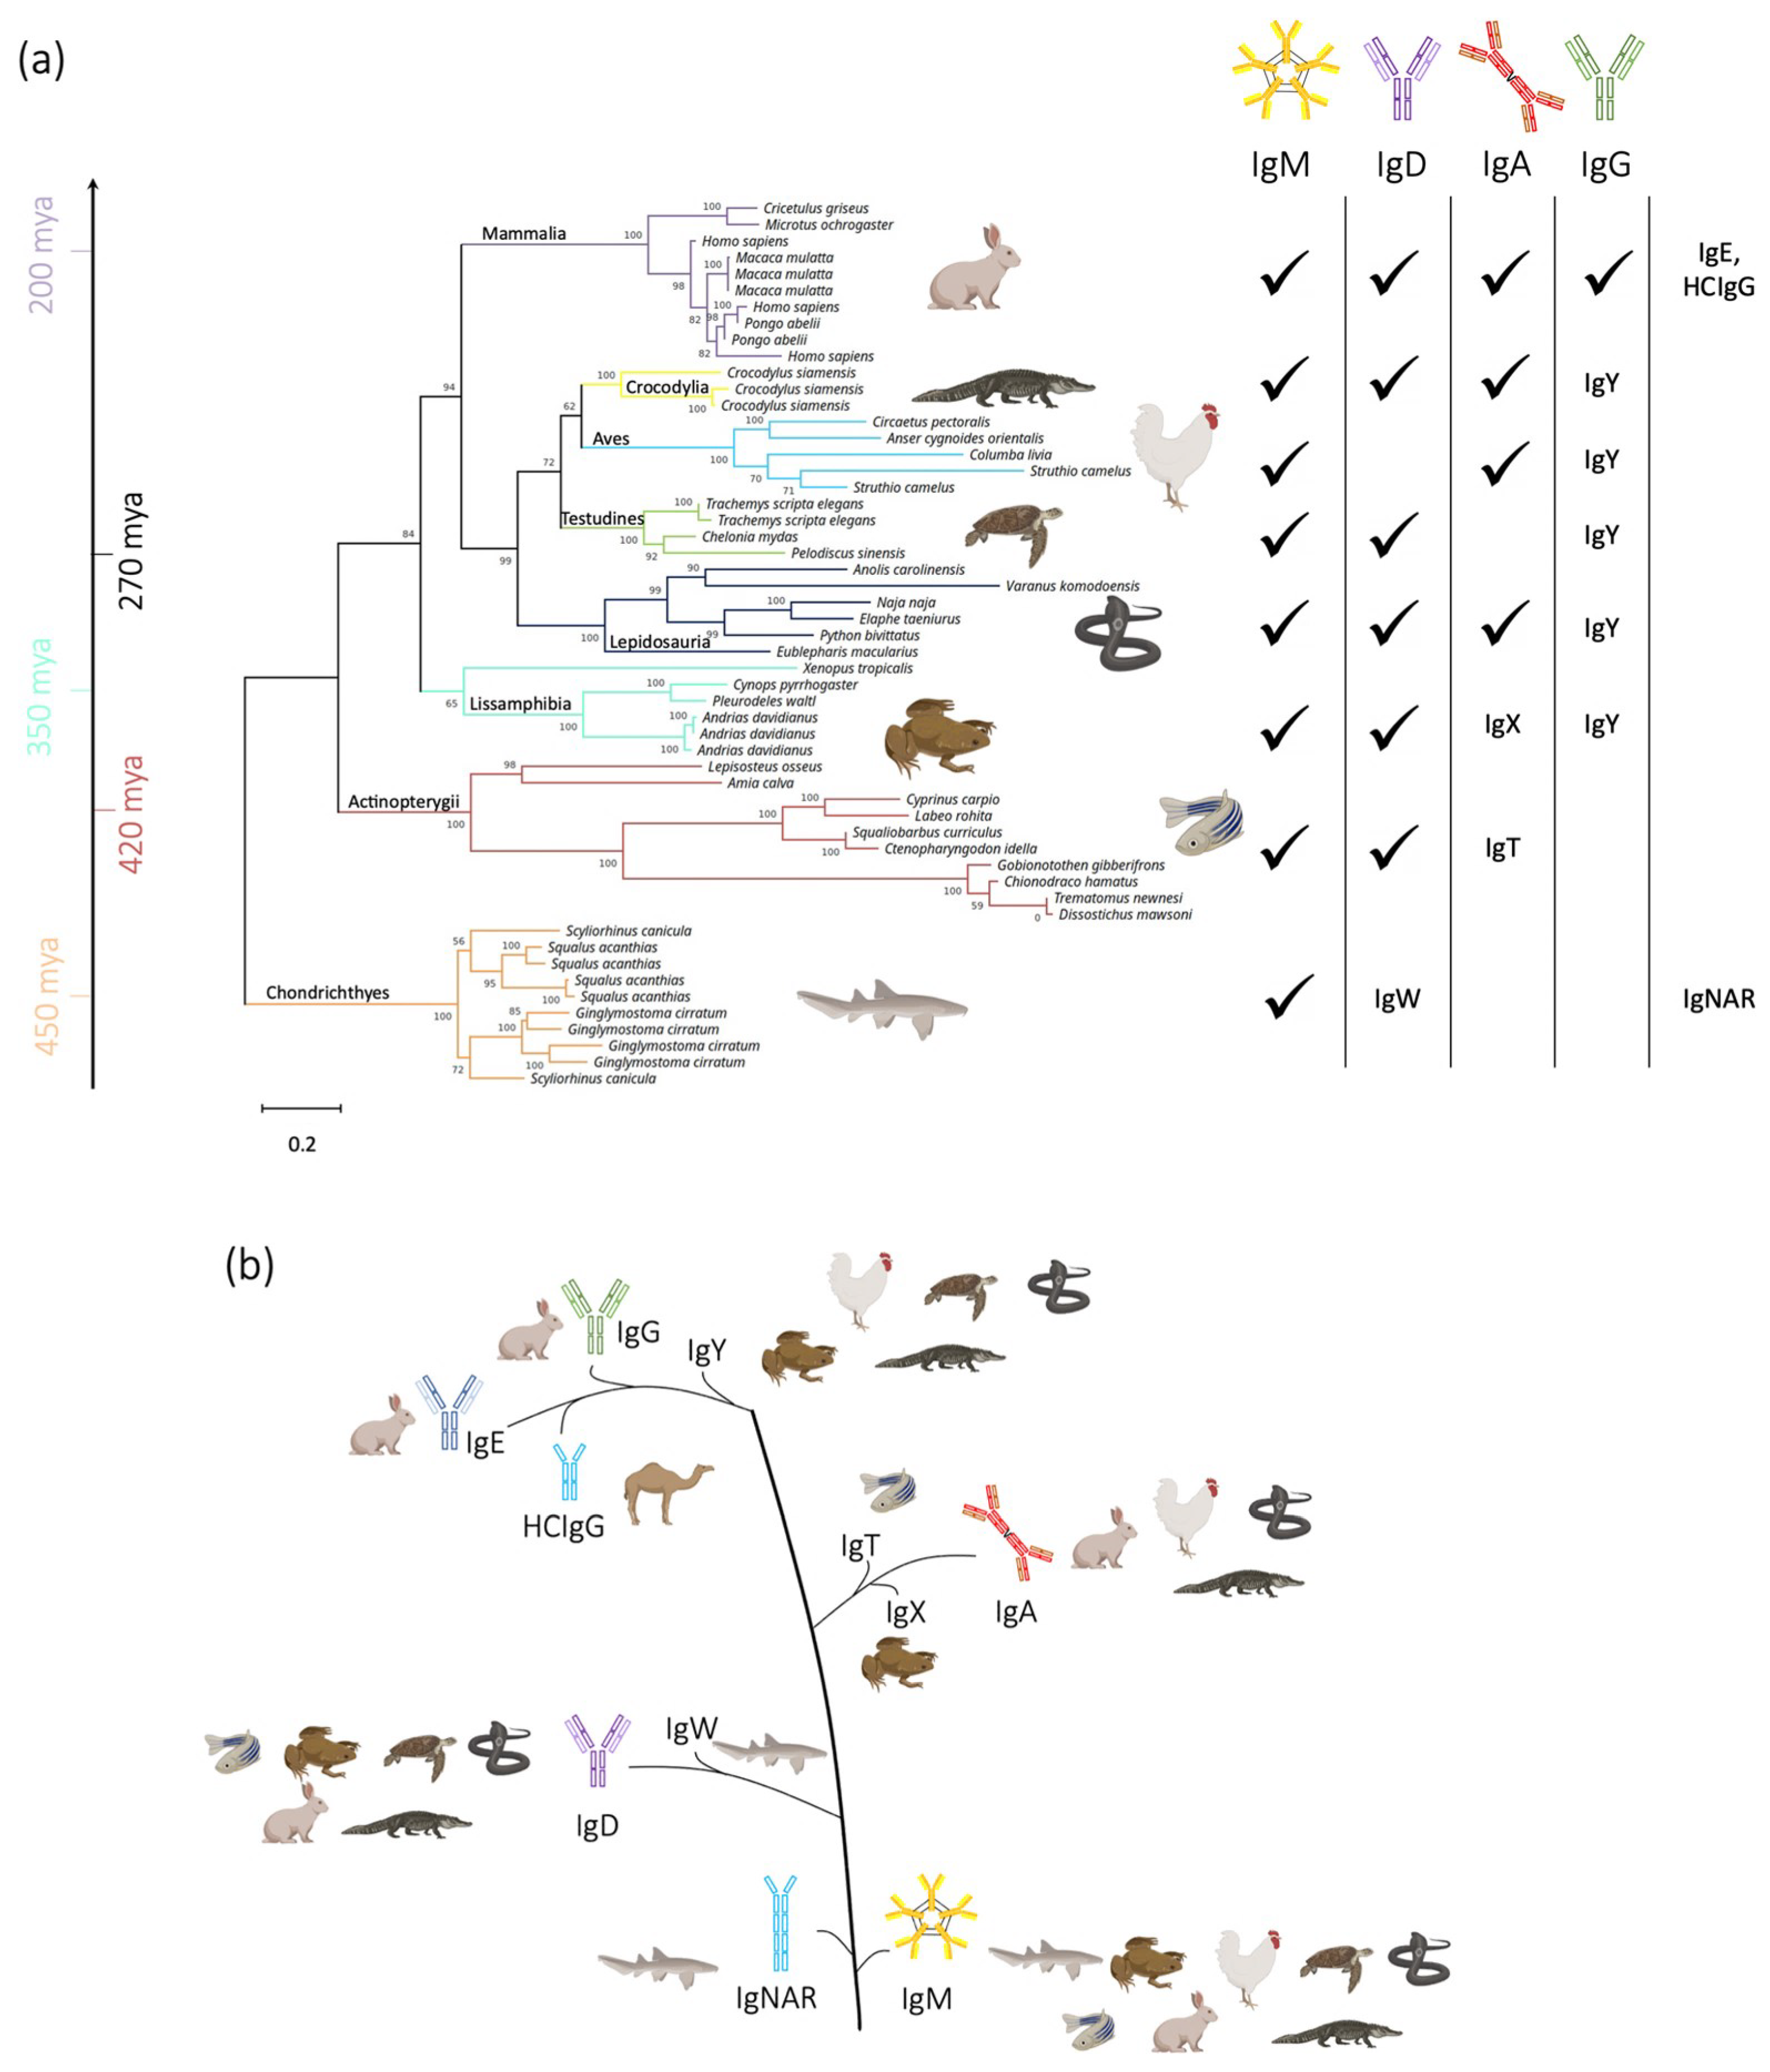
Abstract
:1. Introduction
2. Materials and Methods
2.1. Dataset Generation and Alignment
2.2. Phylogenetic Tree
2.3. Evolutionary Coupled Residues Analysis
2.4. Sequence Logos
2.5. Principal Component Analysis (PCA)
3. Results
3.1. Evolutionary Couplings Analysis
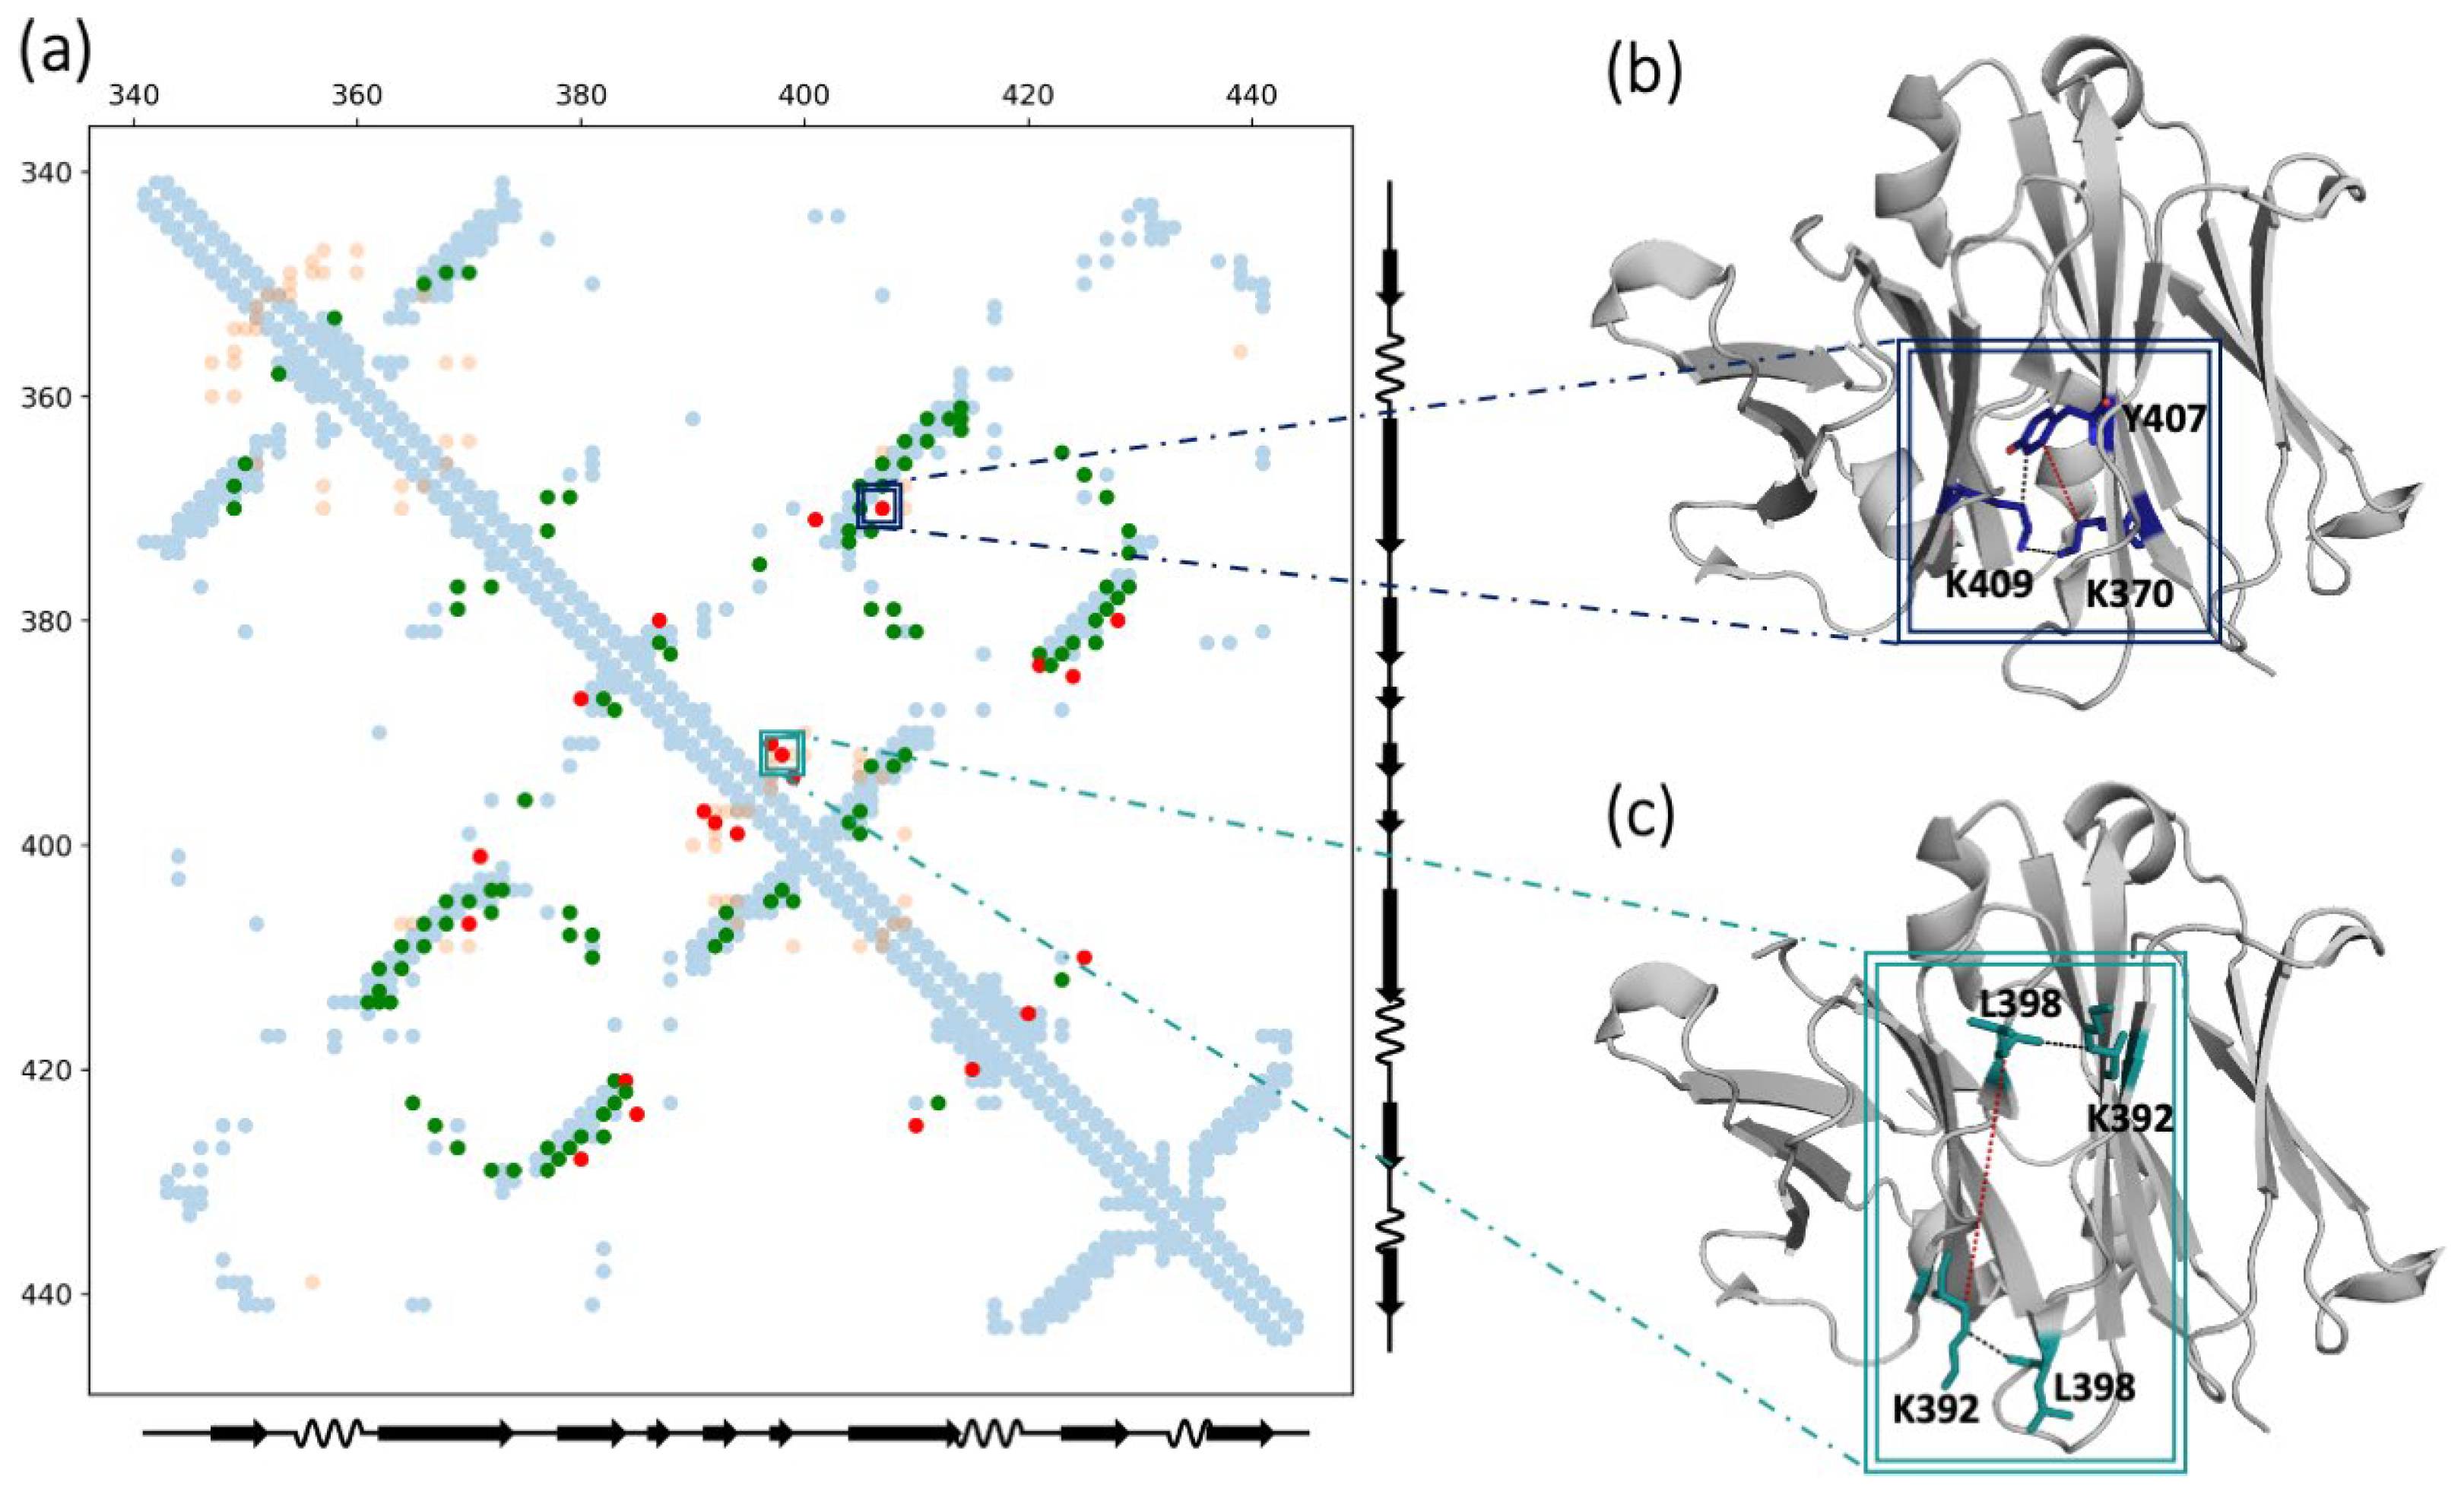
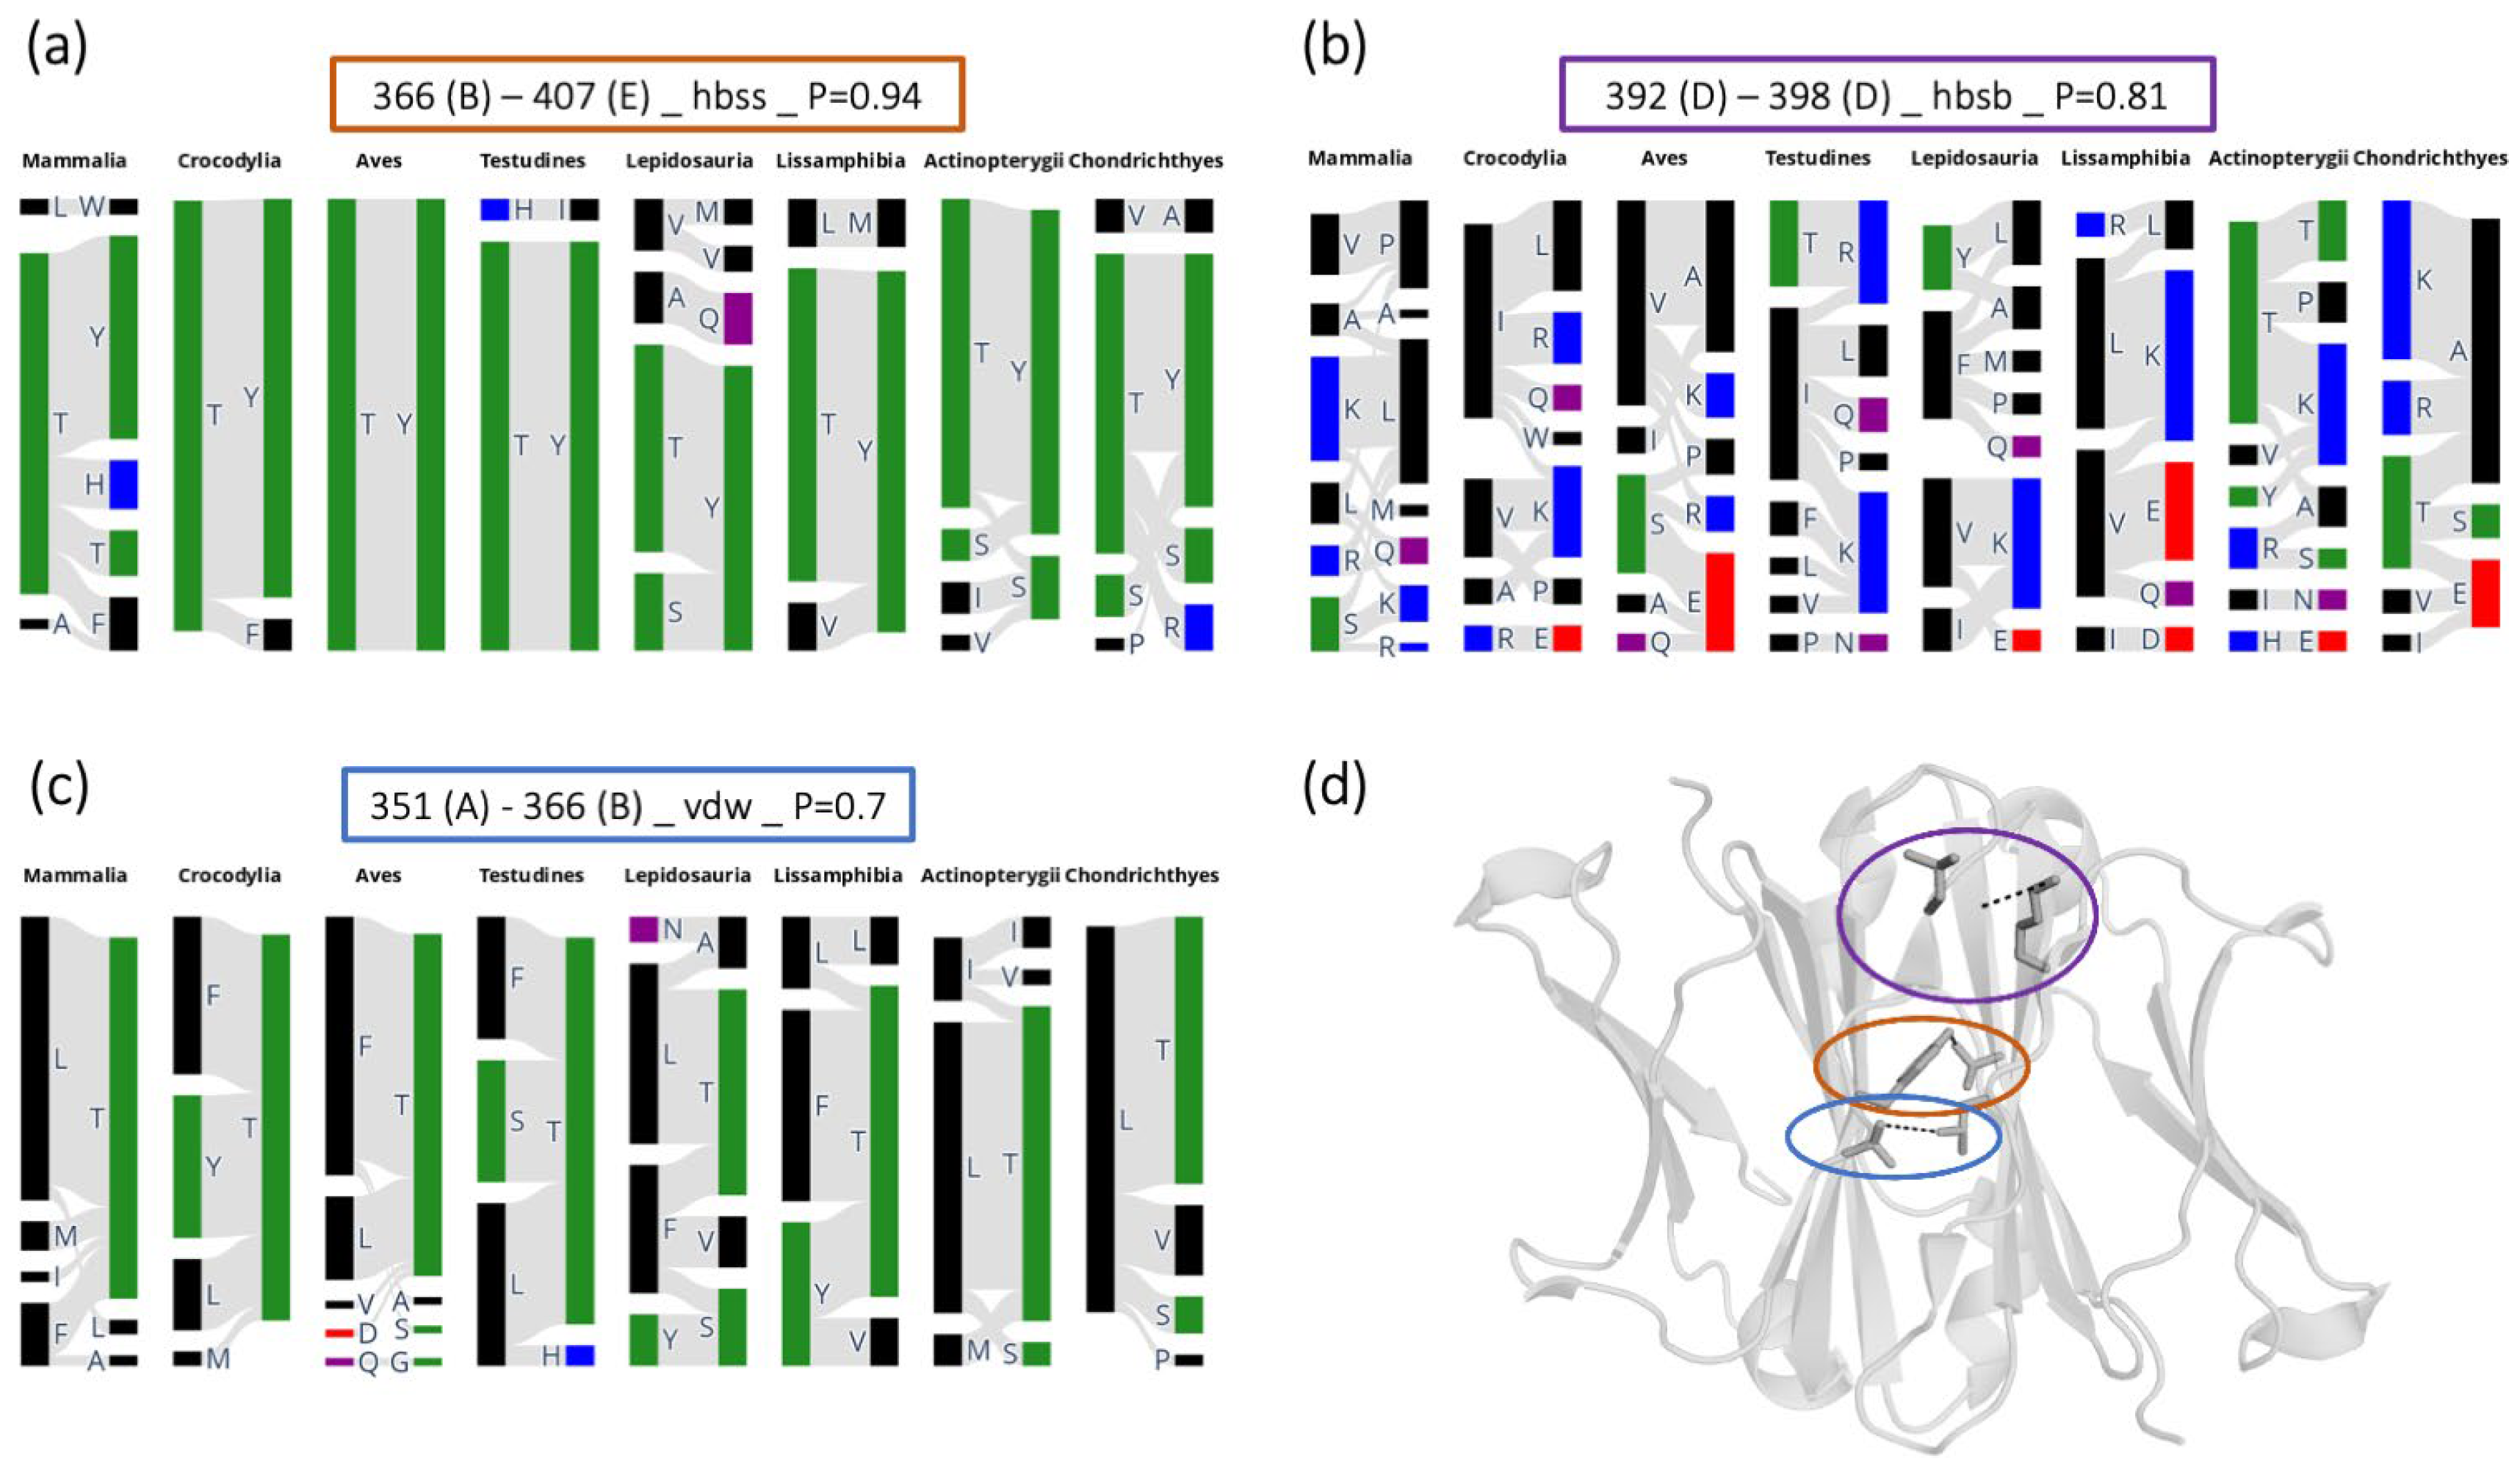
3.2. Evolution-Based Analysis of Interdomain Contacts
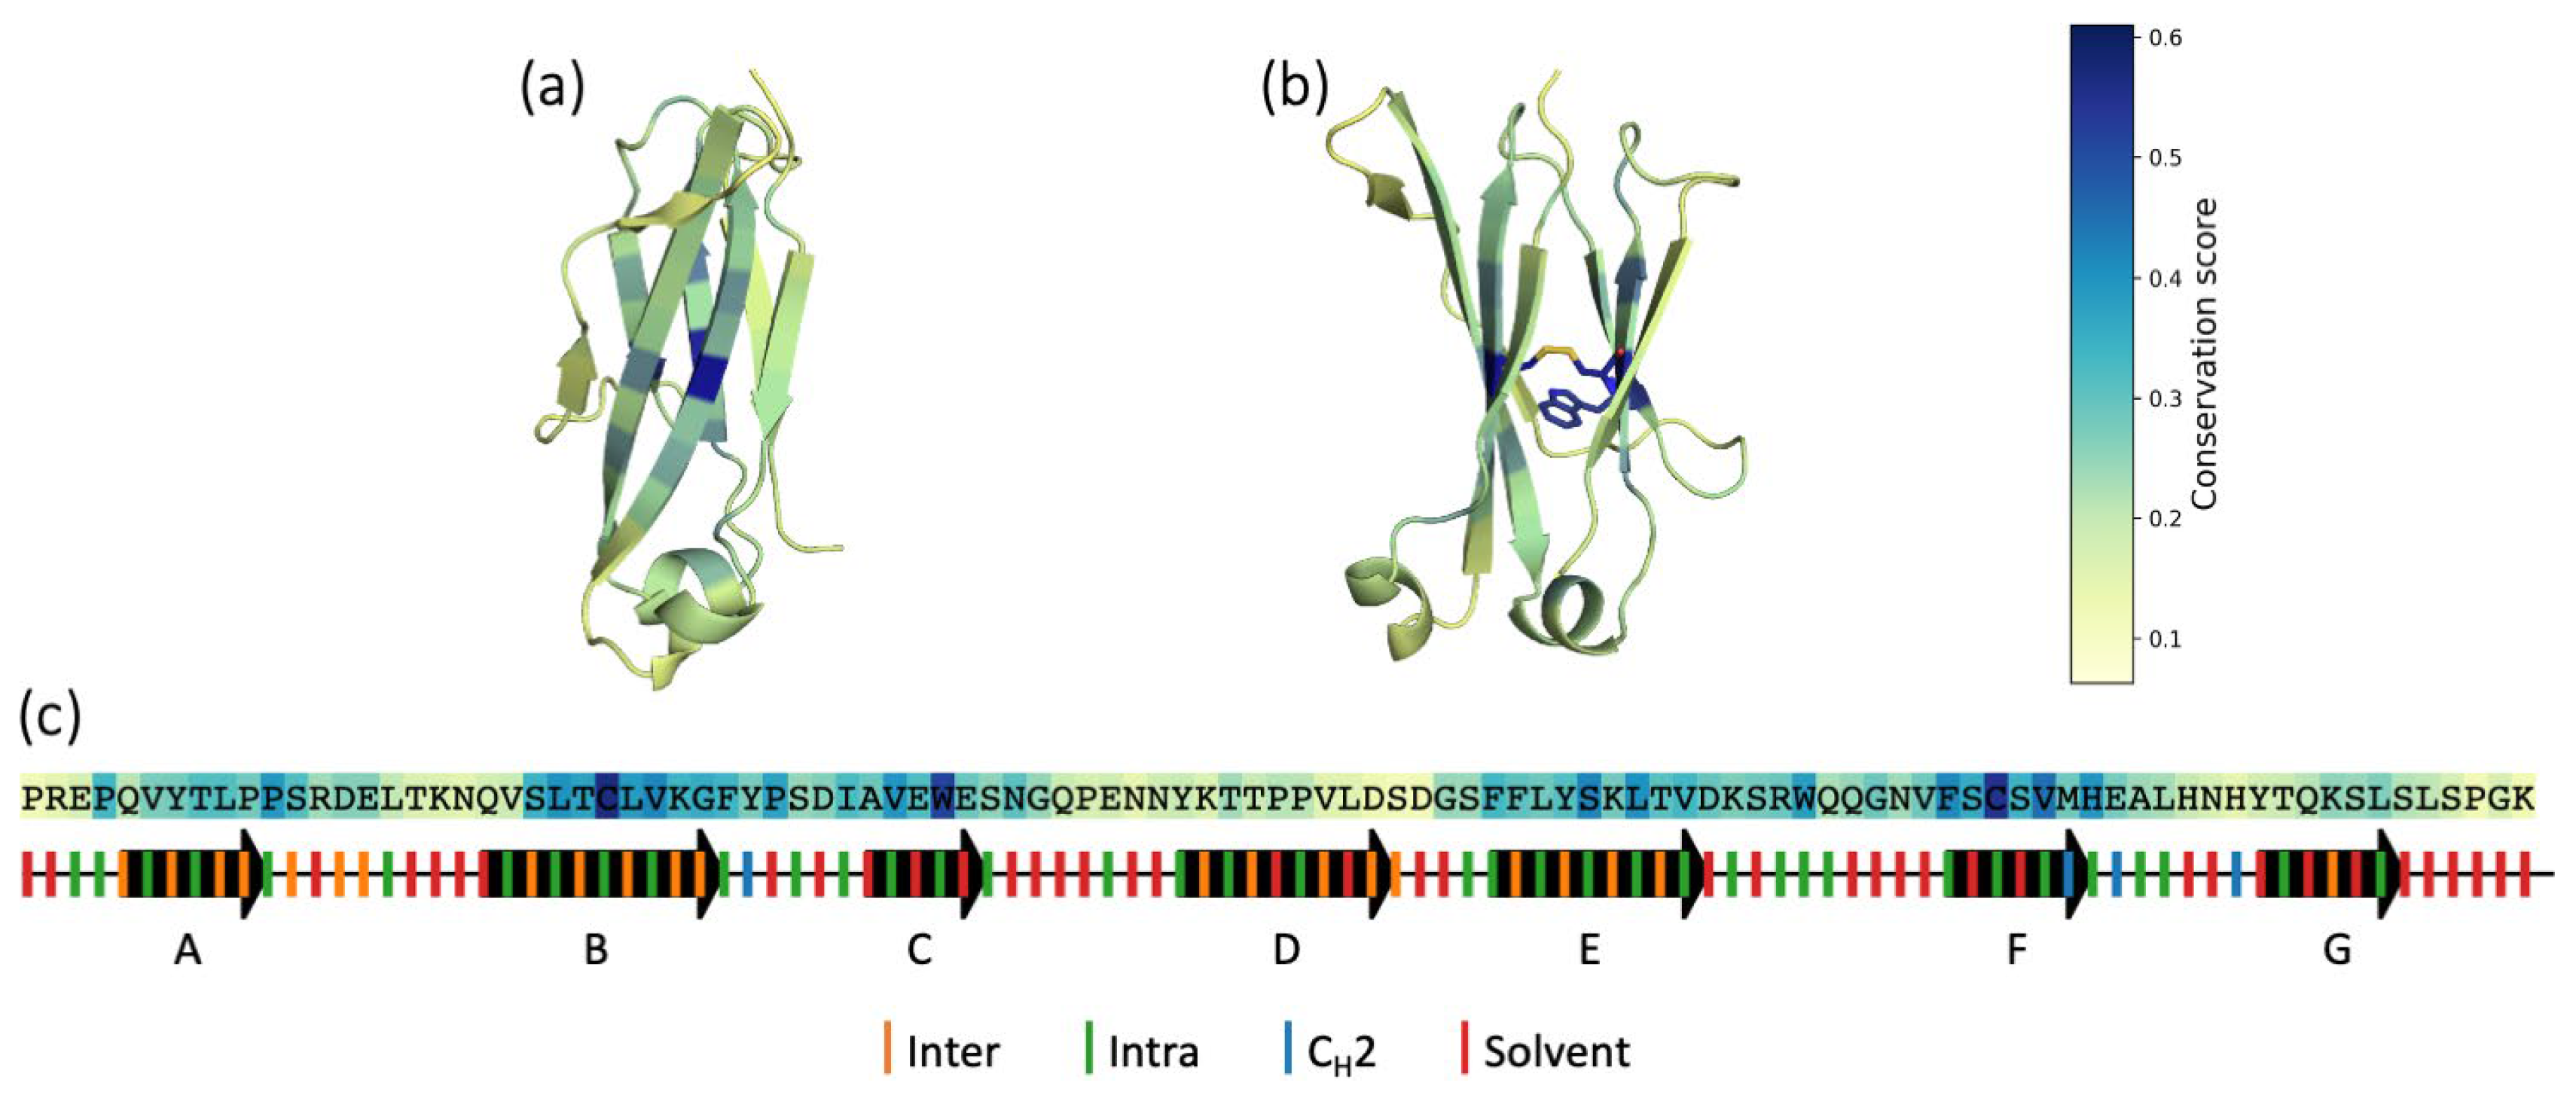
3.3. Sequence Conservation
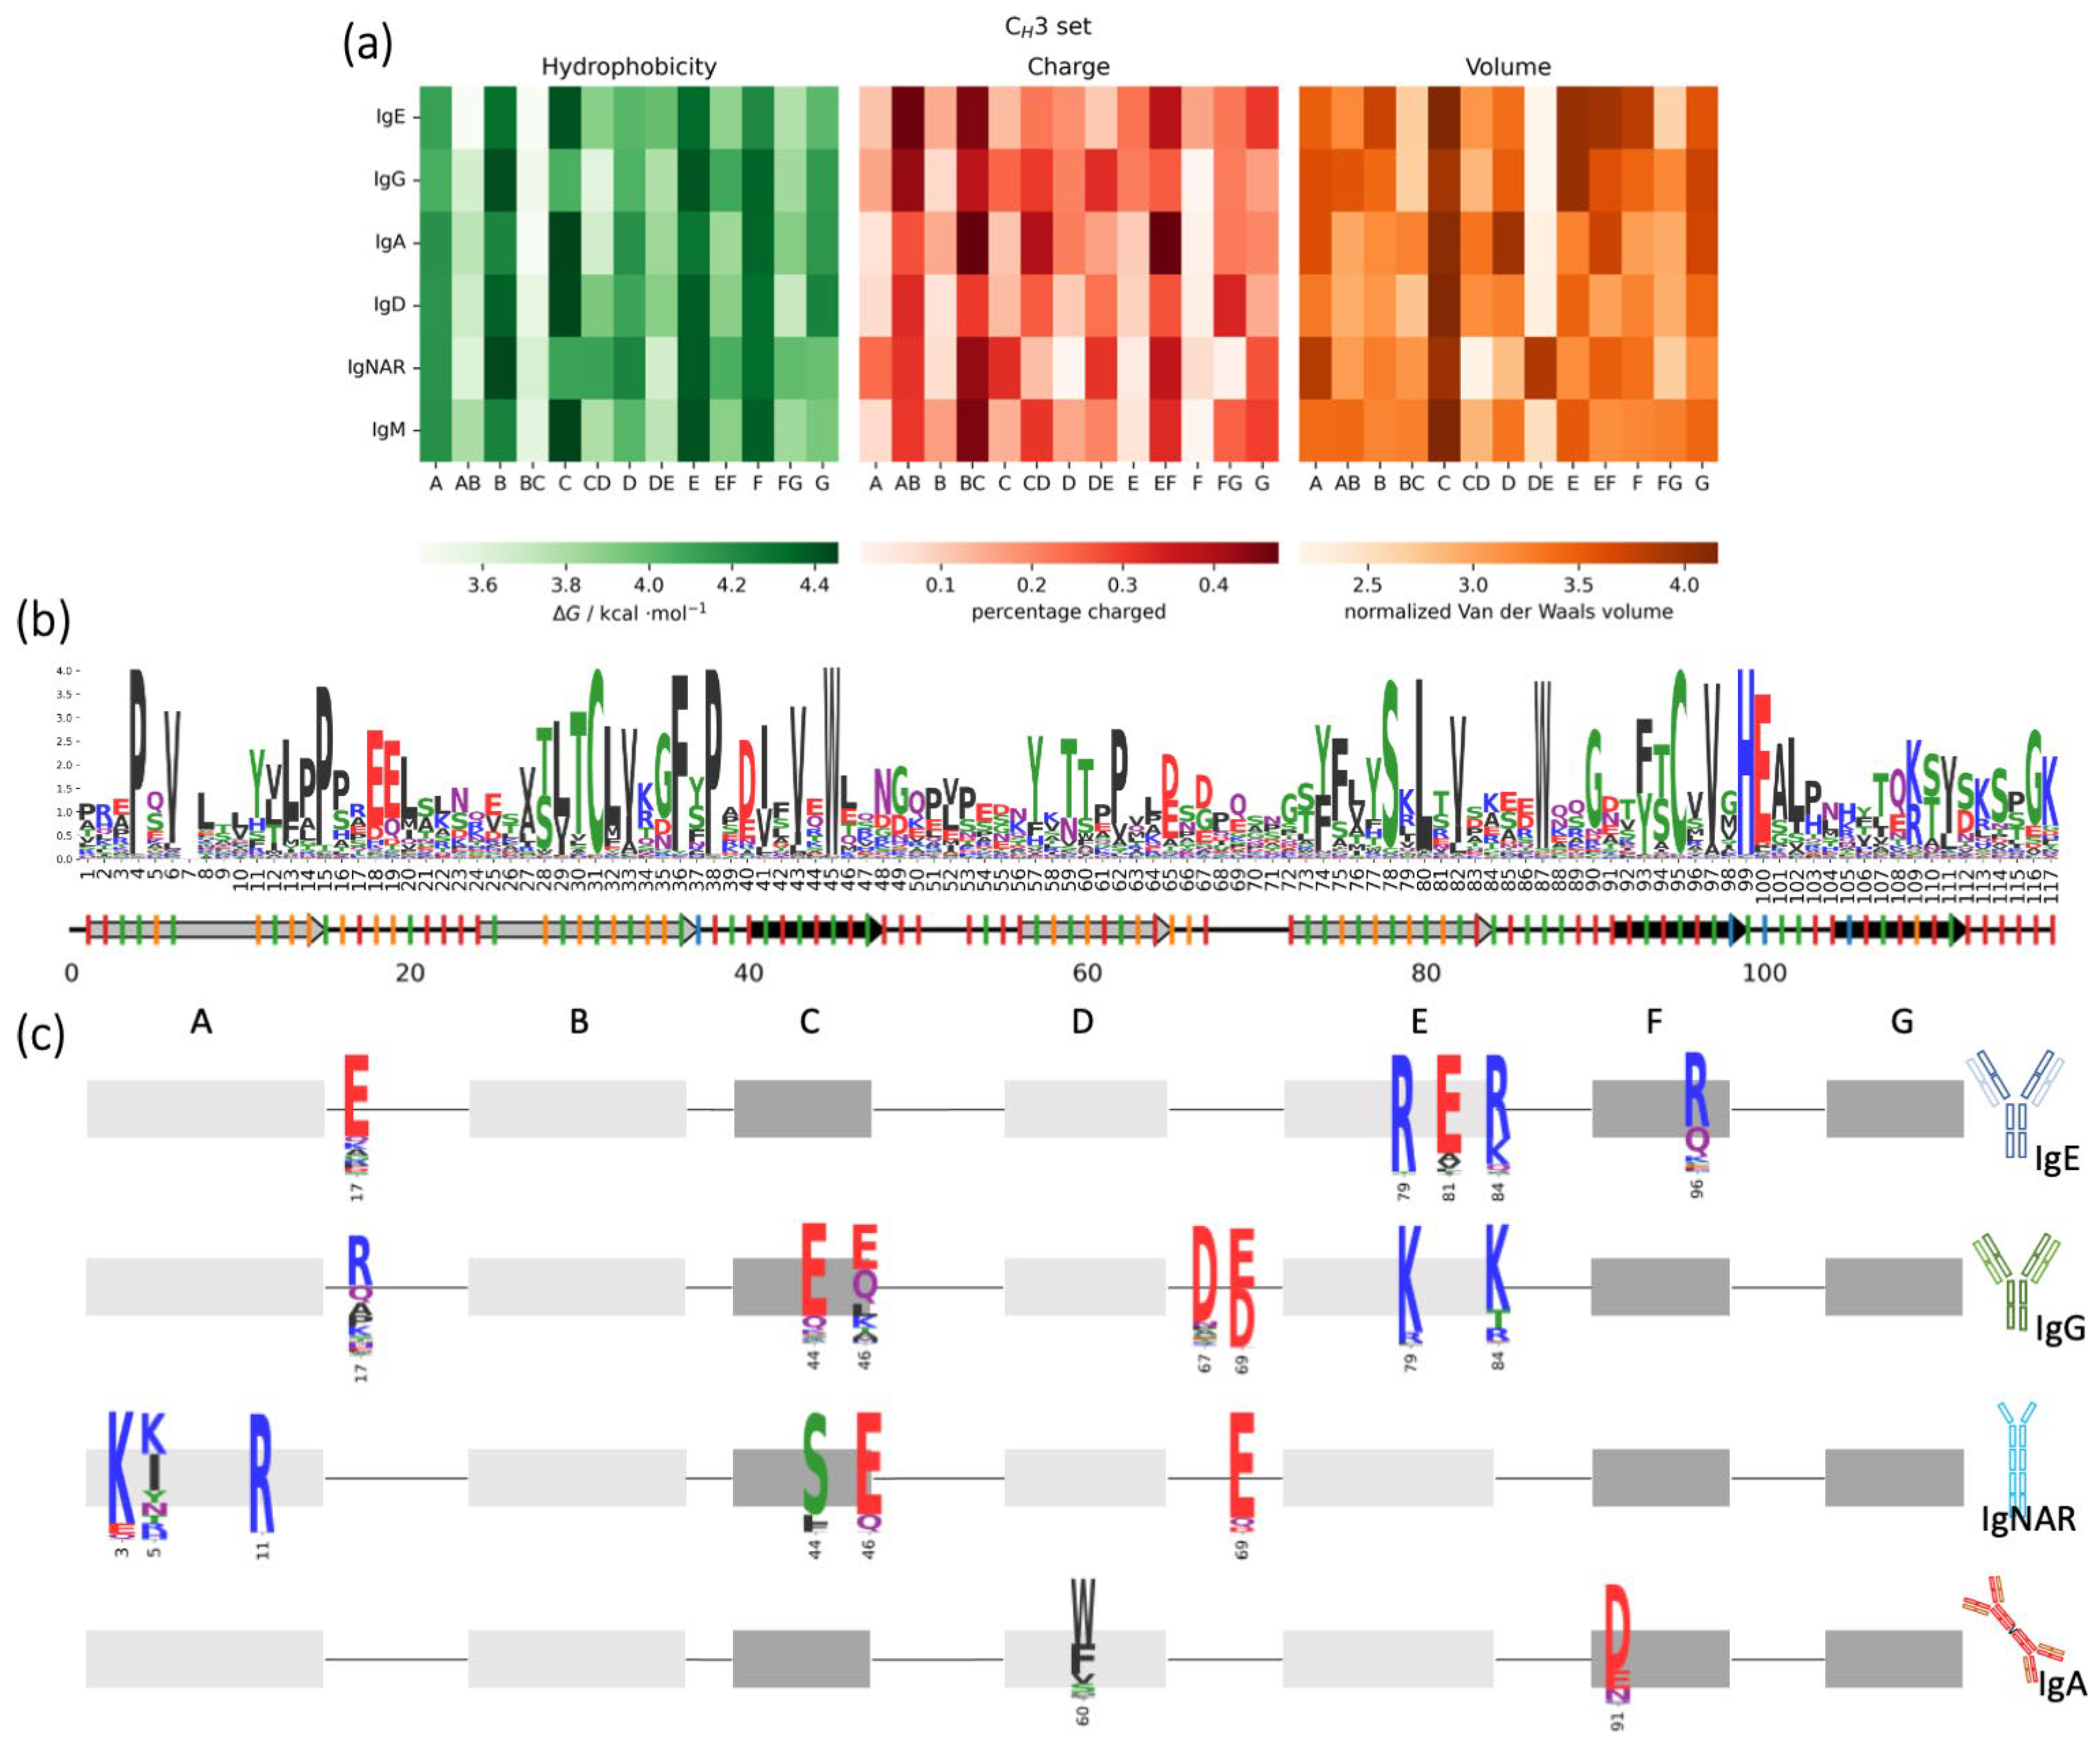
3.4. CH3 Domains: Biophysical Properties in Different Isotypes and Animal Classes
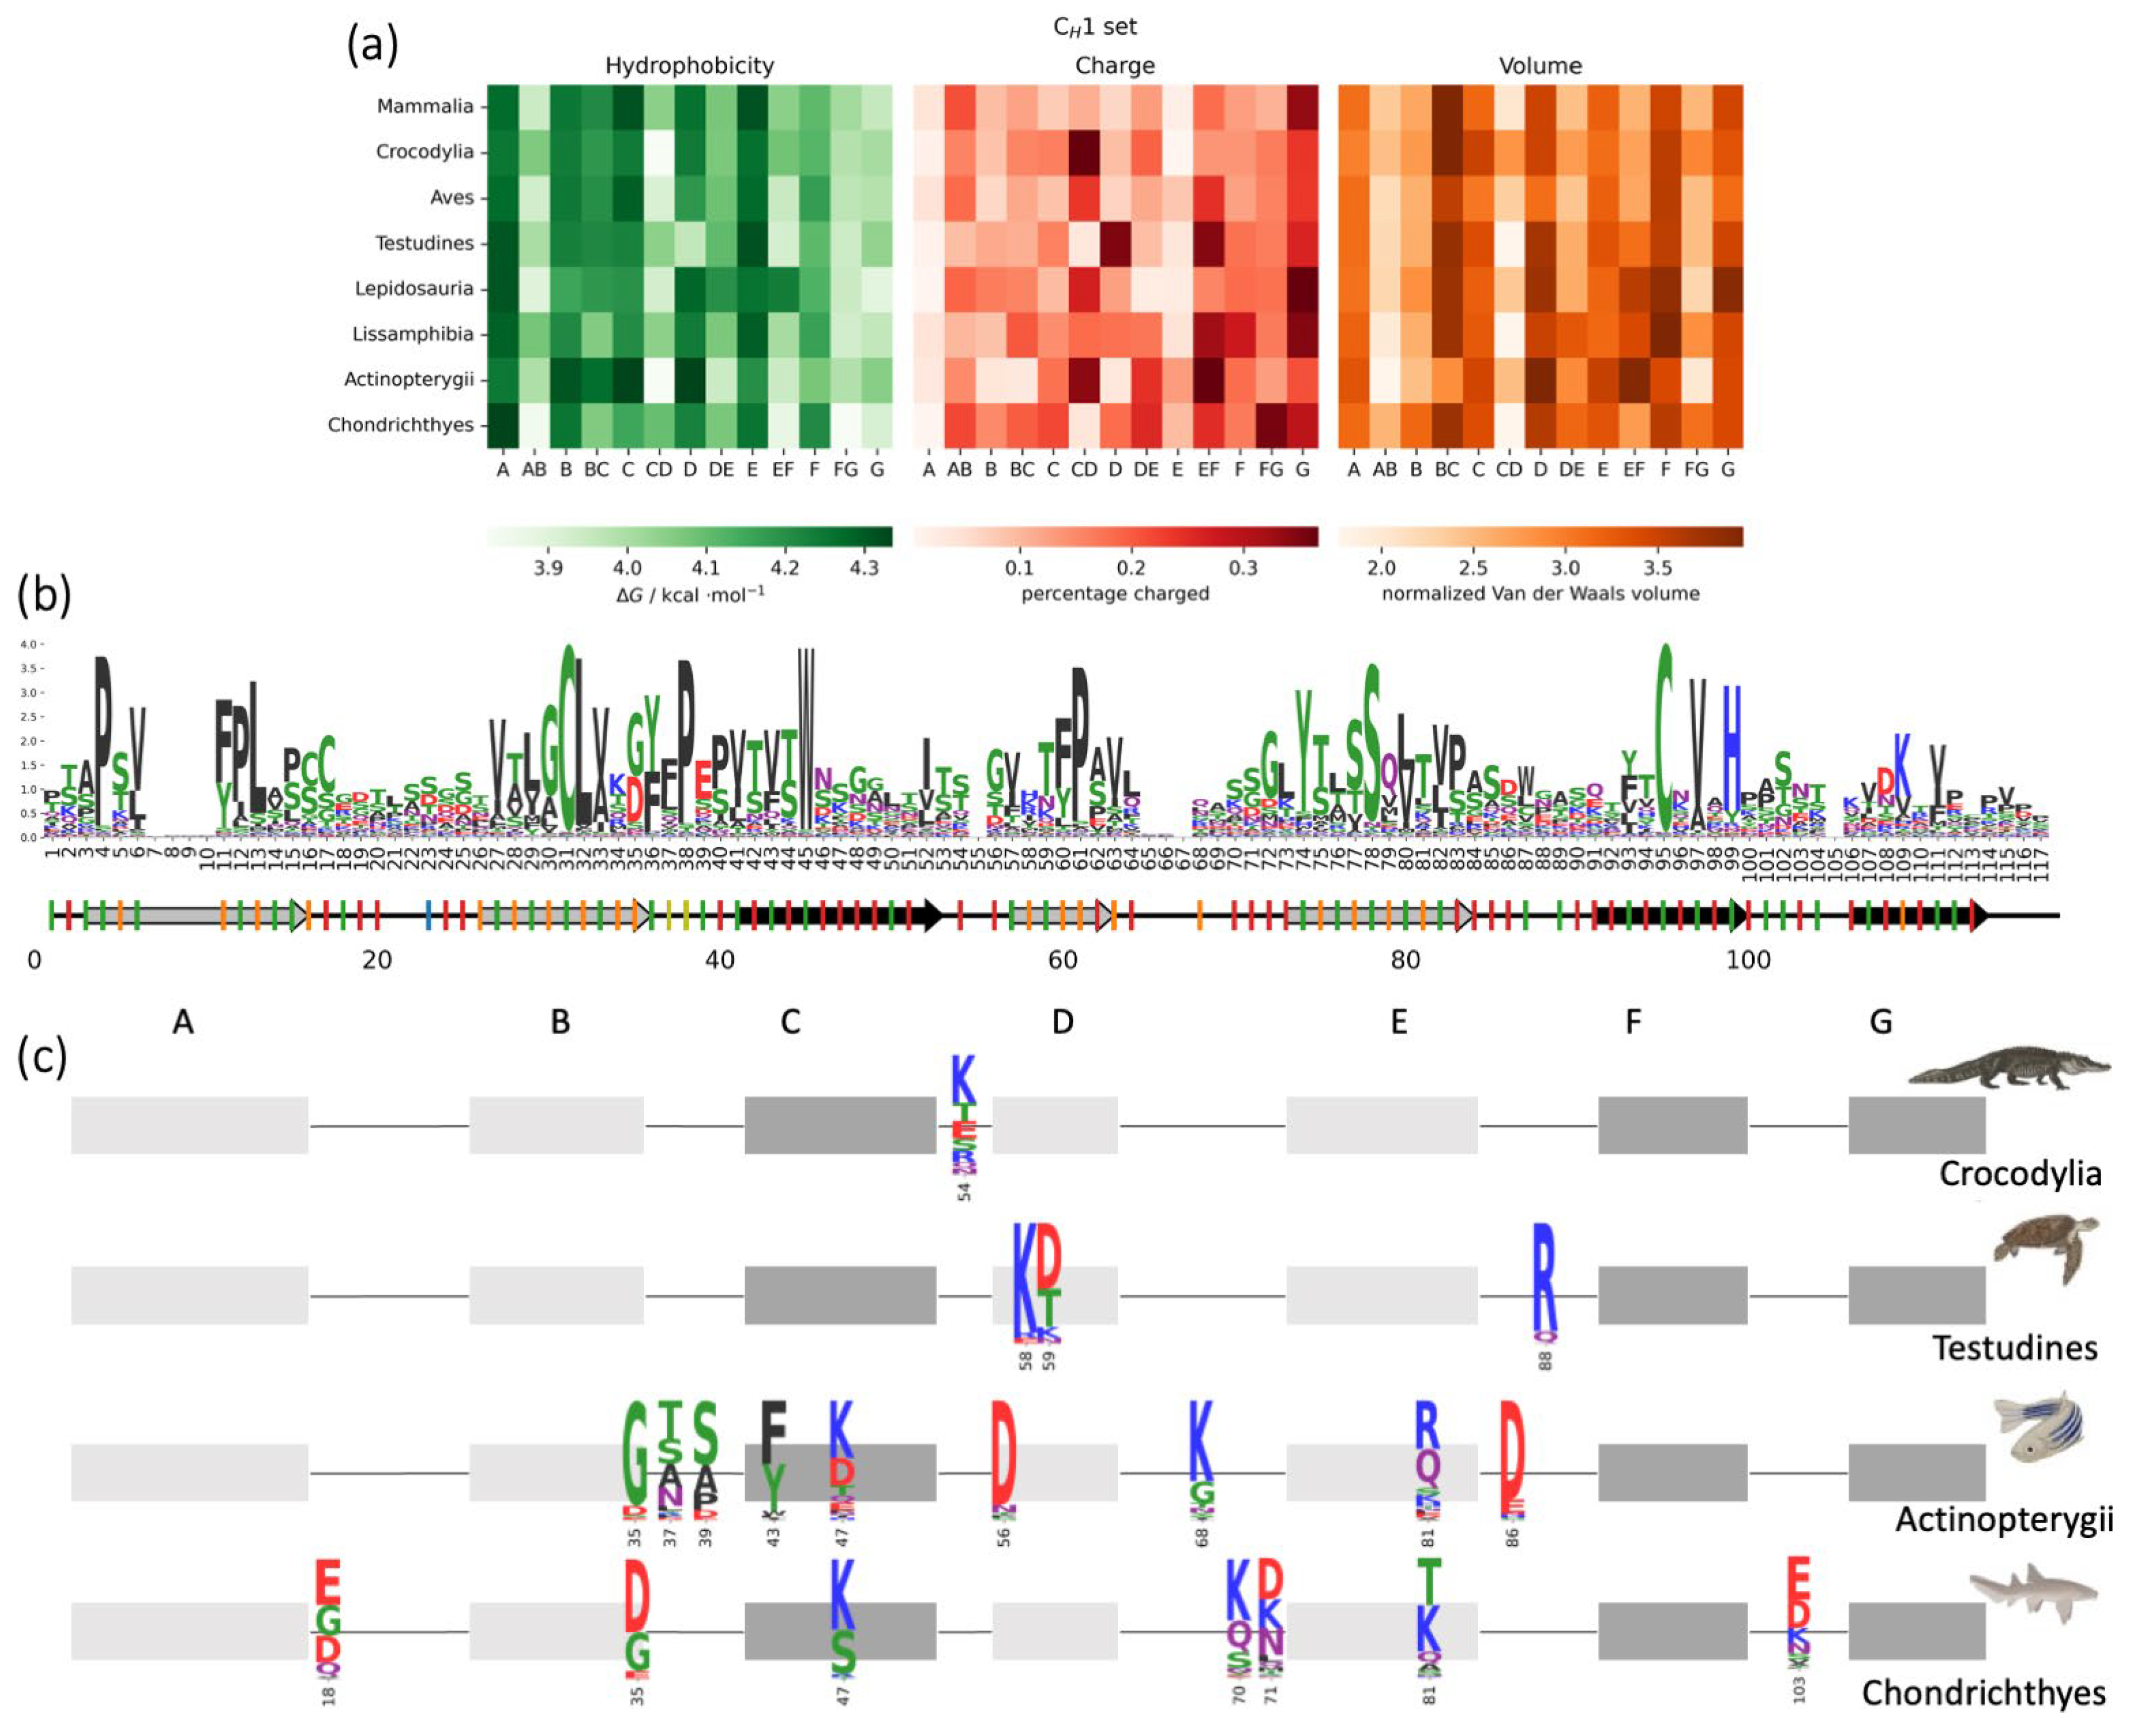
3.5. CH1 Domains: Biophysical Properties in Different Isotypes and Animal Classes
3.6. CL Domains: Biophysical Properties in Different Isotypes and Animal Classes
4. Discussion
5. Conclusions
Supplementary Materials
Author Contributions
Funding
Institutional Review Board Statement
Informed Consent Statement
Data Availability Statement
Conflicts of Interest
References
- Davies, D.R.; Chacko, S. Antibody Structure. Acc. Chem. Res. 1993, 26, 421–427. [Google Scholar] [CrossRef]
- Röthlisberger, D.; Honegger, A.; Plückthun, A. Domain Interactions in the Fab Fragment: A Comparative Evaluation of the Single-Chain Fv and Fab Format Engineered with Variable Domains of Different Stability. J. Mol. Biol. 2005, 347, 773–789. [Google Scholar] [CrossRef] [PubMed]
- Colman, P.M. Structure of Antibody-Antigen Complexes: Implications for Immune Recognition. In Advances in Immunology; Dixon, F.J., Ed.; Academic Press: Cambridge, MA, USA, 1988; Volume 43, pp. 99–132. [Google Scholar]
- Teplyakov, A.; Zhao, Y.; Malia, T.J.; Obmolova, G.; Gilliland, G.L. IgG2 Fc Structure and the Dynamic Features of the IgG CH2–CH3 Interface. Mol. Immunol. 2013, 56, 131–139. [Google Scholar] [CrossRef] [PubMed]
- Bruhns, P.; Iannascoli, B.; England, P.; Mancardi, D.A.; Fernandez, N.; Jorieux, S.; Daëron, M. Specificity and Affinity of Human Fcγ Receptors and Their Polymorphic Variants for Human IgG Subclasses. Blood 2009, 113, 3716–3725. [Google Scholar] [CrossRef]
- Schroeder, H.W.; Cavacini, L. Structure and Function of Immunoglobulins. J. Allergy Clin. Immunol. 2010, 125, S41–S52. [Google Scholar] [CrossRef]
- Alzari, P.M. Domains, Immunoglobulin-Type. In Encyclopedia of Immunology, 2nd ed.; Delves, P.J., Ed.; Elsevier: Oxford, UK, 1998; pp. 775–778. ISBN 978-0-12-226765-9. [Google Scholar]
- Bork, P.; Holm, L.; Sander, C. The Immunoglobulin Fold: Structural Classification, Sequence Patterns and Common Core. J. Mol. Biol. 1994, 242, 309–320. [Google Scholar] [CrossRef]
- Feige, M.J.; Hendershot, L.M.; Buchner, J. How Antibodies Fold. Trends Biochem. Sci. 2010, 35, 189–198. [Google Scholar] [CrossRef]
- Choi, H.-J.; Seok, S.-H.; Kim, Y.-J.; Seo, M.-D.; Kim, Y.-S. Crystal Structures of Immunoglobulin Fc Heterodimers Reveal the Molecular Basis for Heterodimer Formation. Mol. Immunol. 2015, 65, 377–383. [Google Scholar] [CrossRef]
- Charles, A.; Janeway, J.; Travers, P.; Walport, M.; Shlomchik, M.J. Structural Variation in Immunoglobulin Constant Regions. In Immunobiology: The Immune System in Health and Disease, 5th ed.; Garland Science: New York, NY, USA, 2001. [Google Scholar]
- Fillatreau, S.; Six, A.; Magadan, S.; Castro, R.; Sunyer, J.O.; Boudinot, P. The Astonishing Diversity of Ig Classes and B Cell Repertoires in Teleost Fish. Front. Immunol. 2013, 4, 28. [Google Scholar] [CrossRef]
- Justiz Vaillant, A.A.; Jamal, Z.; Patel, P.; Ramphul, K. Immunoglobulin. In StatPearls; StatPearls Publishing: Treasure Island, FL, USA, 2022. [Google Scholar]
- Kumar Bharathkar, S.; Parker, B.W.; Malyutin, A.G.; Haloi, N.; Huey-Tubman, K.E.; Tajkhorshid, E.; Stadtmueller, B.M. The Structures of Secretory and Dimeric Immunoglobulin A. eLife 2020, 9, e56098. [Google Scholar] [CrossRef]
- Kumar, N.; Arthur, C.P.; Ciferri, C.; Matsumoto, M.L. Structure of the Secretory Immunoglobulin A Core. Science 2020, 367, 1008–1014. [Google Scholar] [CrossRef]
- Li, Y.; Wang, G.; Li, N.; Wang, Y.; Zhu, Q.; Chu, H.; Wu, W.; Tan, Y.; Yu, F.; Su, X.-D.; et al. Structural Insights into Immunoglobulin M. Science 2020, 367, 1014–1017. [Google Scholar] [CrossRef]
- Lyu, M.; Malyutin, A.; Stadtmueller, B. The Structure of the Teleost Immunoglobulin M Core Provides Insights on Polymeric Antibody Evolution, Assembly, and Function. bioRxiv 2023. [Google Scholar] [CrossRef]
- Charles, A.; Janeway, J.; Travers, P.; Walport, M.; Shlomchik, M.J. The Distribution and Functions of Immunoglobulin Isotypes. In Immunobiology: The Immune System in Health and Disease, 5th ed.; Garland Science: New York, NY, USA, 2001. [Google Scholar]
- Pabst, O. New Concepts in the Generation and Functions of IgA. Nat. Rev. Immunol. 2012, 12, 821–832. [Google Scholar] [CrossRef]
- Mukai, K.; Tsai, M.; Starkl, P.; Marichal, T.; Galli, S.J. IgE and Mast Cells in Host Defense against Parasites and Venoms. Semin. Immunopathol. 2016, 38, 581–603. [Google Scholar] [CrossRef]
- Goding, J.W. Allotypes of IgM and IgD Receptors in the Mouse: A Probe for Lymphocyte Differentiation. Contemp. Top. Immunobiol. 1978, 8, 203–243. [Google Scholar] [CrossRef]
- Chen, K.; Cerutti, A. The Function and Regulation of Immunoglobulin D. Curr. Opin. Immunol. 2011, 23, 345–352. [Google Scholar] [CrossRef]
- Flajnik, M.F.; Kasahara, M. Origin and Evolution of the Adaptive Immune System: Genetic Events and Selective Pressures. Nat. Rev. Genet. 2010, 11, 47–59. [Google Scholar] [CrossRef]
- Amemiya, C.T.; Alföldi, J.; Lee, A.P.; Fan, S.; Philippe, H.; MacCallum, I.; Braasch, I.; Manousaki, T.; Schneider, I.; Rohner, N.; et al. The African Coelacanth Genome Provides Insights into Tetrapod Evolution. Nature 2013, 496, 311–316. [Google Scholar] [CrossRef]
- Irisarri, I.; Baurain, D.; Brinkmann, H.; Delsuc, F.; Sire, J.-Y.; Kupfer, A.; Petersen, J.; Jarek, M.; Meyer, A.; Vences, M.; et al. Phylotranscriptomic Consolidation of the Jawed Vertebrate Timetree. Nat. Ecol. Evol. 2017, 1, 1370–1378. [Google Scholar] [CrossRef]
- Berstein, R.M.; Schluter, S.F.; Shen, S.; Marchalonis, J.J. A New High Molecular Weight Immunoglobulin Class from the Carcharhine Shark: Implications for the Properties of the Primordial Immunoglobulin. Proc. Natl. Acad. Sci. USA 1996, 93, 3289–3293. [Google Scholar] [CrossRef] [PubMed]
- Matz, H.; Munir, D.; Logue, J.; Dooley, H. The Immunoglobulins of Cartilaginous Fishes. Dev. Comp. Immunol. 2021, 115, 103873. [Google Scholar] [CrossRef] [PubMed]
- Ohta, Y.; Flajnik, M. IgD, like IgM, Is a Primordial Immunoglobulin Class Perpetuated in Most Jawed Vertebrates. Proc. Natl. Acad. Sci. USA 2006, 103, 10723–10728. [Google Scholar] [CrossRef] [PubMed]
- Greenberg, A.S.; Avila, D.; Hughes, M.; Hughes, A.; McKinney, E.C.; Flajnik, M.F. A New Antigen Receptor Gene Family That Undergoes Rearrangement and Extensive Somatic Diversification in Sharks. Nature 1995, 374, 168–173. [Google Scholar] [CrossRef] [PubMed]
- Roux, K.H.; Greenberg, A.S.; Greene, L.; Strelets, L.; Avila, D.; McKinney, E.C.; Flajnik, M.F. Structural Analysis of the Nurse Shark (New) Antigen Receptor (NAR): Molecular Convergence of NAR and Unusual Mammalian Immunoglobulins. Proc. Natl. Acad. Sci. USA 1998, 95, 11804–11809. [Google Scholar] [CrossRef]
- Gambón Deza, F.; Sánchez Espinel, C.; Valdueza Beneitez, J. A Novel IgA-like Immunoglobulin in the Reptile Eublepharis Macularius. Dev. Comp. Immunol. 2007, 31, 596–605. [Google Scholar] [CrossRef]
- Belov, K.; Hellman, L.; Cooper, D.W. Characterisation of Echidna IgM Provides Insights into the Time of Divergence of Extant Mammals. Dev. Comp. Immunol. 2002, 26, 831–839. [Google Scholar] [CrossRef]
- Lundqvist, M.L.; Middleton, D.L.; Radford, C.; Warr, G.W.; Magor, K.E. Immunoglobulins of the Non-Galliform Birds: Antibody Expression and Repertoire in the Duck. Dev. Comp. Immunol. 2006, 30, 93–100. [Google Scholar] [CrossRef]
- Warr, G.W.; Magor, K.E.; Higgins, D.A. IgY: Clues to the Origins of Modern Antibodies. Immunol. Today 1995, 16, 392–398. [Google Scholar] [CrossRef]
- Mußmann, R.; Du Pasquier, L.; Hsu, E. Is Xenopus IgX an Analog of IgA? Eur. J. Immunol. 1996, 26, 2823–2830. [Google Scholar] [CrossRef]
- Das, S.; Hirano, M.; Tako, R.; McCallister, C.; Nikolaidis, N. Evolutionary Genomics of Immunoglobulin-Encoding Loci in Vertebrates. Curr. Genom. 2012, 13, 95–102. [Google Scholar] [CrossRef]
- Mirete-Bachiller, S.; Olivieri, D.N.; Gambón-Deza, F. Immunoglobulin T Genes in Actinopterygii. Fish Shellfish. Immunol. 2021, 108, 86–93. [Google Scholar] [CrossRef]
- Tongsri, P.; Meng, K.; Liu, X.; Wu, Z.; Yin, G.; Wang, Q.; Liu, M.; Xu, Z. The Predominant Role of Mucosal Immunoglobulin IgT in the Gills of Rainbow Trout (Oncorhynchus Mykiss) after Infection with Flavobacterium Columnare. Fish Shellfish. Immunol. 2020, 99, 654–662. [Google Scholar] [CrossRef]
- Oreste, U.; Ametrano, A.; Coscia, M.R. On Origin and Evolution of the Antibody Molecule. Biology 2021, 10, 140. [Google Scholar] [CrossRef]
- Marks, D.S.; Colwell, L.J.; Sheridan, R.; Hopf, T.A.; Pagnani, A.; Zecchina, R.; Sander, C. Protein 3D Structure Computed from Evolutionary Sequence Variation. PLoS ONE 2011, 6, e28766. [Google Scholar] [CrossRef]
- Balakrishnan, S.; Kamisetty, H.; Carbonell, J.G.; Lee, S.-I.; Langmead, C.J. Learning Generative Models for Protein Fold Families. Proteins: Struct. Funct. Bioinform. 2011, 79, 1061–1078. [Google Scholar] [CrossRef]
- Morcos, F.; Pagnani, A.; Lunt, B.; Bertolino, A.; Marks, D.S.; Sander, C.; Zecchina, R.; Onuchic, J.N.; Hwa, T.; Weigt, M. Direct-Coupling Analysis of Residue Coevolution Captures Native Contacts across Many Protein Families. Proc. Natl. Acad. Sci. USA 2011, 108, E1293–E1301. [Google Scholar] [CrossRef]
- Hopf, T.A.; Colwell, L.J.; Sheridan, R.; Rost, B.; Sander, C.; Marks, D.S. Three-Dimensional Structures of Membrane Proteins from Genomic Sequencing. Cell 2012, 149, 1607–1621. [Google Scholar] [CrossRef]
- Ovchinnikov, S.; Kamisetty, H.; Baker, D. Robust and Accurate Prediction of Residue–Residue Interactions across Protein Interfaces Using Evolutionary Information. eLife 2014, 3, e02030. [Google Scholar] [CrossRef]
- Ovchinnikov, S.; Kinch, L.; Park, H.; Liao, Y.; Pei, J.; Kim, D.E.; Kamisetty, H.; Grishin, N.V.; Baker, D. Large-Scale Determination of Previously Unsolved Protein Structures Using Evolutionary Information. eLife 2015, 4, e09248. [Google Scholar] [CrossRef]
- Hopf, T.A.; Ingraham, J.B.; Poelwijk, F.J.; Schärfe, C.P.I.; Springer, M.; Sander, C.; Marks, D.S. Mutation Effects Predicted from Sequence Co-Variation. Nat. Biotechnol. 2017, 35, 128–135. [Google Scholar] [CrossRef] [PubMed]
- Johnson, M.; Zaretskaya, I.; Raytselis, Y.; Merezhuk, Y.; McGinnis, S.; Madden, T.L. NCBI BLAST: A Better Web Interface. Nucleic Acids Res. 2008, 36, W5–W9. [Google Scholar] [CrossRef] [PubMed]
- Sievers, F.; Wilm, A.; Dineen, D.; Gibson, T.J.; Karplus, K.; Li, W.; Lopez, R.; McWilliam, H.; Remmert, M.; Söding, J.; et al. Fast, Scalable Generation of High-Quality Protein Multiple Sequence Alignments Using Clustal Omega. Mol. Syst. Biol. 2011, 7, 539. [Google Scholar] [CrossRef] [PubMed]
- Okonechnikov, K.; Golosova, O.; Fursov, M.; the UGENE Team. Unipro UGENE: A Unified Bioinformatics Toolkit. Bioinformatics 2012, 28, 1166–1167. [Google Scholar] [CrossRef] [PubMed]
- Sievers, F.; Higgins, D.G. Clustal Omega for Making Accurate Alignments of Many Protein Sequences. Protein Sci. 2018, 27, 135–145. [Google Scholar] [CrossRef]
- Capella-Gutiérrez, S.; Silla-Martínez, J.M.; Gabaldón, T. TrimAl: A Tool for Automated Alignment Trimming in Large-Scale Phylogenetic Analyses. Bioinformatics 2009, 25, 1972–1973. [Google Scholar] [CrossRef]
- The UniProt Consortium. UniProt: The Universal Protein Knowledgebase in 2023. Nucleic Acids Res. 2023, 51, D523–D531. [Google Scholar] [CrossRef]
- Lefranc, M.-P.; Pommié, C.; Kaas, Q.; Duprat, E.; Bosc, N.; Guiraudou, D.; Jean, C.; Ruiz, M.; Da Piédade, I.; Rouard, M.; et al. IMGT Unique Numbering for Immunoglobulin and T Cell Receptor Constant Domains and Ig Superfamily C-like Domains. Dev. Comp. Immunol. 2005, 29, 185–203. [Google Scholar] [CrossRef]
- Lefranc, M.-P. Immunoglobulin and T Cell Receptor Genes: IMGT® and the Birth and Rise of Immunoinformatics. Front. Immunol. 2014, 5, 22. [Google Scholar] [CrossRef]
- Lefranc, M.-P.; Giudicelli, V.; Ginestoux, C.; Jabado-Michaloud, J.; Folch, G.; Bellahcene, F.; Wu, Y.; Gemrot, E.; Brochet, X.; Lane, J.; et al. IMGT®, the International ImMunoGeneTics Information System®. Nucleic Acids Res. 2009, 37, D1006–D1012. [Google Scholar] [CrossRef]
- Lefranc, M.-P. IMGT®, the International ImMunoGeneTics Information System® for Immunoinformatics. Mol. Biotechnol. 2008, 40, 101–111. [Google Scholar] [CrossRef]
- Capra, J.A.; Singh, M. Predicting Functionally Important Residues from Sequence Conservation. Bioinformatics 2007, 23, 1875–1882. [Google Scholar] [CrossRef]
- Minh, B.Q.; Schmidt, H.A.; Chernomor, O.; Schrempf, D.; Woodhams, M.D.; von Haeseler, A.; Lanfear, R. IQ-TREE 2: New Models and Efficient Methods for Phylogenetic Inference in the Genomic Era. Mol. Biol. Evol. 2020, 37, 1530–1534. [Google Scholar] [CrossRef]
- Truszkowski, J.; Goldman, N. Maximum Likelihood Phylogenetic Inference Is Consistent on Multiple Sequence Alignments, with or without Gaps. Syst. Biol. 2016, 65, 328–333. [Google Scholar] [CrossRef]
- Kumar, S.; Stecher, G.; Li, M.; Knyaz, C.; Tamura, K. MEGA X: Molecular Evolutionary Genetics Analysis across Computing Platforms. Mol. Biol. Evol. 2018, 35, 1547–1549. [Google Scholar] [CrossRef]
- Whelan, S.; Goldman, N. A General Empirical Model of Protein Evolution Derived from Multiple Protein Families Using a Maximum-Likelihood Approach. Mol. Biol. Evol. 2001, 18, 691–699. [Google Scholar] [CrossRef]
- Schwarz, G. Estimating the Dimension of a Model. Ann. Stat. 1978, 6, 461–464. [Google Scholar] [CrossRef]
- Soubrier, J.; Steel, M.; Lee, M.S.Y.; Der Sarkissian, C.; Guindon, S.; Ho, S.Y.W.; Cooper, A. The Influence of Rate Heterogeneity among Sites on the Time Dependence of Molecular Rates. Mol. Biol. Evol. 2012, 29, 3345–3358. [Google Scholar] [CrossRef]
- Minh, B.Q.; Nguyen, M.A.T.; von Haeseler, A. Ultrafast Approximation for Phylogenetic Bootstrap. Mol. Biol. Evol. 2013, 30, 1188–1195. [Google Scholar] [CrossRef]
- Hoang, D.T.; Chernomor, O.; von Haeseler, A.; Minh, B.Q.; Vinh, L.S. UFBoot2: Improving the Ultrafast Bootstrap Approximation. Mol. Biol. Evol. 2018, 35, 518–522. [Google Scholar] [CrossRef]
- Matsumiya, S.; Yamaguchi, Y.; Saito, J.; Nagano, M.; Sasakawa, H.; Otaki, S.; Satoh, M.; Shitara, K.; Kato, K. Corrigendum to “Structural Comparison of Fucosylated and Nonfucosylated Fc Fragments of Human Immunoglobulin G1” [J. Mol. Biol. 386/3 (2007) 767–779]. J. Mol. Biol. 2011, 408, 1001. [Google Scholar] [CrossRef]
- Suzek, B.E.; Wang, Y.; Huang, H.; McGarvey, P.B.; Wu, C.H. UniRef Clusters: A Comprehensive and Scalable Alternative for Improving Sequence Similarity Searches. Bioinformatics 2015, 31, 926–932. [Google Scholar] [CrossRef] [PubMed]
- Ekeberg, M.; Lövkvist, C.; Lan, Y.; Weigt, M.; Aurell, E. Improved Contact Prediction in Proteins: Using Pseudolikelihoods to Infer Potts Models. Phys. Rev. E 2013, 87, 012707. [Google Scholar] [CrossRef] [PubMed]
- Hopf, T.A.; Green, A.G.; Schubert, B.; Mersmann, S.; Schärfe, C.P.I.; Ingraham, J.B.; Toth-Petroczy, A.; Brock, K.; Riesselman, A.J.; Palmedo, P.; et al. The EVcouplings Python Framework for Coevolutionary Sequence Analysis. Bioinformatics 2019, 35, 1582–1584. [Google Scholar] [CrossRef]
- GetContacts. Available online: https://getcontacts.github.io/ (accessed on 3 November 2020).
- Tareen, A.; Kinney, J.B. Logomaker: Beautiful Sequence Logos in Python. Bioinformatics 2020, 36, 2272–2274. [Google Scholar] [CrossRef]
- Python 3 Reference Manual:|Guide Books. Available online: https://dl.acm.org/doi/book/10.5555/1593511 (accessed on 20 March 2023).
- Pedregosa, F.; Varoquaux, G.; Gramfort, A.; Michel, V.; Thirion, B.; Grisel, O.; Blondel, M.; Prettenhofer, P.; Weiss, R.; Dubourg, V.; et al. Scikit-Learn: Machine Learning in Python. J. Mach. Learn. Res. 2011, 12, 2825–2830. [Google Scholar]
- Wimley, W.C.; White, S.H. Experimentally Determined Hydrophobicity Scale for Proteins at Membrane Interfaces. Nat. Struct. Mol. Biol. 1996, 3, 842–848. [Google Scholar] [CrossRef]
- Fauchère, J.L.; Charton, M.; Kier, L.B.; Verloop, A.; Pliska, V. Amino Acid Side Chain Parameters for Correlation Studies in Biology and Pharmacology. Int. J. Pept. Protein Res. 1988, 32, 269–278. [Google Scholar] [CrossRef]
- Cooper, L.J.; Shikhman, A.R.; Glass, D.D.; Kangisser, D.; Cunningham, M.W.; Greenspan, N.S. Role of Heavy Chain Constant Domains in Antibody-Antigen Interaction. Apparent Specificity Differences among Streptococcal IgG Antibodies Expressing Identical Variable Domains. J. Immunol. 1993, 150, 2231–2242. [Google Scholar] [CrossRef]
- Brinkmann, U.; Kontermann, R.E. The Making of Bispecific Antibodies. MAbs 2017, 9, 182–212. [Google Scholar] [CrossRef]
- Zhang, X.; Calvert, R.A.; Sutton, B.J.; Doré, K.A. IgY: A Key Isotype in Antibody Evolution. Biol. Rev. 2017, 92, 2144–2156. [Google Scholar] [CrossRef]
- Keyt, B.A.; Baliga, R.; Sinclair, A.M.; Carroll, S.F.; Peterson, M.S. Structure, Function, and Therapeutic Use of IgM Antibodies. Antibodies 2020, 9, 53. [Google Scholar] [CrossRef]
- Scapin, G.; Yang, X.; Prosise, W.W.; McCoy, M.; Reichert, P.; Johnston, J.M.; Kashi, R.S.; Strickland, C. Structure of Full-Length Human Anti-PD1 Therapeutic IgG4 Antibody Pembrolizumab. Nat. Struct. Mol. Biol. 2015, 22, 953–958. [Google Scholar] [CrossRef]
- Criscitiello, M.F.; Flajnik, M.F. Four Primordial Immunoglobulin Light Chain Isotypes, Including λ and κ, Identified in the Most Primitive Living Jawed Vertebrates. Eur. J. Immunol. 2007, 37, 2683–2694. [Google Scholar] [CrossRef]
- Stavnezer, J.; Amemiya, C.T. Evolution of Isotype Switching. Semin. Immunol. 2004, 16, 257–275. [Google Scholar] [CrossRef]
- Thomas, J.; Ramakrishnan, N.; Bailey-Kellogg, C. Graphical Models of Residue Coupling in Protein Families. IEEE/ACM Trans. Comput. Biol. Bioinform. 2008, 5, 183–197. [Google Scholar] [CrossRef]
- Wilkins, A.; Erdin, S.; Lua, R.; Lichtarge, O. Evolutionary Trace for Prediction and Redesign of Protein Functional Sites. Methods Mol. Biol. 2012, 819, 29–42. [Google Scholar] [CrossRef]
- Göbel, U.; Sander, C.; Schneider, R.; Valencia, A. Correlated Mutations and Residue Contacts in Proteins. Proteins 1994, 18, 309–317. [Google Scholar] [CrossRef]
- Hopf, T.A.; Schärfe, C.P.I.; Rodrigues, J.P.G.L.M.; Green, A.G.; Kohlbacher, O.; Sander, C.; Bonvin, A.M.J.J.; Marks, D.S. Sequence Co-Evolution Gives 3D Contacts and Structures of Protein Complexes. eLife 2014, 3, e03430. [Google Scholar] [CrossRef]
- Marks, D.S.; Hopf, T.A.; Sander, C. Protein Structure Prediction from Sequence Variation. Nat. Biotechnol. 2012, 30, 1072–1080. [Google Scholar] [CrossRef]
- Jumper, J.; Evans, R.; Pritzel, A.; Green, T.; Figurnov, M.; Ronneberger, O.; Tunyasuvunakool, K.; Bates, R.; Žídek, A.; Potapenko, A.; et al. Highly Accurate Protein Structure Prediction with AlphaFold. Nature 2021, 596, 583–589. [Google Scholar] [CrossRef] [PubMed]
- Merchant, A.M.; Zhu, Z.; Yuan, J.Q.; Goddard, A.; Adams, C.W.; Presta, L.G.; Carter, P. An Efficient Route to Human Bispecific IgG. Nat. Biotechnol. 1998, 16, 677–681. [Google Scholar] [CrossRef] [PubMed]
- Ma, J.; Mo, Y.; Tang, M.; Shen, J.; Qi, Y.; Zhao, W.; Huang, Y.; Xu, Y.; Qian, C. Bispecific Antibodies: From Research to Clinical Application. Front. Immunol. 2021, 12, 1555. [Google Scholar] [CrossRef] [PubMed]
- Bertz, M.; Buchner, J.; Rief, M. Mechanical Stability of the Antibody Domain CH3 Homodimer in Different Oxidation States. J. Am. Chem. Soc. 2013, 135, 15085–15091. [Google Scholar] [CrossRef]
- Rispens, T.; Davies, A.M.; Ooijevaar-de Heer, P.; Absalah, S.; Bende, O.; Sutton, B.J.; Vidarsson, G.; Aalberse, R.C. Dynamics of Inter-Heavy Chain Interactions in Human Immunoglobulin G (IgG) Subclasses Studied by Kinetic Fab Arm Exchange. J. Biol. Chem. 2014, 289, 6098–6109. [Google Scholar] [CrossRef]
- Anishchenko, I.; Ovchinnikov, S.; Kamisetty, H.; Baker, D. Origins of Coevolution between Residues Distant in Protein 3D Structures. Proc. Natl. Acad. Sci. USA 2017, 114, 9122–9127. [Google Scholar] [CrossRef]
- Lesk, A.M.; Chothia, C. Evolution of Proteins Formed by β-Sheets: II. The Core of the Immunoglobulin Domains. J. Mol. Biol. 1982, 160, 325–342. [Google Scholar] [CrossRef]
- Thies, M.J.W.; Talamo, F.; Mayer, M.; Bell, S.; Ruoppolo, M.; Marino, G.; Buchner, J. Folding and Oxidation of the Antibody Domain CH3. J. Mol. Biol. 2002, 319, 1267–1277. [Google Scholar] [CrossRef]
- Feige, M.J.; Groscurth, S.; Marcinowski, M.; Shimizu, Y.; Kessler, H.; Hendershot, L.M.; Buchner, J. An Unfolded CH1 Domain Controls the Assembly and Secretion of IgG Antibodies. Mol. Cell 2009, 34, 569–579. [Google Scholar] [CrossRef]
- Feige, M.J.; Gräwert, M.A.; Marcinowski, M.; Hennig, J.; Behnke, J.; Ausländer, D.; Herold, E.M.; Peschek, J.; Castro, C.D.; Flajnik, M.; et al. The Structural Analysis of Shark IgNAR Antibodies Reveals Evolutionary Principles of Immunoglobulins. Proc. Natl. Acad. Sci. USA 2014, 111, 8155–8160. [Google Scholar] [CrossRef]
- Fernández-Quintero, M.L.; Quoika, P.K.; Wedl, F.S.; Seidler, C.A.; Kroell, K.B.; Loeffler, J.R.; Pomarici, N.D.; Hoerschinger, V.J.; Bujotzek, A.; Georges, G.; et al. Comparing Antibody Interfaces to Inform Rational Design of New Antibody Formats. Front. Mol. Biosci. 2022, 9, 812750. [Google Scholar] [CrossRef]
- Pomarici, N.D.; Waibl, F.; Quoika, P.K.; Bujotzek, A.; Georges, G.; Fernández-Quintero, M.L.; Liedl, K.R. Structural Mechanism of Fab Domain Dissociation as a Measure of Interface Stability. J. Comput. Aided Mol. Des. 2023, 37, 201–215. [Google Scholar] [CrossRef]


Disclaimer/Publisher’s Note: The statements, opinions and data contained in all publications are solely those of the individual author(s) and contributor(s) and not of MDPI and/or the editor(s). MDPI and/or the editor(s) disclaim responsibility for any injury to people or property resulting from any ideas, methods, instructions or products referred to in the content. |
© 2023 by the authors. Licensee MDPI, Basel, Switzerland. This article is an open access article distributed under the terms and conditions of the Creative Commons Attribution (CC BY) license (https://creativecommons.org/licenses/by/4.0/).
Share and Cite
Pomarici, N.D.; Cacciato, R.; Kokot, J.; Fernández-Quintero, M.L.; Liedl, K.R. Evolution of the Immunoglobulin Isotypes—Variations of Biophysical Properties among Animal Classes. Biomolecules 2023, 13, 801. https://doi.org/10.3390/biom13050801
Pomarici ND, Cacciato R, Kokot J, Fernández-Quintero ML, Liedl KR. Evolution of the Immunoglobulin Isotypes—Variations of Biophysical Properties among Animal Classes. Biomolecules. 2023; 13(5):801. https://doi.org/10.3390/biom13050801
Chicago/Turabian StylePomarici, Nancy D., Roberta Cacciato, Janik Kokot, Monica L. Fernández-Quintero, and Klaus R. Liedl. 2023. "Evolution of the Immunoglobulin Isotypes—Variations of Biophysical Properties among Animal Classes" Biomolecules 13, no. 5: 801. https://doi.org/10.3390/biom13050801