
Liposomal DQ in Combination with Copper Inhibits ARID1A Mutant Ovarian Cancer Growth
 , , , and
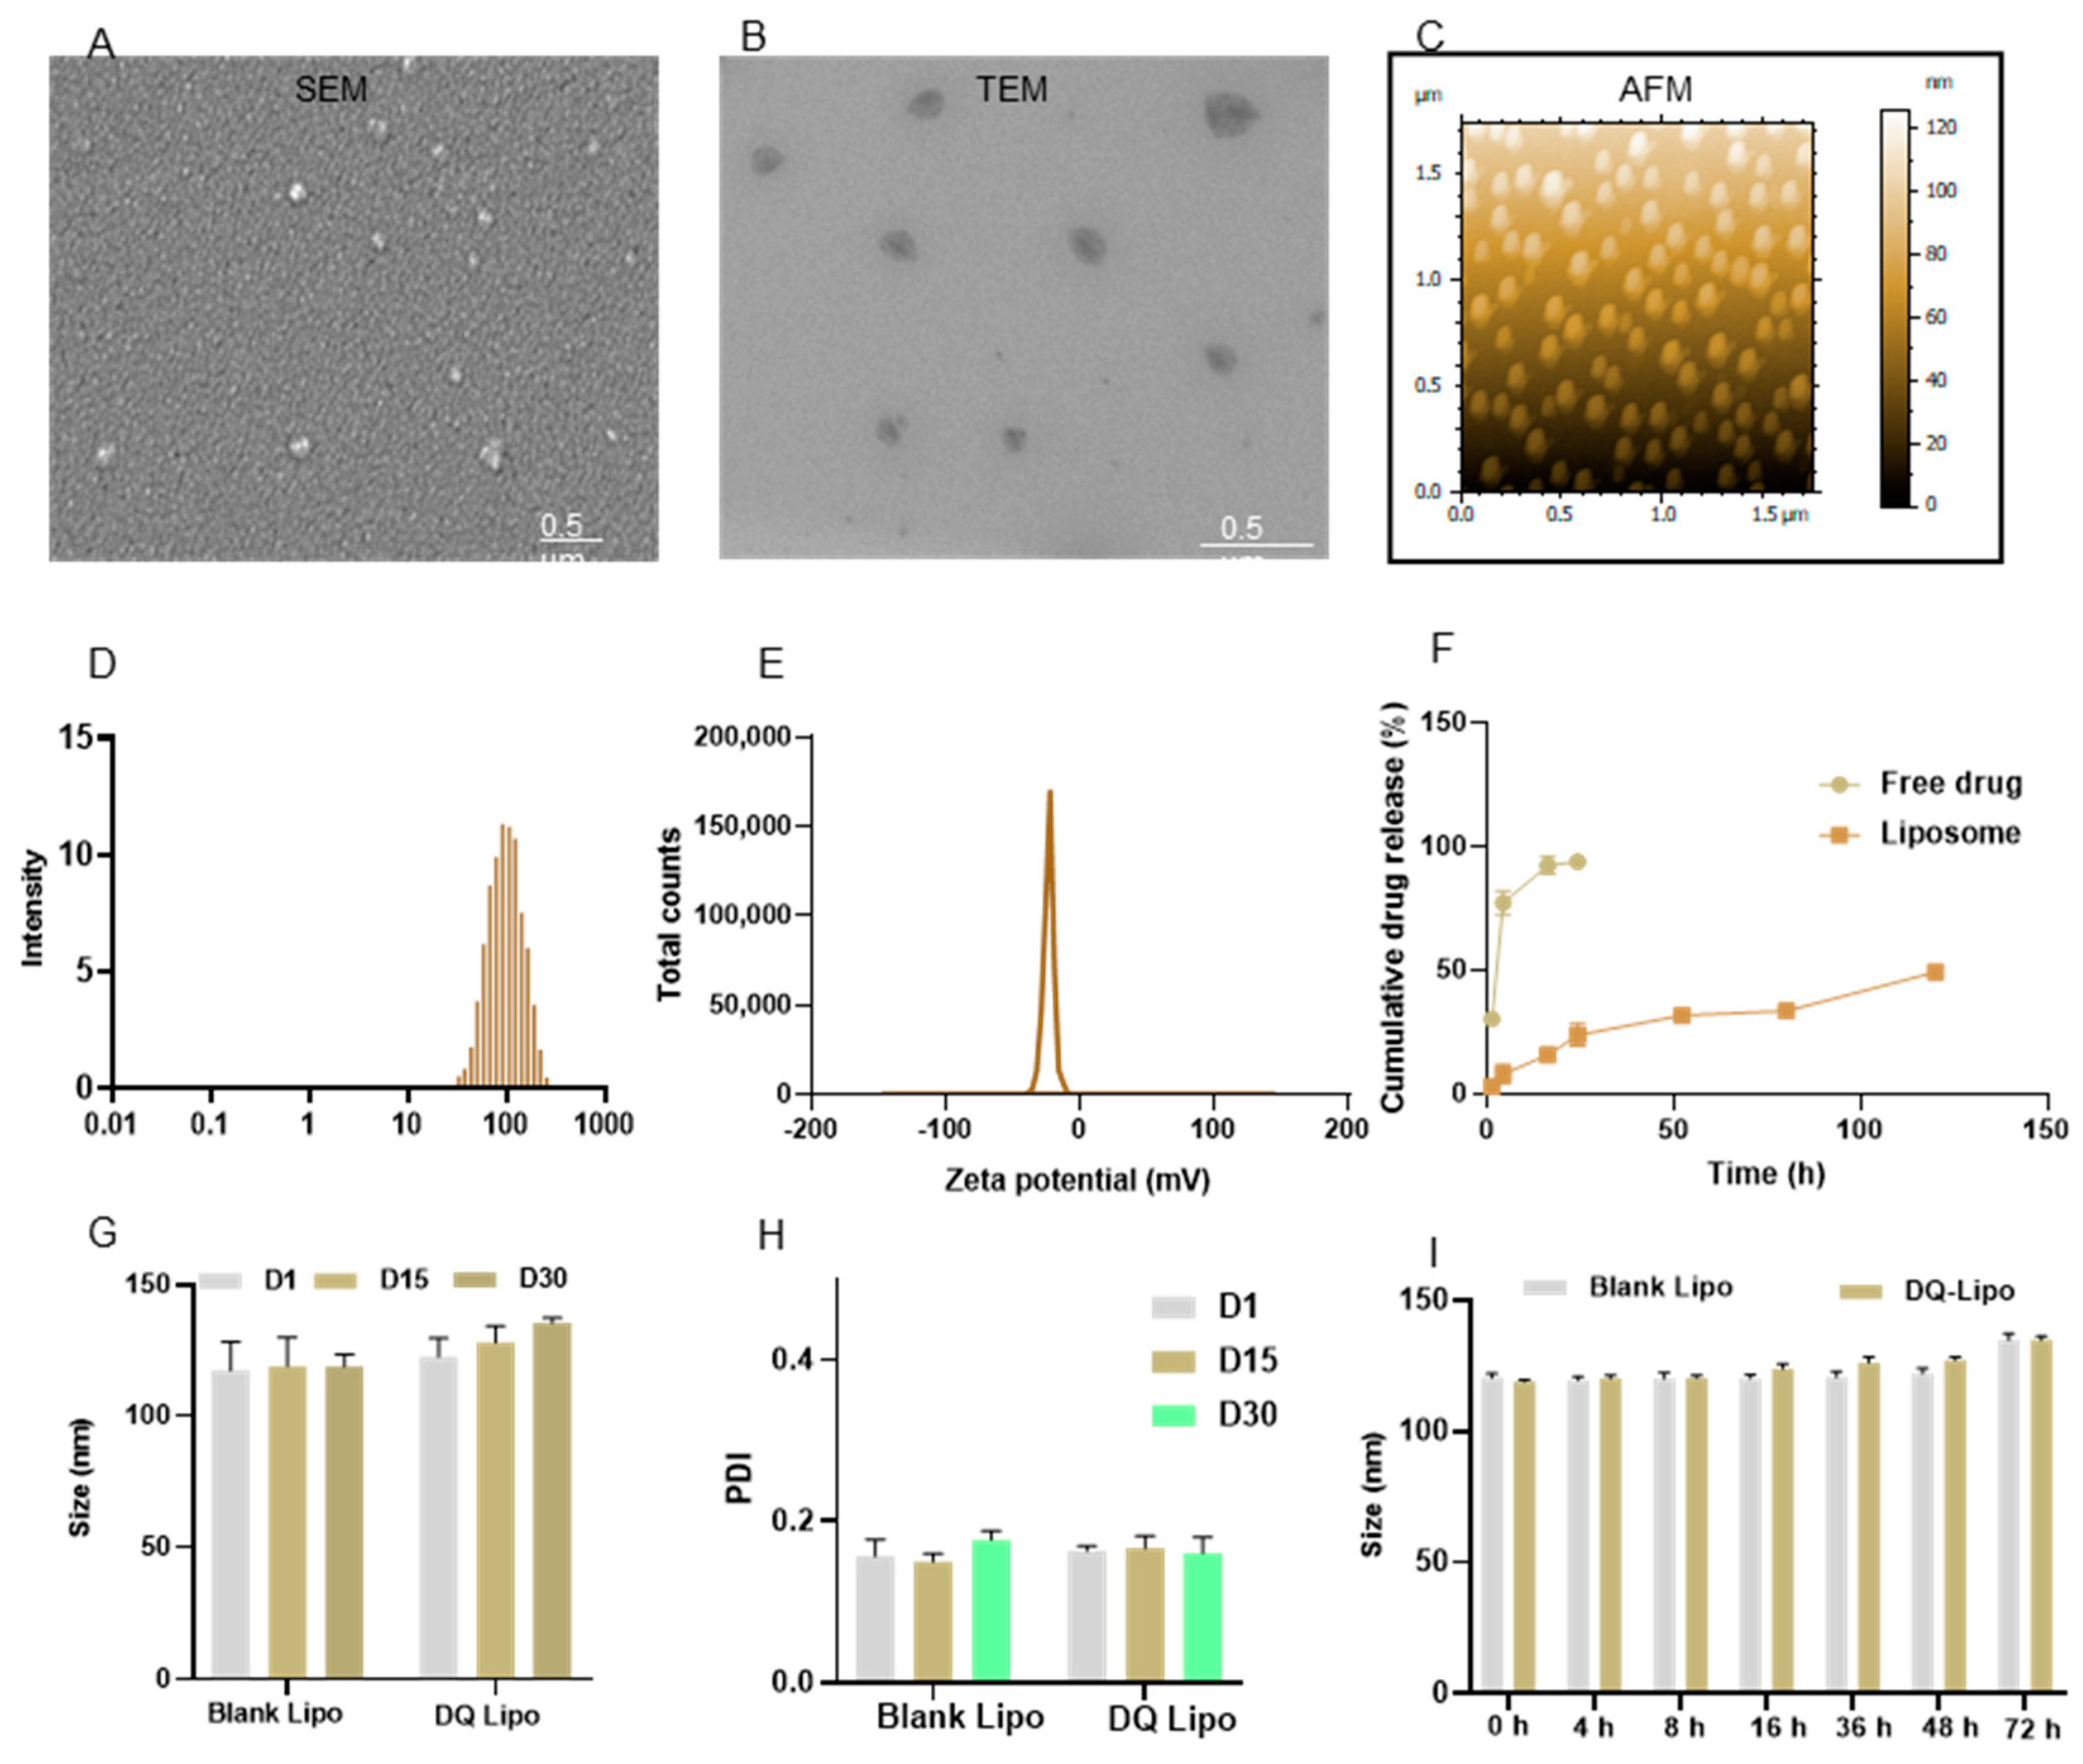
Abstract
:1. Introduction
2. Materials and Methods
2.1. Materials
2.2. Cell Lines
2.3. Preparation of Liposomes
2.4. Characterization of Liposomes
2.5. In Vitro Cell Assays
2.6. EMT Gene Expression and Western Blotting Assay
2.7. Cytokines Detection in the Co-Culture System and Biomarkers of ICD
2.8. Statistical Analysis
3. Results and Discussion
3.1. Characterization, Stabilities, Drug Entrapment Efficiency, and Drug Release of Liposomes
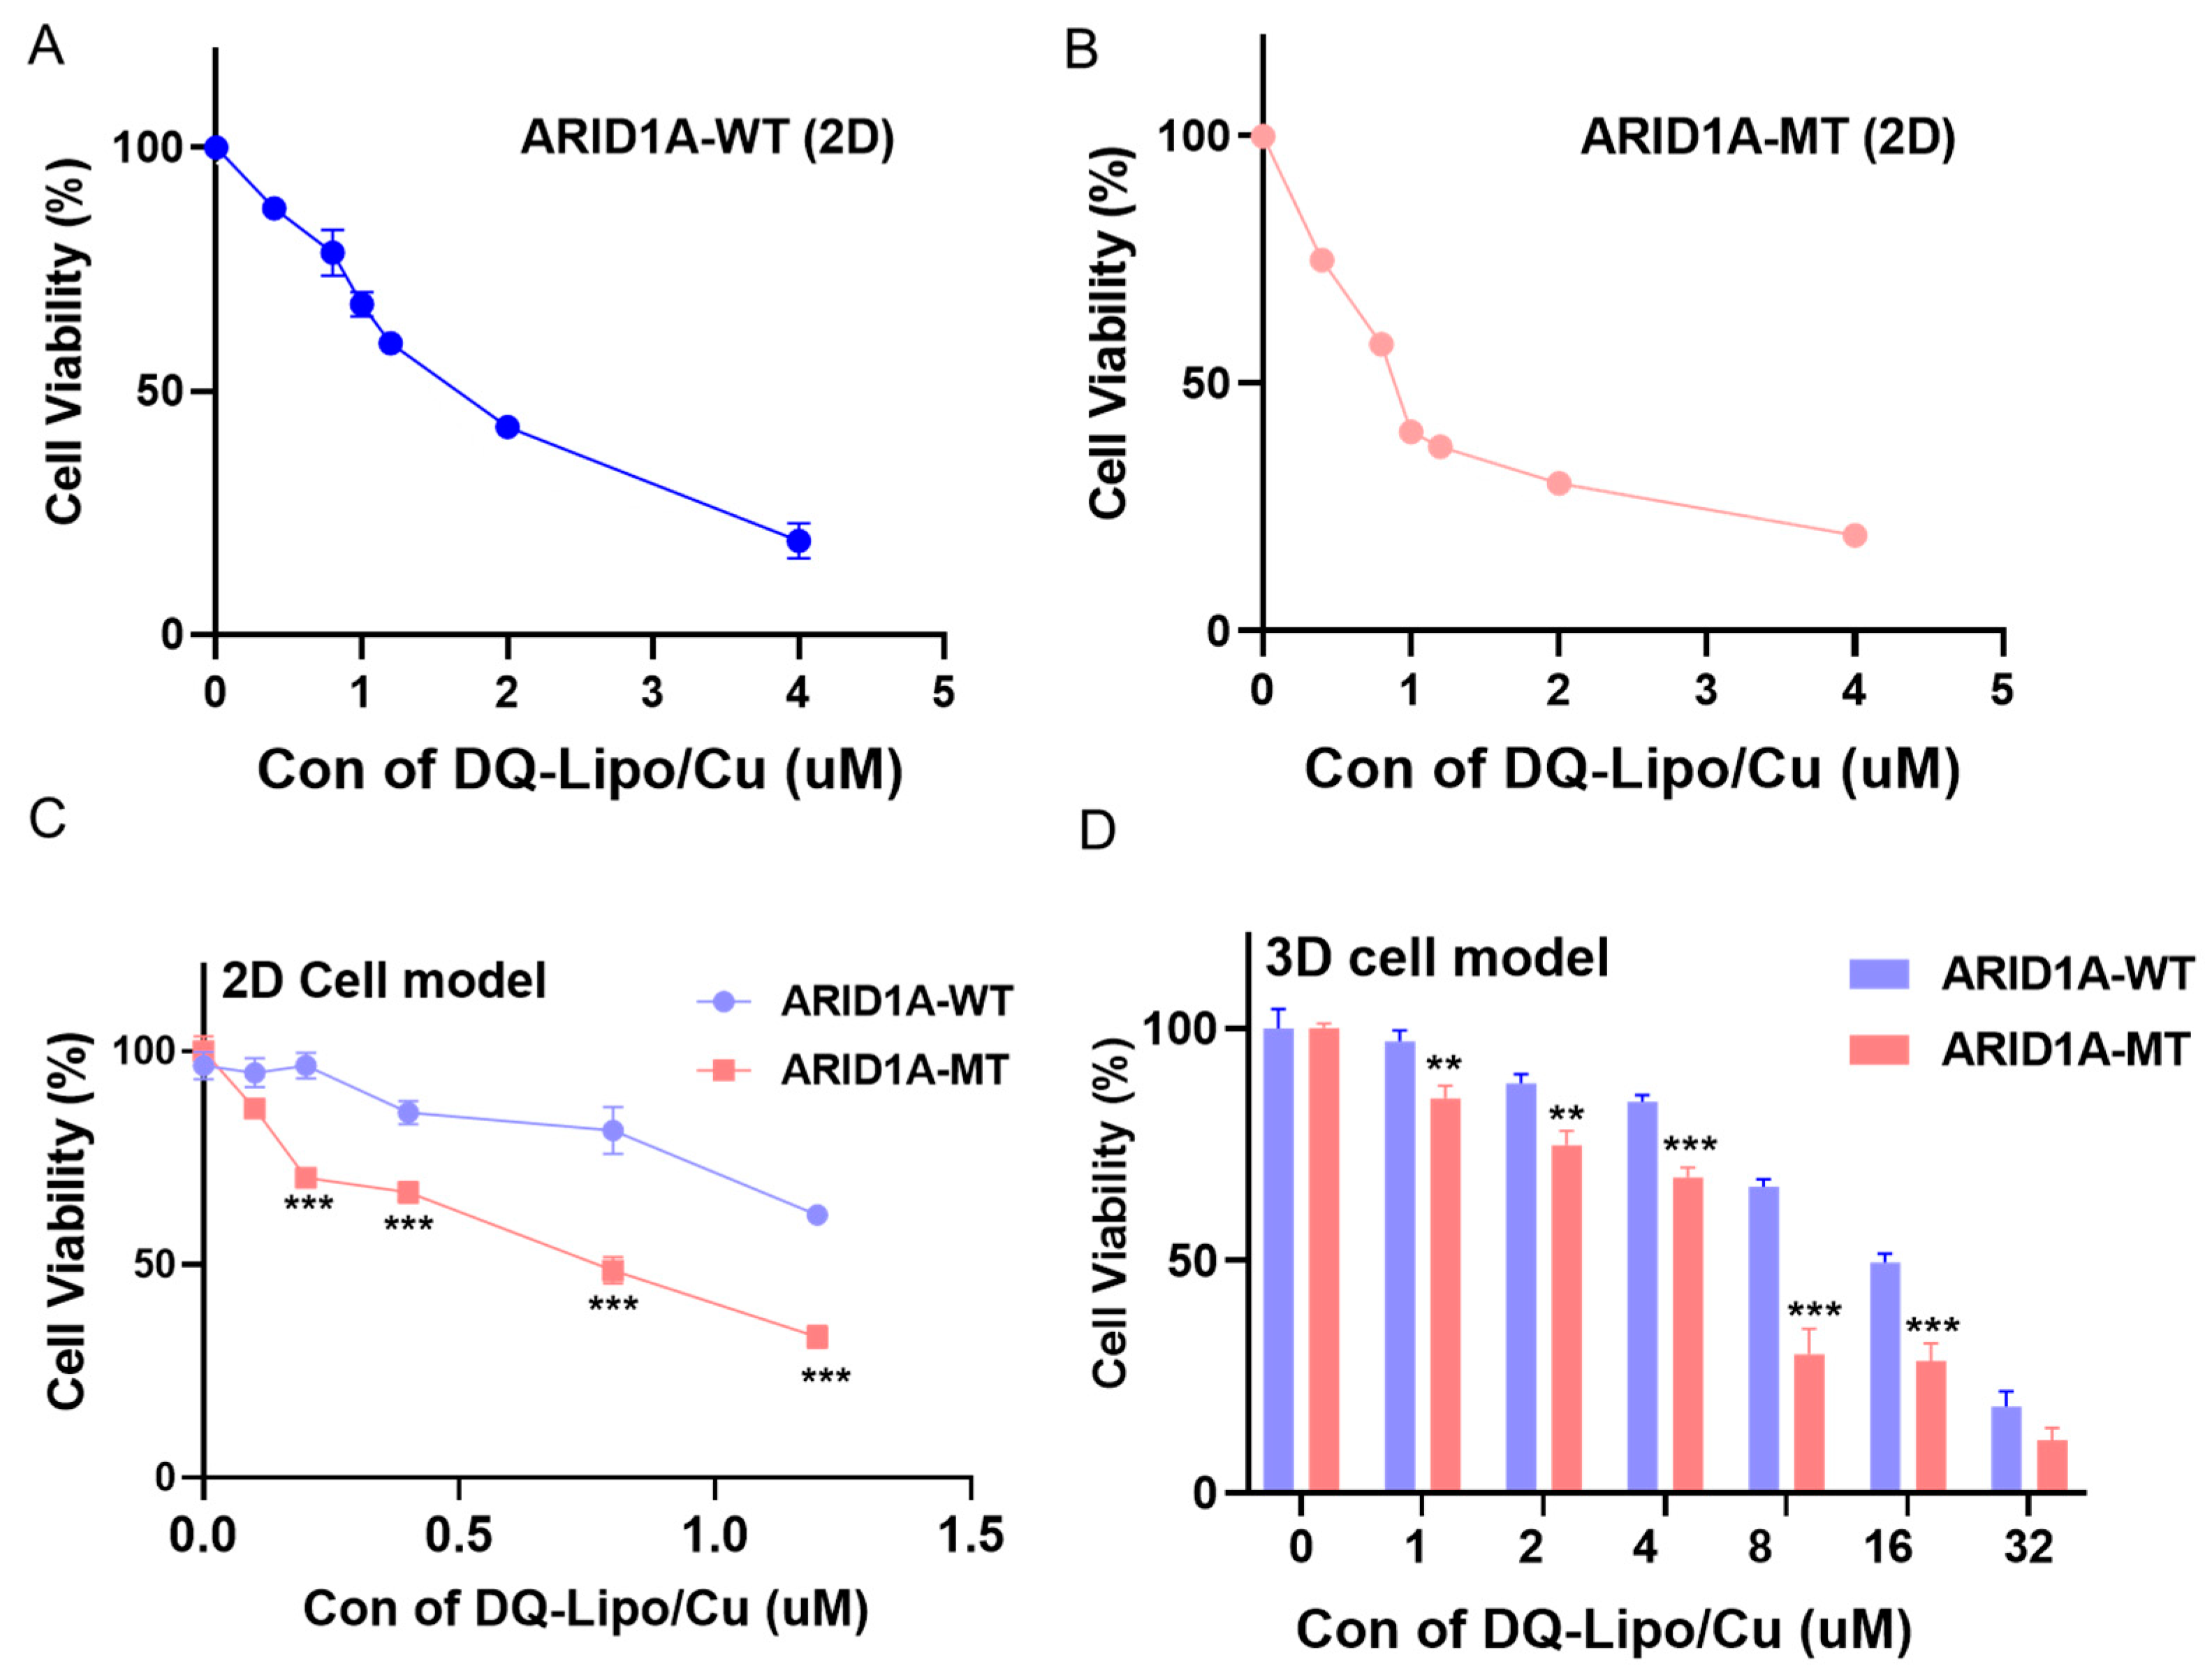
3.2. ARID1A-Mutant Cancer Cell Line Is More Sensitive to the DQ-Lipo/Cu
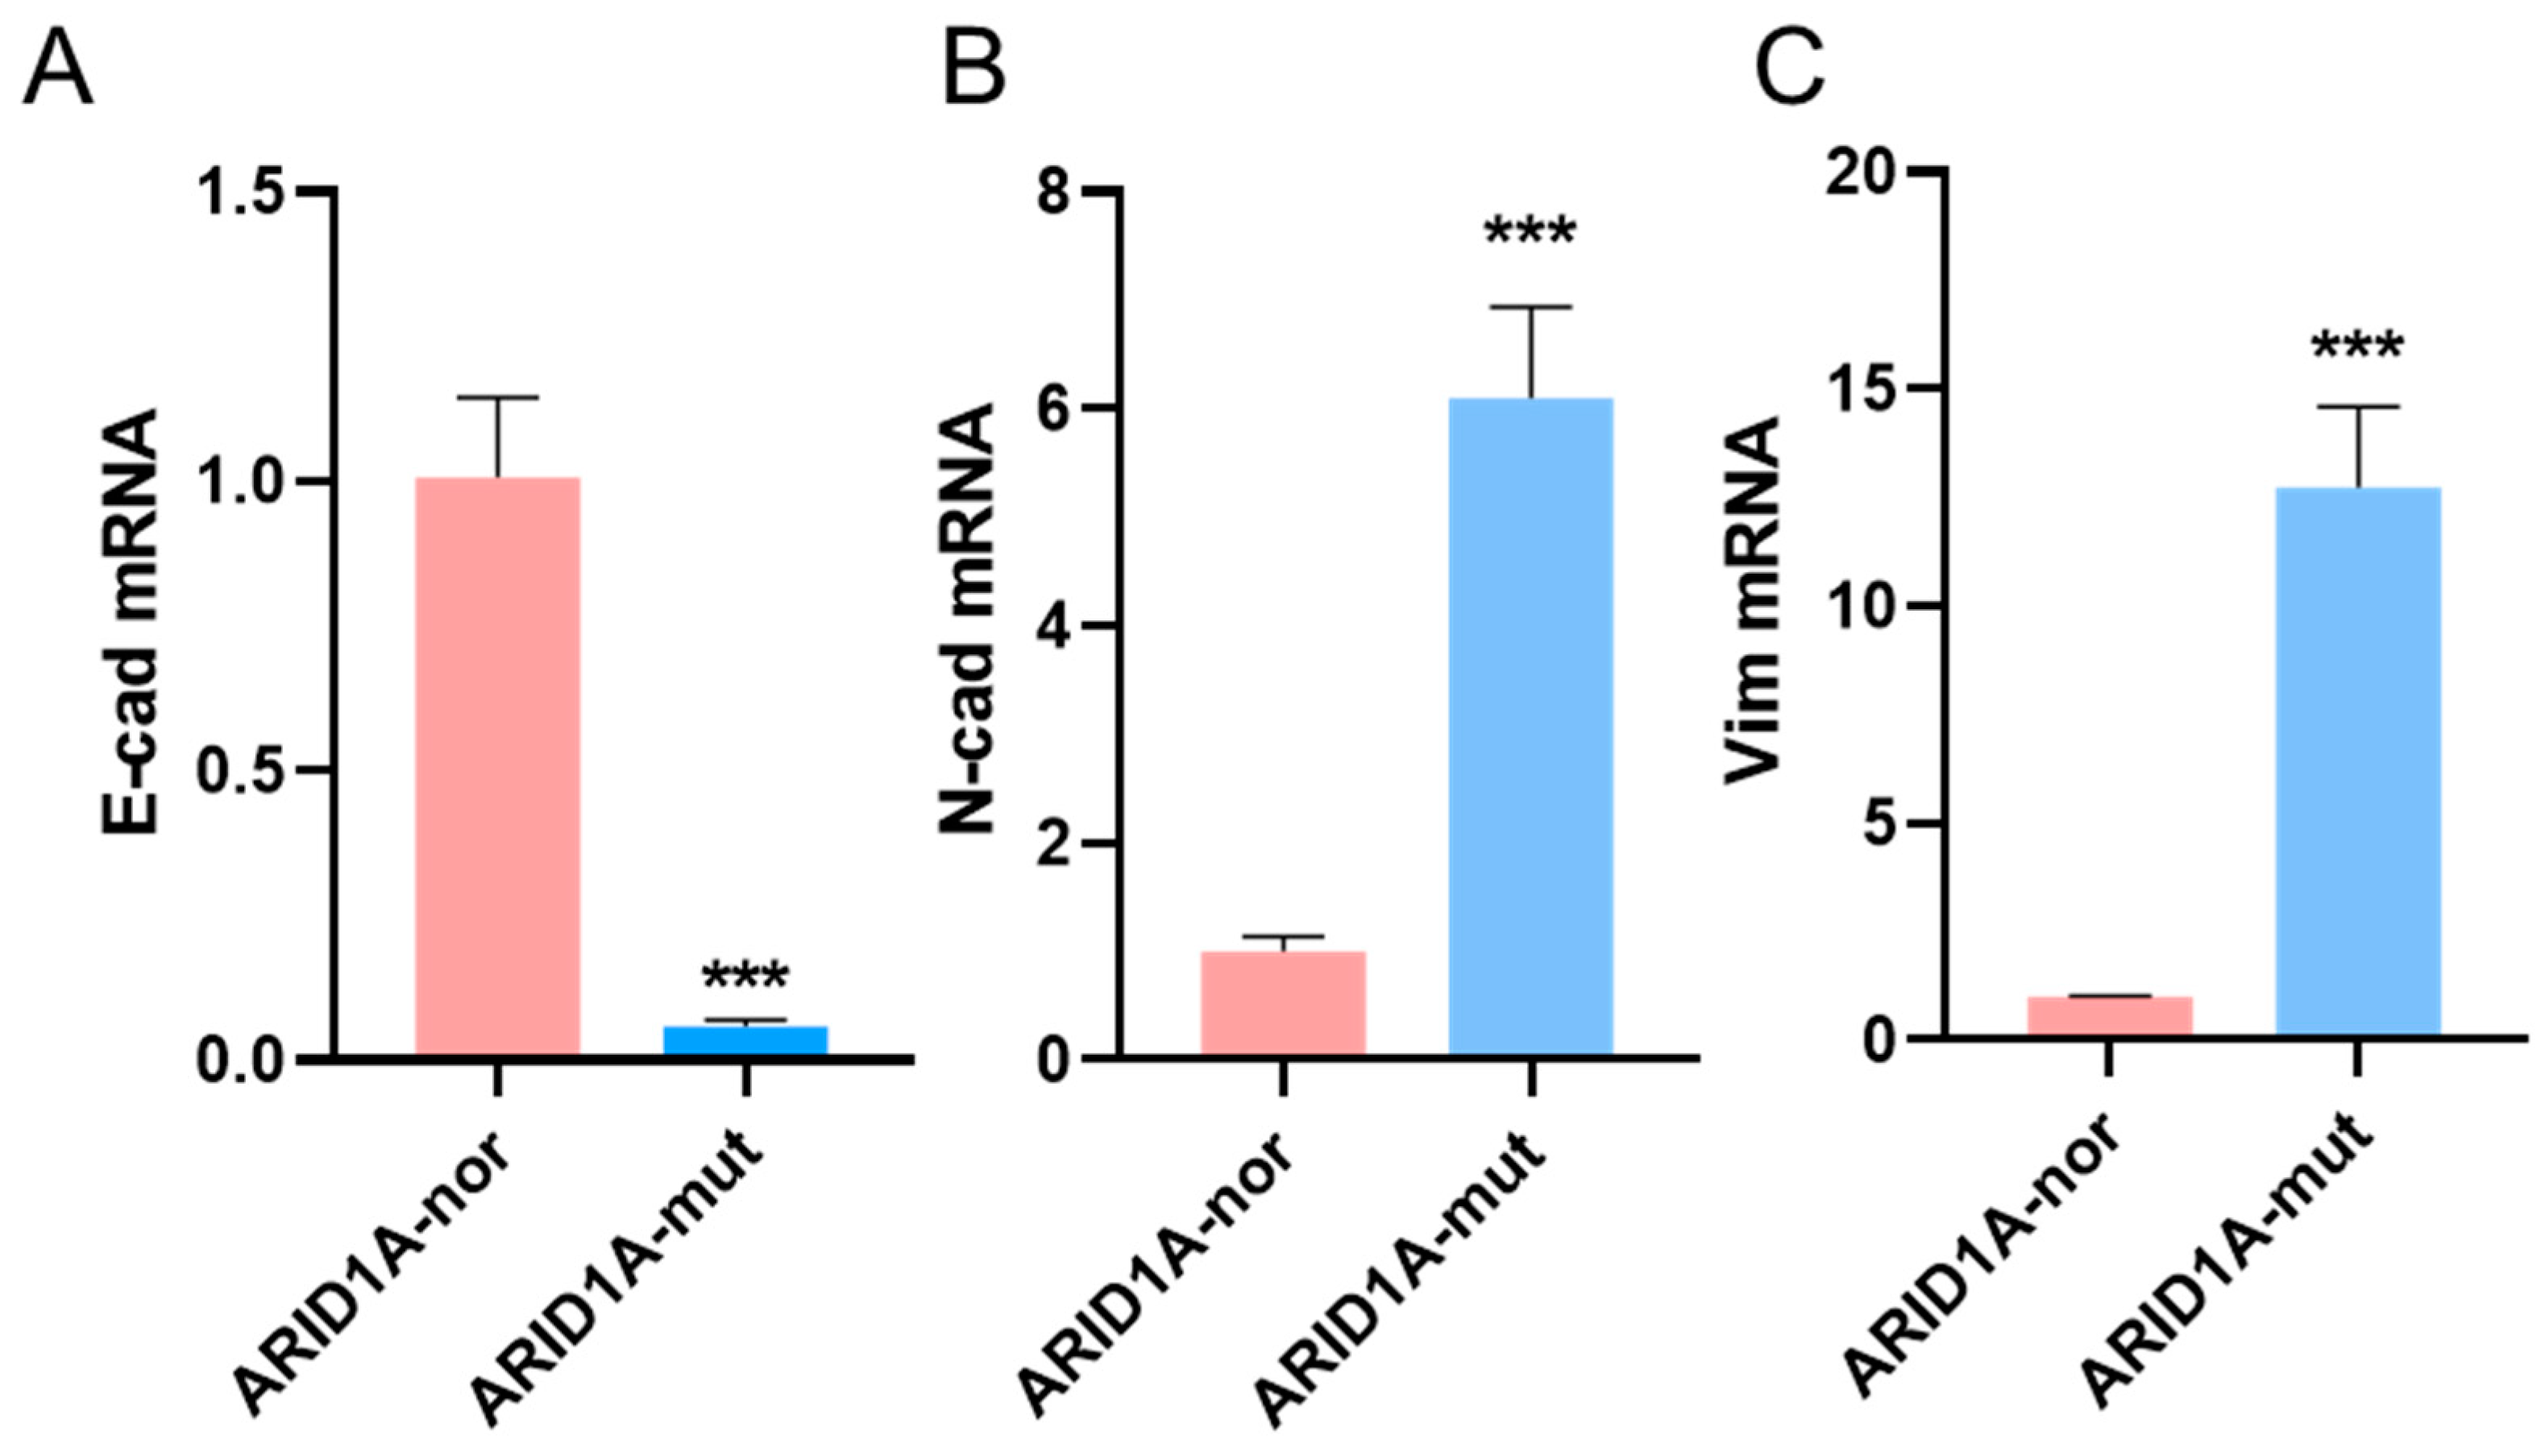
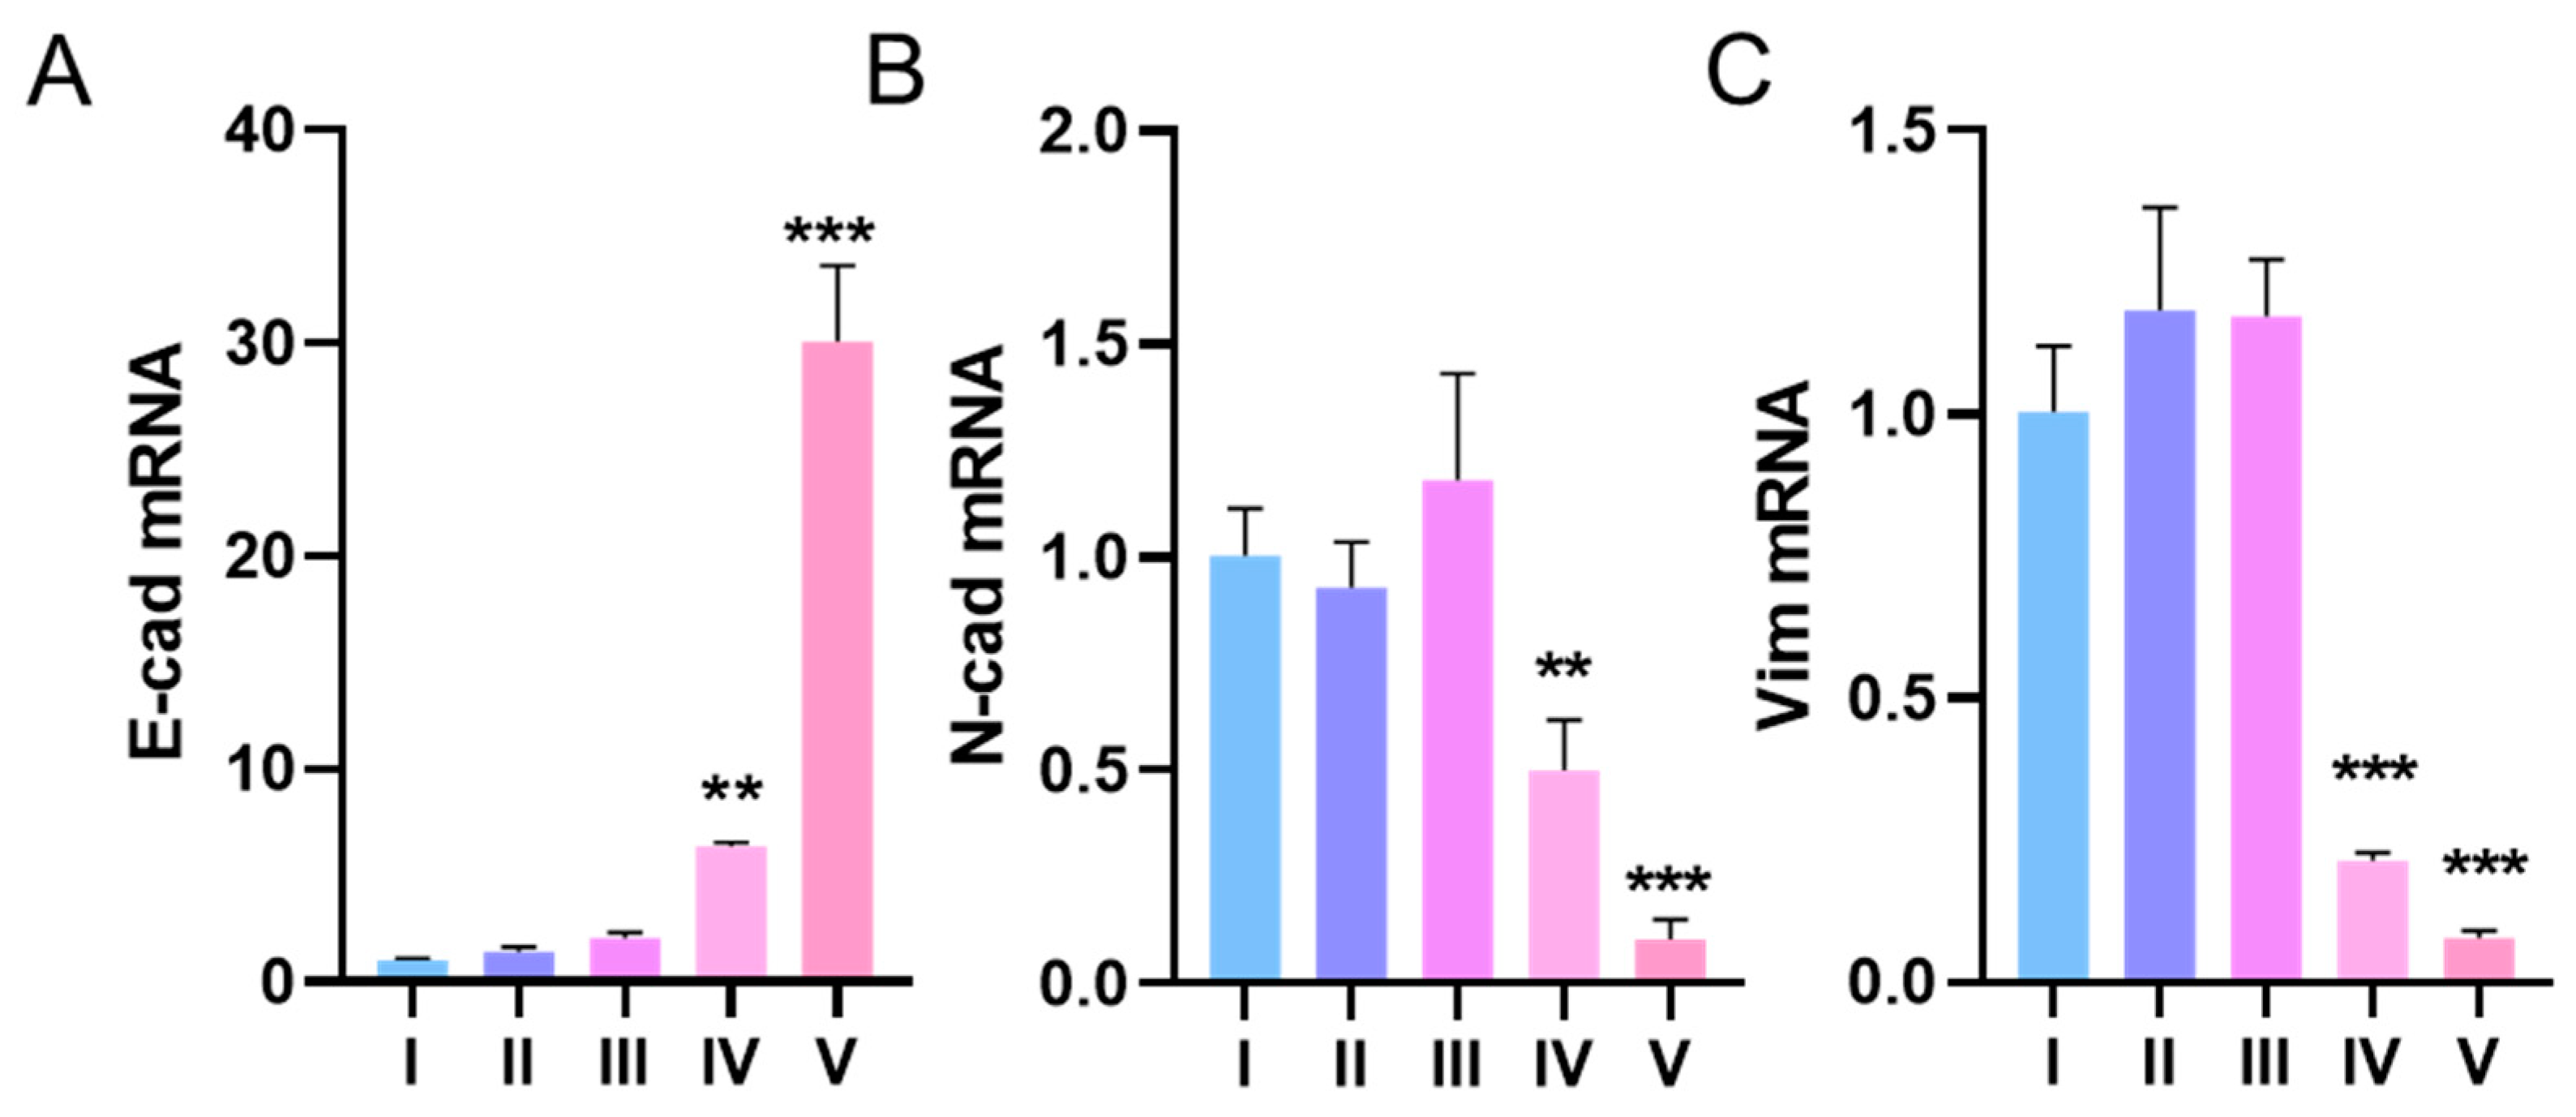
3.3. ARID1A-Mutant Cancer Cell Line Shown Different EMT Biomarkers Levels
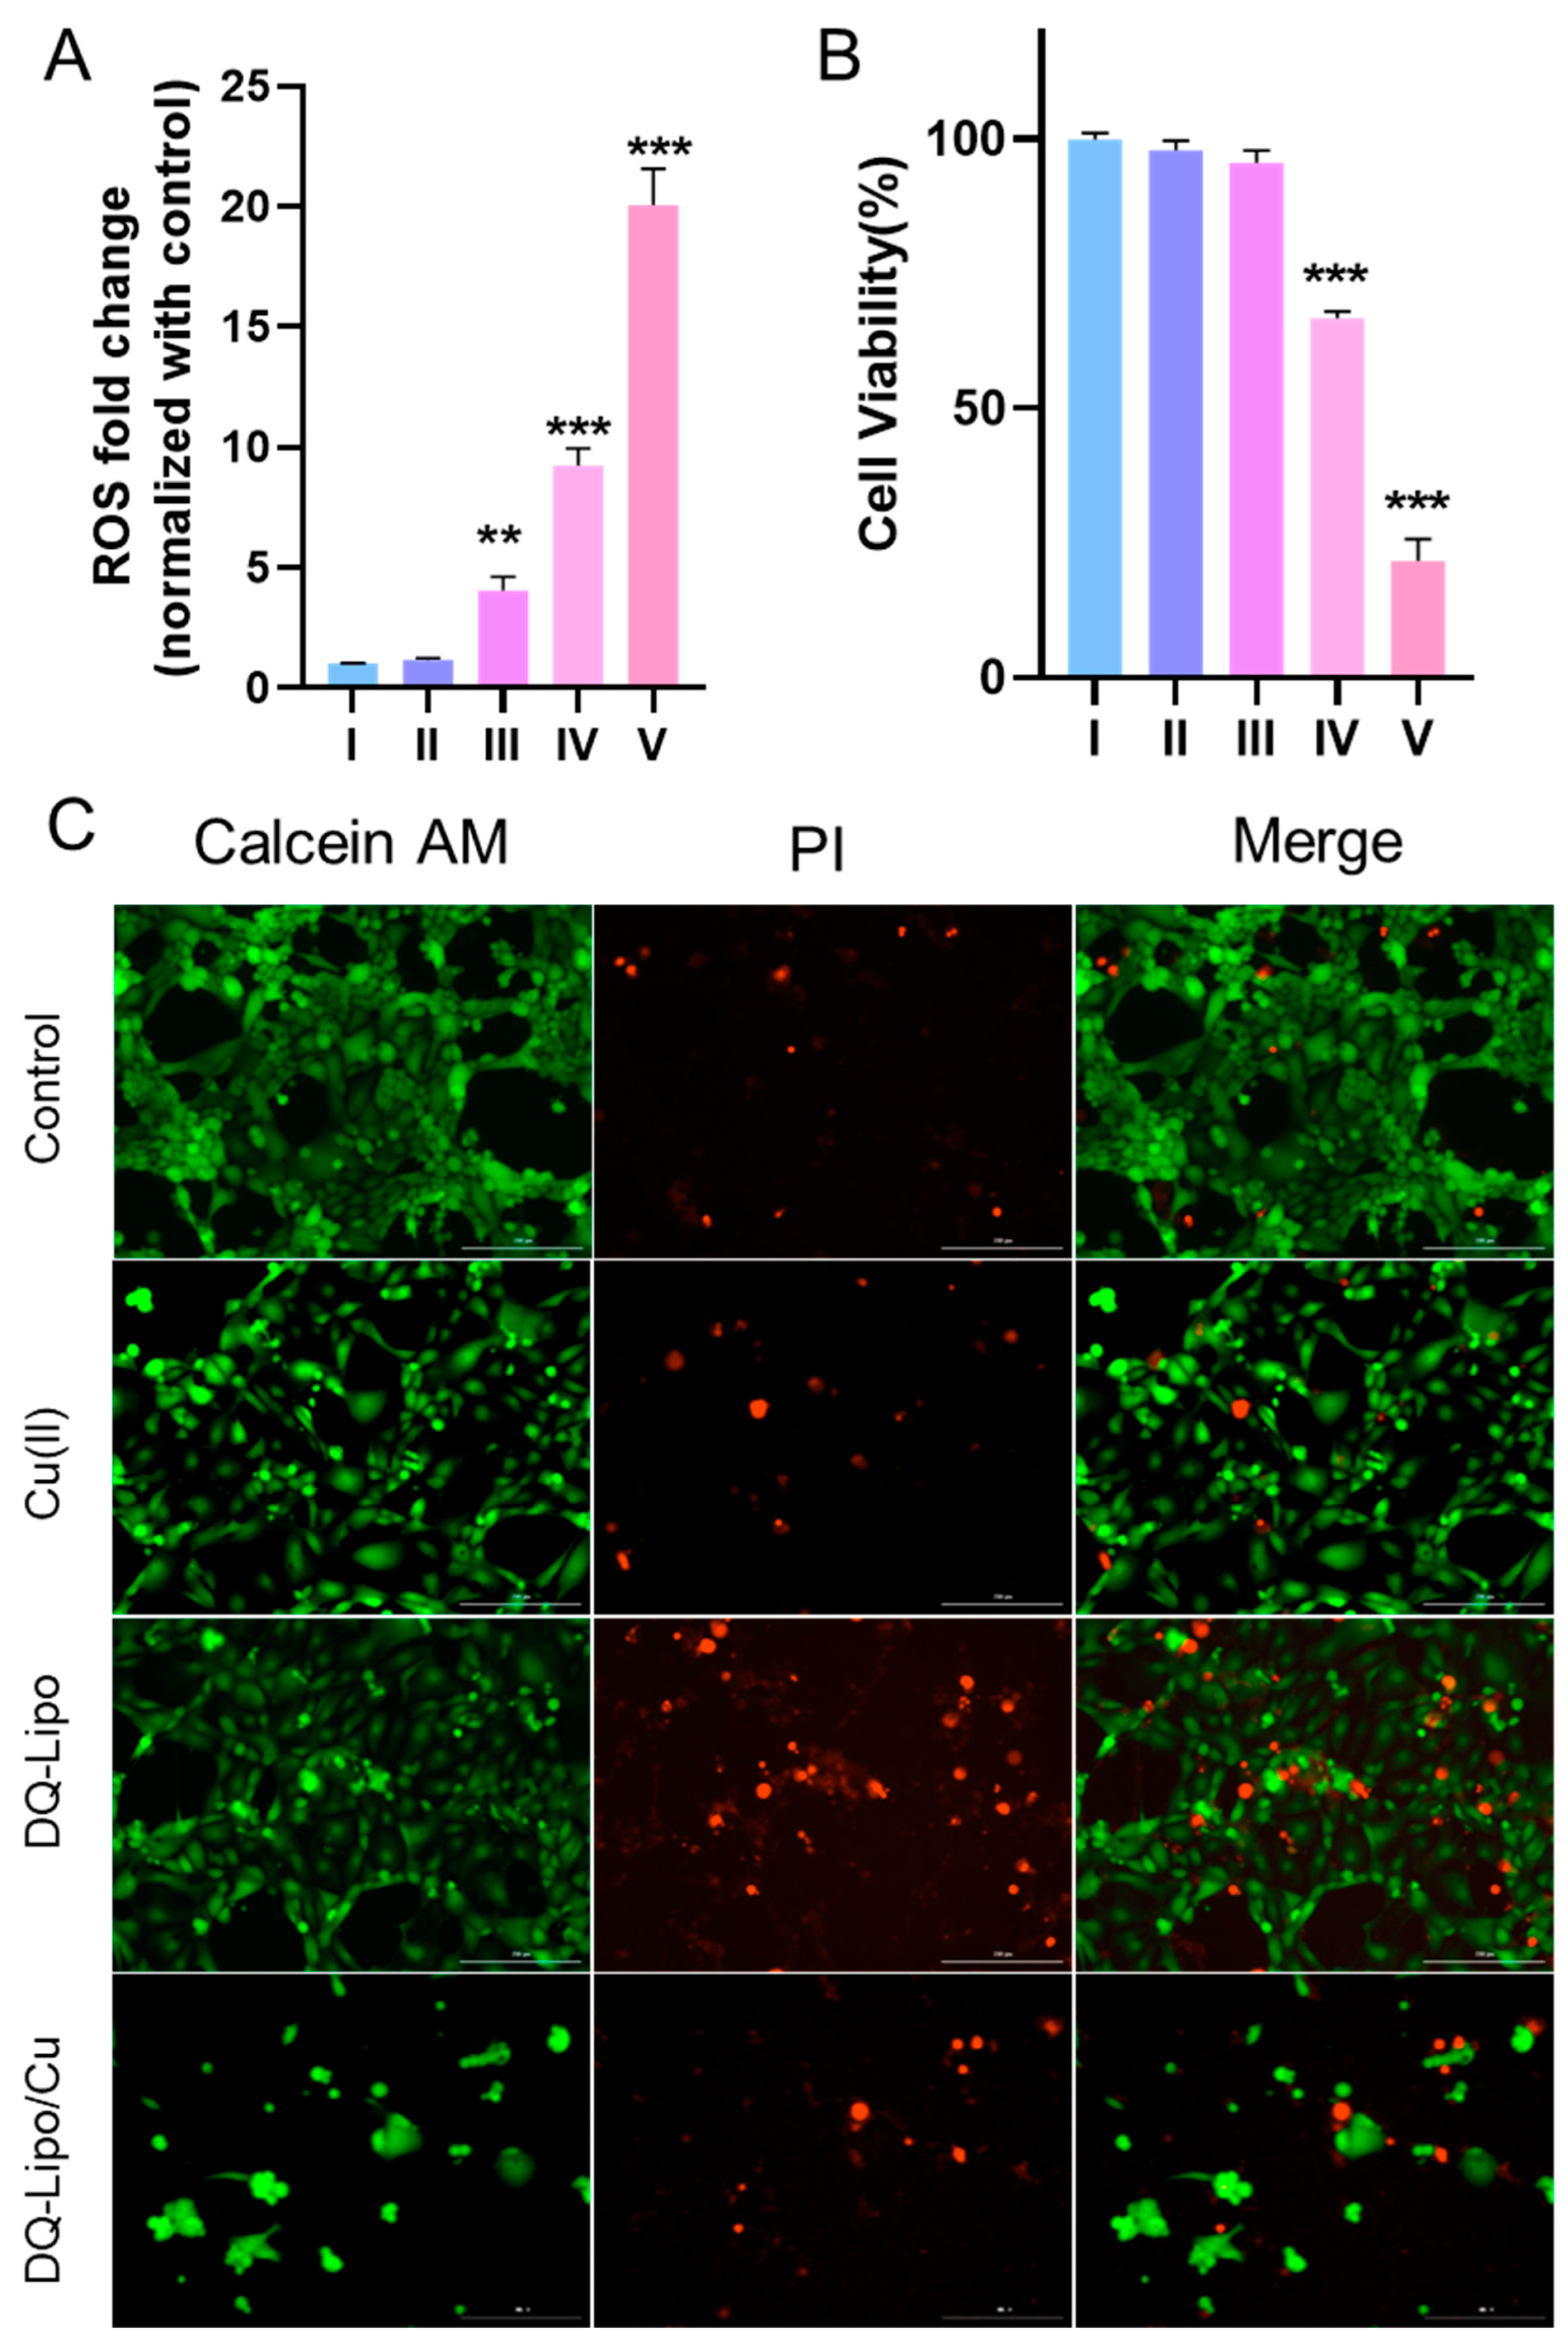
3.4. In Vitro Antitumor Activity of Liposomes against ARID1A-Mutant Cancer Cell
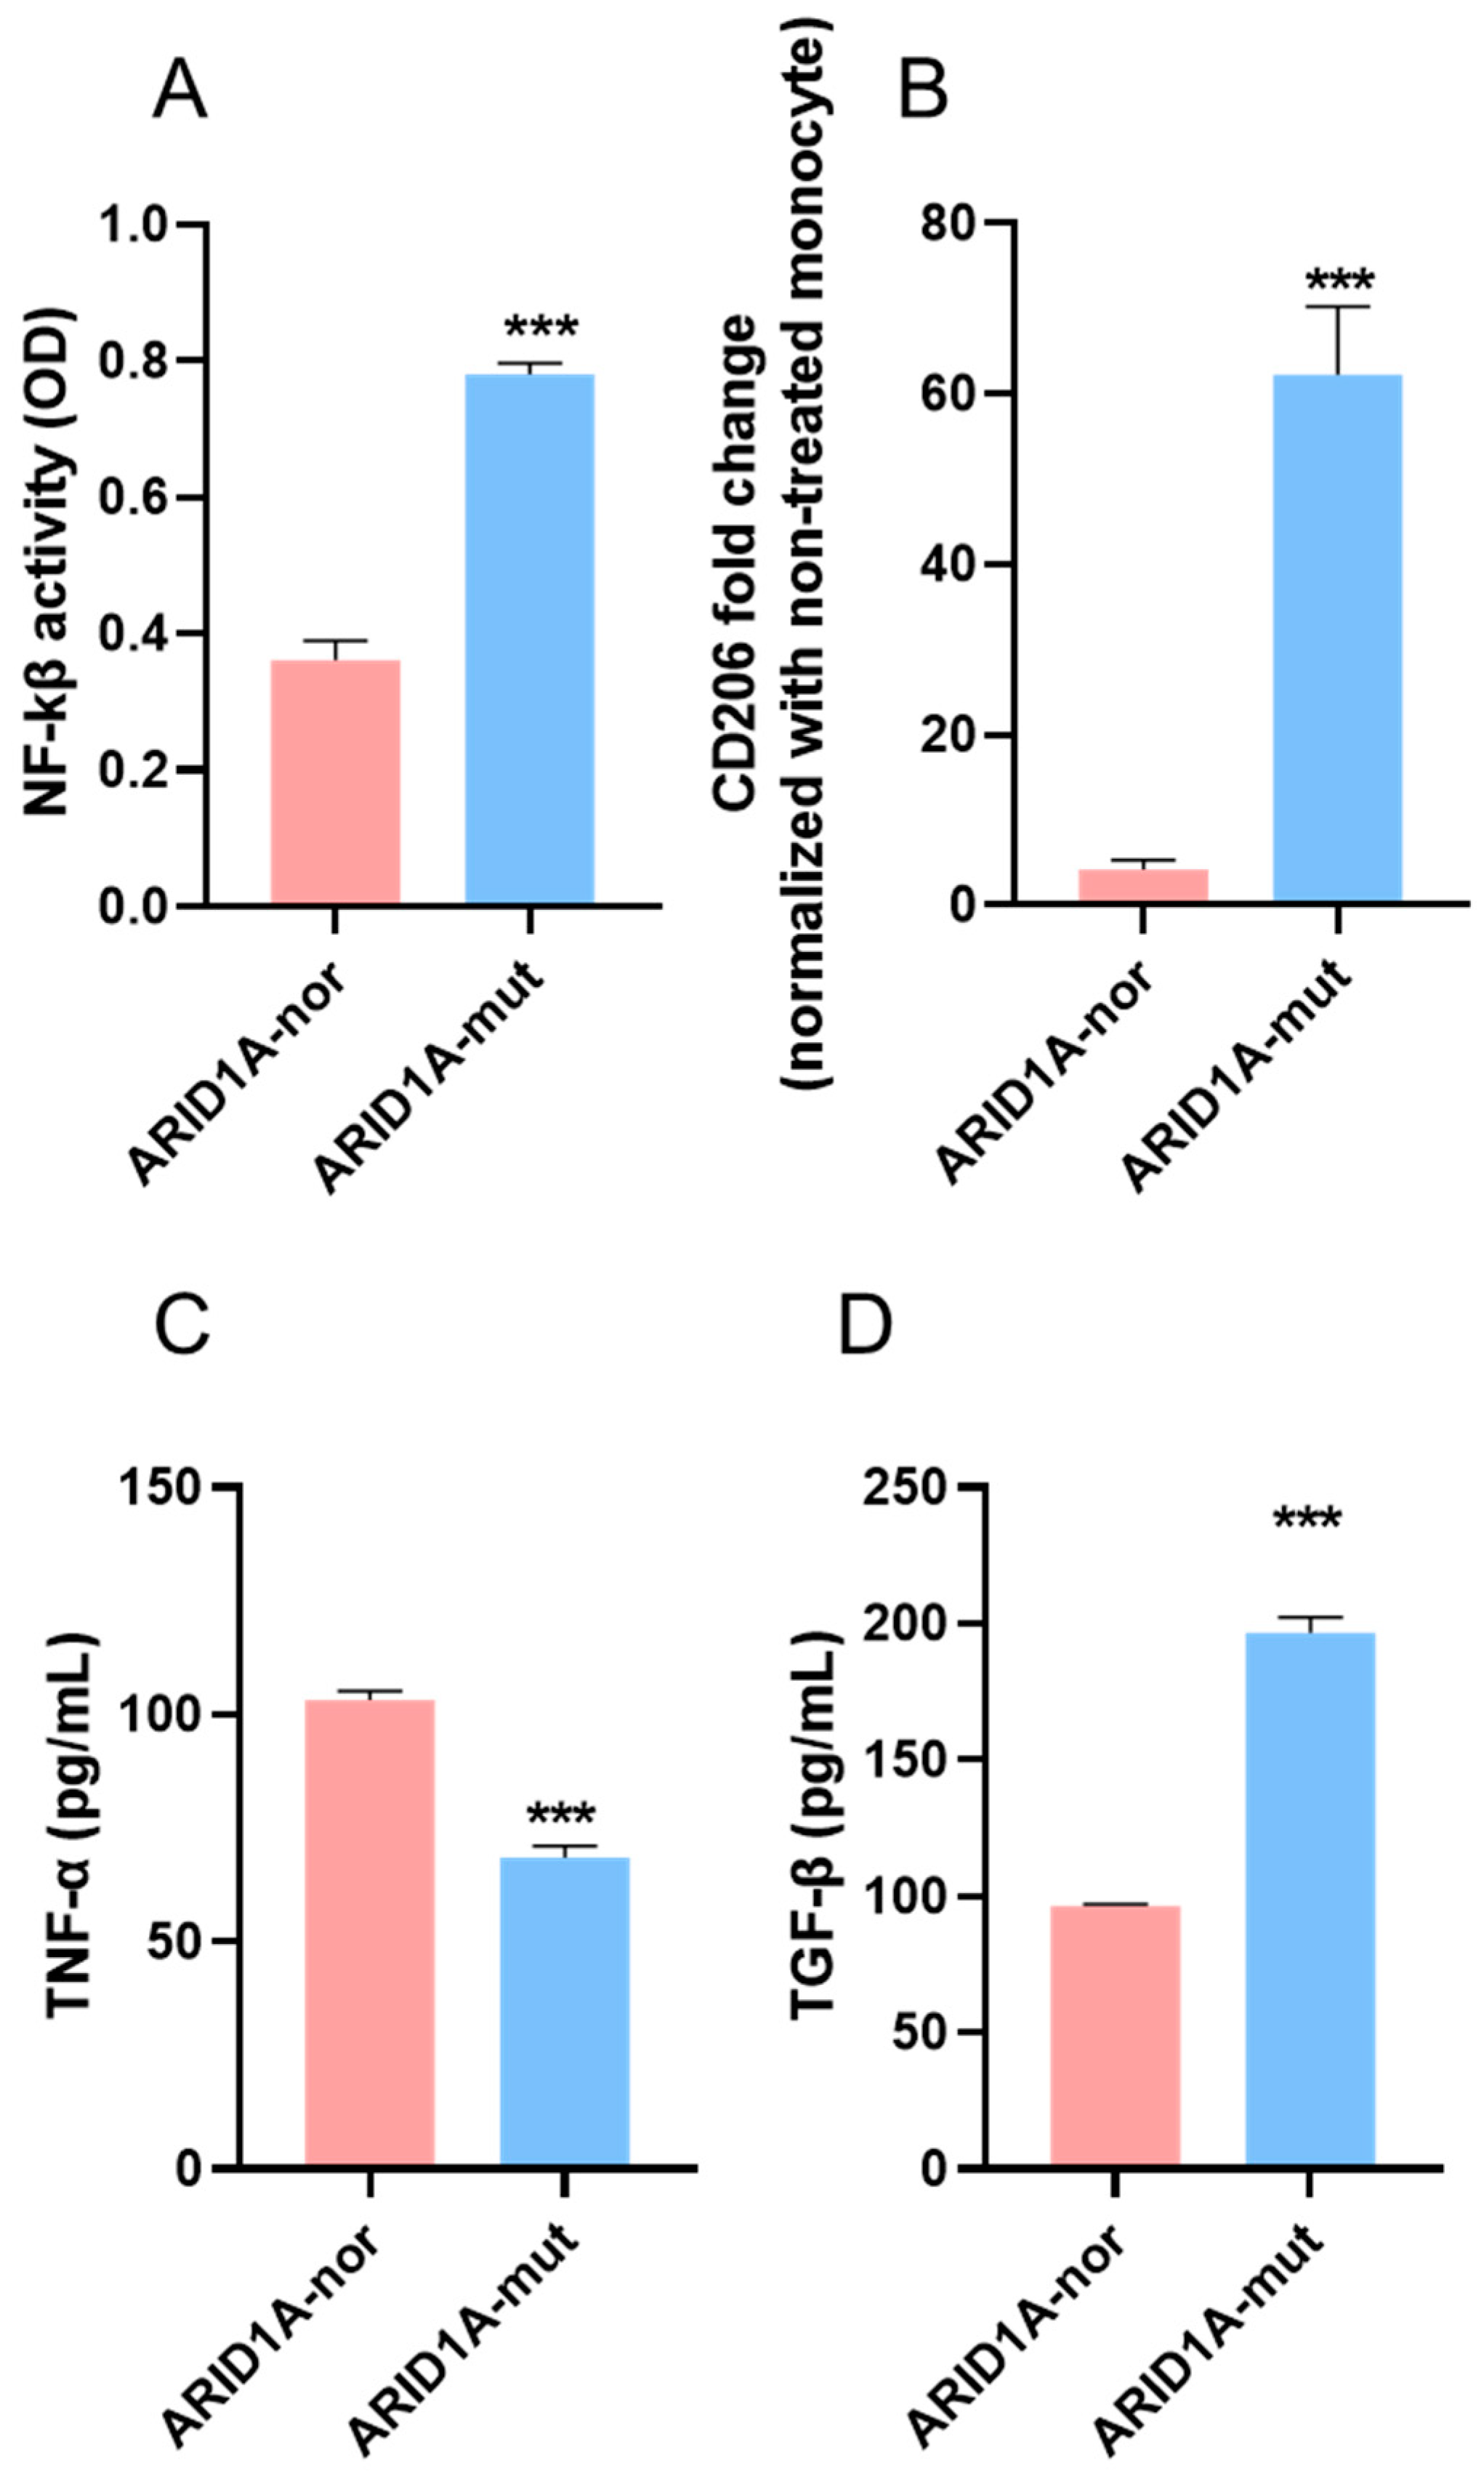
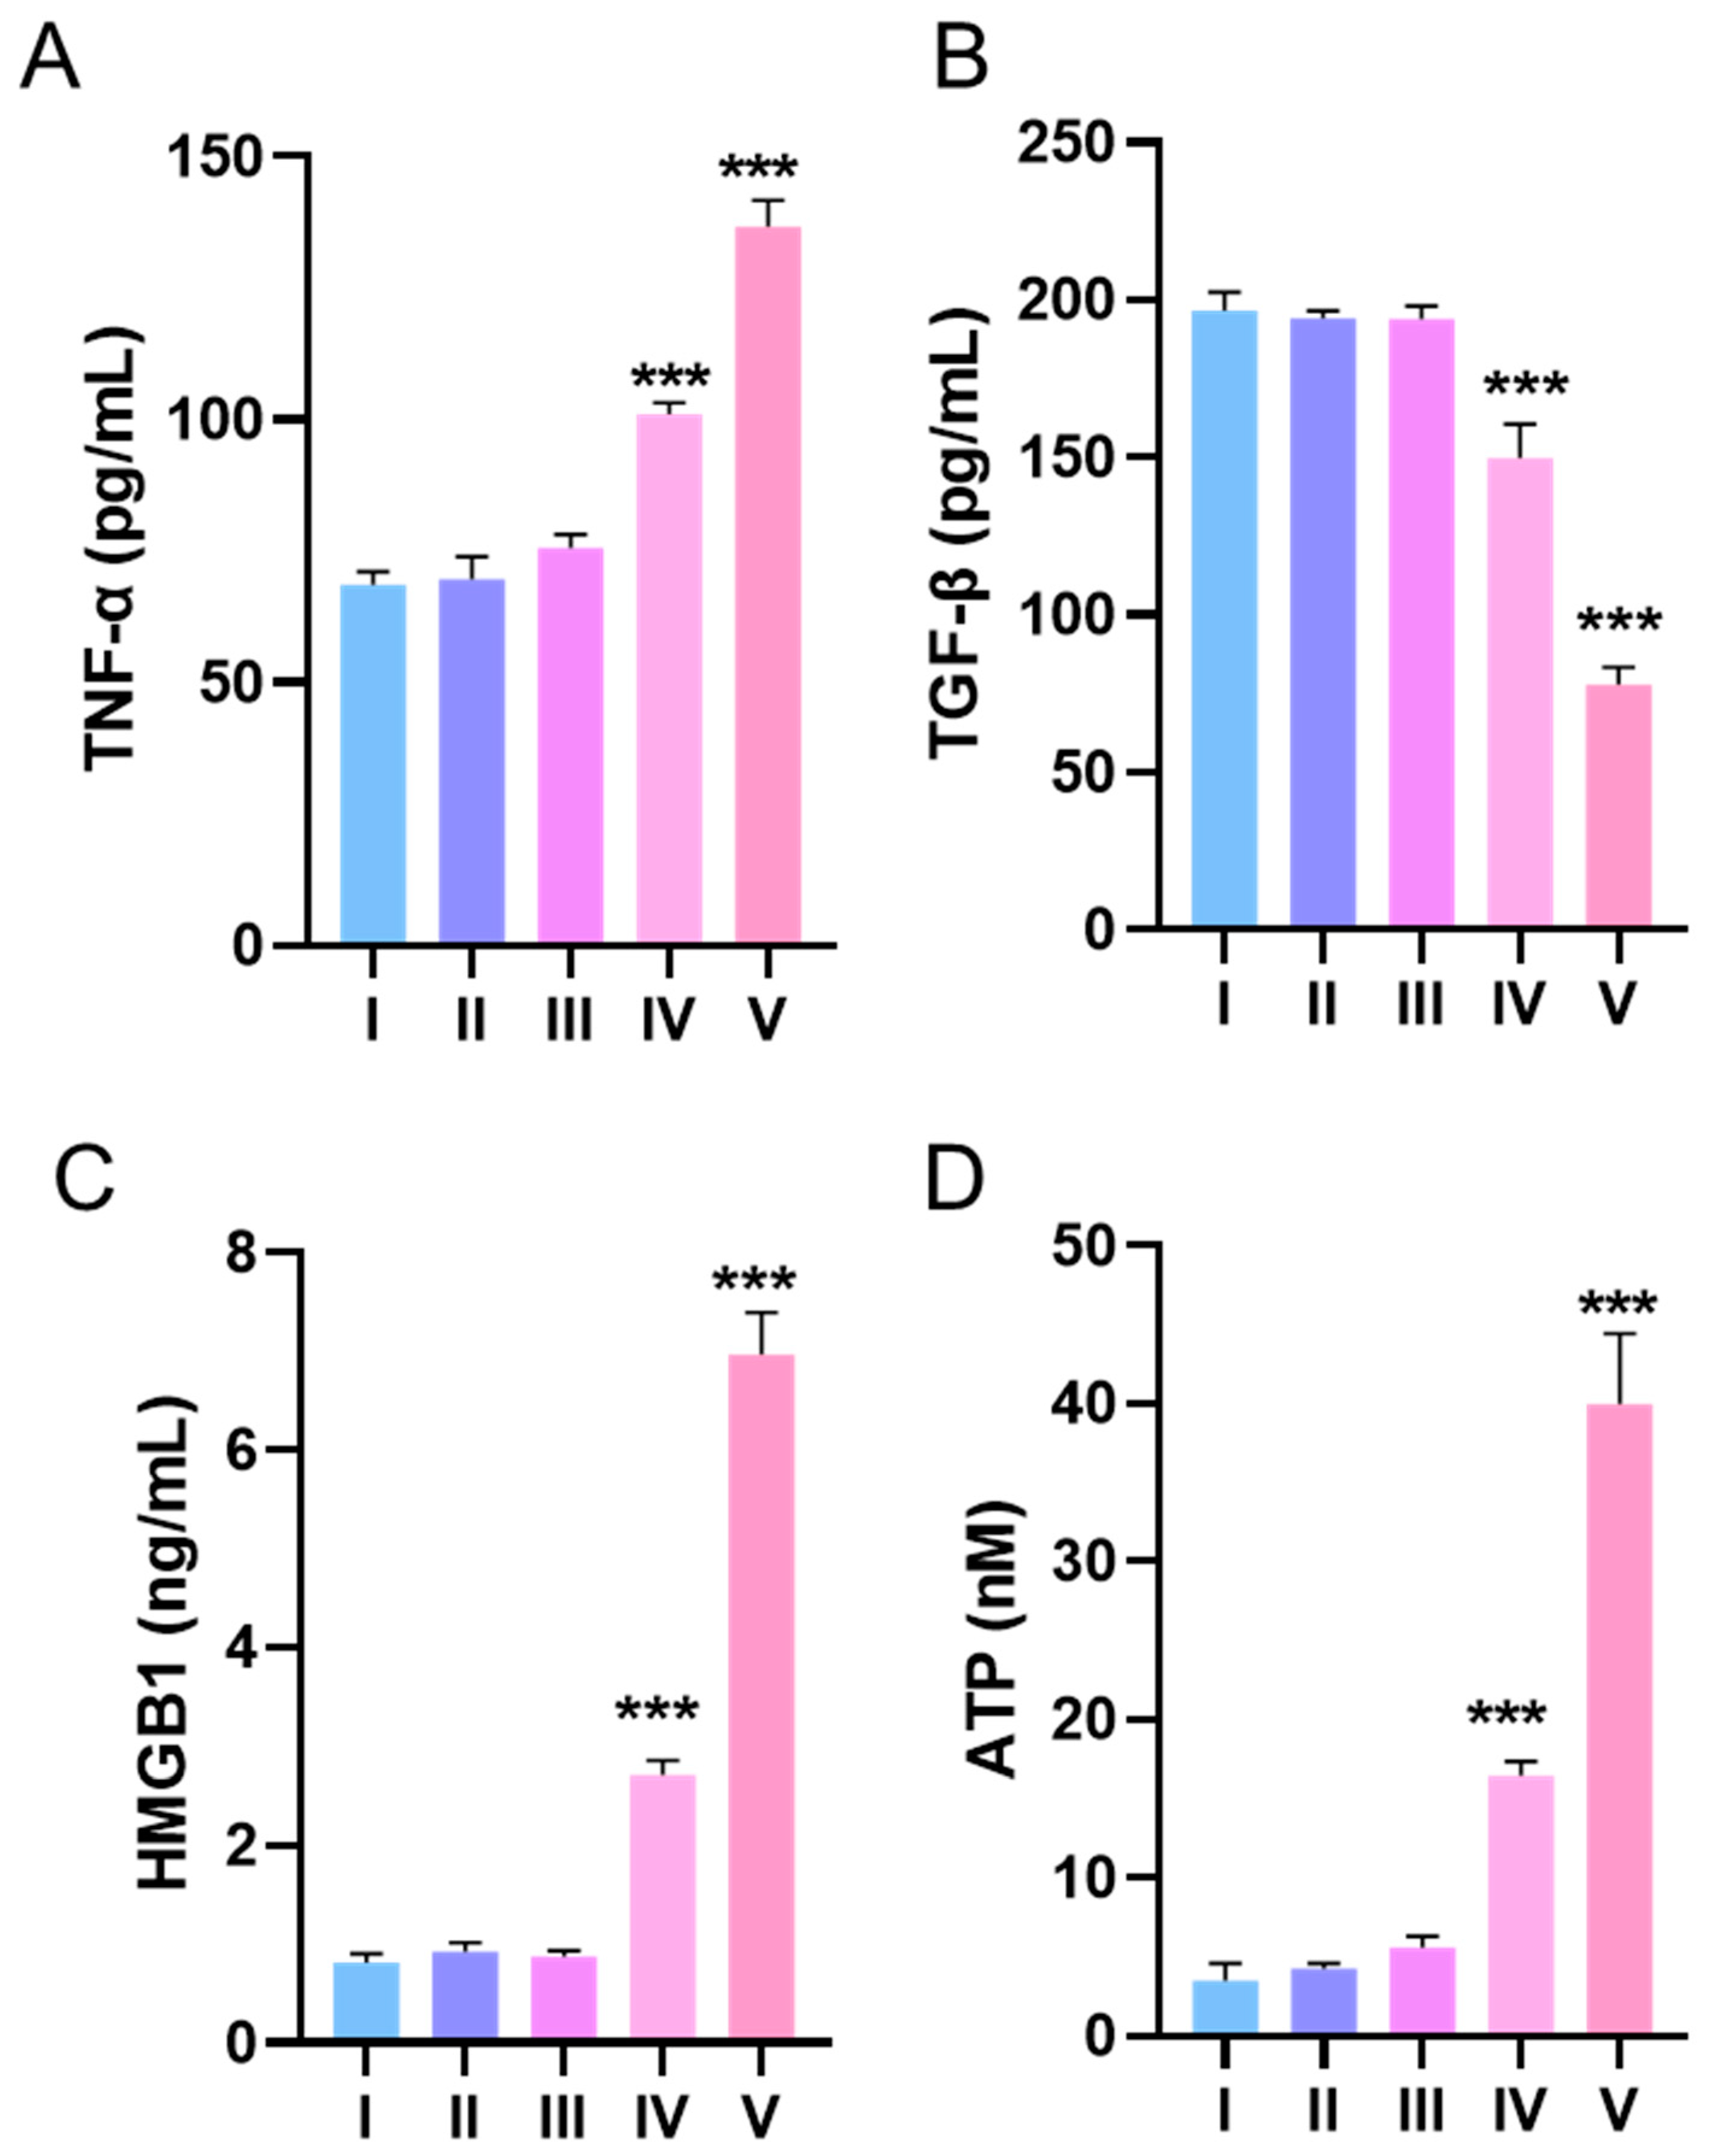
3.5. Effects of DQ-Lipo/Cu on Improvement of Cold TME
4. Conclusions
Supplementary Materials
Author Contributions
Funding
Data Availability Statement
Conflicts of Interest
References
- Wang, T.; Zeng, J.; Li, N.; Zhang, R.; Song, Y.; Wu, L. An exploratory analysis about cycles of adjuvant chemotherapy and outcomes by substage for stage I ovarian clear cell carcinoma: A single institution retrospective study. Am. J. Cancer Res. 2020, 10, 4561. [Google Scholar] [PubMed]
- Pearce, C.L.; Templeman, C.; Rossing, M.A.; Lee, A.; Near, A.M.; Webb, P.M.; Nagle, C.M.; Doherty, J.A.; Cushing-Haugen, K.L.; Wicklund, K.G.; et al. Association between endometriosis and risk of histological subtypes of ovarian cancer: A pooled analysis of case–control studies. Lancet Oncol. 2012, 13, 385–394. [Google Scholar] [CrossRef] [PubMed] [Green Version]
- Anglesio, M.S.; Carey, M.S.; Köbel, M.; MacKay, H.; Huntsman, D.G. Clear cell carcinoma of the ovary: A report from the first Ovarian Clear Cell Symposium, June 24th, 2010. Gynecol. Oncol. 2011, 121, 407–415. [Google Scholar] [CrossRef]
- Takahashi, K.; Takenaka, M.; Okamoto, A.; Bowtell, D.D.; Kohno, T. Treatment strategies for ARID1A-deficient ovarian clear cell carcinoma. Cancers 2021, 13, 1769. [Google Scholar] [CrossRef] [PubMed]
- Sun, Y.; Liu, G. Endometriosis-associated ovarian clear cell carcinoma: A special entity? J. Cancer 2021, 12, 6773. [Google Scholar] [CrossRef]
- Mwenifumbo, J.C.; Marra, M.A. Cancer genome-sequencing study design. Nat. Rev. Genet. 2013, 14, 321–332. [Google Scholar] [CrossRef]
- Bitler, B.G.; Aird, K.M.; Garipov, A.; Li, H.; Amatangelo, M.; Kossenkov, A.V.; Schultz, D.C.; Liu, Q.; Shih, I.-M.; Conejo-Garcia, J.R.; et al. Synthetic lethality by targeting EZH2 methyltransferase activity in ARID1A-mutated cancers. Nat. Med. 2015, 21, 231–238. [Google Scholar] [CrossRef] [Green Version]
- Bitler, B.G.; Fatkhutdinov, N.; Zhang, R.J. Potential therapeutic targets in ARID1A-mutated cancers. Expert Opin. Ther. Targets 2015, 19, 1419–1422. [Google Scholar] [CrossRef] [Green Version]
- Ogiwara, H.; Takahashi, K.; Sasaki, M.; Kuroda, T.; Yoshida, H.; Watanabe, R.; Maruyama, A.; Makinoshima, H.; Chiwaki, F.; Sasaki, H.; et al. Targeting the vulnerability of glutathione metabolism in ARID1A-deficient cancers. Cancer cell 2019, 35, 177–190. [Google Scholar]
- Aboelella, N.S.; Brandle, C.; Kim, T.; Ding, Z.-C.; Zhou, G. Oxidative stress in the tumor microenvironment and its relevance to cancer immunotherapy. Cancers 2021, 13, 986. [Google Scholar] [CrossRef]
- Zhou, G.; Meng, S.; Li, Y.; Ghebre, Y.T.; Cooke, J.P. Optimal ROS signaling is critical for nuclear reprogramming. Cell Rep. 2016, 15, 919–925. [Google Scholar] [CrossRef] [PubMed] [Green Version]
- Kang, X.; Cai, Y.; Wang, Q.; Wang, C.; Chen, W.; Yang, W.; Suryawanshi, A.; Zhou, G.; Chen, P.; Li, F. Near-infrared light triggered activation of pro-drug combination cancer therapy and induction of immunogenic cell death. Int. J. Pharm. 2021, 607, 120972. [Google Scholar] [CrossRef] [PubMed]
- Pan, Q.; Zhang, B.; Peng, X.; Wan, S.; Luo, K.; Gao, W.; Pu, Y.; He, B.J.C.C. A dithiocarbamate-based H2O2-responsive prodrug for combinational chemotherapy and oxidative stress amplification therapy. Chem. Comm. 2019, 55, 13896–13899. [Google Scholar] [CrossRef] [PubMed]
- Zhou, G.; Latchoumanin, O.; Hebbard, L.; Duan, W.; Liddle, C.; George, J.; Qiao, L.J.A. Aptamers as targeting ligands and therapeutic molecules for overcoming drug resistance in cancers. Adv. Drug Deliv. Rev. 2018, 134, 107–121. [Google Scholar] [CrossRef]
- Yang, Z.; Guo, F.; Albers, A.E.; Sehouli, J.; Kaufmann, A.M. Disulfiram modulates ROS accumulation and overcomes synergistically cisplatin resistance in breast cancer cell lines. Biomed. Pharmacother. 2019, 113, 108727. [Google Scholar] [CrossRef]
- Zheng, Z.; Zhang, J.; Jiang, J.; He, Y.; Zhang, W.; Mo, X.; Kang, X.; Xu, Q.; Wang, B.; Huang, Y. Remodeling tumor immune microenvironment (TIME) for glioma therapy using multi-targeting liposomal codelivery. J. Immunother. Cancer 2020, 8, e000207. [Google Scholar] [CrossRef]
- Zhou, L.; Hou, B.; Wang, D.; Sun, F.; Song, R.; Shao, Q.; Wang, H.; Yu, H.; Li, Y. Engineering polymeric prodrug nanoplatform for vaccination immunotherapy of cancer. Nano Lett. 2020, 20, 4393–4402. [Google Scholar] [CrossRef]
- Xiong, W.; Qi, L.; Jiang, N.; Zhao, Q.; Chen, L.; Jiang, X.; Li, Y.; Zhou, Z.; Shen, J. Metformin liposome-mediated PD-L1 downregulation for amplifying the photodynamic immunotherapy efficacy. ACS Appl. Mater. Interfaces 2021, 13, 8026–8041. [Google Scholar] [CrossRef]
- Hong, D.S.; Kang, Y.-K.; Borad, M.; Sachdev, J.; Ejadi, S.; Lim, H.Y.; Brenner, A.J.; Park, K.; Lee, J.-L.; Kim, T.-Y. Phase 1 study of MRX34, a liposomal miR-34a mimic, in patients with advanced solid tumours. Br. J. Cancer 2020, 122, 1630–1637. [Google Scholar]
- Zhong, H.-H.; Wang, H.-Y.; Li, J.; Huang, Y.-Z. TRAIL-based gene delivery and therapeutic strategies. Acta Pharmacol. Sin. 2019, 40, 1373–1385. [Google Scholar] [CrossRef] [Green Version]
- Kang, X.; Zheng, Z.; Liu, Z.; Wang, H.; Zhao, Y.; Zhang, W.; Shi, M.; He, Y.; Cao, Y.; Xu, Q. Liposomal codelivery of doxorubicin and andrographolide inhibits breast cancer growth and metastasis. Mol. Pharm. 2018, 15, 1618–1626. [Google Scholar] [CrossRef] [PubMed]
- Bitler, B.G.; Wu, S.; Park, P.H.; Hai, Y.; Aird, K.M.; Wang, Y.; Zhai, Y.; Kossenkov, A.V.; Vara-Ailor, A.; Rauscher, F.J., III. ARID1A-mutated ovarian cancers depend on HDAC6 activity. Nat. Cell Biol. 2017, 19, 962–973. [Google Scholar] [CrossRef] [PubMed] [Green Version]
- Kang, X.; Wang, H.; Peng, H.; Chen, B.; Zhang, W.; Wu, A.; Xu, Q.; Huang, Y. Codelivery of dihydroartemisinin and doxorubicin in mannosylated liposomes for drug-resistant colon cancer therapy. Acta Pharmacol. Sin. 2017, 38, 885–896. [Google Scholar] [CrossRef] [PubMed]
- Mo, X.; Zheng, Z.; He, Y.; Zhong, H.; Kang, X.; Shi, M.; Liu, T.; Jiao, Z.; Huang, Y. Antiglioma via regulating oxidative stress and remodeling tumor-associated macrophage using lactoferrin-mediated biomimetic codelivery of simvastatin/fenretinide. Nat. Cell Biol. 2018, 287, 12–23. [Google Scholar] [CrossRef] [PubMed]
- Kang, X.; Wang, J.; Huang, C.-H.; Wibowo, F.S.; Amin, R.; Chen, P.; Li, F. Diethyldithiocarbamate copper nanoparticle overcomes resistance in cancer therapy without inhibiting P-glycoprotein. Nanomed. Nanotechnol. Biol. Med. 2023, 47, 102620. [Google Scholar] [CrossRef] [PubMed]
- Okamoto, M.; Shimogishi, M.; Nakamura, A.; Suga, Y.; Sugawara, K.; Sato, M.; Nishi, R.; Fujisawa, A.; Yamamoto, Y.; Kashiba, M. Differentiation of THP-1 monocytes to macrophages increased mitochondrial DNA copy number but did not increase expression of mitochondrial respiratory proteins or mitochondrial transcription factor A. Arch. Biochem. N. Y. 2021, 710, 108988. [Google Scholar] [CrossRef]
- Smith, M.P.; Young, H.; Hurlstone, A.; Wellbrock, C. Differentiation of THP1 cells into macrophages for transwell co-culture assay with melanoma cells. Bio-Protocol 2015, 5, e1638. [Google Scholar] [CrossRef] [Green Version]
- Purwoko, R.Y.; Rosliana, I.; Purwaningsih, E.H.; Freisleben, H.J.; Adiwinata, J. Liposome formulation of soybean phosphatidylcholine extract from argomulyo variety soy to replace the toxicity of injectable phosphatidylcholine solution containing sodium deoxycholate. Int. J. PharmTech Res. 2016, 9, 166–175. [Google Scholar]
- Sen, M. The Role of ARID1A in Oncogenic Transcriptional (de) Regulation in Colorectal Cancer. Ph. D. Thesis, Georg-August Universität, Göttingen, Germany, 2019. [Google Scholar]
- Desideri, E.; Ciccarone, F.; Ciriolo, M.R.J.N. Targeting glutathione metabolism: Partner in crime in anticancer therapy. Nutrients 2019, 11, 1926. [Google Scholar] [CrossRef] [Green Version]
- Wang, J.; Yan, H.-B.; Zhang, Q.; Liu, W.-Y.; Jiang, Y.-H.; Peng, G.; Wu, F.-Z.; Liu, X.; Yang, P.-Y.; Liu, F. Enhancement of E-cadherin expression and processing and driving of cancer cell metastasis by ARID1A deficiency. Oncogene 2021, 40, 5468–5481. [Google Scholar] [CrossRef]
- Zhang, J.; Wang, N.; Li, Q.; Zhou, Y.; Luan, Y.J.C.C. A two-pronged photodynamic nanodrug to prevent metastasis of basal-like breast cancer. Chem. Comm. 2021, 57, 2305–2308. [Google Scholar] [CrossRef]
- Cassetta, L.; Fragkogianni, S.; Sims, A.H.; Swierczak, A.; Forrester, L.M.; Zhang, H.; Soong, D.Y.; Cotechini, T.; Anur, P.; Lin, E.Y. Human tumor-associated macrophage and monocyte transcriptional landscapes reveal cancer-specific reprogramming, biomarkers, and therapeutic targets. Cancer cell 2019, 35, 588–602. [Google Scholar] [CrossRef] [PubMed] [Green Version]
- Xiao, S.; Liu, L.; Lu, X.; Long, J.; Zhou, X.; Fang, M. The prognostic significance of bromodomain PHD-finger transcription factor in colorectal carcinoma and association with vimentin and E-cadherin. J. Cancer Res. Clin. Oncol. 2015, 141, 1465–1474. [Google Scholar] [CrossRef] [PubMed]
- Link, A.; Bornschein, J.; Thon, C.J.B.P.; Gastroenterology, R.C. Helicobacter pylori induced gastric carcinogenesis-The best molecular model we have? Best Pract. Res. Clin. Gastroenterol. 2021, 50, 101743. [Google Scholar] [CrossRef] [PubMed]
- Mittal, P. Molecular Characterization of Metastatic Endometrial Cancer by Mass Spectrometry. 2017. Available online: https://digital.library.adelaide.edu.au/dspace/handle/2440/121939 (accessed on 12 March 2021).
- Yan, H.-B.; Wang, X.-F.; Zhang, Q.; Tang, Z.-Q.; Jiang, Y.-H.; Fan, H.-Z.; Sun, Y.-H.; Yang, P.-Y.; Liu, F.J.C. Reduced expression of the chromatin remodeling gene ARID1A enhances gastric cancer cell migration and invasion via downregulation of E-cadherin transcription. Carcinogenesis 2014, 35, 867–876. [Google Scholar] [CrossRef] [PubMed] [Green Version]
- Kim, M.; Lu, F.; Zhang, Y. Loss of HDAC-mediated repression and gain of NF-κB activation underlie cytokine induction in ARID1A-and PIK3CA-mutation-driven ovarian cancer. Cell rep. 2016, 17, 275–288. [Google Scholar] [CrossRef] [Green Version]
- Mak, K.K.; Wu, A.T.; Lee, W.H.; Chang, T.C.; Chiou, J.F.; Wang, L.S.; Wu, C.H.; Huang, C.Y.F.; Shieh, Y.S.; Chao, T.Y.; et al. Pterostilbene, a bioactive component of blueberries, suppresses the generation of breast cancer stem cells within tumor microenvironment and metastasis via modulating NF-κ B/microRNA 448 circuit. Mol. Nutr. Food Res. 2013, 57, 1123–1134. [Google Scholar] [CrossRef]
- Zhu, H.; Bengsch, F.; Svoronos, N.; Rutkowski, M.R.; Bitler, B.G.; Allegrezza, M.J.; Yokoyama, Y.; Kossenkov, A.V.; Bradner, J.E.; Conejo-Garcia, J.R.; et al. BET bromodomain inhibition promotes anti-tumor immunity by suppressing PD-L1 expression. Cell Rep. 2016, 16, 2829–2837. [Google Scholar] [CrossRef] [Green Version]
- Aird, K.M.; Zhang, G.; Li, H.; Tu, Z.; Bitler, B.G.; Garipov, A.; Wu, H.; Wei, Z.; Wagner, S.N.; Herlyn, M.; et al. Suppression of nucleotide metabolism underlies the establishment and maintenance of oncogene-induced senescence. Cell Rep. 2013, 3, 1252–1265. [Google Scholar] [CrossRef] [Green Version]
- Yin, W.; Yu, X.; Kang, X.; Zhao, Y.; Zhao, P.; Jin, H.; Fu, X.; Wan, Y.; Peng, C.; Huang, Y.J.S. Remodeling tumor-associated macrophages and neovascularization overcomes EGFRT790M-associated drug resistance by PD-L1 nanobody-mediated codelivery. Small 2018, 14, 1802372. [Google Scholar] [CrossRef]
- Zhao, P.; Wang, Y.; Kang, X.; Wu, A.; Yin, W.; Tang, Y.; Wang, J.; Zhang, M.; Duan, Y.; Huang, Y. Dual-targeting biomimetic delivery for anti-glioma activity via remodeling the tumor microenvironment and directing macrophage-mediated immunotherapy. Chem. Sci. 2018, 9, 2674–2689. [Google Scholar] [CrossRef] [Green Version]
- Erfani, M.; Zamani, M.; Hosseini, S.Y.; Mostafavi-Pour, Z.; Shafiee, S.M.; Saeidnia, M.; Mokarram, P. ARID1A regulates E-cadherin expression in colorectal cancer cells: A promising candidate therapeutic target. Mol. Biol. Rep. 2021, 48, 6749–6756. [Google Scholar] [CrossRef] [PubMed]
- Goswami, K.K.; Ghosh, T.; Ghosh, S.; Sarkar, M.; Bose, A.; Baral, R. Tumor promoting role of anti-tumor macrophages in tumor microenvironment. Cell. Immunol. 2017, 316, 1–10. [Google Scholar] [CrossRef] [PubMed]
- Mercogliano, M.; Bruni, S.; Mauro, F.; Elizalde, P.; Schillaci, R. Harnessing Tumor Necrosis Factor Alpha to Achieve Effective Cancer Immunotherapy. Cancers 2021, 13, 564. [Google Scholar] [CrossRef] [PubMed]
- Zhang, K.; Fang, T.; Shao, Y.; Wu, Y. TGF-β-MTA1-SMAD7-SMAD3-SOX4-EZH2 signaling axis promotes viability, migration, invasion and EMT of hepatocellular carcinoma cells. Cancer Manag. Res. 2021, 13, 7087–7099. [Google Scholar] [CrossRef] [PubMed]
- Duan, X.; Chan, C.; Lin, W. Nanoparticle-mediated immunogenic cell death enables and potentiates cancer immunotherapy. Angew. Chem. Int. Ed. 2019, 58, 670–680. [Google Scholar] [CrossRef]


Disclaimer/Publisher’s Note: The statements, opinions and data contained in all publications are solely those of the individual author(s) and contributor(s) and not of MDPI and/or the editor(s). MDPI and/or the editor(s) disclaim responsibility for any injury to people or property resulting from any ideas, methods, instructions or products referred to in the content. |
© 2023 by the authors. Licensee MDPI, Basel, Switzerland. This article is an open access article distributed under the terms and conditions of the Creative Commons Attribution (CC BY) license (https://creativecommons.org/licenses/by/4.0/).
Share and Cite
Kang, X.; Wang, Q.; Wu, S.; Wang, C.; Annaji, M.; Huang, C.-H.; Shen, J.; Chen, P.; Babu, R.J. Liposomal DQ in Combination with Copper Inhibits ARID1A Mutant Ovarian Cancer Growth. Biomolecules 2023, 13, 744. https://doi.org/10.3390/biom13050744
Kang X, Wang Q, Wu S, Wang C, Annaji M, Huang C-H, Shen J, Chen P, Babu RJ. Liposomal DQ in Combination with Copper Inhibits ARID1A Mutant Ovarian Cancer Growth. Biomolecules. 2023; 13(5):744. https://doi.org/10.3390/biom13050744
Chicago/Turabian StyleKang, Xuejia, Qi Wang, Siqi Wu, Chuanyu Wang, Manjusha Annaji, Chung-Hui Huang, Jianzhong Shen, Pengyu Chen, and R. Jayachandra Babu. 2023. "Liposomal DQ in Combination with Copper Inhibits ARID1A Mutant Ovarian Cancer Growth" Biomolecules 13, no. 5: 744. https://doi.org/10.3390/biom13050744