Article

Spt3 and Spt8 Are Involved in the Formation of a Silencing Boundary by Interacting with TATA-Binding Protein

1
Department of Applied Chemistry & Biotechnology, Graduate School of Engineering, University of Fukui, Fukui 910-8507, Japan
2
Japan Society for the Promotion of Science for Young Scientists (JSPS), Tokyo 102-0083, Japan
3
Life Science Innovation Center, University of Fukui, Fukui 910-8507, Japan
*
Author to whom correspondence should be addressed.
Biomolecules 2023, 13(4), 619; https://doi.org/10.3390/biom13040619
Submission received: 27 February 2023 / Revised: 28 March 2023 / Accepted: 28 March 2023 / Published: 30 March 2023
(This article belongs to the Special Issue Yeast Models for Gene Regulation)

Abstract

:
In Saccharomyces cerevisiae, a heterochromatin-like chromatin structure called the silencing region is present at the telomere as a complex of Sir2, Sir3, and Sir4. Although spreading of the silencing region is blocked by histone acetylase-mediated boundary formation, the details of the factors and mechanisms involved in the spread and formation of the boundary at each telomere are unknown. Here, we show that Spt3 and Spt8 block the spread of the silencing regions. Spt3 and Spt8 are members of the Spt-Ada-Gcn5-acetyltransferase (SAGA) complex, which has histone acetyltransferase activity. We performed microarray analysis of the transcriptome of spt3Δ and spt8Δ strains and RT-qPCR analysis of the transcript levels of genes from the subtelomeric region in mutants in which the interaction of Spt3 with TATA-binding protein (TBP) is altered. The results not only indicated that both Spt3 and Spt8 are involved in TBP-mediated boundary formation on the right arm of chromosome III, but also that boundary formation in this region is DNA sequence independent. Although both Spt3 and Spt8 interact with TBP, Spt3 had a greater effect on genome-wide transcription. Mutant analysis showed that the interaction between Spt3 and TBP plays an important role in the boundary formation.

1. Introduction

Transcriptional silencing is determined by histone modifications in Saccharomyces cerevisiae. The Sir2/4 proteins are recruited to the target region and deacetylate the neighboring histone H4 at Lysine 16. Sir3 interacts with deacetylated histones, followed by interaction with Sir2/4 proteins, leading to further histone deacetylation by Sir2 [1,2,3,4]. Thus, the silencing region formed by Sir proteins is expanded by this “step-wise” mechanism. Transcription of the HM regions, which is the sex-determining region, and the genes of telomeres are silenced by the Sir2/3/4 complex. On the other hand, rDNA transcription is silenced by Sir2 [5,6,7]. The histone acetyltransferase Sas2 is the counterpart of Sir2, a NAD+-dependent histone deacetylase [8,9], and Sas2 mediates the establishment of heterochromatin boundaries. The different mechanism of boundary formation from that of Sas2 histone modifications has been reported for the tDNA region adjacent to the HMR silencing region and for the promoter of the CHA1 gene near the HML silencing region, which functions as an insulator [10,11,12,13]. However, many questions remain, such as the mechanism of boundary formation in native configurations, the number of boundary-forming factors, and the genetic regions regulated by boundary fluctuations.
Boundary factors in Saccharomyces cerevisiae have been identified by screening with the HMR locus and are roughly divided into eight groups: histone modification, transcriptional factor, cell cycle, SWI/SNF, TFIID, mediator, others, and unknown function [14]. In more detail, some of the components of the Spt-Ada-Gcn5-acetyltransferase (SAGA) complex were included in the histone modification group. The SAGA complex consists of 19 proteins, including a histone acetyltransferase and a H2B deubiquitinating enzyme, which are known to promote transcription initiation by interacting with TBP [15,16,17,18,19,20,21,22,23]. We previously focused on the large number of components of the SAGA complex uncovered earlier during screening, and reported that Sgf73, which has deubiquitination activity, Sgf29, which is involved in the recognition of H3K9me2 and H3K9me3, and Ada1, the core component of the SAGA complex, are important for boundary formation [24,25,26]. Screening has also revealed that TBP1 (also known as Spt15), which is known to interact directly with SAGA complex components Spt3 and Spt8, is capable of boundary formation; however, it is still not understood how the SAGA complex and TBP1 co-operate in boundary formation.
Spt3 and Spt8 are components of the histone modification complex SAGA [15,27]. Both Spt3 and Spt8 interact with TATA-binding proteins (TBPs) and regulate target gene expression positively and negatively [28,29,30,31,32,33]. As an example of negative regulation, binding of Spt3 and Spt8 to TBP prevents TBP from binding to the TATA box, resulting in repression of HIS3 and TRP3 genes [34,35]. However, when the binding of Spt3 and Spt8 to TBP is weakened, TBP binds to the TATA box and transcription is promoted [30]. In another mechanism, Spt3 interacts with Gcn5 and inhibits its function. Gcn5 is phosphorylated and activated by Snf1, but Spt3 inhibits Gcn5 function by binding to Gcn5 at the Snf1 interaction site [33]. Others have reported that deletion of SPT3 gene decreases transcription of genes encoding a- and α-factors and causes defects in mating [36]. In addition, Spt3 is a component of both the SAGA complex and a SAGA-like (SLIK) complex, with a similar structure and function to the SAGA complex; however, the SLIK complex does not contain Spt8 [36,37,38,39]. The SLIK complex contains a C-terminal truncated Spt7 (1–1141 amino acids) instead of full-length Spt7 [40].
In this study, we found that Spt3 and Spt8 contribute to the formation of a silencing boundary at the right subtelomere of chromosome III (Chr III), and that the boundary function depends on the intensity of the interaction between the SAGA complex and TBPs via Spt3 and Spt8.

2. Materials and Methods

2.1. Yeast Strains

The KanMX gene was used to construct strains with deletion of the required gene (Knockout Strain Collection, Open Biosystems). To construct the deletion strain, a KanMX cassette flanked by the promoter and terminator of the target genes was prepared by PCR and introduced into yeast cells [41,42]. Transformed cells were selected using medium containing G418. SIR3 deletion strains by HphMX were constructed using the same method used to construct KanMX strains and selected by Hygromycin B.
To obtain amino acid residue substitution mutant strains, the particular target gene was first replaced with the URA3 gene and transformants were selected on uracil-free synthetic complete (SC) medium. Subsequently, URA3 was replaced with the amino acid residue substituted target gene and the required colonies were selected on 5-fluoroorotic acid (5-FOA) medium [43]. Strains with the substituted telomeric sequence were constructed using the same method used to construct amino acid residue substitution mutant strains.
For 3xFlag-SPT7 strain construction, first, the plasmid (URA3-SPT7 promoter-3xFlag-SPT7 ORF) was inserted in the SPT7 ORF, and transformants (SPT7 promoter-SPT7 ORF- URA3-SPT7 promoter-3xFlag-SPT7 ORF) were selected on uracil-free SC medium. Subsequently, URA3 was deleted by intrachromosomal homologous recombination of the SPT7 promoter and the 3xFlag-SPT7 strain was selected on 5-FOA medium. Other strains producing Flag-tagged proteins were constructed using the same methods.
G418 for KanMX selection and Hygromycin B for HphMX selection were added to YPD, uracil-free SC medium for URA3 selection, and 5-FOA medium for URA3 counterselection were used as needed.
Yeast cultures were grown on YPD medium at 30 °C.
The strains used in this study are listed in Table 1.

2.2. Plasmids

The plasmids bearing target genes fused to a Flag-tag encoding sequence were constructed by amplification of target genes with Gflex DNA polymerase (TaKaRa, Shiga, Japan) by PCR. The PCR products were purified using the GEX™ PCR DNA and Gel Purification Kits (GE Healthcare, Chicago, IL, USA) and inserted into pRS406 [44].
The Escherichia coli strain DH5α was used as a host for the plasmids, which were cultured in LB medium containing ampicillin at 37 °C.

2.3. RNA Extraction and Real-Time PCR Analysis

RNA analysis was performed as described previously [26]. The primers used for real-time PCR are listed in Table 2.

2.4. Microarray Analysis

Yeast cells were grown in YPD medium to mid-log phase and were collected by centrifugation. Total RNA was extracted from whole cell lysates using hot phenol and RNA (200 ng) was used for first strand cDNA synthesis using the GeneChip® 3′ IVT Express Kit (Affymetrix, Santa Clara, CA, USA). aRNA (7.5 μg) was hybridized for 16 hr at 45 °C in a GeneChip Yeast Genome 2.0 Array. GeneChips were washed and stained in a Affymetrix Fluidics Station 450, and then scanned using the GeneChip Scanner 3000 7G System. The data were analyzed using Microarray Suite version 5.0 (MAS 5.0) with Affymetrix default analysis settings.
The accession number of the microarray data is GSE220290.

2.5. Immunoblotting

Western blotting was performed as described previously [25]. Anti-Flag M2 (Sigma, Sofia, Bulgaria) was used at a dilution of 1/5000.

2.6. Chromatin Immunoprecipitation (ChIP)

ChIP was performed to determine the boundary position of the Chromatin III right telomere region. ChIP assays were performed as described previously [45,46]. Yeast cells were grown until reaching OD600 = 1.5 at 30 °C in YPD medium and collected by centrifugation at 4 °C for 5 min. Cells were resuspended in 200 mL cross-linking buffer (10 mM Hepes-KOH pH 7.5, 3 mM MgCl) + 1% HCHO. Rabbit polyclonal anti-Sir3 antibody (a gift from Dr. Kamakaka) was used for immunoprecipitation. The amount of immunoprecipitated DNA was measured using the Applied Biosystems SYBR Green RT-PCR system. Chromatin VI right telomere regions were used as controls. The primers used for ChIP are listed in Table 3.

3. Results

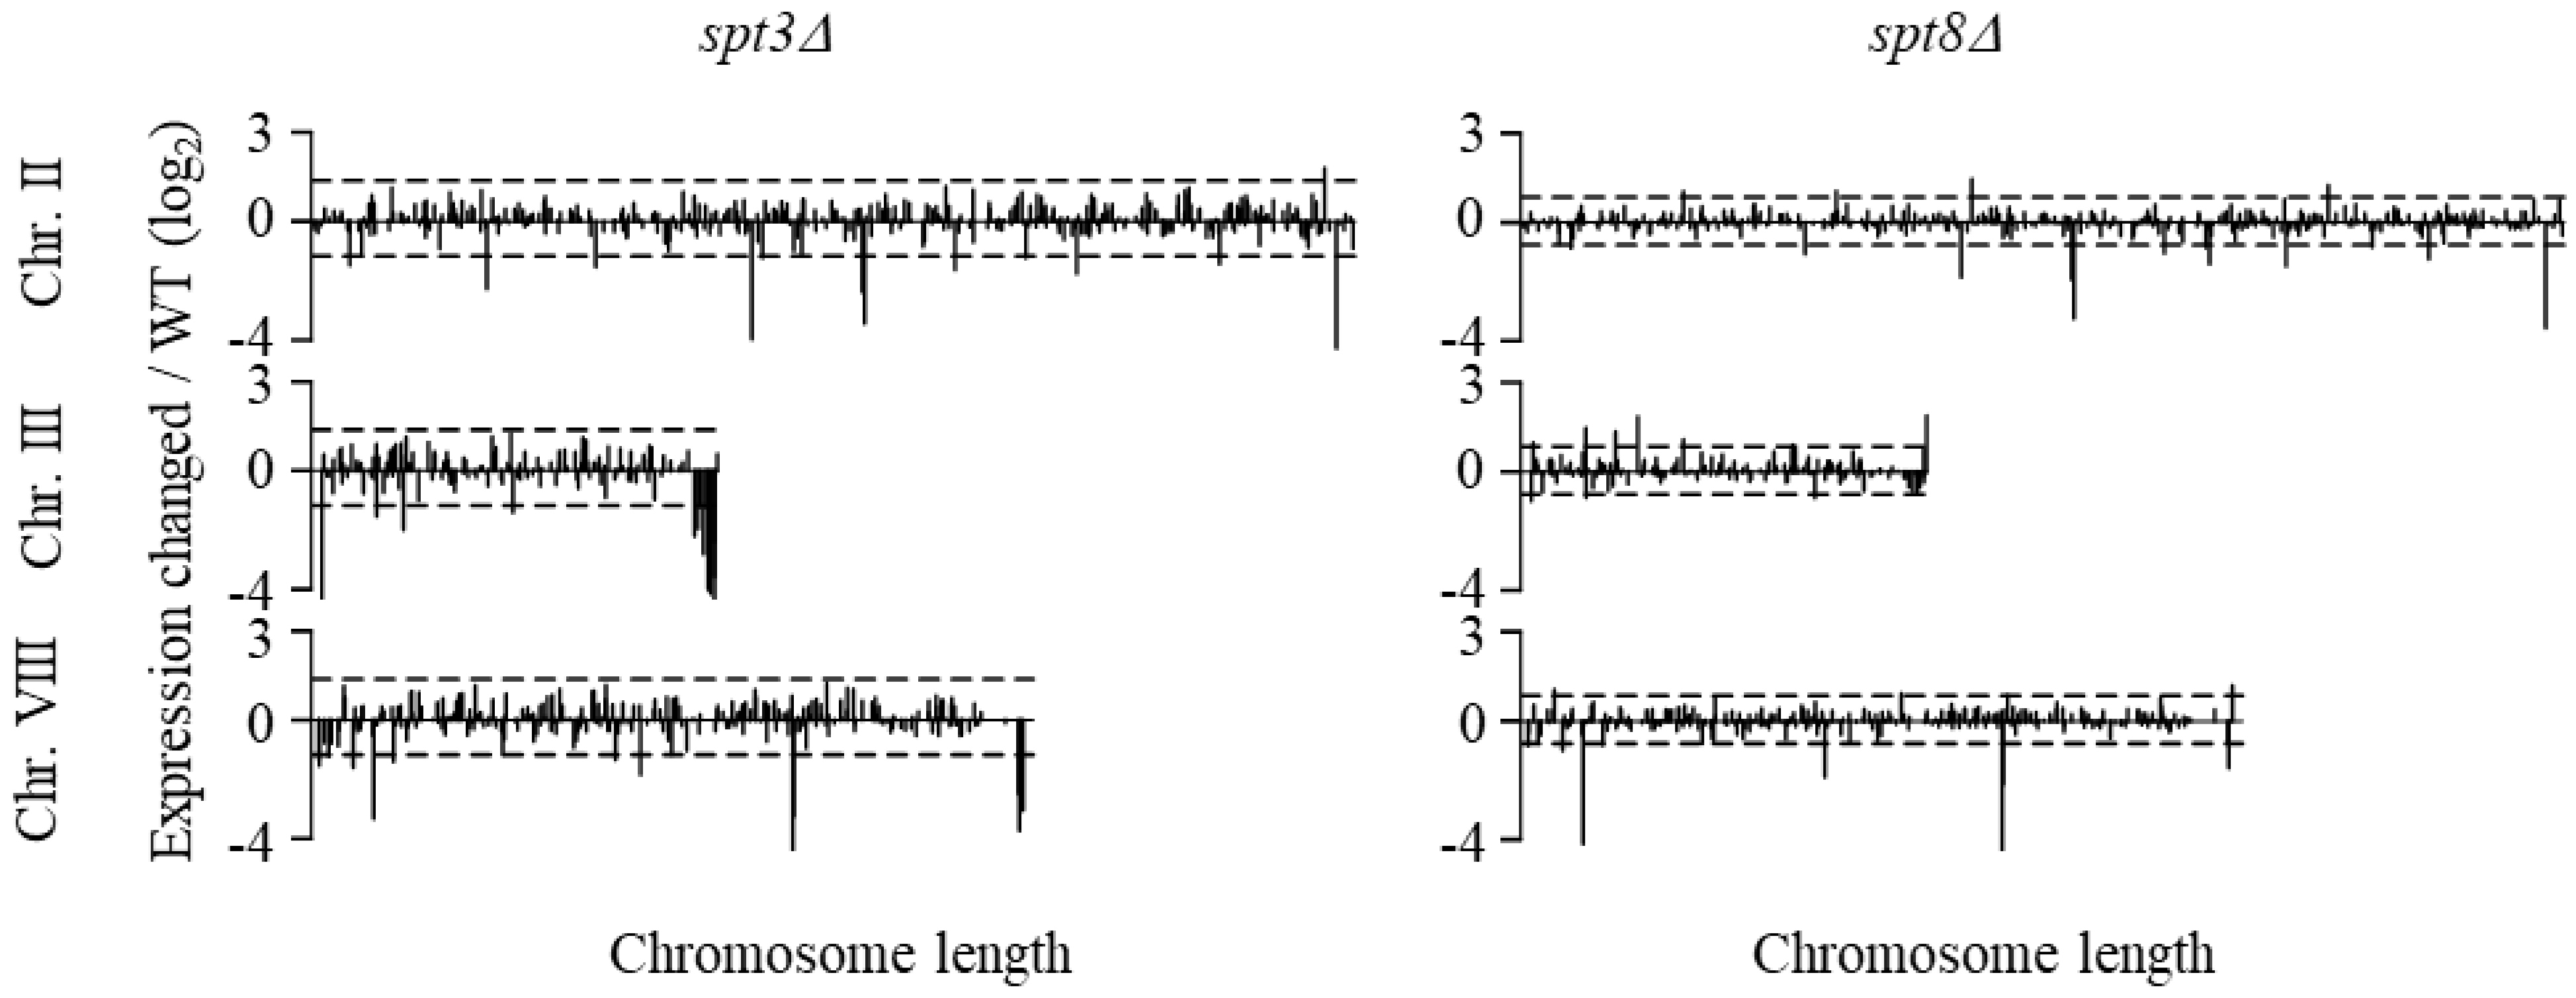
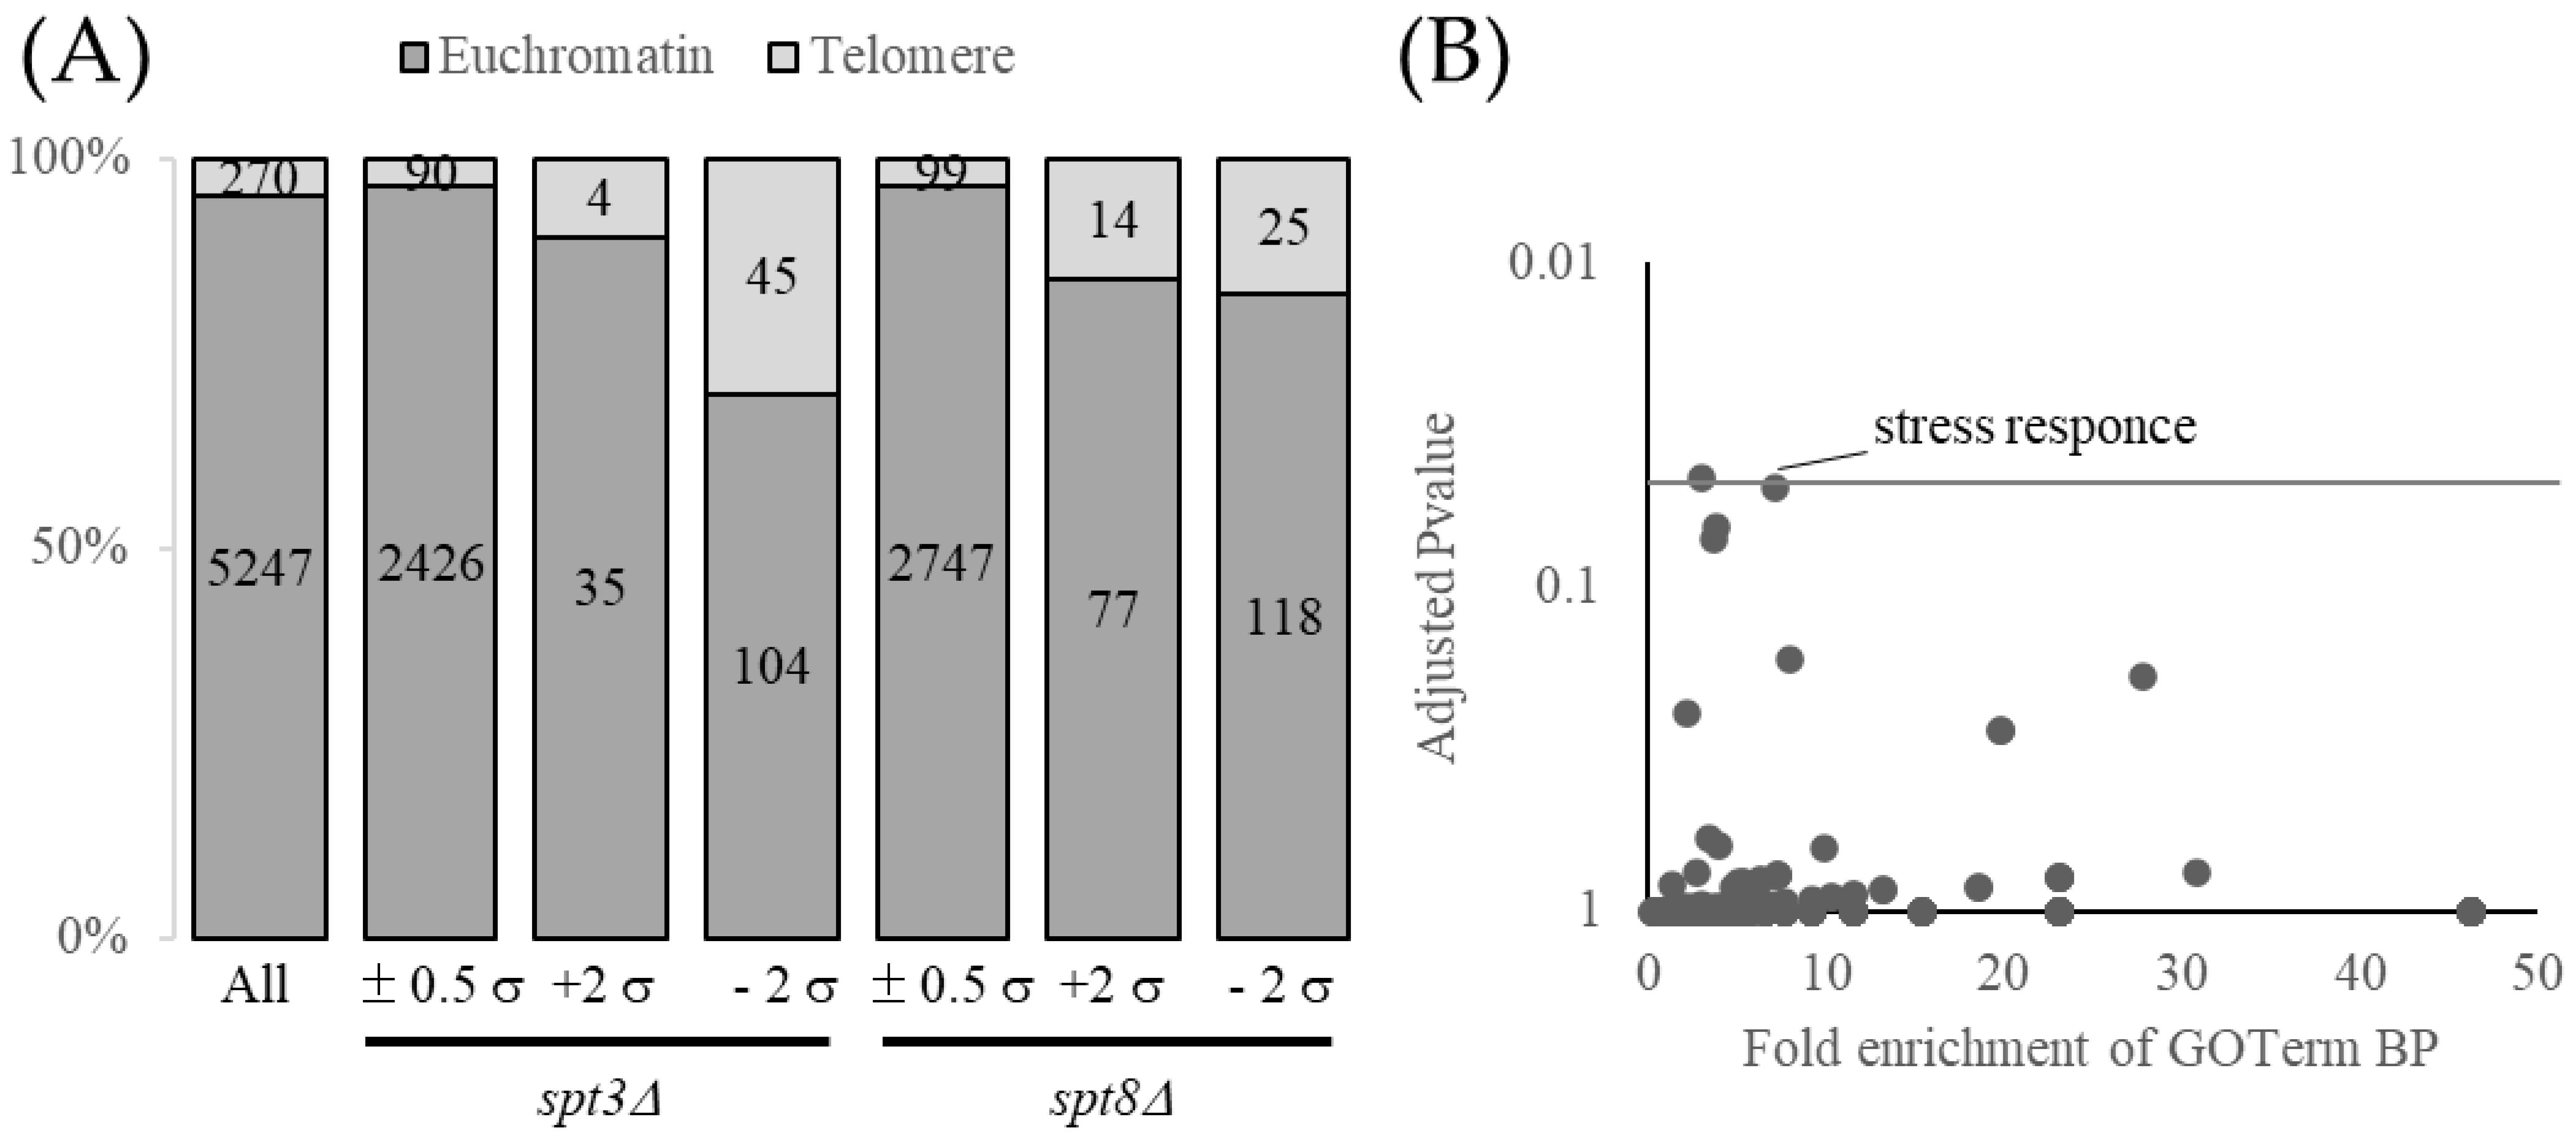
3.1. Spt3 and Spt8 Regulate Subtelomere Genes

In budding yeast, the process of silencing regulation is not clear, and it is not known which regions and genes are regulated by the interaction of the SAGA complex and TBP. Microarray analysis was performed on SPT3 deletion strain (spt3Δ) and SPT8 deletion strain (spt8Δ) to determine which regions on the chromosome are regulated by SAGA-TBP. The spt3Δ strain and spt8Δ strain showed significant changes in subtelomere silencing compared with the wild type strain (WT) (Figure 1). The genes showing differences in expression were almost identical between spt3Δ and spt8Δ strains, but overall, expression changes were greater in spt3Δ than in spt8Δ.
To confirm that Spt3 and Spt8 affect subtelomeric region dominance, we analyzed trends in genes with fluctuating expression levels, focusing on their distance from telomeres. We checked the position of the genes at the chromosomes and found that 270 genes of all yeast genes (5517 genes) were located within 30 Kb from telomeres (subtelomeres), and the frequency rate of subtelomere genes was approximately 5% (270/5517). If the effects of Spt3 and Spt8 occur randomly throughout the genome, we considered that the frequency rate of affected genes in subtelomeres is about 5% in spt3Δ or spt8Δ compared with WT. In the spt3Δ compared with WT, there were 149 genes downregulated by a less than two-fold standard deviation (−2σ, 0.46-fold), of which 46 genes were located in the subtelomere, and the frequency rate was approximately 30% (46/149) (Figure 2A, left; p = 3.9 × 10⁻⁹, Fisher’s test). Similarly, in the spt8Δ, 143 genes were downregulated by <−2σ (0.59-fold) and 25 genes were located in the subtelomere. From this, the frequency rate was approximately 17% (25/143) (Figure 2A, right; p = 1.1 × 10⁻³). Furthermore, gene ontology analysis of the downregulated genes in spt3Δ showed enrichment of genes involved in the stress response (Figure 2B). This is consistent with previous reports showing that, among TBP target genes, SAGA-dominated genes are involved in the stress response [32], and that many stress response genes are contained in subtelomeric region [47,48]. These results indicate that the genes regulated by the SAGA-TBP interaction are strongly enriched in subtelomeric regions.

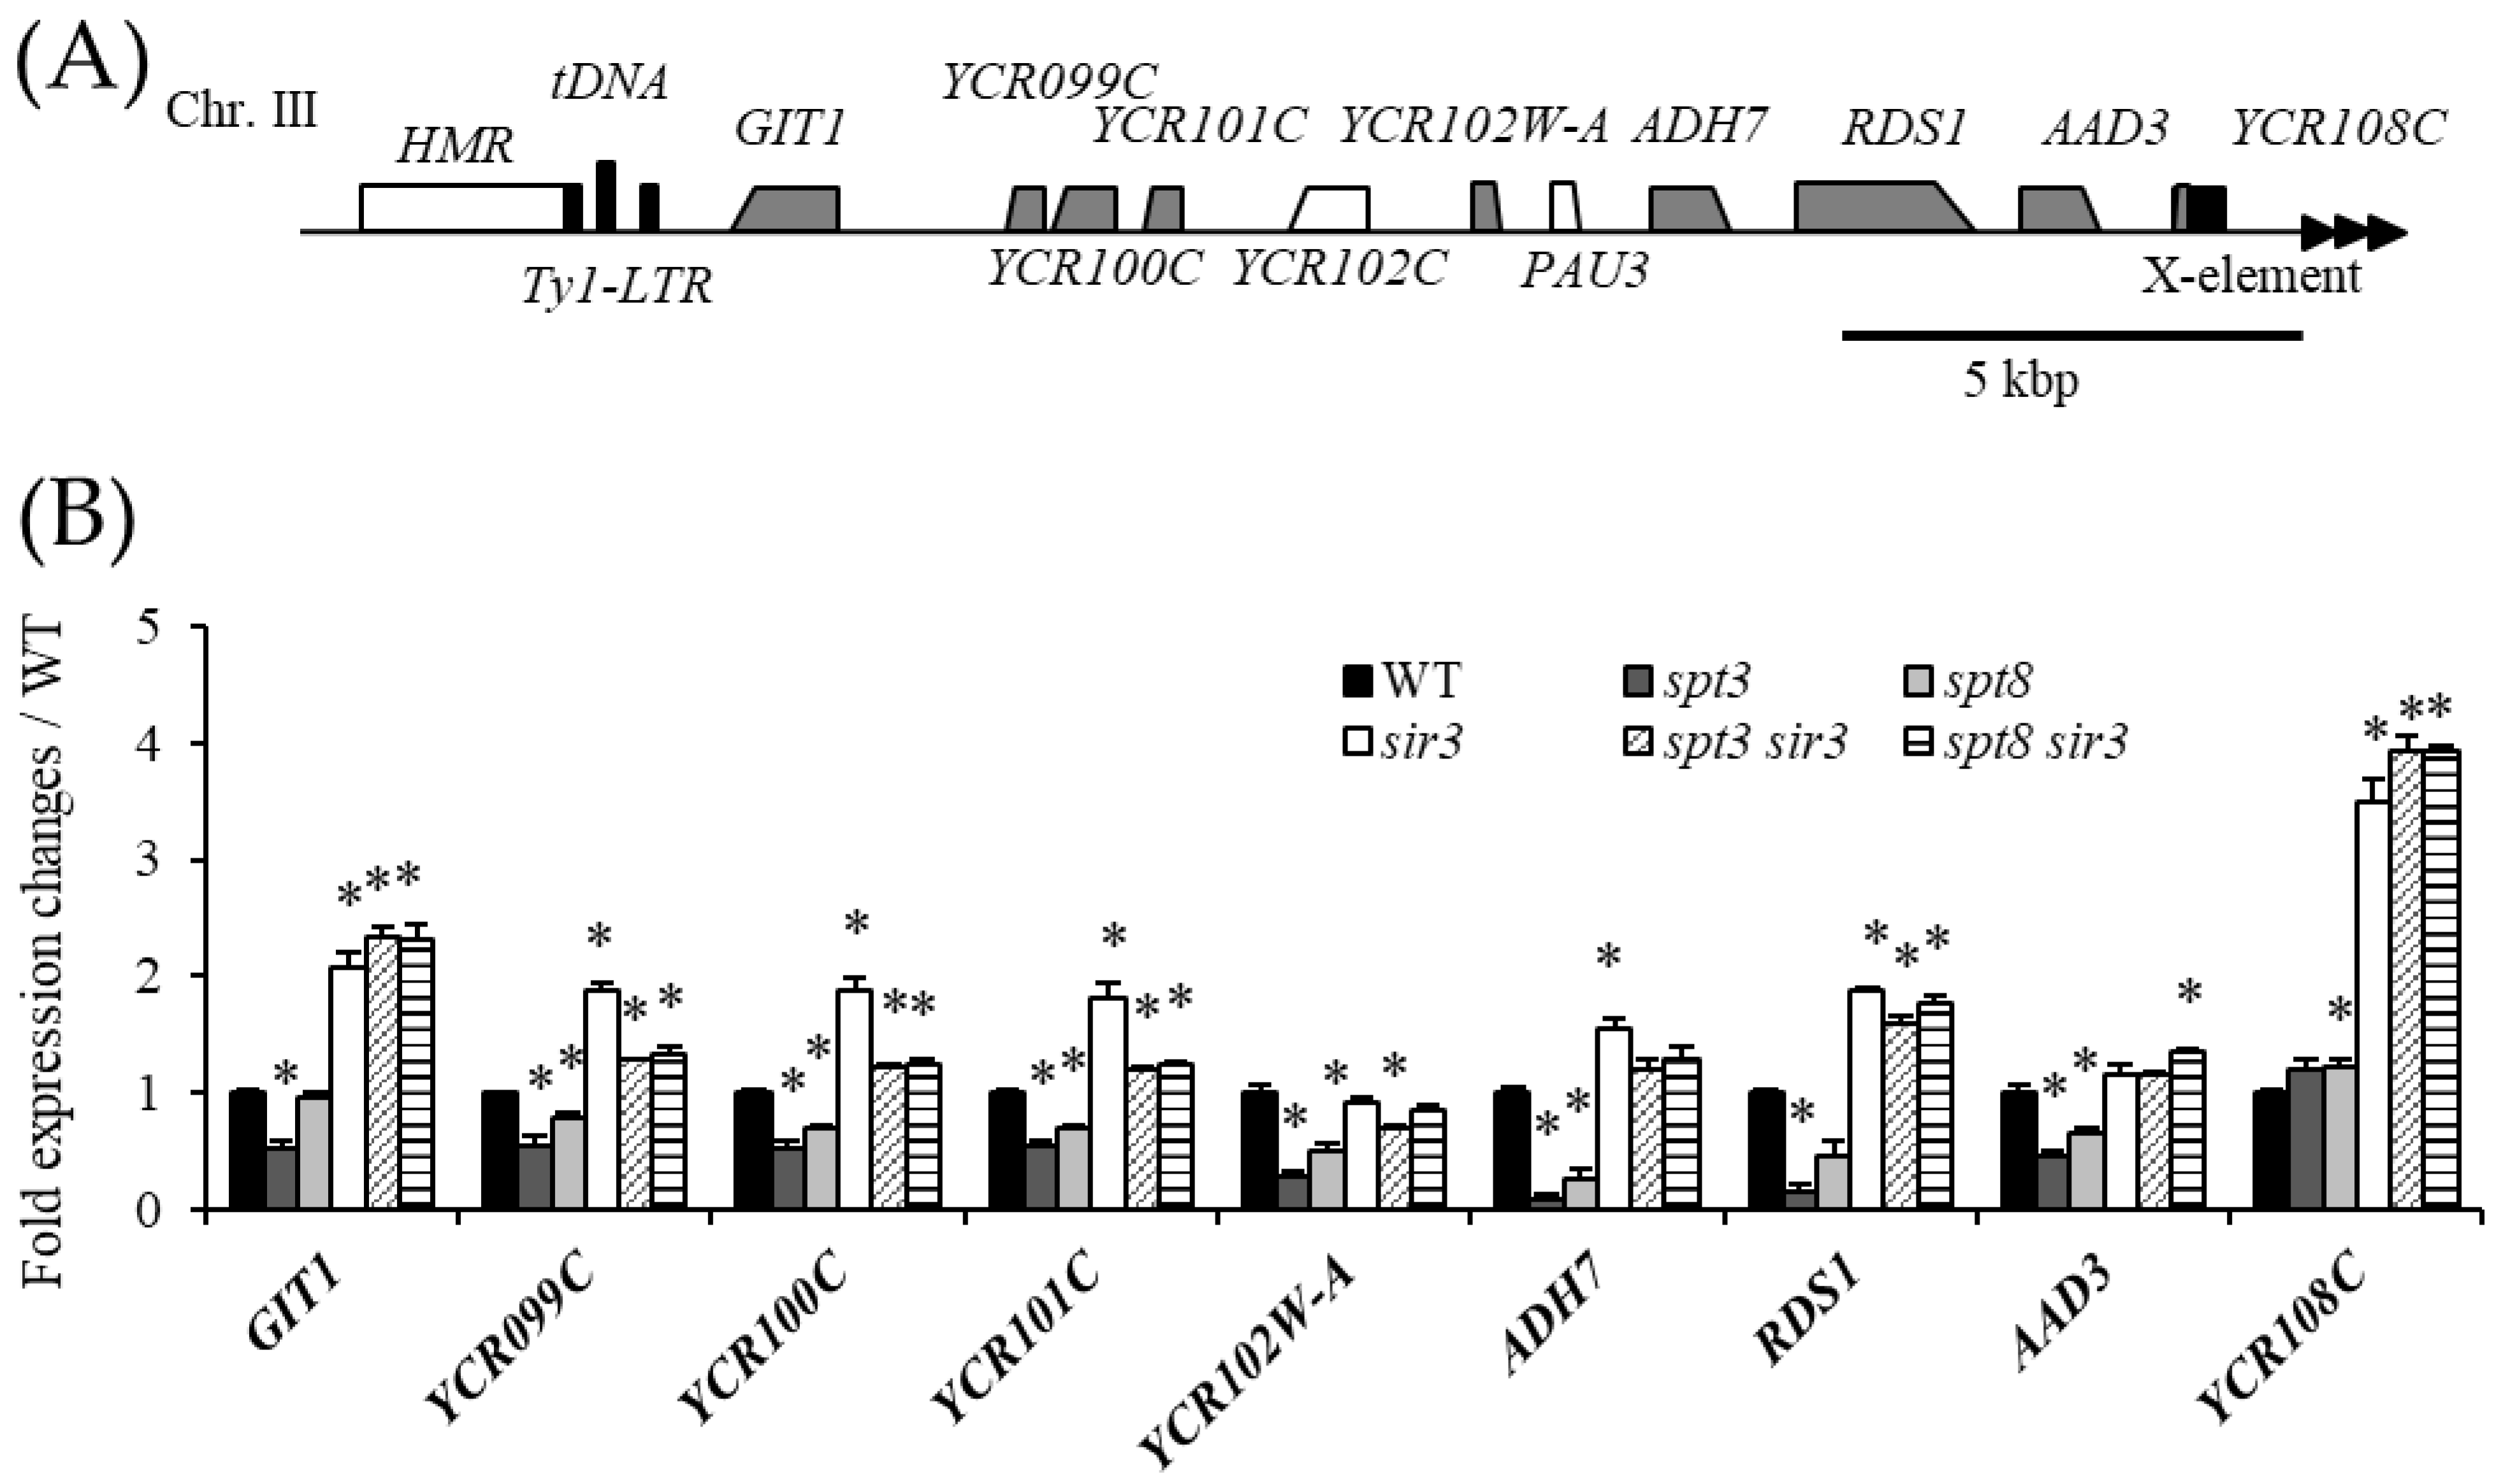
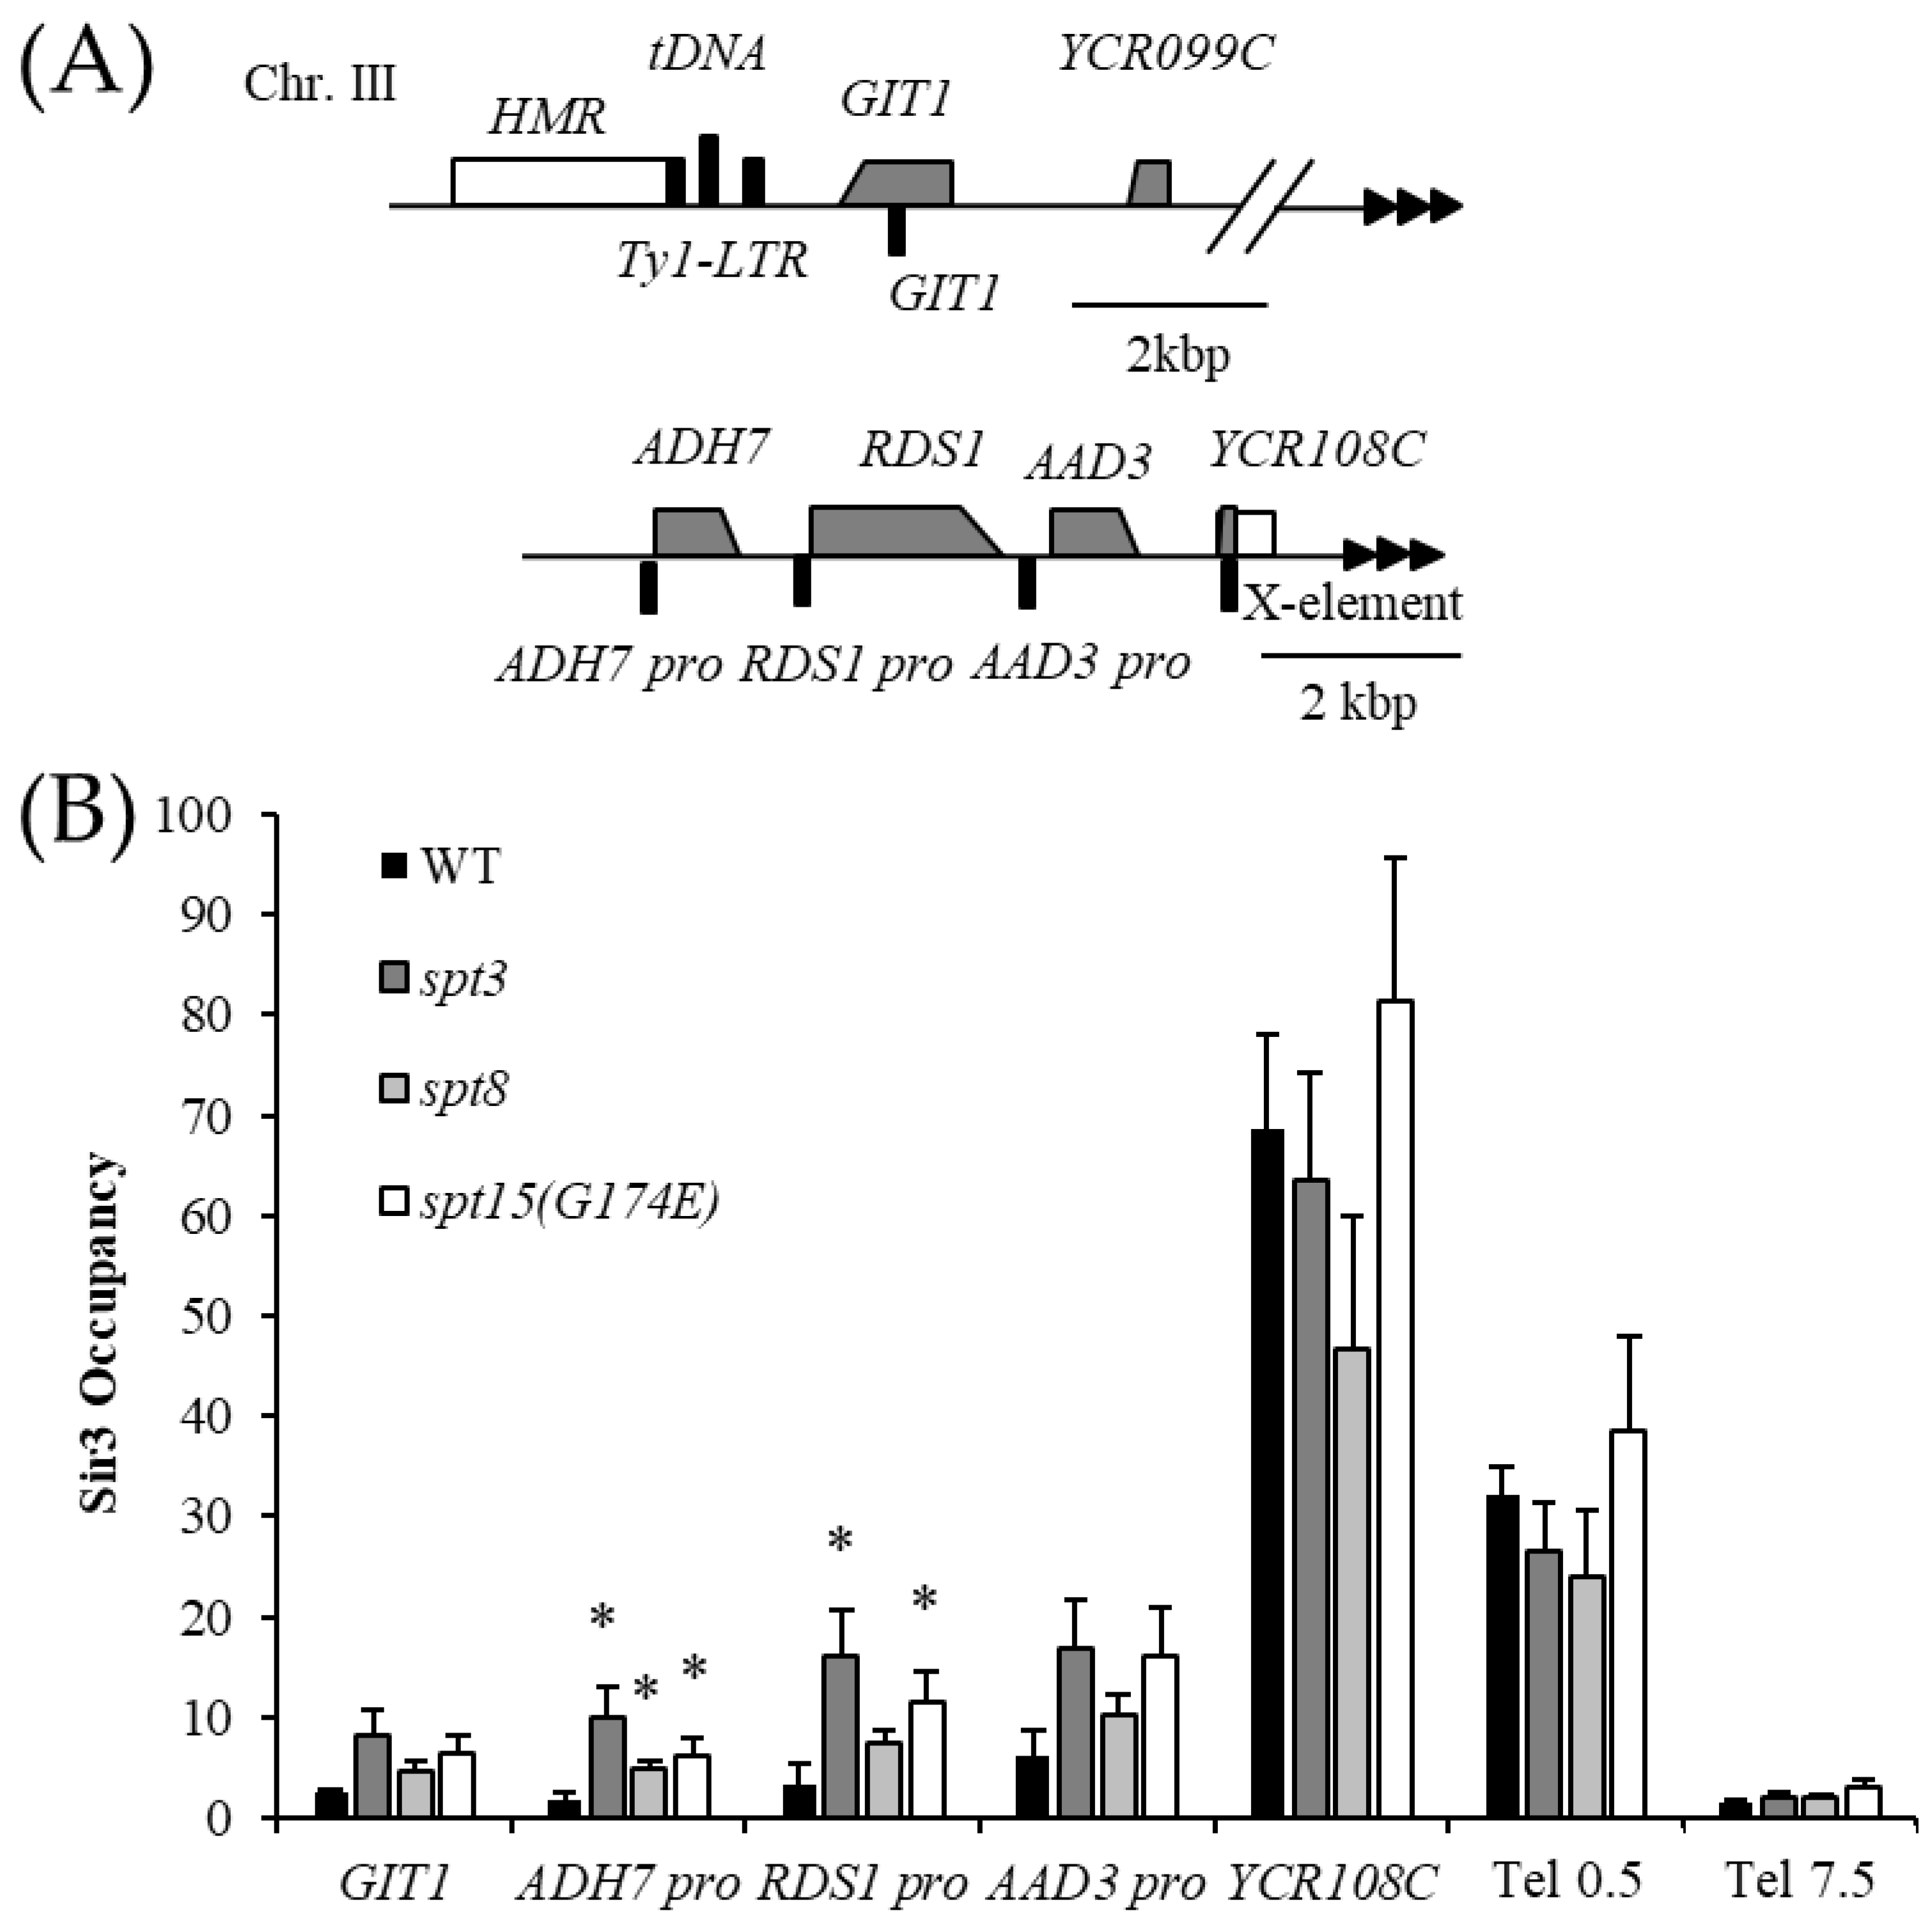
3.2. Spt3 and Spt8 Are Involved in the Subtelomere Silencing Boundary

We investigated boundary regions within 20 kb of the telomere using the one-sample t-test. In the spt3Δ strain, the expression of genes located at subtelomere regions of chromosome III right (IIIR), IV left (IVL), IVR, VIIIL, VIIIR, XVL, and XVIR were significantly downregulated. In particular, genes on the chromosome III right telomere region (Chr IIIR) showed significant variations in spt3Δ, which was also the case for the spt8Δ strain. Therefore, we focused on Chr IIIR.
To confirm the microarray results, we measured gene expression at the Chr IIIR by RT-qPCR (Figure 3). In Figure 3A, the genes analyzed are indicated in gray. Chr IIIR genes were mostly downregulated in the spt3Δ strain (Figure 3B). In the spt3Δ strain, expression of all genes was downregulated at the Chr IIIR except for YCR108C. Among them, the expression levels of AAD3, RDS1, ADH7, and YCR102W-A were less than 50% of the WT. Similar results were observed for spt8Δ, but the effect was not as great as in spt3Δ. There were no transcriptional changes in YCR108C expression in both the spt3Δ strain and spt8Δ strain. Because YCR108C may always be silenced by Sir2/3/4 proteins or is intrinsically not transcribed, YCR108C expression showed no changes.
To determine whether this wide range of repression was attributed to SAGA complex regulation or to silencing spread, SIR3 was deleted from the spt3Δ or spt8Δ strains (Figure 3B). The expression of Chr IIIR genes in double mutant strains was comparable to that in the sir3Δ strain. This result indicated that repression of Chr IIIR genes was caused by silencing spread rather than SAGA complex regulation.

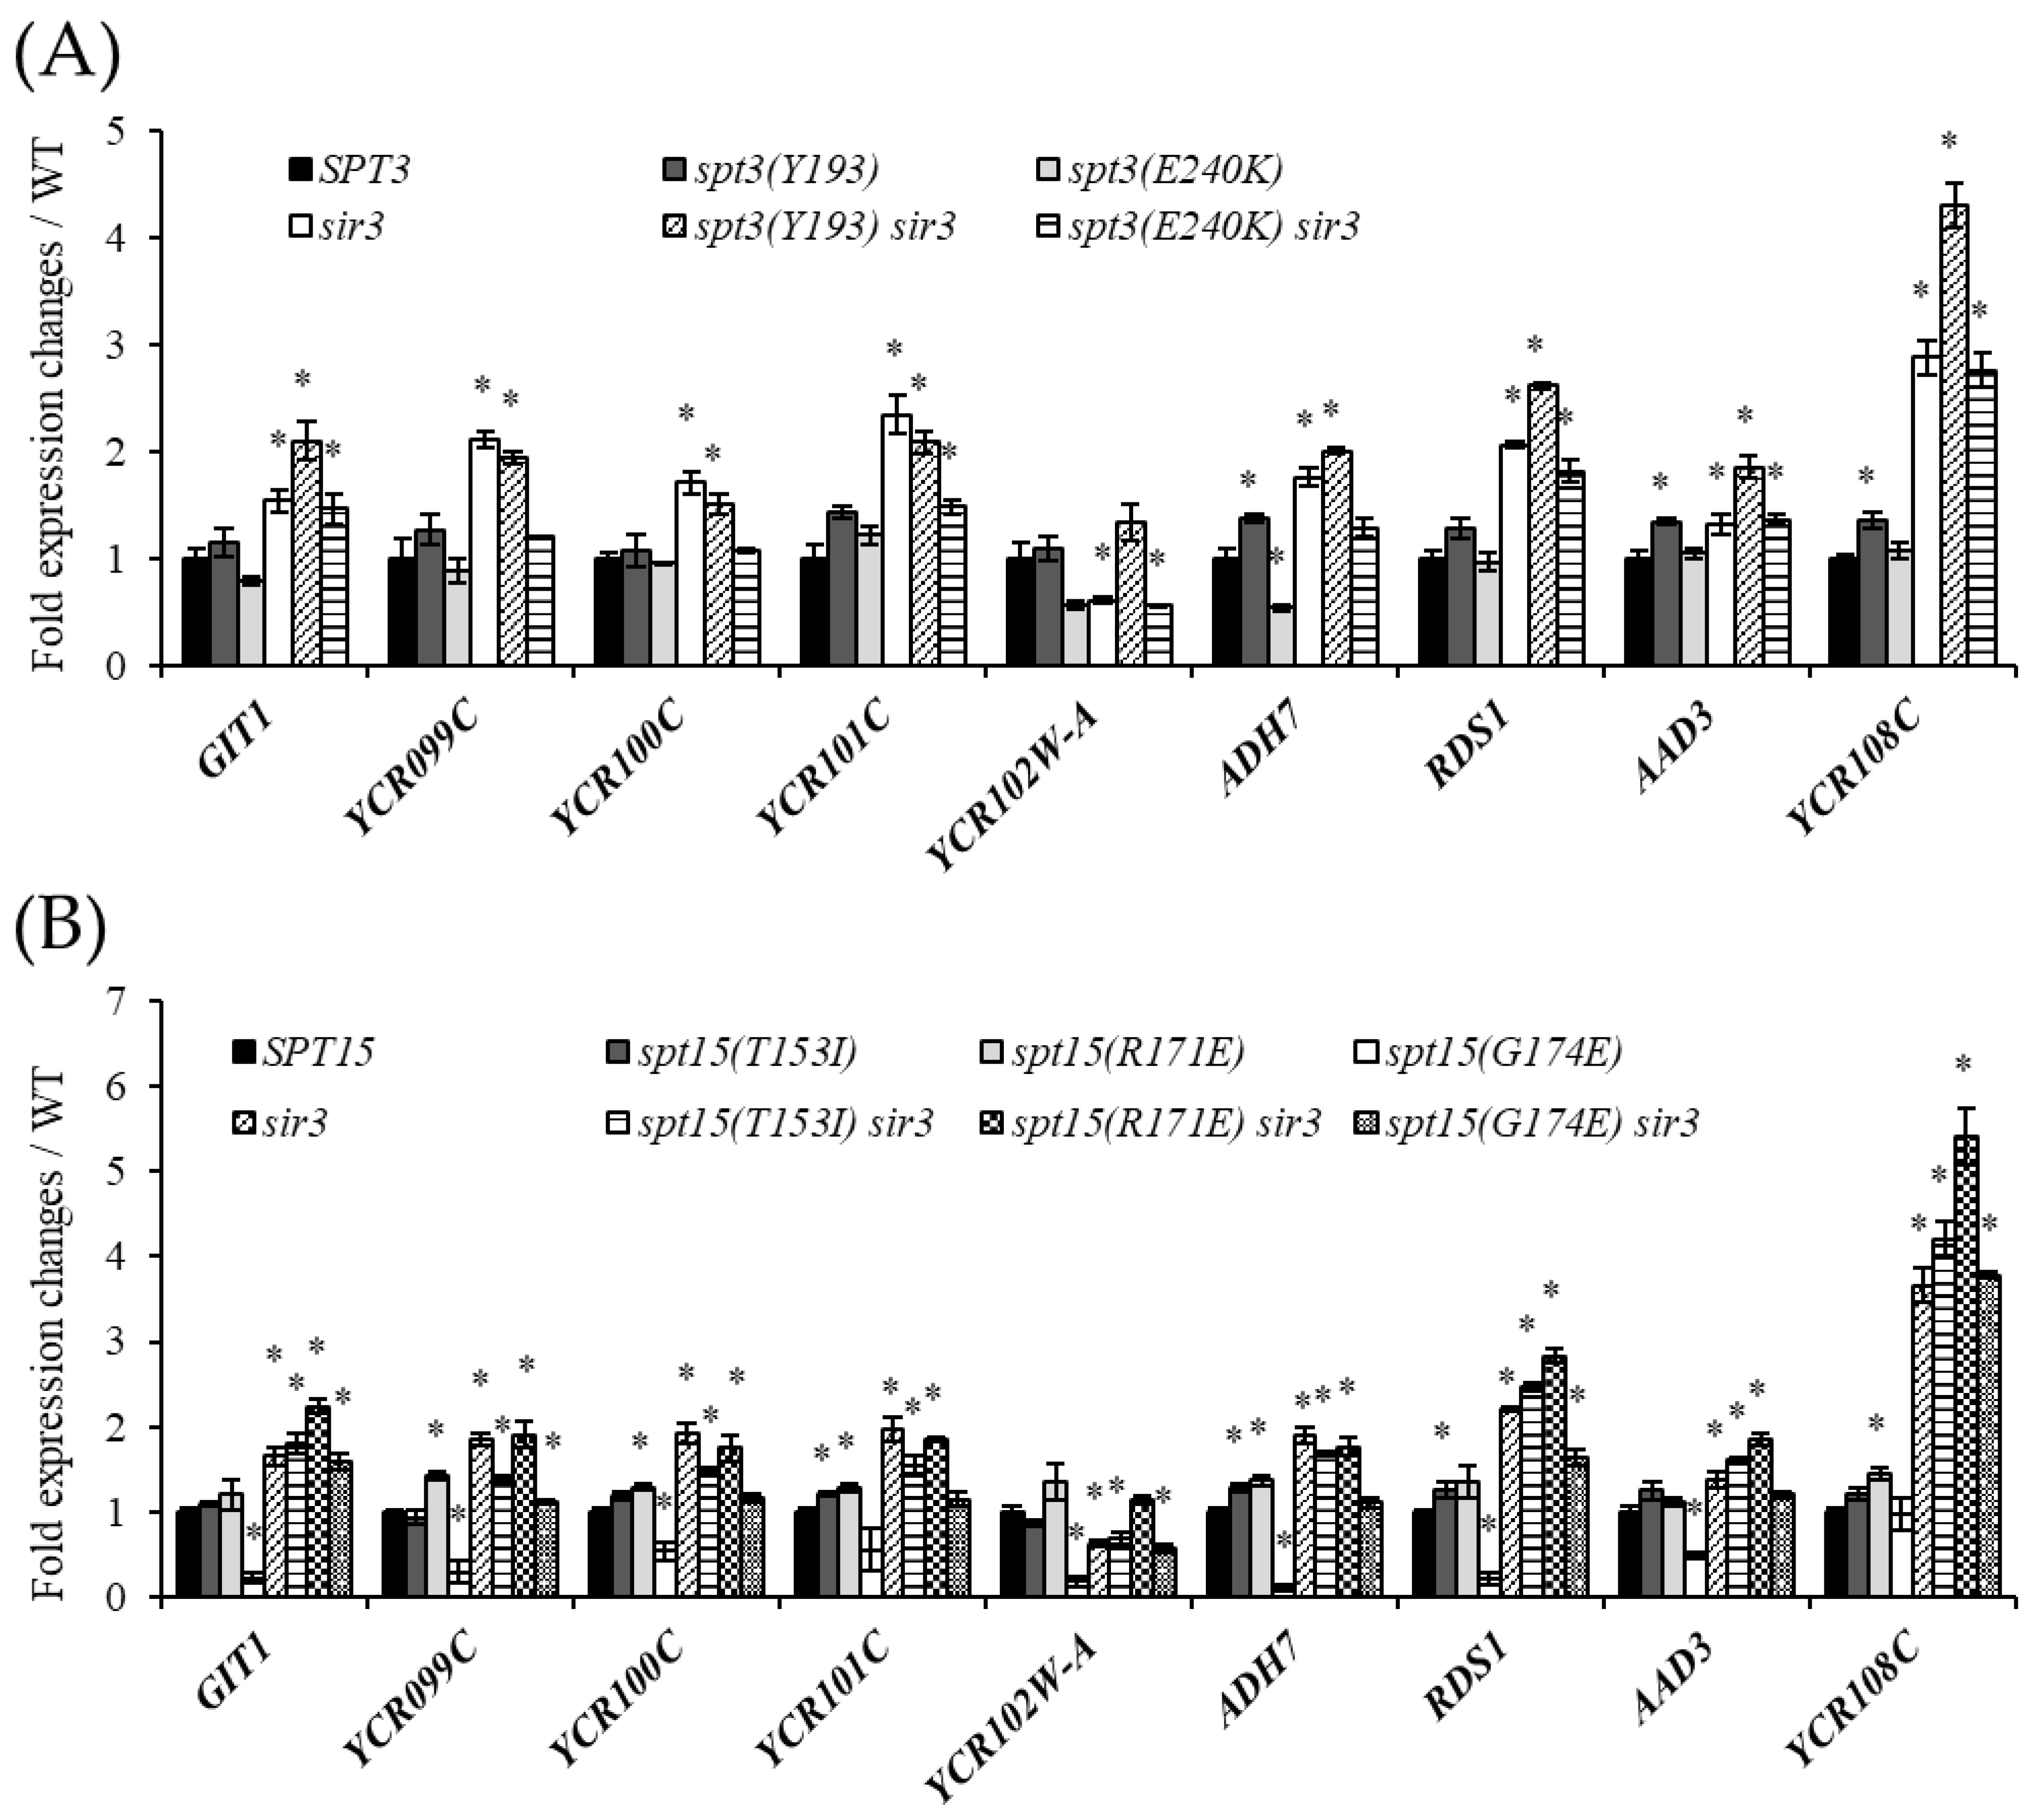
3.3. Interaction between Spt3 and TBPs Is Important for Telomere Silencing Boundary Formation

The results suggested that Spt3 and Spt8 contributed to the formation of the Chr IIIR silencing boundary. However, the specific function required for boundary formation remained unclear. It is remarkable that the patterns of gene expression in spt3Δ and spt8Δ strains were distinctly different between YCR108C, which is located near the telomere, and AAD3, which is located right next to YCR108C (Figure 3B).
Therefore, we hypothesized that a DNA sequence-dependent silencing boundary exists between YCR108C and AAD3. To test this hypothesis, we generated a yeast strain in which the region between AAD3 and YCR108C was replaced by an ampicillin resistance (ampR) gene sequence, which is normally not present in yeast. Considering the possibility that the ARS319 sequence between AAD3 and YCR108C may affect boundary formation, we generated the Amp-ARS319 strain, which replaced the region from AAD3 to ARS319, and the Amp-YCR108C strain, which replaced the region from AAD3 to YCR108C (Figure 4A), and performed RT-qPCR at the Chr IIIR. Contrary to expectations, insertion of the ampR gene sequence into the intergenic region (Amp-ARS319 and Amp-YCR108C) did not affect gene expression within the Chr IIIR, indicating that the regulation of the silencing region by boundary formation is independent of the DNA sequence between AAD3 and YCR108C at Chr IIIR (Figure 4B).
Based on these results and the known interaction between Spt3/8 and TBP [29,30,31], we predicted that transcription of the genes at Chr IIIR would be activated by SAGA-TBP, which would suppress the spread of the silencing region from the telomere. To elucidate the effects of the SAGA-TBP interaction on transcriptional regulation at Chr IIIR, we first focused on Spt3, a TBP binding partner within the SAGA complex. The mutants of Spt8, another TBP interaction partner that is a component of SAGA complex, were not used because spt8Δ had a weaker effect on gene expression changes than spt3Δ.
We investigated the effect of two previously identified mutations in the SPT3 gene that affect the interaction of Spt3 with TBP on gene transcript levels at Chr IIIR. The first Spt3 (Y193C) mutant strain (spt3(Y193C)) produces Spt3 with a Y193C amino acid residue substitution that attenuates the interaction with TBP. Conversely, the second Spt3 (E240K) mutant strain (spt3(E240K)) has Spt3 with an E240K substitution resulting in a stronger interaction with TBP and reduced TBP recruitment to the TATA box [16,28,49]. Both of these substitutions affect the SAGA-TBP interaction and, like spt3Δ, are assumed to disrupt the boundary and repress gene expression at Chr IIIR. Contrary to expectations, spt3(Y193C) did not show a decrease in gene expression (Figure 5A). In addition, deletion of the SIR3 gene in the spt3(Y193C) strain (spt3(Y193C) sir3Δ) resulted in slightly higher expression levels of some genes than in the sir3Δ strain. Transcription of some genes was downregulated in spt3(E240K), as well as gene transcription levels in the spt3(E240K) sir3Δ, in contrast to spt3(Y193C). These results indicated that in some genes at Chr IIIR, the effects of Y193C and the E240K substitutions in Spt3 were dependent on the presence of Sir3 protein.
Next, we analyzed the effects of TBP mutations on the transcription level of genes at Chr IIIR. Three TBP (Spt15) amino acid residue substitution mutants, T153I, R171E, and G174E, have been reported to weaken TBP recruitment to the TATA box, interaction with Spt8, and interaction with Spt3 [28,35,50,51,52]. We used TBP mutant strains (spt15(T153I), spt15(R171E), spt15 (G174E)) and analyzed the transcription level of genes at Chr IIIR to determine whether the recruitment of TBP by SAGA or the transfer of TBP to the TATA box via Spt3 or Spt8 affects boundary formation. No transcriptional repression was observed for genes at Chr IIIR in the spt15(T153I) strain and spt15(R171E) strain, showing a similar trend to WT. The spt15(T153I) sir3Δ strain and spt15(R171E) sir3Δ strain also showed similar results to the sir3Δ, so TBP recruitment and interaction with Spt8 did not critical affect boundary formation at Chr IIIR. However, Chr IIIR genes were significantly repressed in the spt15 (G174E) mutant. Furthermore, we confirmed that gene expression at Chr IIIR in spt15(G174E) was restored by sir3Δ (spt15(G174E) sir3Δ). These results were similar to those obtained using the spt3Δ strain. This indicated that proper interaction between TBPs and Spt3 is critical for boundary formation.

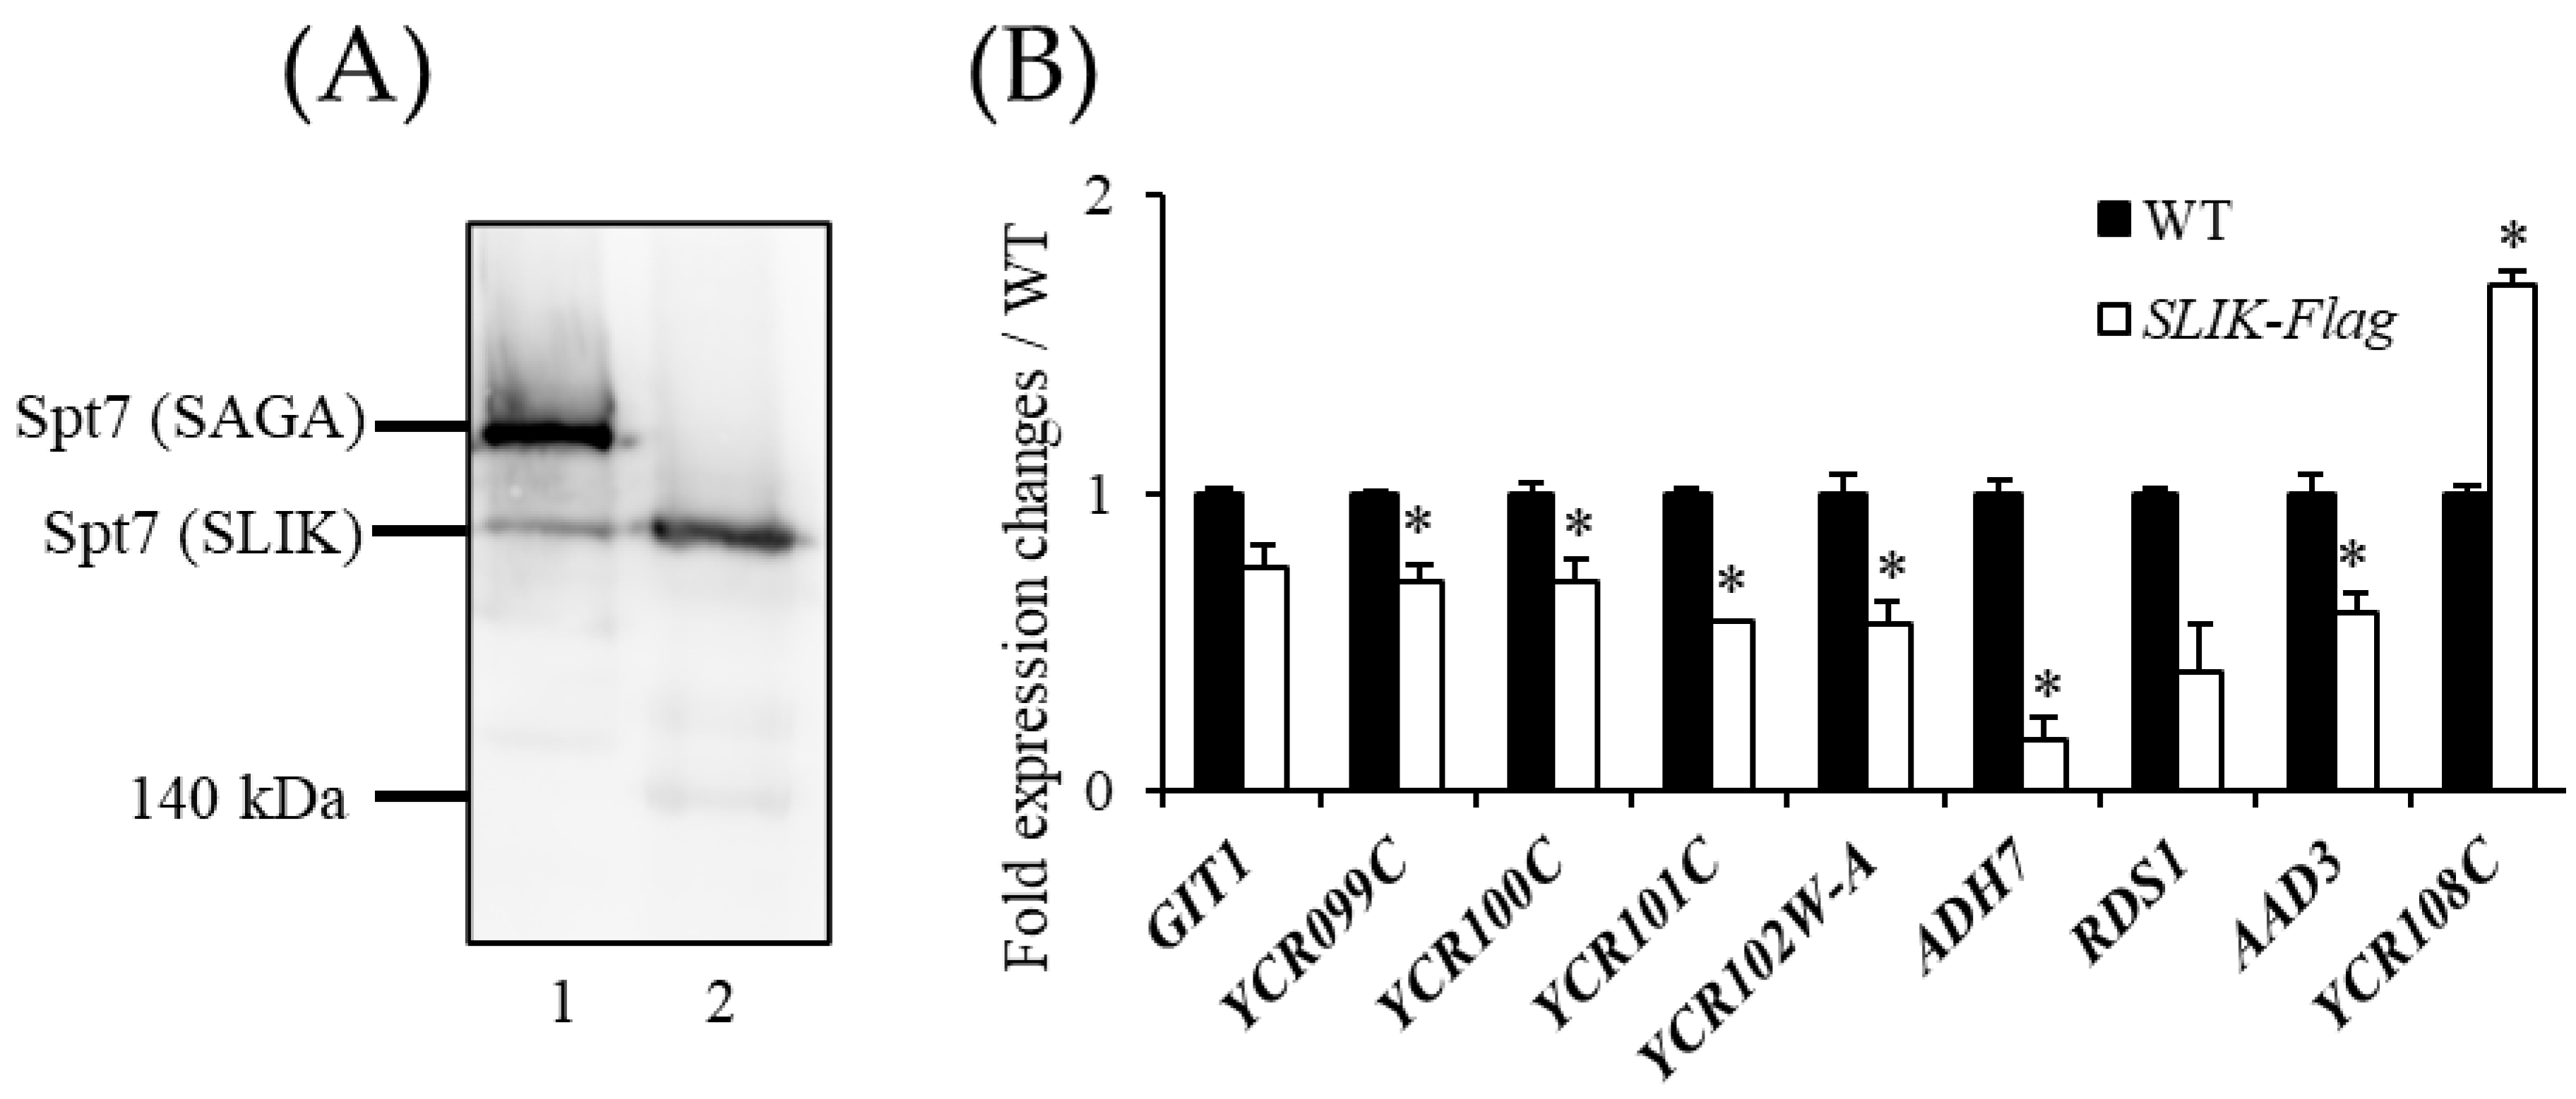
3.4. The SAGA Complex Is Required for Boundary Formation

The results described above suggested that interaction between the SAGA complex and TBPs is important for Chr IIIR boundary formation. The SLIK complex, which is similar to the SAGA complex, does not contain Spt8, whereas it does contain a truncated form of Spt7 (C-terminal truncated resulting in a protein of 1–1141 amino acid residues). However, it is unclear when SAGA and SLIK are used differently in cells. Therefore, we constructed a yeast strain in which only SLIK complexes were present and measured transcriptional expression of Chr IIIR genes. To confirm presence of truncated Spt7 (SLIK-specific), a 3xFlag-tag was added to the C-terminus (SLIK-Flag strain). We extracted and fractionated proteins from the SLIK-Flag strain and the strain expressing Spt7 with a 3xFlag-tag at the C-terminus (Flag-Spt7 strain) as a control for forming the SAGA and SLIK complexes, and detected bands of the SAGA and SLIK complexes by Western blotting using an anti-Flag antibody (Figure 6A). A band was detected in the SLIK-Flag strain at the same position as the second band of Flag-Spt7 (SLIK complex), confirming the formation of the SLIK complex in the SLIK-Flag strain. Assessment of the transcriptional expression of Chr IIIR genes with the SLIK strain (Figure 6B) showed that AAD3, RDS1, ADH7, YCR102W-A, and YCR101C were downregulated to approximately 20–60%, and YCR100C, YCR099C, and GIT1 expression levels were decreased to approximately 70%. This expression pattern was similar to that of spt8Δ strains (Figure 3B). The above results suggested that Spt3 functions in the boundary formation by SAGA-TBP at Chr IIIR, and Spt8 is predicted to assist in the interaction between Spt3 and TBP by maintaining the structure of SAGA.

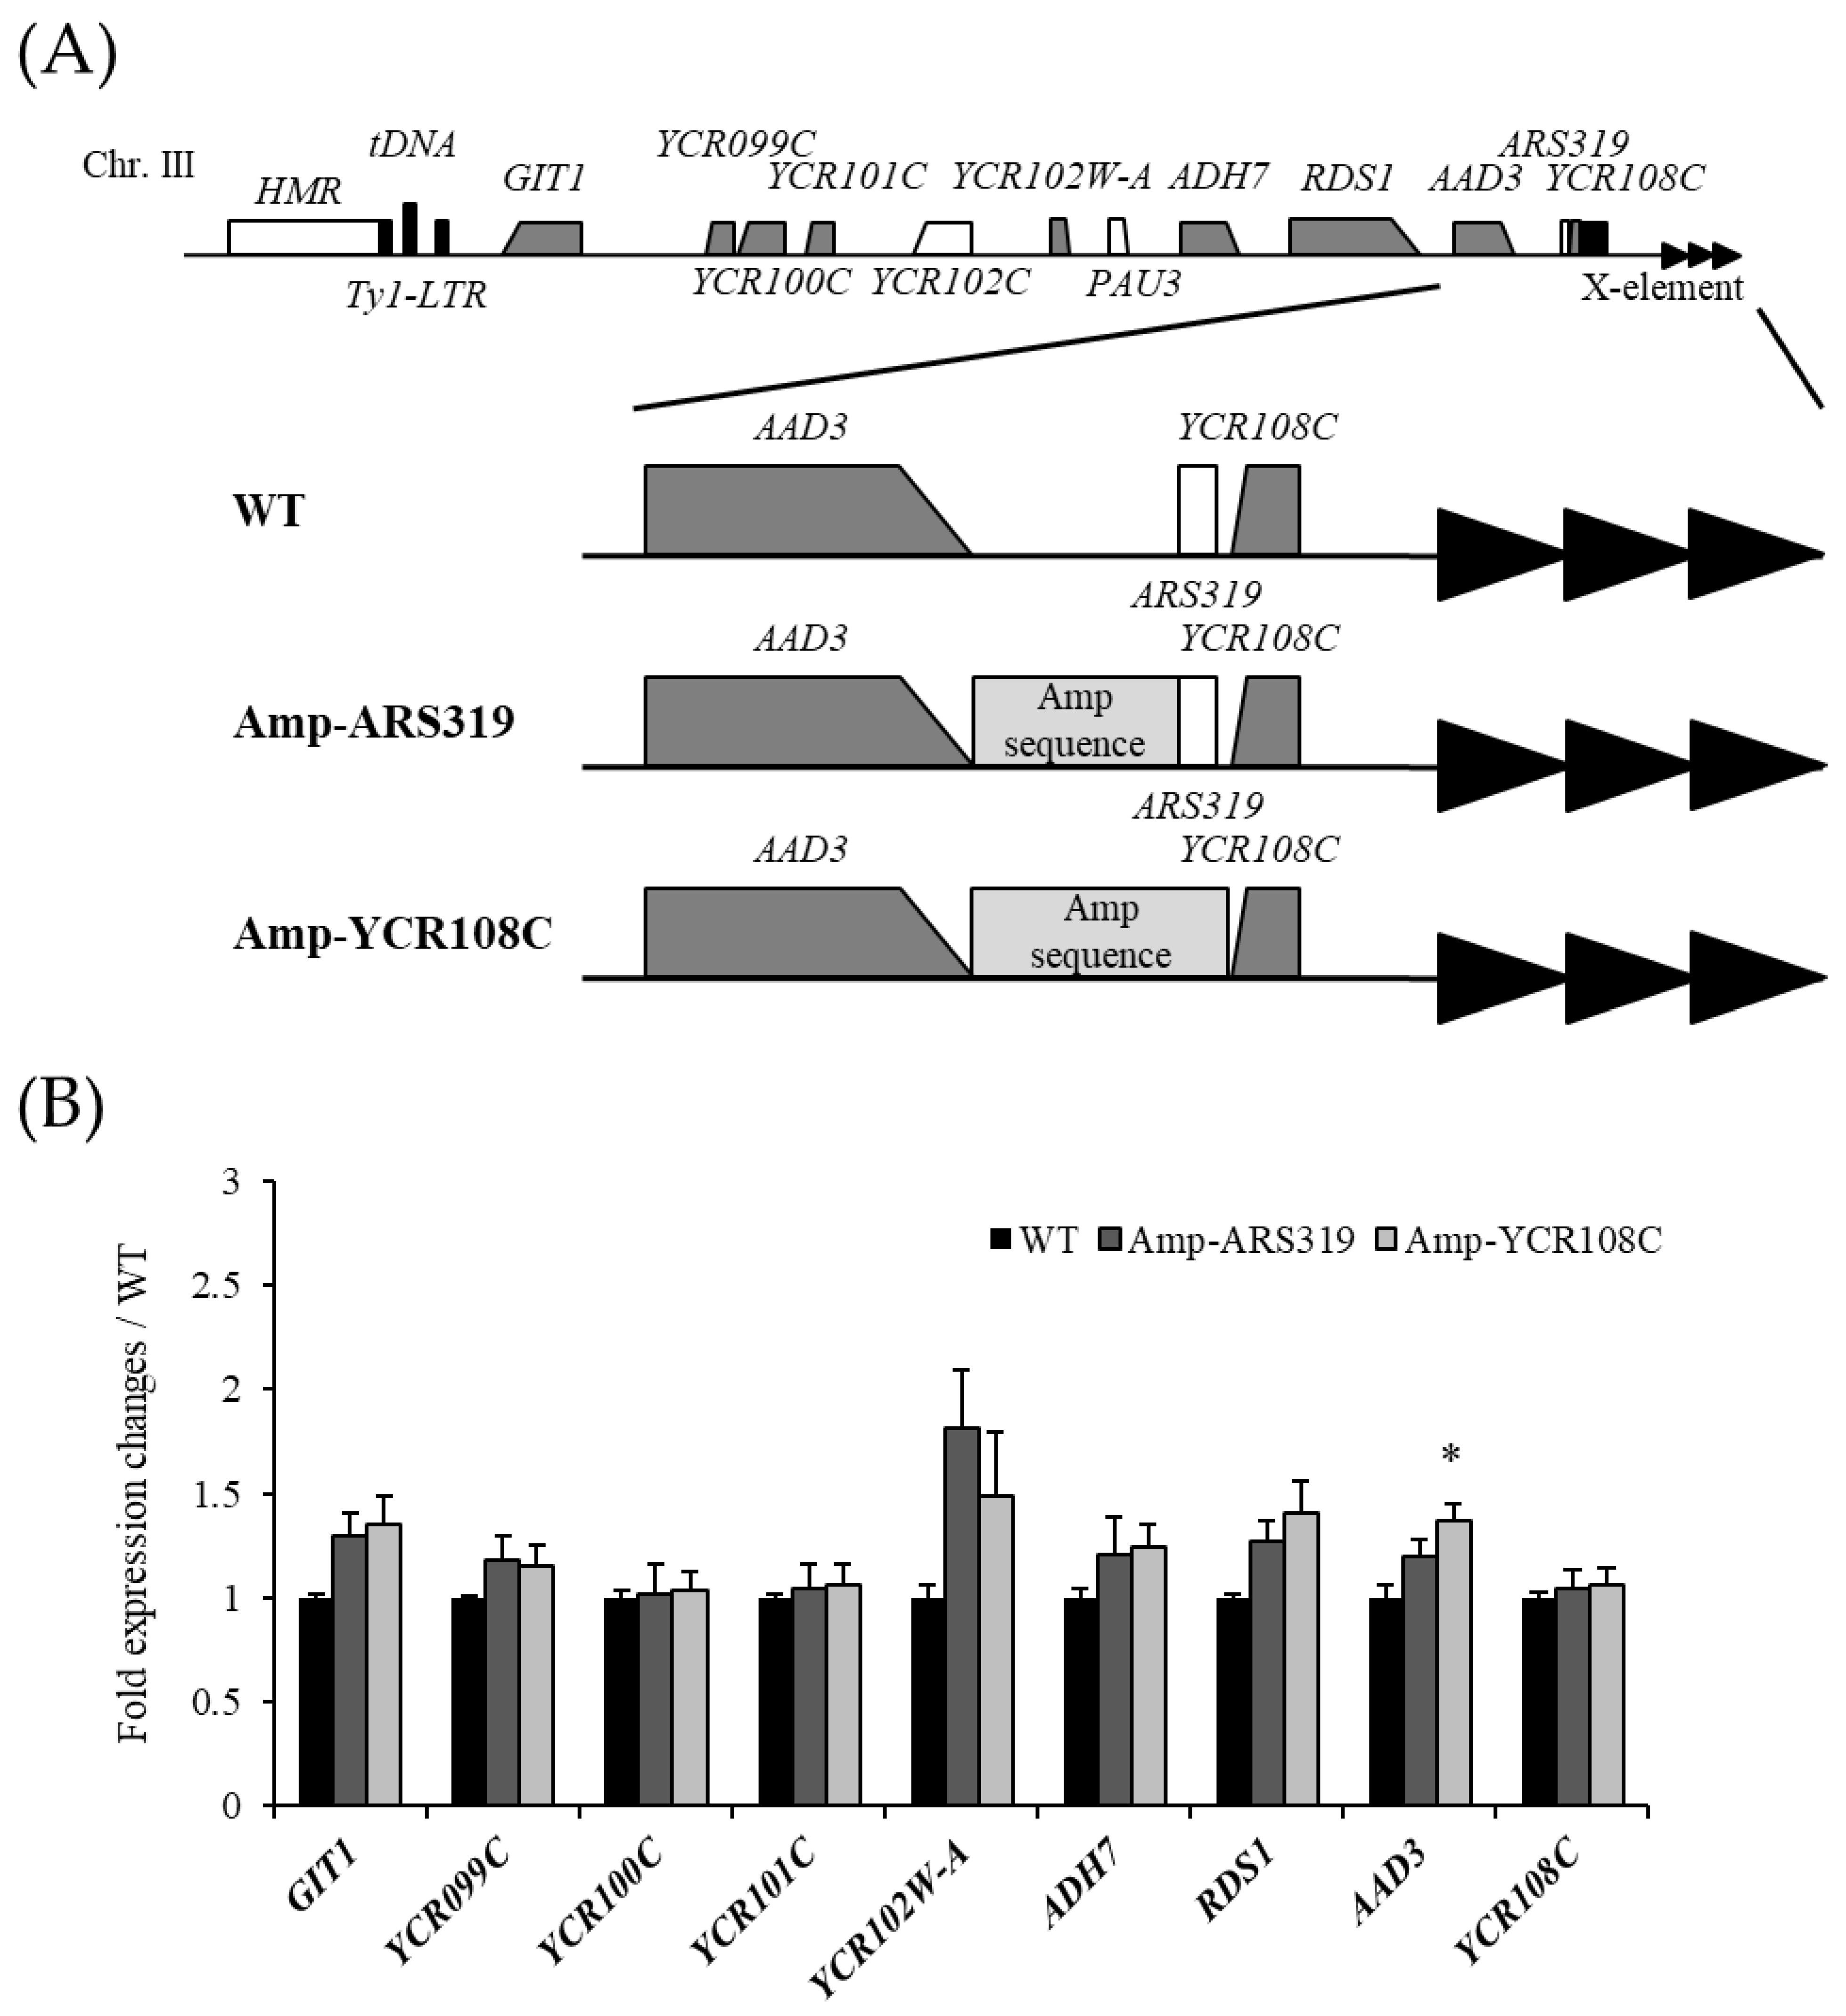
3.5. Spt3 and TBP Mutations Lead to the Spread of the Silencing Region

The results suggested spreading of the silencing region at Chr IIIR in spt3, spt8, and spt15 mutants. To determine whether the transcriptional repression was attributed to silencing region spread by Sir2/3/4 complex, we performed chromatin immunoprecipitation (ChIP) analysis targeting Sir3 in the spt3Δ, spt8Δ, and spt15(G174E) strains at Chr IIIR (Figure 7A). Tel 0.5 and Tel 7.5 served as positive and negative controls, respectively. In all strains, Sir3 level was not significantly changed at YCR108C, which is the intrinsically silenced gene. The Sir3 level was significantly increased at the RDS1 and ADH7 promoter regions (Figure 7B). This results strongly suggested that Spt3 and Spt8 are involved in the formation of the Chr IIIR silencing boundary.

4. Discussion

In this study, we focused on the SAGA complex as one of the boundary-forming factors involved in the silencing of Chr IIIR by analyzing the contribution of its components, Spt3 and Spt8, to boundary formation. We found that boundary formation at Chr IIIR was regulated by the interaction between TBP and Spt3 and/or Spt8, which are components of the SAGA complex. However, although our results suggested that the boundary formed by SAGA-TBP was located between AAD3 and YCR108C (Figure 3B), replacing the sequence in this intergenic region with an ampR sequence did not affect the transcription of genes at Chr IIIR, suggesting that boundary formation at Chr IIIR is not dependent on the DNA sequence between AAD3 and YCR108C (Figure 4B). However, gene expression levels throughout Chr IIIR were decreased not only in the spt3Δ and the spt8Δ, which are involved in the interaction with TBP, which is important for transcription, but also in the spt15(G174E) mutant strain, which has a weakened interaction with Spt3, and the SLIK-Flag strain, which lacks Spt8 (Figure 3B, Figure 5B and Figure 6B). We attribute this to a decrease in the amount of TBP recruited to the TATA box, which resulted in decreased transcription and failure of TBP to function as a boundary. In fact, transcription was restored in sir3Δ of these mutants. We propose that SAGA acts at ADH7 to create a transcription-friendly environment for the two adjacent telomere-proximal genes RDS1 and AAD3. This “synergy in transcriptional activity” creates a boundary at AAD3 that blocks the spread of the silencing region from the telomere. Indeed, among the genes in this region, ADH7 has been reported to have a TATA sequence that is more SAGA-dominant than TFIID [53,54], and in our experiments, the transcription of ADH7 was reduced in each mutant strain (spt3Δ, spt8Δ, and spt15(G174E)) (Figure 3B and Figure 5B). Furthermore, the transcript levels of RDS1 and AAD3 were higher than those of ADH7, suggesting that the transcription of these genes functions synergistically as a boundary. However, our results do not prove that SAGA complex directly affects this subtelomere region. Therefore, it is possible that factors that truly form the boundary of the Chr IIIR are under the control of SAGA-TBP. This is also the case because the SAGA complex regulates the expression of stress response genes, and it is assumed that genes induced in response to specific stresses are responsible for the regulation of boundary formation at Chr IIIR. It also cannot be ruled out that the downregulation of gene expressions at Chr IIIR by mutant strains of SAGA complex and TBP may be the result in the spreading of the silencing region due to the indirect upregulation of SIR genes by the mutation.
The spt8Δ strain showed gene repression at Chr IIIR and other subtelomeres (VIIR, IVL, and IXL) (Figure 3). The SAGA and SLIK complexes regulate stress response genes, and subtelomere regions contain many stress response genes [47,48]. Normally, the SAGA complex is more abundant than the SLIK complex; however, the abundance of the SAGA complex is decreased under spt8Δ. Although SAGA/SLIK complexes regulate stress response genes, subtelomere genes were repressed in the spt8Δ strain (Figure 3). This result appears contradictory because upregulation of the SLIK complex in response to stress decreases the stability of the silencing boundary. Furthermore, TFIID or SAGA complex dependency is not detected at boundary collapsed regions [32]. Further analysis is needed to resolve the discrepancy.
The boundary is maintained when a complete SAGA complex is formed. However, the interaction between SLIK and TBPs is weakened when the complete SAGA complex is not formed, as in the SLIK-Flag strain, spt8Δ strain, or spt3Δ strain. Therefore, it is possible that the SLIK complex performs part of the SAGA complex function through the interaction. We hypothesized that this was a cause of the silencing boundary collapse in the spt8Δ strain. Indeed, the boundary was destabilized in the SLIK-Flag strain (Figure 6). In addition, there are two possible reasons for the smaller effects on the boundary in the spt8Δ or SLIK-Flag strain than in the spt3Δ strain. First, the interaction of TBPs with Spt8 was weaker than that with Spt3. Second, there are SAGA complexes lacking Spt8 (not complete SAGA) in a certain ratio. Actually, the YCR108C expression level was increased. Possibly, this is an unnatural effect specific to the SLIK-Flag strain, since the spt8Δ strain has an incomplete SAGA complex lacking Spt8, whereas the SLIK-Flag strain cannot make the SAGA complex at all. Therefore, spt8 deletion had a smaller effect on boundary formation as spt3Δ.
The silencing boundary was collapsed in the spt3Δ, spt8Δ, the SLIK-Flag strain, and the spt15(G174E) mutant strain with a weakened interaction with Spt3, indicating that the boundary function of the SAGA complex required interaction with TBPs to a certain extent (Figure 5). However, almost no transcriptional repression was observed at Chr IIIR in spt3 mutants compared to spt3Δ or spt15(G174E). In particular, spt3(E240K) was not only identified as a suppressor of spt15(G174E), it was also reported to bind TBP more strongly than the WT and reduce TBP recruitment to the TATA-box, without much effect on transcription [16,28,51]. However, spt3(E240K) functioned in the absence of Sir3 protein, as the spt3(E240K) sir3Δ strain showed lower transcript levels in some genes than the sir3Δ strain. Since spt3(Y193C) was identified as a suppressor of spt3(E240K), we expected to see a decrease in the expression levels of some genes, such as spt3Δ and spt15(G174E), but interestingly, an increase in transcript levels was observed for some genes. This result indicated that the interaction between Spt3 and TBP is weakened in spt3(Y193C) and that the increased recruitment of TBP to the TATA-box may have increased transcription. This effect was also stronger in the absence of Sir3 for some genes. This suggests that the interaction between SAGA and TBP may differ between open chromatin regions and silencing regions.
The SAGA complex interacts with TFIIS through Spt8. If this interaction was required for boundary function, it was presumed that spt8Δ or SLIK-Flag strain would destabilize the boundary, but not spt3Δ or spt15 mutants. However, the boundary was collapsed not only in spt8Δ or SLIK-Flag strains, but also in spt3Δ or spt15 mutants. This indicated that the interaction between SAGA and TFIIS is not required for boundary formation.

Author Contributions

Conceptualization, K.K. and M.O.; methodology, K.K., T.A. and M.O.; validation, K.K., T.A. and M.O.; formal analysis, K.K.; investigation, K.K., T.A. and M.O.; data curation, K.K.; writing—original draft preparation, K.K., T.A. and M.O.; writing—review and editing, K.K., T.A. and M.O.; visualization, K.K. and T.A.; supervision, M.O.; project administration, M.O.; funding acquisition, M.O. All authors have read and agreed to the published version of the manuscript.

Funding

This work was supported by JSPS KAKENHI Grant Number JP 22H02301.

Institutional Review Board Statement

Not applicable.

Informed Consent Statement

Not applicable.

Data Availability Statement

Experimental data of microarray from this study are deposited in the NCBI Gene Expression Omnibus database. This data (accession number GSE220290) can be found here: https://www.ncbi.nlm.nih.gov/geo/query/acc.cgi?acc=GSE220290 (accessed on 20 February 2023).

Acknowledgments

We thank Karaya for supervising the microarray experiment.

Conflicts of Interest

The authors declare no conflict of interest.

References

  1. Imai, S.; Armstrong, C.M.; Kaeberlein, M.; Guarente, L. Transcriptional silencing and longevity protein Sir2 is an NAD-dependent histone deacetylase. Nature 2000, 403, 795–800. [Google Scholar] [CrossRef] [PubMed]
  2. Rusche, L.N.; Kirchmaier, A.L.; Rine, J. The establishment, inheritance, and function of silenced chromatin in Saccharomyces cerevisiae. Annu. Rev. Biochem. 2003, 72, 481–516. [Google Scholar] [CrossRef] [PubMed]
  3. Sun, J.Q.; Hatanaka, A.; Oki, M. Boundaries of transcriptionally silent chromatin in Saccharomyces cerevisiae. Genes Genet. Syst. 2011, 86, 73–81. [Google Scholar] [CrossRef] [PubMed] [Green Version]
  4. Gartenberg, M.R.; Smith, J.S. The Nuts and Bolts of Transcriptionally Silent Chromatin in Saccharomyces cerevisiae. Genetics 2016, 203, 1563–1599. [Google Scholar] [CrossRef] [PubMed] [Green Version]
  5. Ellahi, A.; Thurtle, D.M.; Rine, J. The Chromatin and Transcriptional Landscape of Native Saccharomyces cerevisiae Telomeres and Subtelomeric Domains. Genetics 2015, 200, 505–521. [Google Scholar] [CrossRef] [Green Version]
  6. Oh, J.; Yeom, S.; Park, J.; Lee, J.S. The regional sequestration of heterochromatin structural proteins is critical to form and maintain silent chromatin. Epigenetics Chromatin 2022, 15, 5. [Google Scholar] [CrossRef]
  7. Yeom, S.; Oh, J.; Lee, J.S. Spreading-dependent or independent Sir2-mediated gene silencing in budding yeast. Genes Genom. 2022, 44, 359–367. [Google Scholar] [CrossRef]
  8. Kimura, A.; Umehara, T.; Horikoshi, M. Chromosomal gradient of histone acetylation established by Sas2p and Sir2p functions as a shield against gene silencing. Nat. Genet. 2002, 32, 370–377. [Google Scholar] [CrossRef]
  9. Suka, N.; Luo, K.; Grunstein, M. Sir2p and Sas2p opposingly regulate acetylation of yeast histone H4 lysine16 and spreading of heterochromatin. Nat. Genet. 2002, 32, 378–383. [Google Scholar] [CrossRef]
  10. Donze, D.; Adams, C.R.; Rine, J.; Kamakaka, R.T. The boundaries of the silenced HMR domain in Saccharomyces cerevisiae. Genes Dev. 1999, 13, 698–708. [Google Scholar] [CrossRef]
  11. Donze, D.; Kamakaka, R.T. RNA polymerase III and RNA polymerase II promoter complexes are heterochromatin barriers in Saccharomyces cerevisiae. EMBO J. 2001, 20, 520–531. [Google Scholar] [CrossRef] [PubMed] [Green Version]
  12. Oki, M.; Kamakaka, R.T. Blockers and barriers to transcription: Competing activities? Curr. Opin. Cell Biol. 2002, 14, 299–304. [Google Scholar] [CrossRef] [PubMed]
  13. Oki, M.; Kamakaka, R.T. Barrier function at HMR. Mol. Cell 2005, 19, 707–716. [Google Scholar] [CrossRef] [PubMed]
  14. Oki, M.; Valenzuela, L.; Chiba, T.; Ito, T.; Kamakaka, R.T. Barrier proteins remodel and modify chromatin to restrict silenced domains. Mol. Cell. Biol. 2004, 24, 1956–1967. [Google Scholar] [CrossRef] [PubMed] [Green Version]
  15. Wery, M.; Shematorova, E.; Van Driessche, B.; Vandenhaute, J.; Thuriaux, P.; Van Mullem, V. Members of the SAGA and Mediator complexes are partners of the transcription elongation factor TFIIS. EMBO J. 2004, 23, 4232–4242. [Google Scholar] [CrossRef] [Green Version]
  16. Han, Y.; Luo, J.; Ranish, J.; Hahn, S. Architecture of the Saccharomyces cerevisiae SAGA transcription coactivator complex. EMBO J. 2014, 33, 2534–2546. [Google Scholar] [CrossRef] [Green Version]
  17. Setiaputra, D.; Ross, J.D.; Lu, S.; Cheng, D.T.; Dong, M.Q.; Yip, C.K. Conformational flexibility and subunit arrangement of the modular yeast Spt-Ada-Gcn5 acetyltransferase complex. J. Biol. Chem. 2015, 290, 10057–10070. [Google Scholar] [CrossRef] [Green Version]
  18. Liu, G.; Zheng, X.; Guan, H.; Cao, Y.; Qu, H.; Kang, J.; Ren, X.; Lei, J.; Dong, M.Q.; Li, X.; et al. Architecture of Saccharomyces cerevisiae SAGA complex. Cell Discov. 2019, 5, 25. [Google Scholar] [CrossRef] [Green Version]
  19. Papai, G.; Frechard, A.; Kolesnikova, O.; Crucifix, C.; Schultz, P.; Ben-Shem, A. Structure of SAGA and mechanism of TBP deposition on gene promoters. Nature 2020, 577, 711–716. [Google Scholar] [CrossRef]
  20. Wang, H.; Dienemann, C.; Stutzer, A.; Urlaub, H.; Cheung, A.C.M.; Cramer, P. Structure of the transcription coactivator SAGA. Nature 2020, 577, 717–720. [Google Scholar] [CrossRef]
  21. Ben-Shem, A.; Papai, G.; Schultz, P. Architecture of the multi-functional SAGA complex and the molecular mechanism of holding TBP. FEBS J. 2021, 288, 3135–3147. [Google Scholar] [CrossRef] [PubMed]
  22. Grant, P.A.; Winston, F.; Berger, S.L. The biochemical and genetic discovery of the SAGA complex. Biochim. Biophys. Acta Gene Regul. Mech. 2021, 1864, 194669. [Google Scholar] [CrossRef] [PubMed]
  23. Vasyliuk, D.; Felt, J.; Zhong, E.D.; Berger, B.; Davis, J.H.; Yip, C.K. Conformational landscape of the yeast SAGA complex as revealed by cryo-EM. Sci. Rep. 2022, 12, 12306. [Google Scholar] [CrossRef] [PubMed]
  24. Kamata, K.; Hatanaka, A.; Goswami, G.; Shinmyozu, K.; Nakayama, J.; Urano, T.; Hatashita, M.; Uchida, H.; Oki, M. C-terminus of the Sgf73 subunit of SAGA and SLIK is important for retention in the larger complex and for heterochromatin boundary function. Genes Cells 2013, 18, 823–837. [Google Scholar] [CrossRef]
  25. Kamata, K.; Goswami, G.; Kashio, S.; Urano, T.; Nakagawa, R.; Uchida, H.; Oki, M. The N-terminus and Tudor domains of Sgf29 are important for its heterochromatin boundary formation function. J Biochem. 2014, 155, 159–171. [Google Scholar] [CrossRef] [PubMed]
  26. Kamata, K.; Shinmyozu, K.; Nakayama, J.I.; Hatashita, M.; Uchida, H.; Oki, M. Four domains of Ada1 form a heterochromatin boundary through different mechanisms. Genes Cells 2016, 21, 1125–1136. [Google Scholar] [CrossRef]
  27. Birck, C.; Poch, O.; Romier, C.; Ruff, M.; Mengus, G.; Lavigne, A.C.; Davidson, I.; Moras, D. Human TAF(II)28 and TAF(II)18 interact through a histone fold encoded by atypical evolutionary conserved motifs also found in the SPT3 family. Cell 1998, 94, 239–249. [Google Scholar] [CrossRef] [PubMed] [Green Version]
  28. Eisenmann, D.M.; Arndt, K.M.; Ricupero, S.L.; Rooney, J.W.; Winston, F. SPT3 interacts with TFIID to allow normal transcription in Saccharomyces cerevisiae. Genes Dev. 1992, 6, 1319–1331. [Google Scholar] [CrossRef] [Green Version]
  29. Dudley, A.M.; Rougeulle, C.; Winston, F. The Spt components of SAGA facilitate TBP binding to a promoter at a post-activator-binding step in vivo. Genes Dev. 1999, 13, 2940–2945. [Google Scholar] [CrossRef]
  30. Belotserkovskaya, R.; Sterner, D.E.; Deng, M.; Sayre, M.H.; Lieberman, P.M.; Berger, S.L. Inhibition of TATA-binding protein function by SAGA subunits Spt3 and Spt8 at Gcn4-activated promoters. Mol. Cell. Biol. 2000, 20, 634–647. [Google Scholar] [CrossRef] [Green Version]
  31. Bhaumik, S.R.; Green, M.R. Differential requirement of SAGA components for recruitment of TATA-box-binding protein to promoters in vivo. Mol. Cell. Biol. 2002, 22, 7365–7371. [Google Scholar] [CrossRef] [PubMed] [Green Version]
  32. Huisinga, K.L.; Pugh, B.F. A genome-wide housekeeping role for TFIID and a highly regulated stress-related role for SAGA in Saccharomyces cerevisiae. Mol. Cell 2004, 13, 573–585. [Google Scholar] [CrossRef] [PubMed]
  33. Liu, Y.; Xu, X.; Kuo, M.H. Snf1p regulates Gcn5p transcriptional activity by antagonizing Spt3p. Genetics 2010, 184, 91–105. [Google Scholar] [CrossRef] [PubMed] [Green Version]
  34. Madison, J.M.; Winston, F. Evidence that Spt3 functionally interacts with Mot1, TFIIA, and TATA-binding protein to confer promoter-specific transcriptional control in Saccharomyces cerevisiae. Mol. Cell. Biol. 1997, 17, 287–295. [Google Scholar] [CrossRef] [PubMed] [Green Version]
  35. Hampsey, M. Molecular genetics of the RNA polymerase II general transcriptional machinery. Microbiol. Mol. Biol. Rev. 1998, 62, 465–503. [Google Scholar] [CrossRef] [PubMed] [Green Version]
  36. Hirschhorn, J.N.; Winston, F. SPT3 is required for normal levels of a-factor and alpha-factor expression in Saccharomyces cerevisiae. Mol. Cell. Biol. 1988, 8, 822–827. [Google Scholar] [CrossRef] [PubMed]
  37. Pray-Grant, M.G.; Schieltz, D.; McMahon, S.J.; Wood, J.M.; Kennedy, E.L.; Cook, R.G.; Workman, J.L.; Yates, J.R., 3rd; Grant, P.A. The novel SLIK histone acetyltransferase complex functions in the yeast retrograde response pathway. Mol. Cell. Biol. 2002, 22, 8774–8786. [Google Scholar] [CrossRef] [Green Version]
  38. Sterner, D.E.; Belotserkovskaya, R.; Berger, S.L. SALSA, a variant of yeast SAGA, contains truncated Spt7, which correlates with activated transcription. Proc. Natl. Acad. Sci. USA 2002, 99, 11622–11627. [Google Scholar] [CrossRef] [Green Version]
  39. Lee, K.K.; Workman, J.L. Histone acetyltransferase complexes: One size doesn’t fit all. Nat. Rev. Mol. Cell Biol. 2007, 8, 284–295. [Google Scholar] [CrossRef]
  40. Mischerikow, N.; Spedale, G.; Altelaar, A.F.; Timmers, H.T.; Pijnappel, W.W.; Heck, A.J. In-depth profiling of post-translational modifications on the related transcription factor complexes TFIID and SAGA. J. Proteome Res. 2009, 8, 5020–5030. [Google Scholar] [CrossRef]
  41. Rothstein, R. Targeting, disruption, replacement, and allele rescue: Integrative DNA transformation in yeast. Methods Enzymol. 1991, 194, 281–301. [Google Scholar] [CrossRef] [PubMed]
  42. Longtine, M.S.; Fares, H.; Pringle, J.R. Role of the yeast Gin4p protein kinase in septin assembly and the relationship between septin assembly and septin function. J. Cell Biol. 1998, 143, 719–736. [Google Scholar] [CrossRef]
  43. Boeke, J.D.; LaCroute, F.; Fink, G.R. A positive selection for mutants lacking orotidine-5′-phosphate decarboxylase activity in yeast: 5-fluoro-orotic acid resistance. Mol. Gen. Genet. 1984, 197, 345–346. [Google Scholar] [CrossRef] [PubMed]
  44. Sikorski, R.S.; Hieter, P. A system of shuttle vectors and yeast host strains designed for efficient manipulation of DNA in Saccharomyces cerevisiae. Genetics 1989, 122, 19–27. [Google Scholar] [CrossRef]
  45. Mitsumori, R.; Ohashi, T.; Kugou, K.; Ichino, A.; Taniguchi, K.; Ohta, K.; Uchida, H.; Oki, M. Analysis of novel Sir3 binding regions in Saccharomyces cerevisiae. J. Biochem. 2016, 160, 11–17. [Google Scholar] [CrossRef]
  46. Mitsumori, R.; Shinmyozu, K.; Nakayama, J.I.; Uchida, H.; Oki, M. Gic1 is a novel heterochromatin boundary protein in vivo. Genes Genet. Syst. 2016, 91, 151–159. [Google Scholar] [CrossRef] [PubMed] [Green Version]
  47. Ghosh, S.; Pugh, B.F. Sequential recruitment of SAGA and TFIID in a genomic response to DNA damage in Saccharomyces cerevisiae. Mol. Cell. Biol. 2011, 31, 190–202. [Google Scholar] [CrossRef] [Green Version]
  48. Smith, J.J.; Miller, L.R.; Kreisberg, R.; Vazquez, L.; Wan, Y.; Aitchison, J.D. Environment-responsive transcription factors bind subtelomeric elements and regulate gene silencing. Mol. Syst. Biol. 2011, 7, 455. [Google Scholar] [CrossRef]
  49. Laprade, L.; Rose, D.; Winston, F. Characterization of new Spt3 and TATA-binding protein mutants of Saccharomyces cerevisiae: Spt3 TBP allele-specific interactions and bypass of Spt8. Genetics 2007, 177, 2007–2017. [Google Scholar] [CrossRef] [Green Version]
  50. Stargell, L.A.; Struhl, K. A new class of activation-defective TATA-binding protein mutants: Evidence for two steps of transcriptional activation in vivo. Mol. Cell. Biol. 1996, 16, 4456–4464. [Google Scholar] [CrossRef] [Green Version]
  51. Larschan, E.; Winston, F. The, S. cerevisiae SAGA complex functions in vivo as a coactivator for transcriptional activation by Gal4. Genes Dev. 2001, 15, 1946–1956. [Google Scholar] [CrossRef] [PubMed] [Green Version]
  52. Sermwittayawong, D.; Tan, S. SAGA binds TBP via its Spt8 subunit in competition with DNA: Implications for TBP recruitment. EMBO J. 2006, 25, 3791–3800. [Google Scholar] [CrossRef] [PubMed]
  53. Basehoar, A.D.; Zanton, S.J.; Pugh, B.F. Identification and distinct regulation of yeast TATA box-containing genes. Cell 2004, 116, 699–709. [Google Scholar] [CrossRef] [Green Version]
  54. de Jonge, W.J.; O’Duibhir, E.; Lijnzaad, P.; van Leenen, D.; Groot Koerkamp, M.J.; Kemmeren, P.; Holstege, F.C. Molecular mechanisms that distinguish TFIID housekeeping from regulatable SAGA promoters. EMBO J. 2017, 36, 274–290. [Google Scholar] [CrossRef] [PubMed]
Figure 1. Spt3 and Spt8 regulate subtelomere gene expression. Changes in expression of genes from Chr II, III, and VIII in the spt3Δ and spt8Δ and the wild type (WT) strains as determined by microarray. Dotted lines show the average ± 2· standard deviation.
Biomolecules 13 00619 g001
Figure 2. The spt3Δ and spt8Δ mutants showed a deficit in the silencing boundary. (A) A 100% stacked column chart of microarray analysis of the transcriptome of spt3Δ strain and spt8Δ strain. The numbers in the bar plot represent gene numbers. σ indicates standard deviation. ±0.5σ, +2σ, and −2σ indicate unchanged, upregulated, and downregulated genes, respectively, compared to WT. (B) The results of DAVID analysis of downregulated genes in spt3Δ. The GOTerm biological process (BP) category results were plotted on the x-axis. Fold enrichment means the ratio of the actual number of downregulated genes to the expected number of genes belonging to each term. Adjusted p-values were calculated by the Benjamini method.
Biomolecules 13 00619 g002
Figure 3. Spt3 and Spt8 are involved in boundary formation. (A) Gene map of Chr IIIR. Grey genes were measured gene expression. (B) Transcription level at Chr IIIR genes in the spt3Δ strain and spt8Δ strain, and in the sir3Δ strain by RT-qPCR. Asterisks mean p < 0.05 compared with WT (Student’s t-test). Error bars show standard errors calculated from three independent experiments.
Biomolecules 13 00619 g003
Figure 4. The boundary formation is DNA sequence-independent at the Chr III right telomere. (A) Gene map of Chr IIIR in Amp-ARS319 and Amp-YCR108C strains. (B) Expression level of Chr IIIR genes in Amp-ARS319 and Amp-YCR108C strains by RT-qPCR. Asterisks mean p < 0.05 compared with WT (Student’s t-test). Error bars show standard errors calculated from three independent experiments.
Biomolecules 13 00619 g004
Figure 5. Interaction between Spt3 and TBP is important for boundary formation. (A,B) Transcription level at Chr IIIR genes in spt3 mutant strains and sir3Δ strains (A) and in spt15 mutant strains and sir3Δ strains by RT-qPCR (B). Asterisks represent p < 0.05 compared with the WT (Student’s t-test). Error bars show standard errors calculated from three independent experiments.
Biomolecules 13 00619 g005
Figure 6. The SLIK complex is not sufficient for boundary formation. (A) Western blot analysis of protein extracts from strains producing Flag-Spt7 (lane 1) or SLIK-specific Spt7-Flag (lane 2). A 6% acrylamide gel was used for protein fractionation. Flag-tag was detected by an anti-Flag antibody. (B) Expression level of Chr III genes in the SLIK-Flag strain by RT-qPCR. Asterisks represent p < 0.05 compared with the WT (Student’s t-test). Error bars show standard errors calculated from three independent experiments.
Biomolecules 13 00619 g006
Figure 7. Silencing region was spread in spt3Δ, spt8Δ, and spt15 mutants. (A) Primer position for the ChIP assay. Black bars mean primer positions. (B) Occupancy levels of Sir3 in WT, spt3Δ, spt8Δ, and spt15(G174E) strain. Asterisks mean p < 0.15 compared with WT (Student’s t-test). Error bars show standard errors calculated from three independent experiments.
Biomolecules 13 00619 g007
Table 1. Yeast strain list.
Strain No.GenotypeSource
FUY 837MATa his3Δ1 leu2Δ0 met15Δ0 ura3Δ0This study
FUY 1621MATa his3Δ1 leu2Δ0 met15Δ0 ura3Δ0 spt3Δ::KanMXThis study
FUY 1622MATa his3Δ1 leu2Δ0 met15Δ0 ura3Δ0 spt8Δ::KanMXThis study
FUY 1624MATa his3Δ1 leu2Δ0 met15Δ0 ura3Δ0 sir3Δ::HphMXThis study
FUY 1657MATa his3Δ1 leu2Δ0 met15Δ0 ura3Δ0 spt3Δ::KanMX sir3Δ::HphMXThis study
FUY 1658MATa his3Δ1 leu2Δ0 met15Δ0 ura3Δ0 spt8Δ::KanMX sir3Δ::HphMXThis study
FUY 1662MATa his3Δ1 leu2Δ0 met15Δ0 ura3Δ0 SPT3::3xFlag-SPT3This study
FUY 1663MATa his3Δ1 leu2Δ0 met15Δ0 ura3Δ0 SPT7::3xFlag-SPT7This study
FUY 1664MATa his3Δ1 leu2Δ0 met15Δ0 ura3Δ0 SPT8::3xFlag-SPT8This study
FUY 1665MATa his3Δ1 leu2Δ0 met15Δ0 ura3Δ0
TBP(SPT15)::3xFlag-TBP(SPT15)
This study
FUY 1757MATa his3Δ1 leu2Δ0 met15Δ0 ura3Δ0
spt3Δ::Flag-spt3(Y193C)
This study
FUY 1758MATa his3Δ1 leu2Δ0 met15Δ0 ura3Δ0
spt3Δ::Flag-spt3(E240K)
This study
FUY 1759MATa his3Δ1 leu2Δ0 met15Δ0 ura3Δ0
spt15Δ::Flag-spt15(T153I)
This study
FUY 1760MATa his3Δ1 leu2Δ0 met15Δ0 ura3Δ0
spt15Δ::Flag-spt15(R171E)
This study
FUY 1761MATa his3Δ1 leu2Δ0 met15Δ0 ura3Δ0
spt15Δ::Flag-spt15(G174E)
This study
FUY 1762MATa his3Δ1 leu2Δ0 met15Δ0 ura3Δ0
spt3Δ::Flag-spt3(Y193C) sir3Δ::HphMX
This study
FUY 1763MATa his3Δ1 leu2Δ0 met15Δ0 ura3Δ0
spt3Δ::Flag-spt3(E240K) sir3Δ::HphMX
This study
FUY 1764MATa his3Δ1 leu2Δ0 met15Δ0 ura3Δ0
spt15Δ::Flag-spt15(T153I) sir3Δ::HphMX
This study
FUY 1765MATa his3Δ1 leu2Δ0 met15Δ0 ura3Δ0
spt15Δ::Flag-spt15(R171E) sir3Δ::HphMX
This study
FUY 1766MATa his3Δ1 leu2Δ0 met15Δ0 ura3Δ0
spt15Δ::Flag-spt15(G174E) sir3Δ::HphMX
This study
FUY 1840MATa his3Δ1 leu2Δ0 met15Δ0 ura3Δ0
spt7Δ::SPT7(1-1141)-3xFlag
This study
Table 2. Primer list for qPCR.
Primer No.Sequence
832-GIT1/YCR098C-FCCAAAAGAGGTGGTATCCTGGTT
833-GIT1/YCR098C-RvTGGACCACCGAAGGCTAGTG
834-YCR099C-FAATGCAAAAAGCCCATGGAA
835-YCR099C-RvCTCTCCCTCAGGATTTTTTCACA
837-YCR100C-CGGGCCACCCTCCATGTTAG
838-YCR101C-FTGGGAAACGGTCAAAGAAATTG
839-YCR101C-RvCCATGGAAAGGATCAACAGTAAATC
842-YCR102W-A-FGAGGAAAAGTTTGGAAGAACAAAAA
843-YCR102W-A-RvCTCCCCGTAAAGAATGCTTGAT
852-AAD3/YCR107W-FGCGCCTCCGAACAAACAG
853-AAD3/YCR107W-RvAGCAATCTTGGCCAATGCTT
854-YCR108C-FCCATGGCCCATTCTCACTAAA
855-YCR108C-RvCAAGTGCCGTGCATAATGATG
1503-836-YCR100C-FCGATCGGAAGGACCGAAAA
1707-851-RDS1/YCR106W-2RvGGACATAGCGGTATTGGCTTTT
1708-oki264 GIT1-FTGGATGTGCGTACGACCAAT
1709-oki265 GIT1-RvACCTGGTCCAGCATTACCTAACA
1719-847-ADH7/YCR105W-RvTCTCCGCTTTCCATCCTTGT
2882-846-ADH7/YCR105W-FAAACTTCCGATCAGCGAAGAAG
2883-850-RDS1/YCR106W-2FGCCAGATGGAGGATGCAGTT
Table 3. Primer list for ChIP.
Primer No.Sequence
854-YCR108C-FCCATGGCCCATTCTCACTAAA
855-YCR108C-RvCAAGTGCCGTGCATAATGATG
1708-oki264 GIT1-FTGGATGTGCGTACGACCAAT
1709-oki265 GIT1-RvACCTGGTCCAGCATTACCTAACA
3055-AAD3(-1)-RTTTAAGCACGATGGATATGCTTC
3056-AAD3(-82)-FCTTTTGCTGGTTTCGATGATG
3061-RDS1(-1)-RCAGAGCATTTCAGCAGCCAA
3062-RDS1(-93)-FGACATCATTACTAATAATGTTACTC
4827-ADH7 pro 1 FCGGCCGCATAATAAAATGGA
4828-ADH7 pro 1 RvTCTACTCAGAGTTTTGGTGCTCAATT
4850-tel(VI)0.5(F)CCTTTTTTGATATAACTGTCGGAGAGT
4851-tel(VI)0.5(Rv)TCCGAACGCTATTCCAGAAAGT
4852-tel(VI)7.5(F)TGTAGACTTCCCACTGTATTTGAATGA
4853-tel(VI)7.5(Rv)CGTGAAAGTTCAGCGCAACA
Disclaimer/Publisher’s Note: The statements, opinions and data contained in all publications are solely those of the individual author(s) and contributor(s) and not of MDPI and/or the editor(s). MDPI and/or the editor(s) disclaim responsibility for any injury to people or property resulting from any ideas, methods, instructions or products referred to in the content.

