
Melatonin Activates Anti-Inflammatory Features in Microglia in a Multicellular Context: Evidence from Organotypic Brain Slices and HMC3 Cells
 , , , and
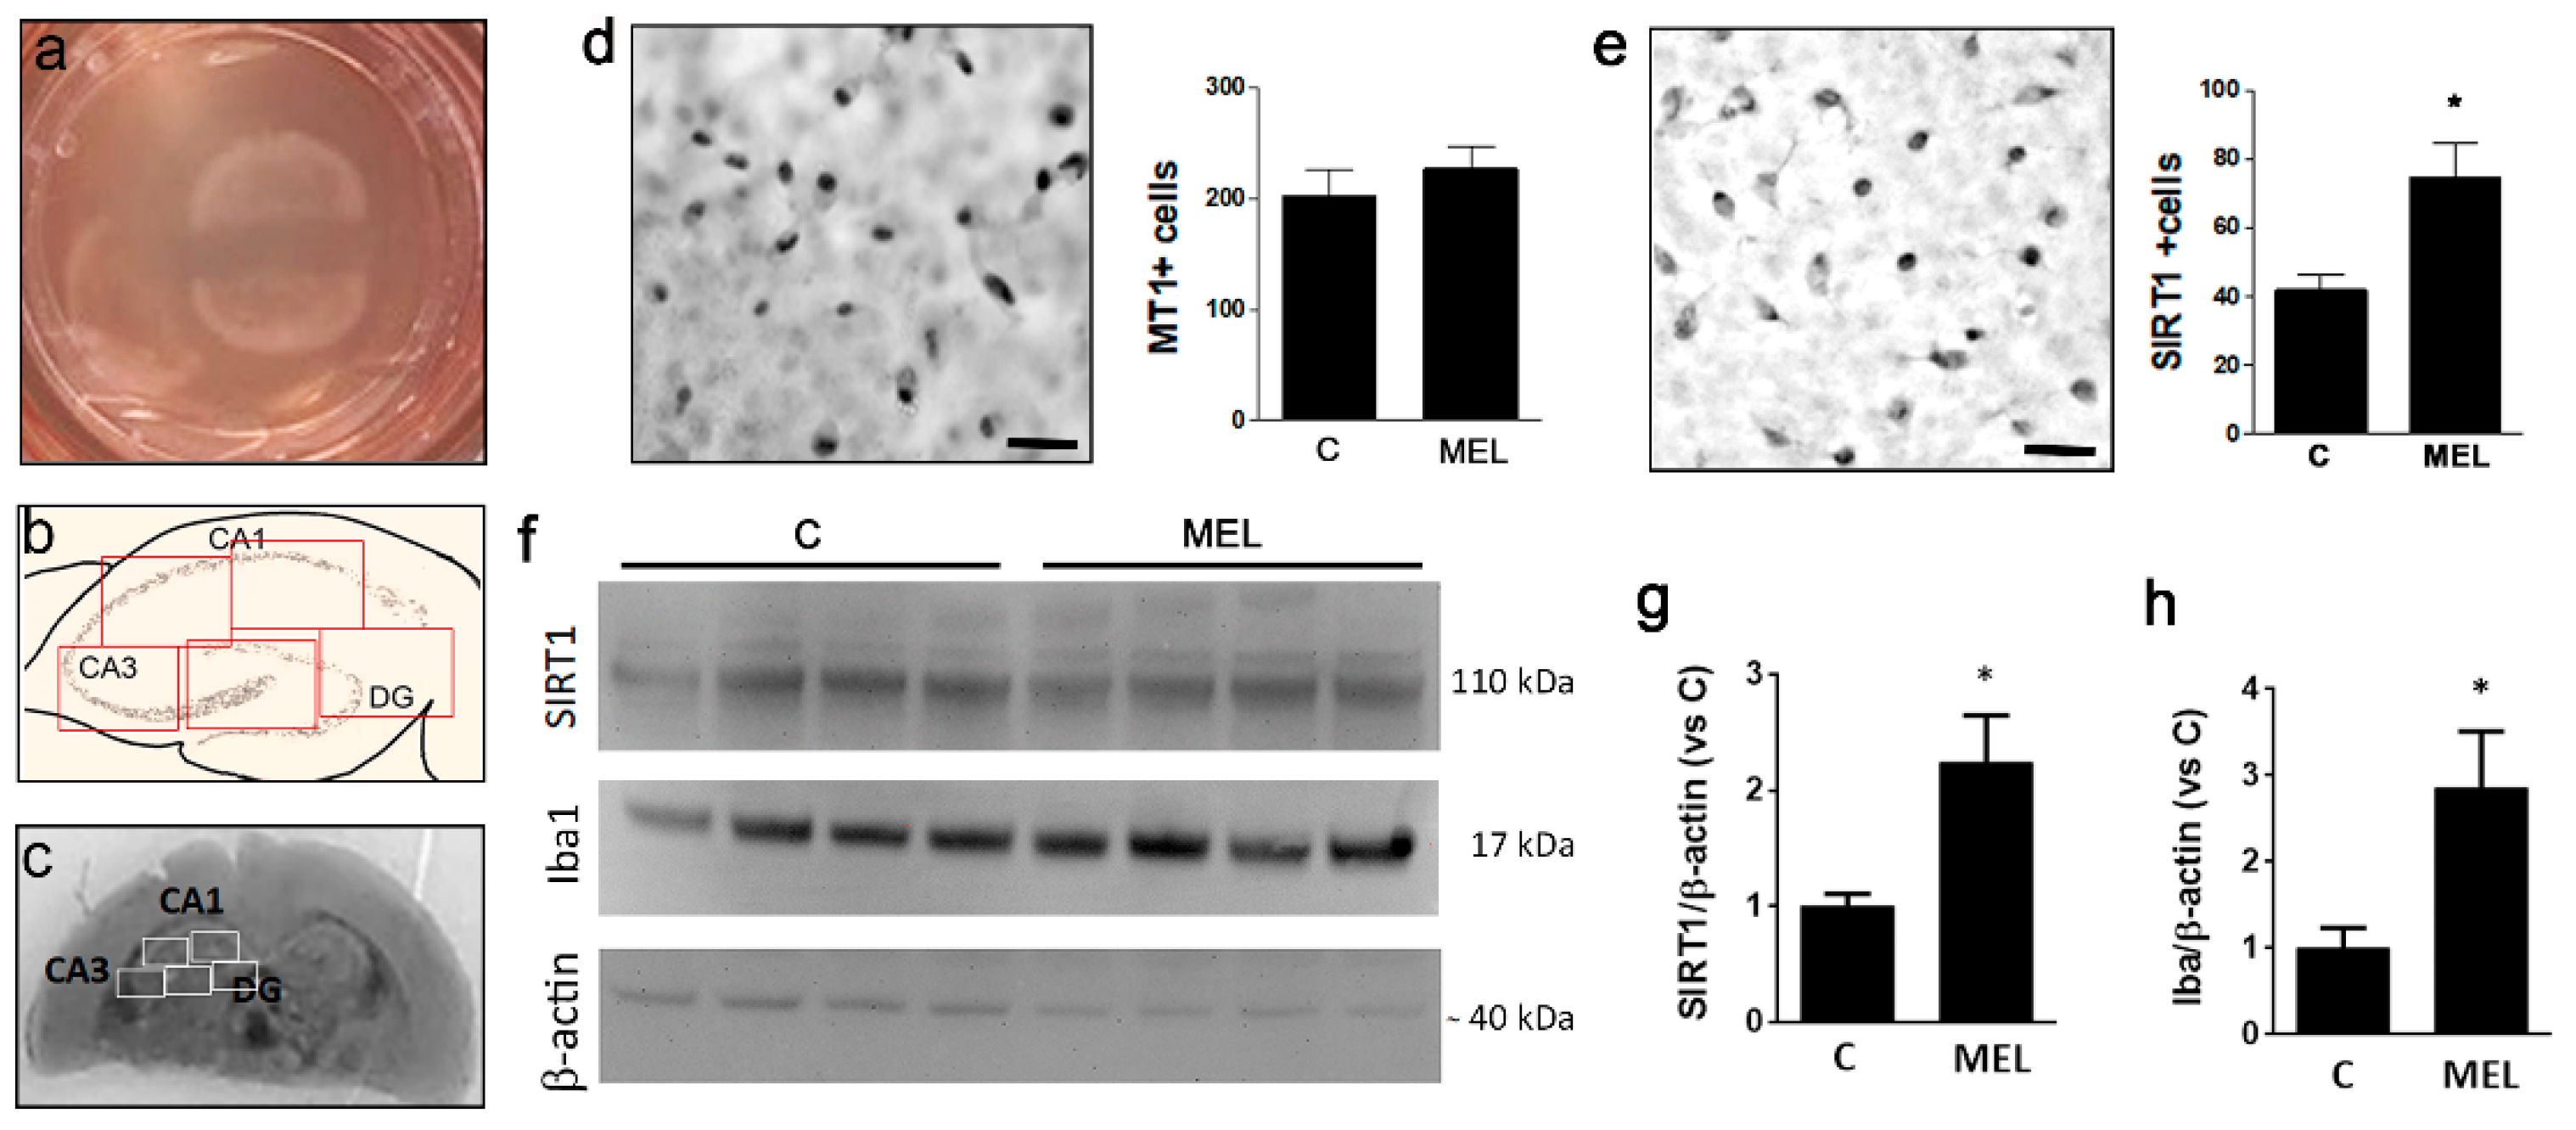
Abstract
:1. Introduction
2. Materials and Method
2.1. Drugs
2.2. Organotypic Brain Cultures (OCs)
2.3. Cell Cultures
2.4. Immunohistochemistry and Cell Counts on OCs
2.5. Immunocytochemistry and Cell Counts on HMC3 Cells
2.6. Quantitative Real-Time Polymerase Chain Reaction (qRT-PCR)
2.7. Western Blot
2.8. Enzyme-Linked Immunosorbent Assay (ELISA)
2.9. Caspase 1 Assay
2.10. Statistical Analysis
3. Results
3.1. Organotypic Slices Express the MT1 Receptor and Respond to Melatonin by Upregulation of SIRT1 and Iba1
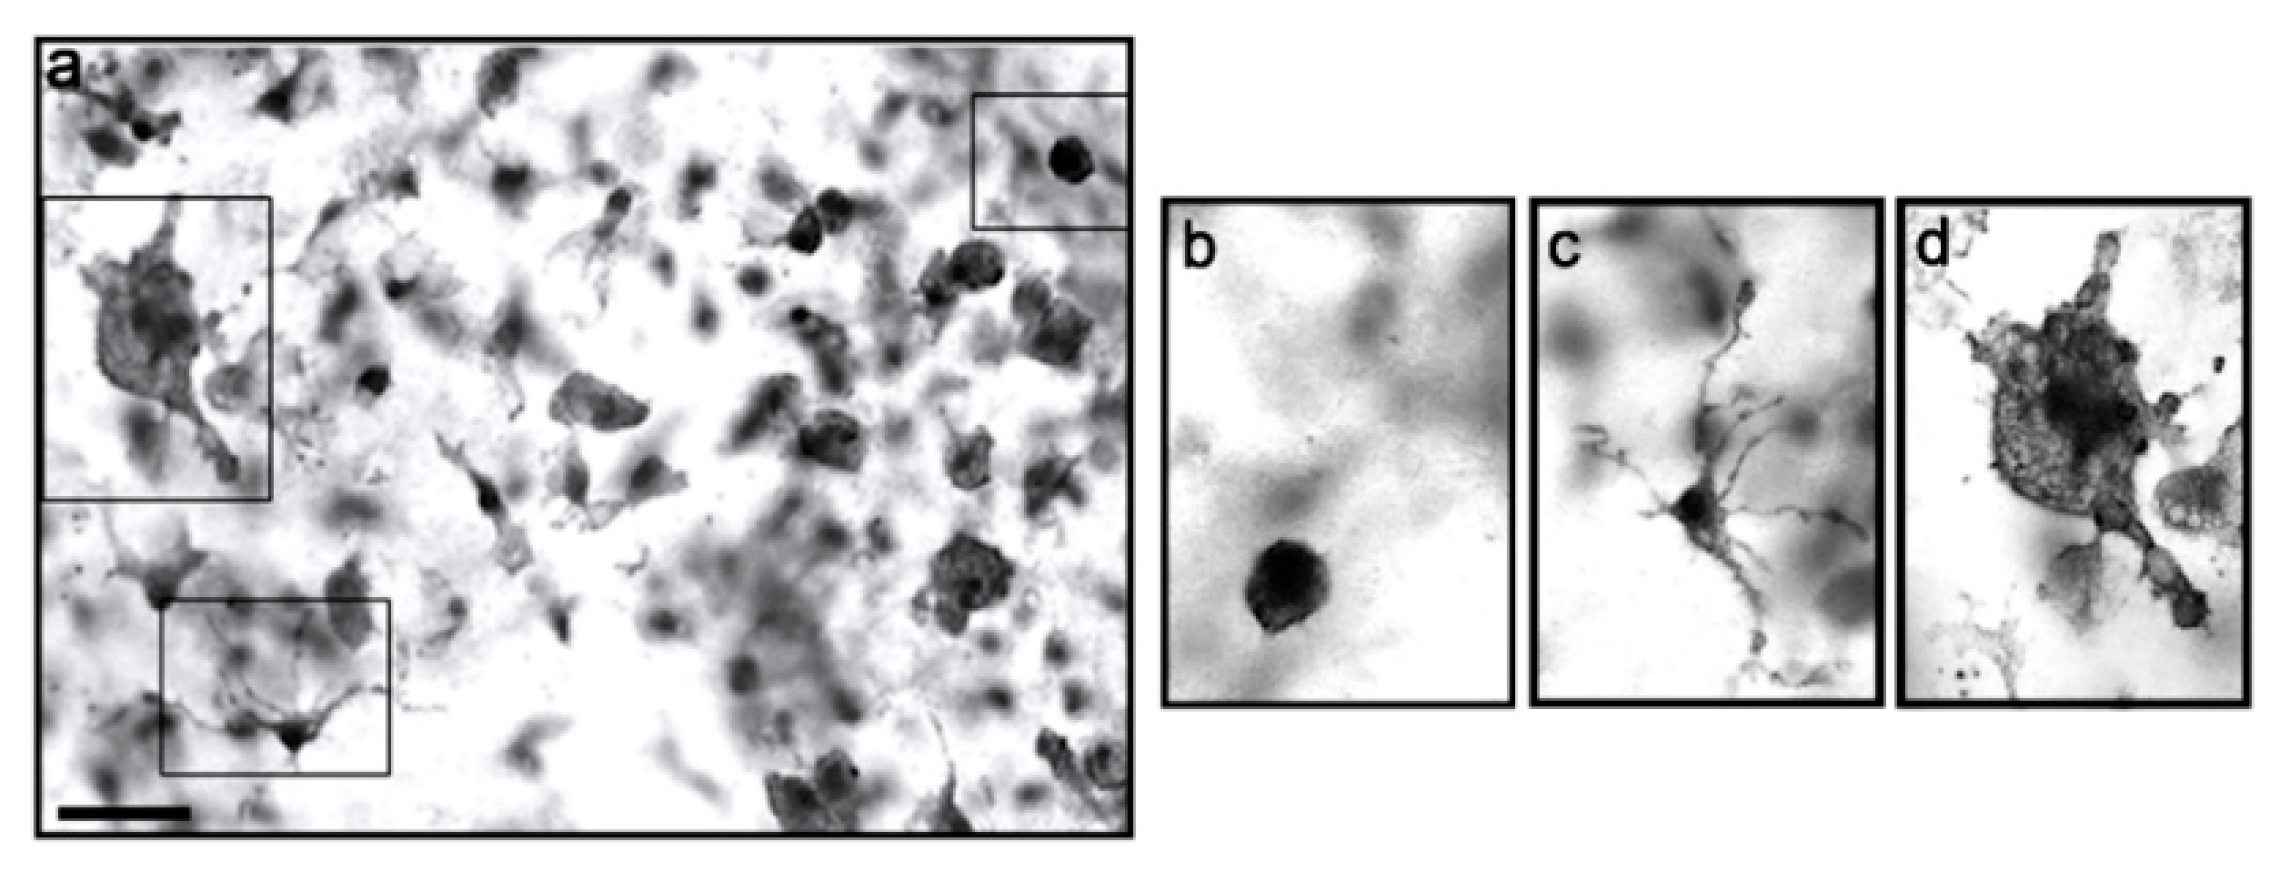
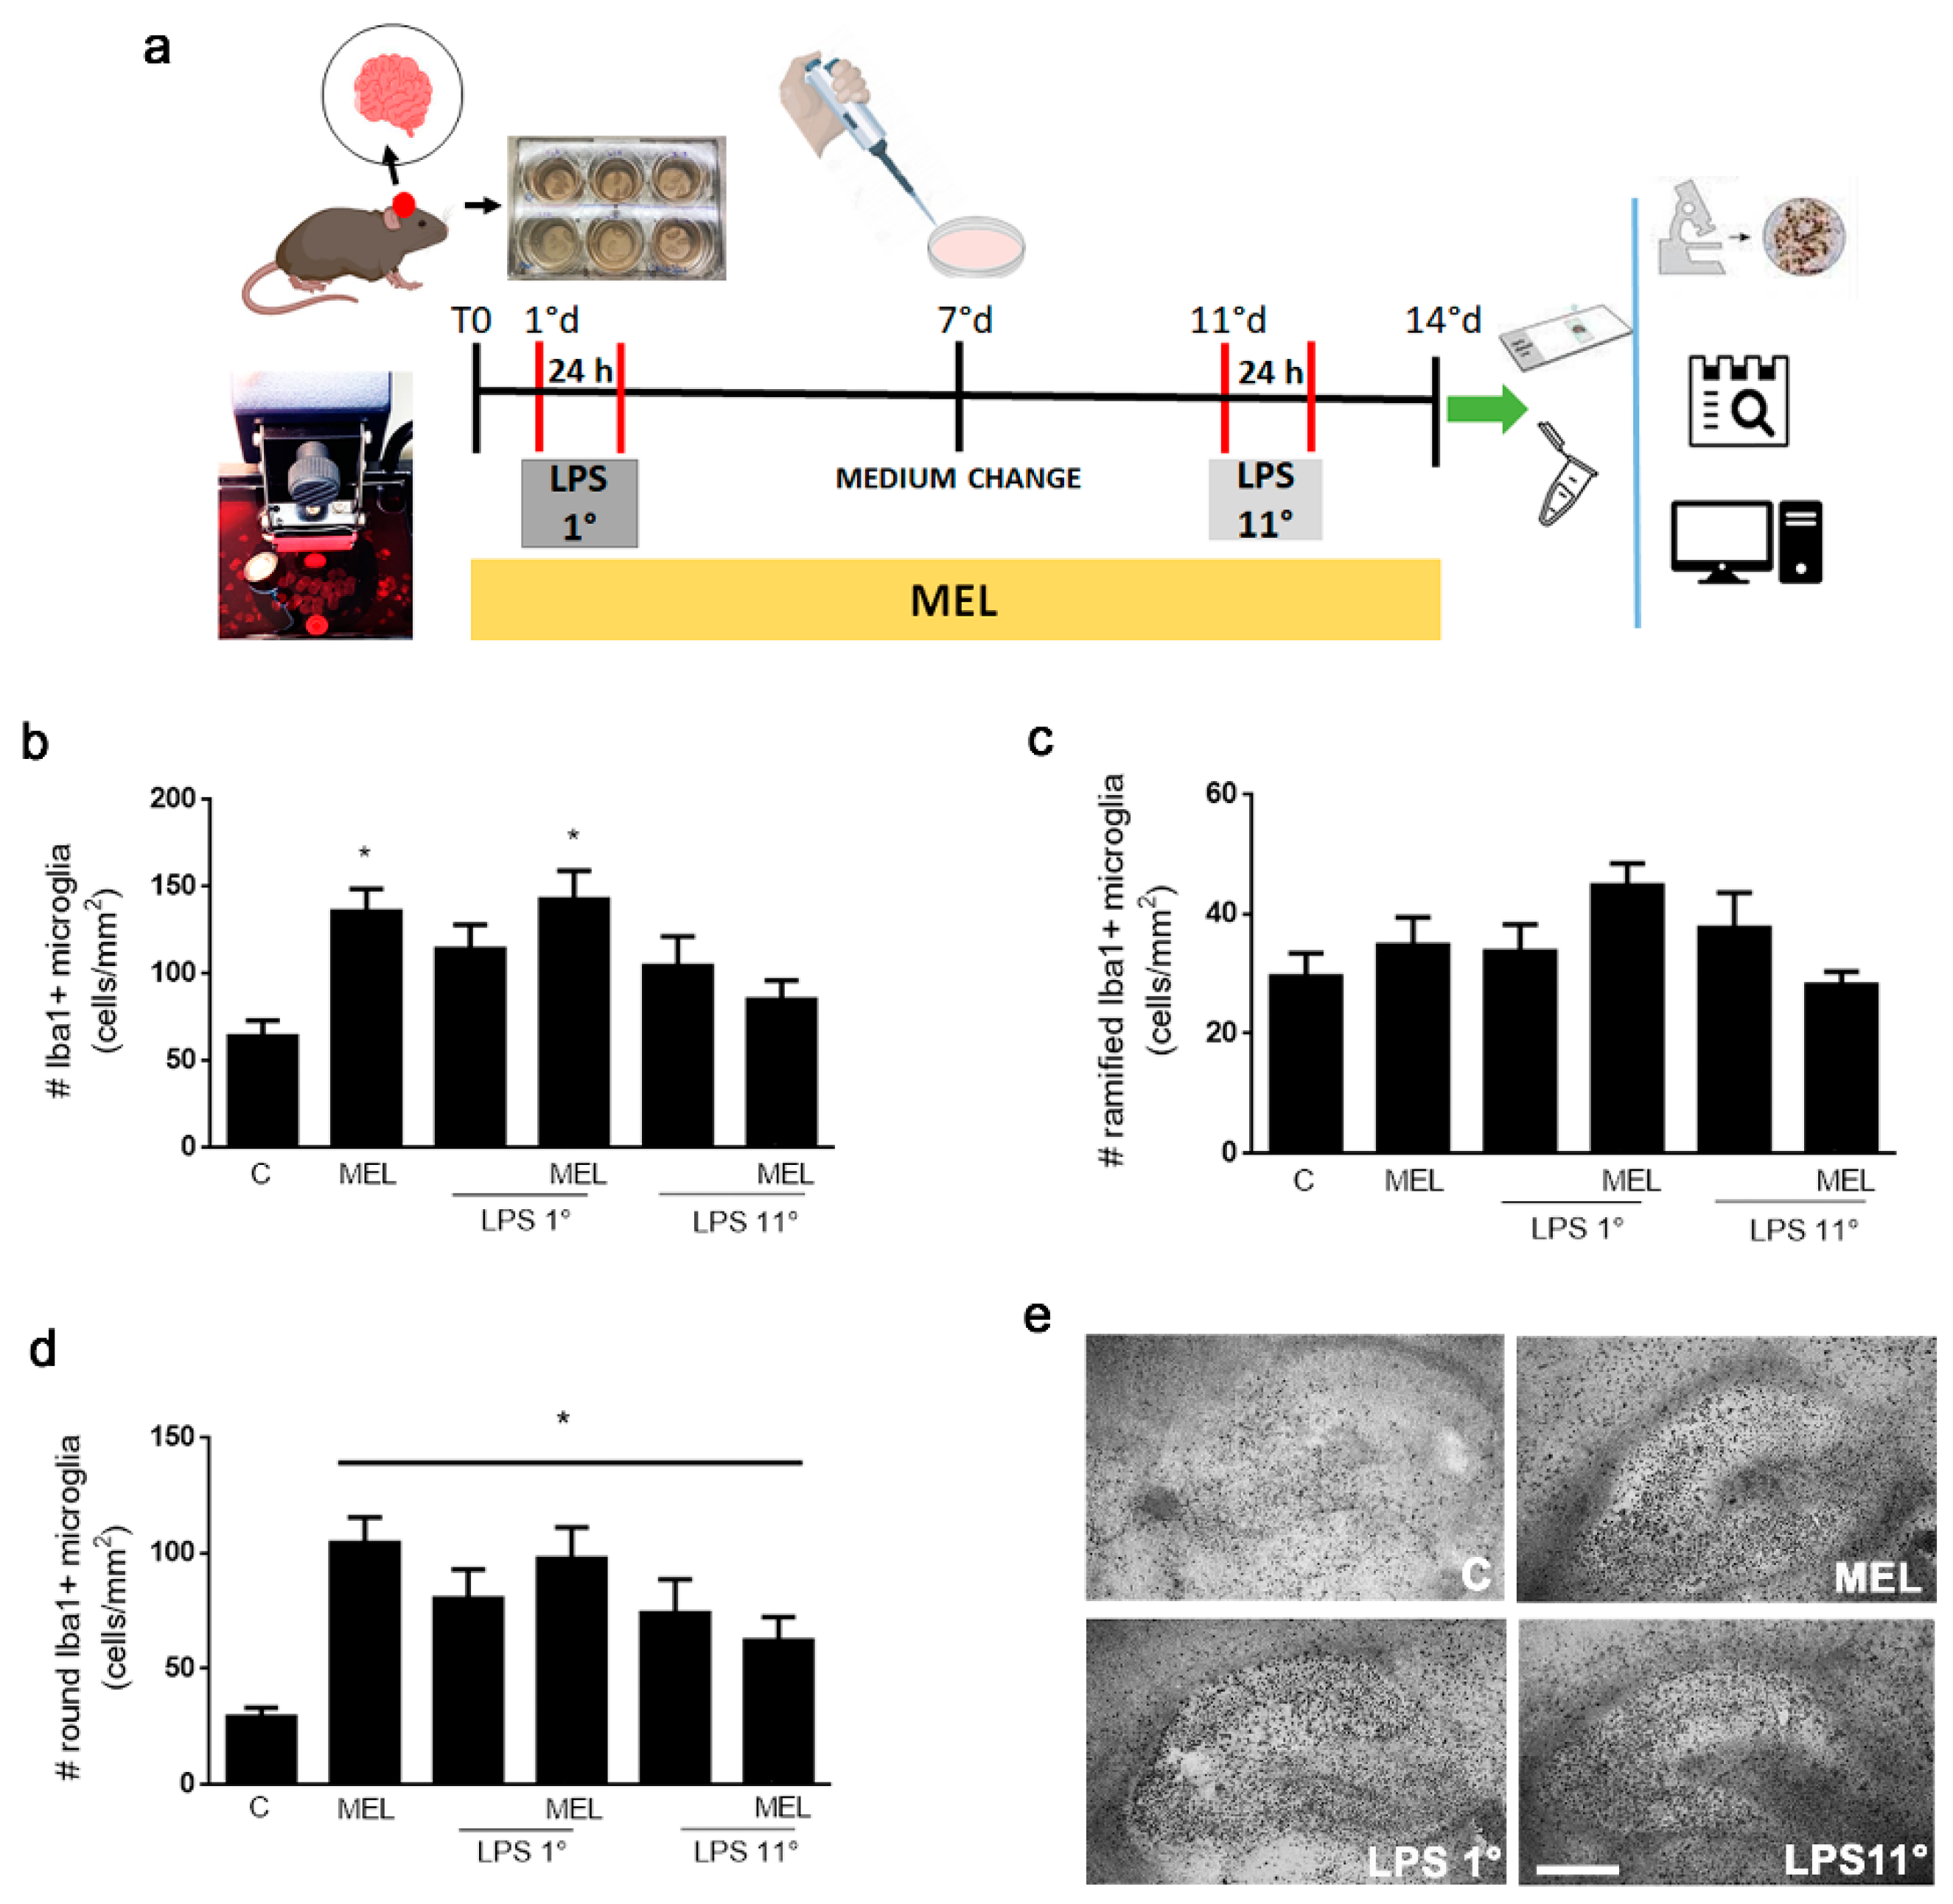
3.2. Melatonin and LPS Activate Microglia into a Round Morphology
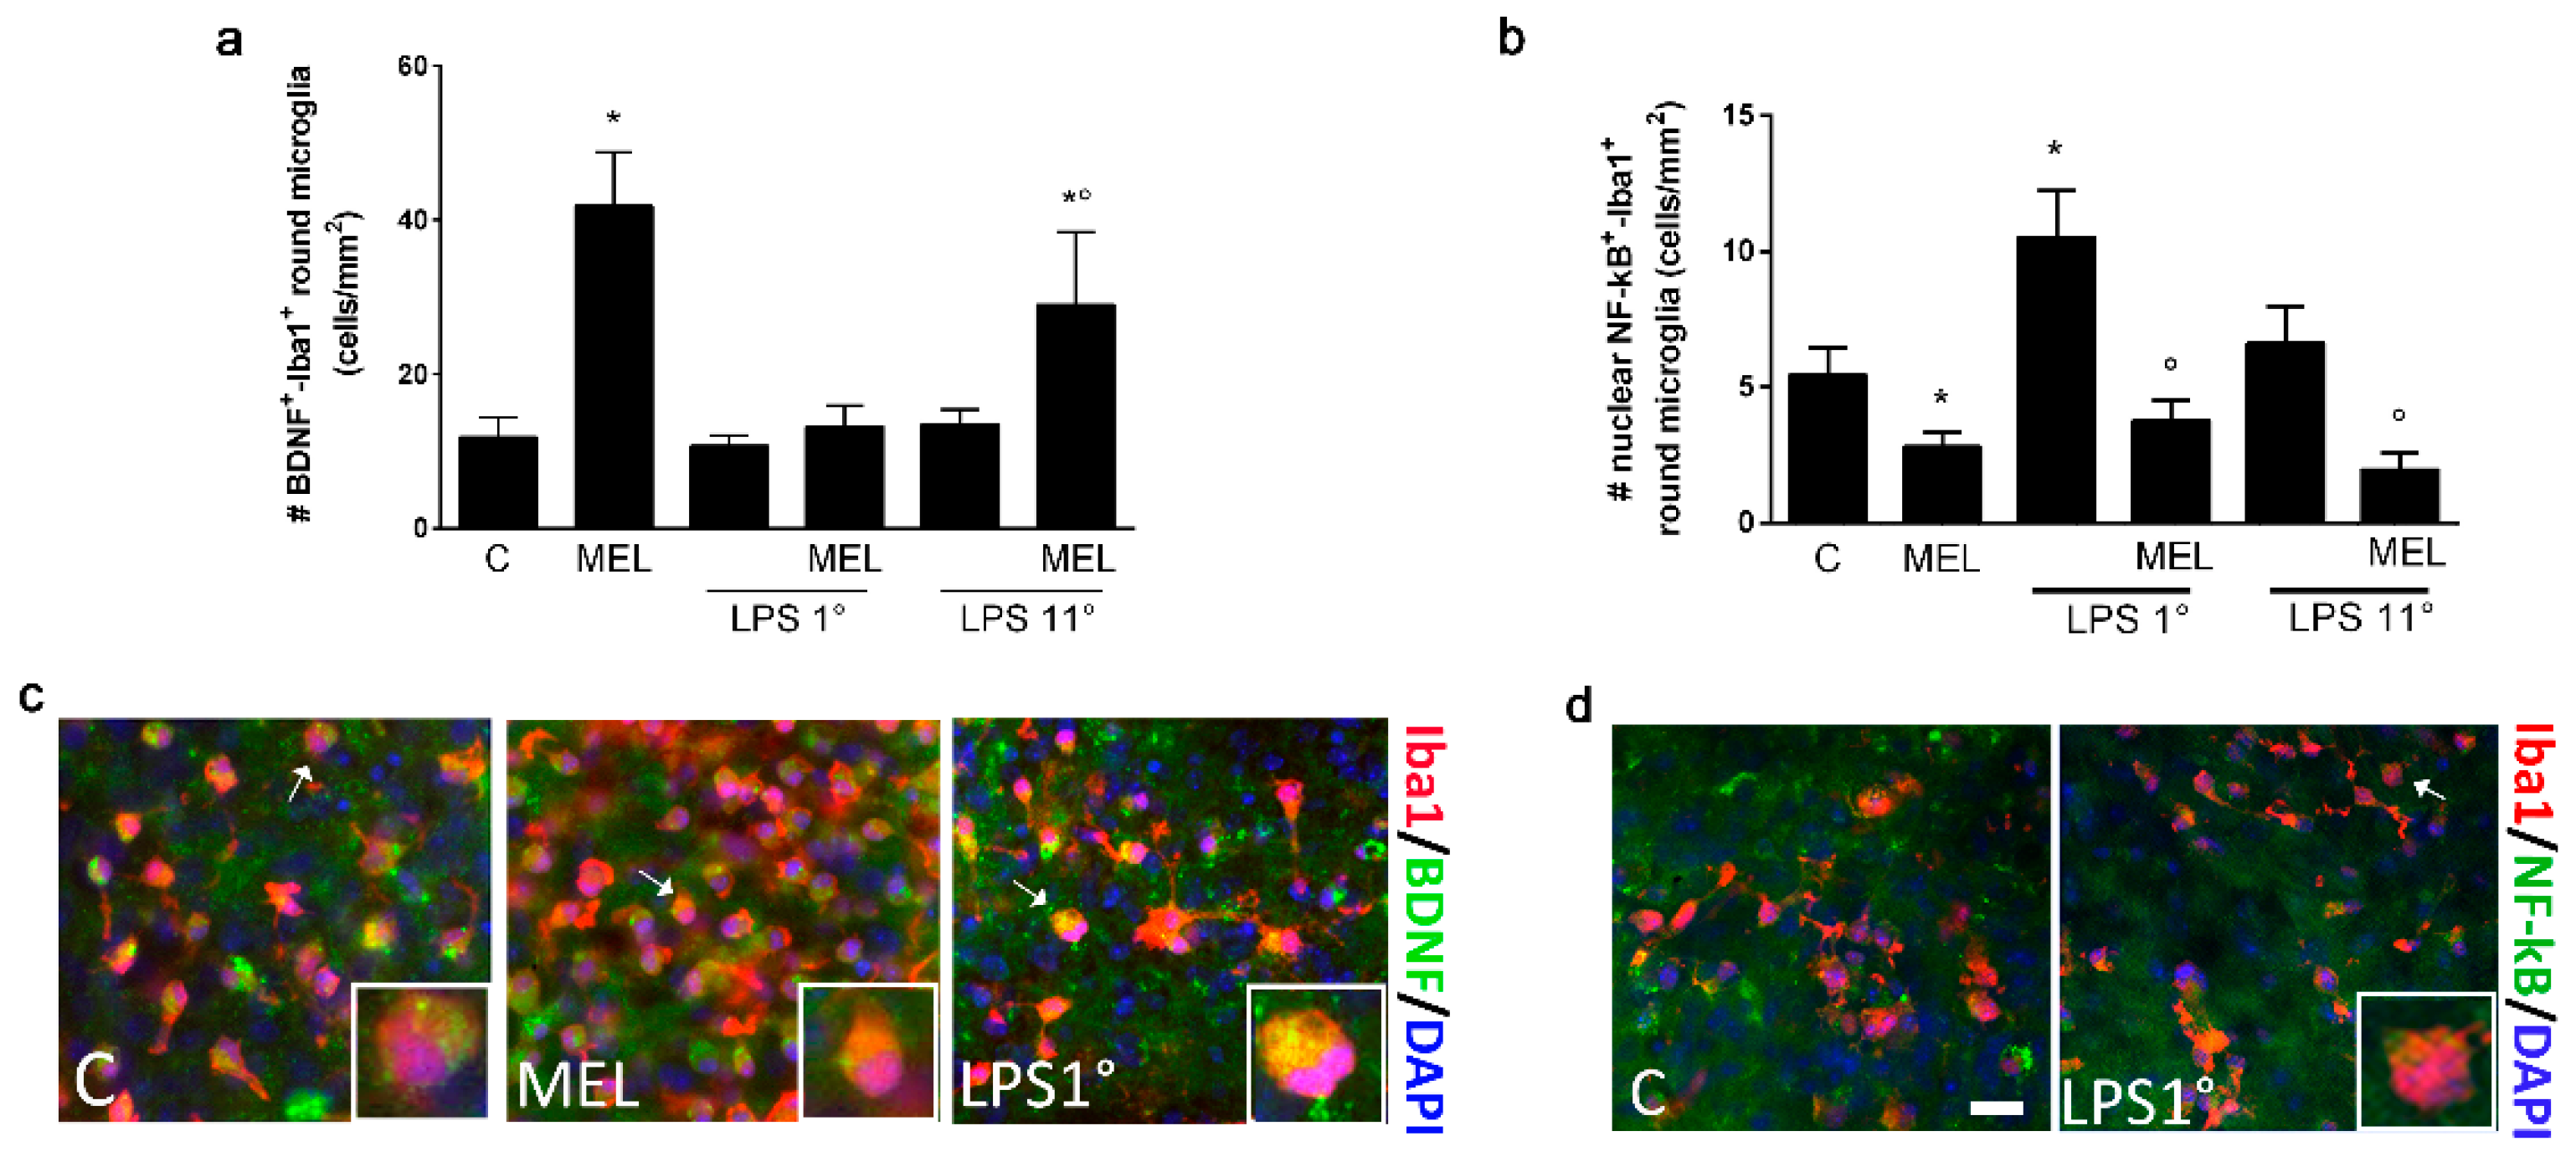
3.3. Melatonin Induces an Anti-Inflammatory Signaling and Is Able to Contrast the LPS Pro-Inflammatory Trigger
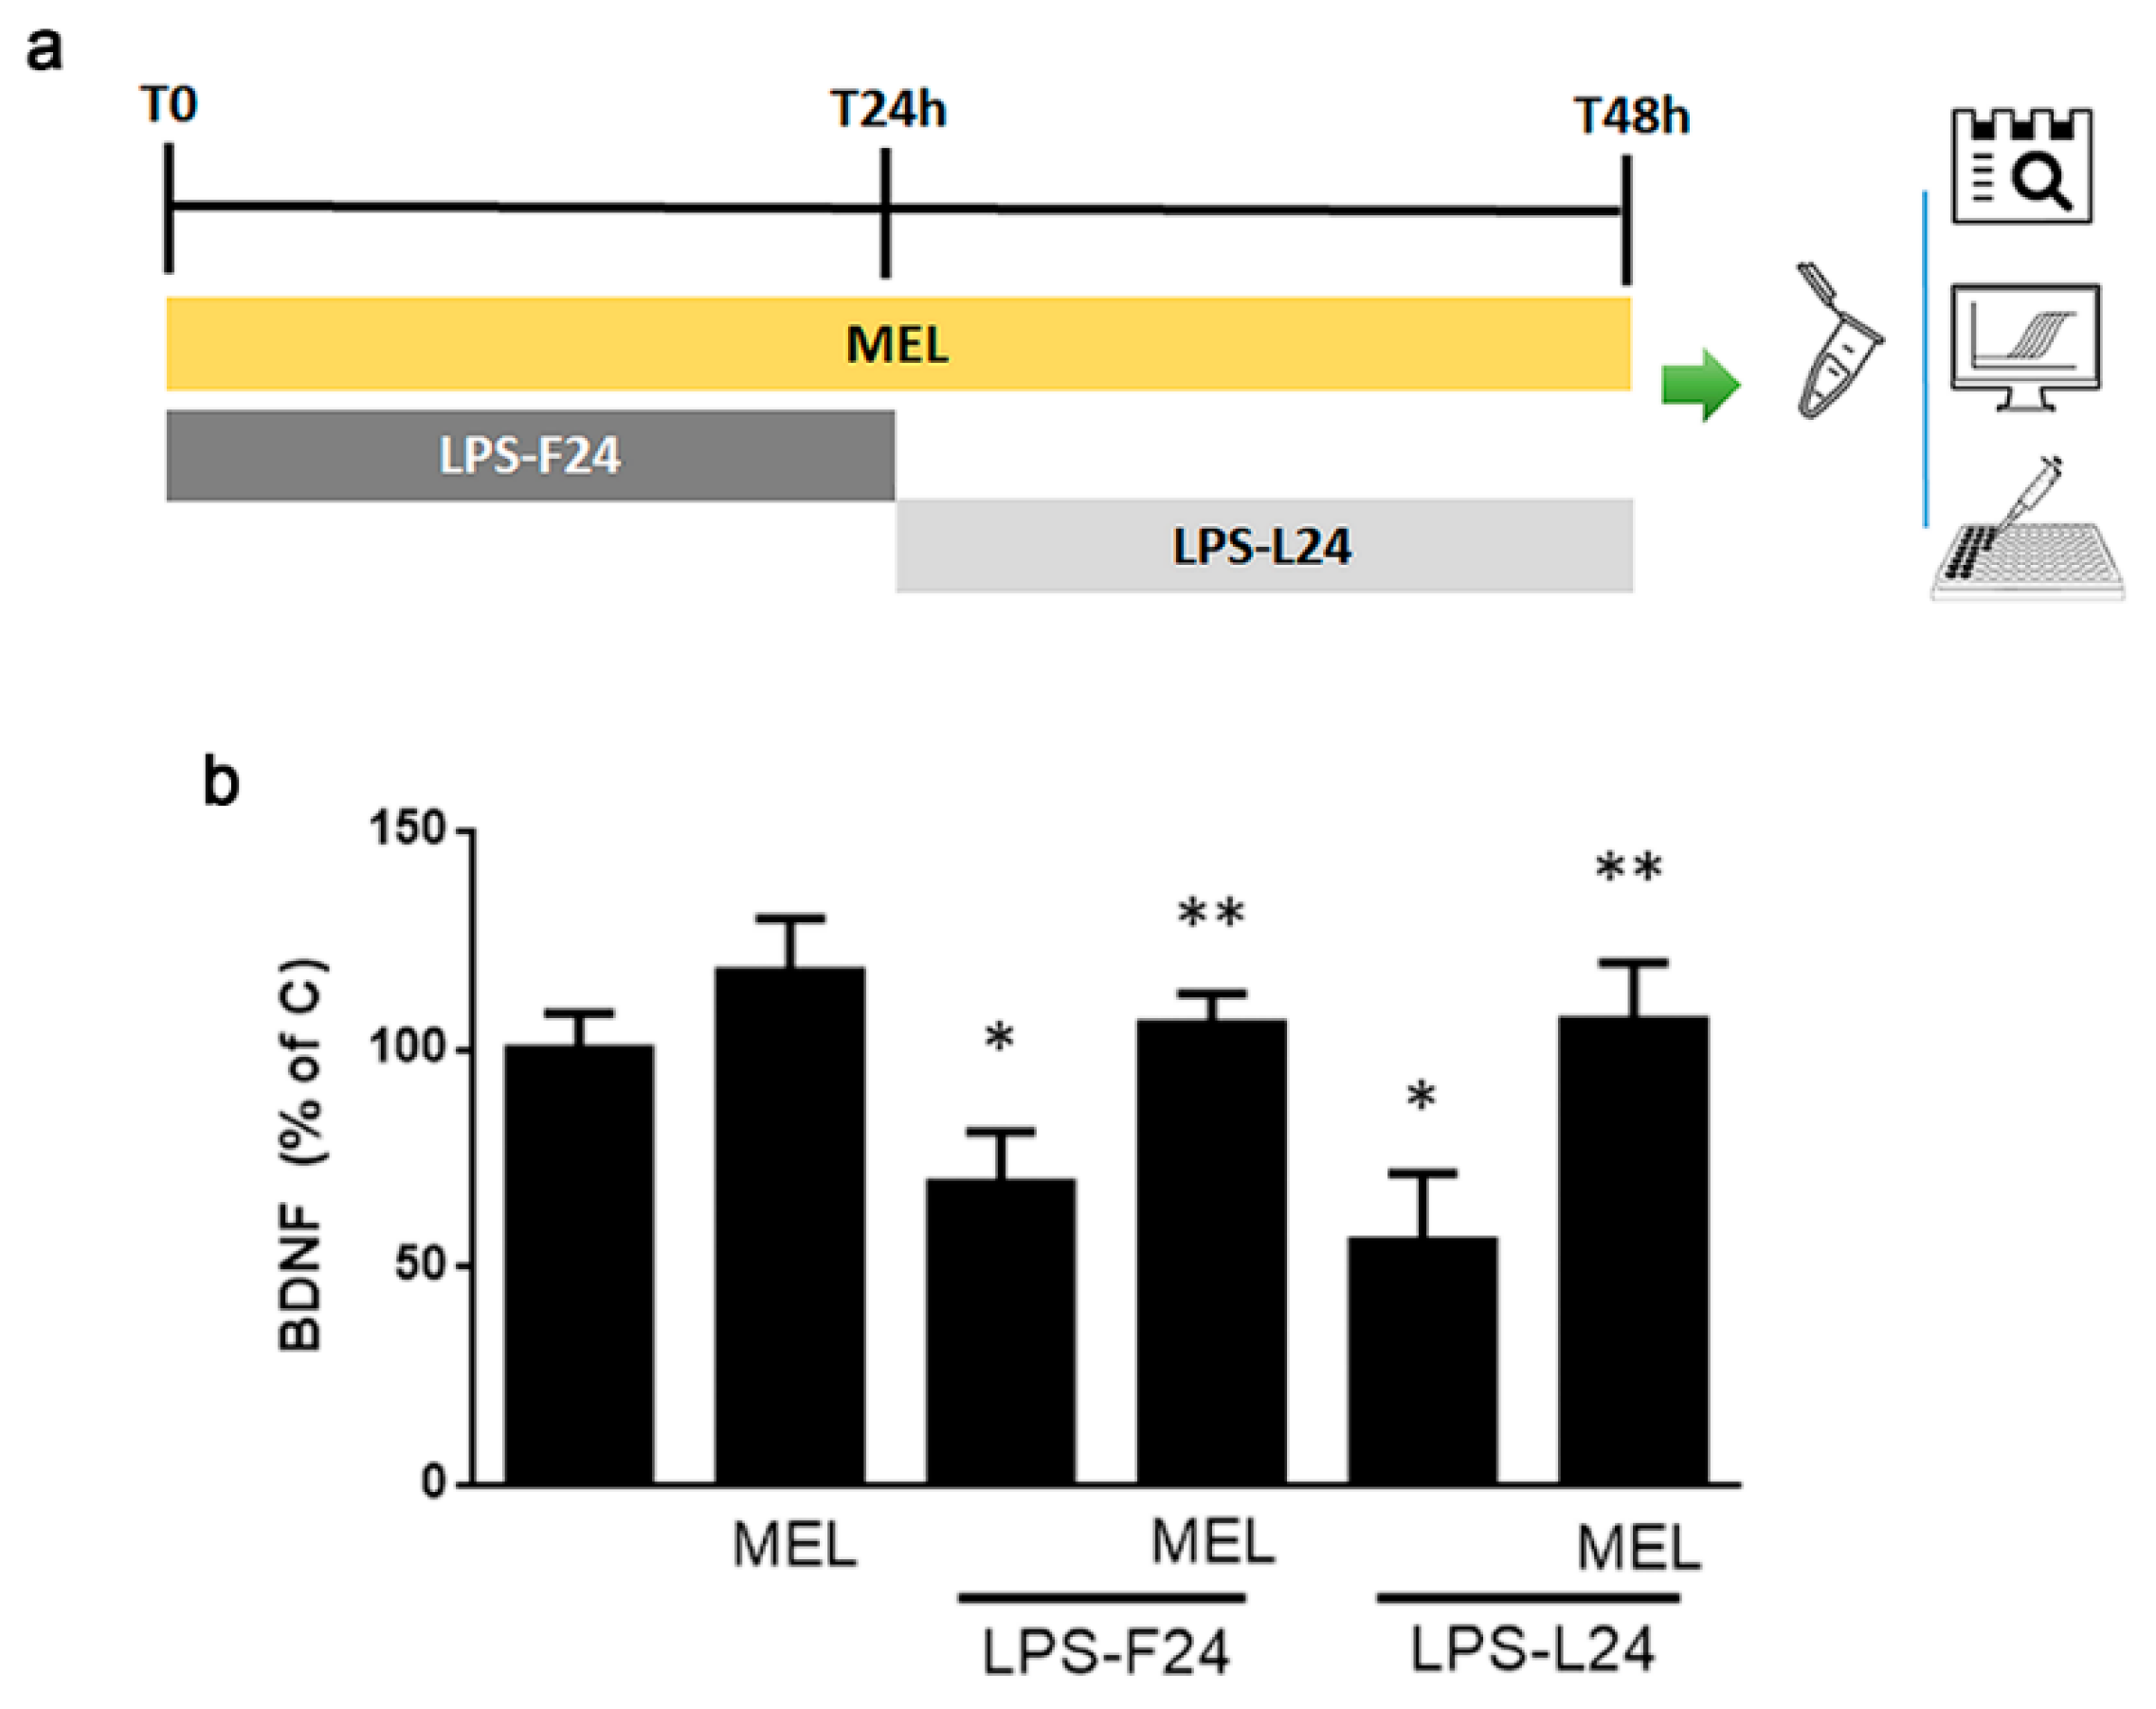
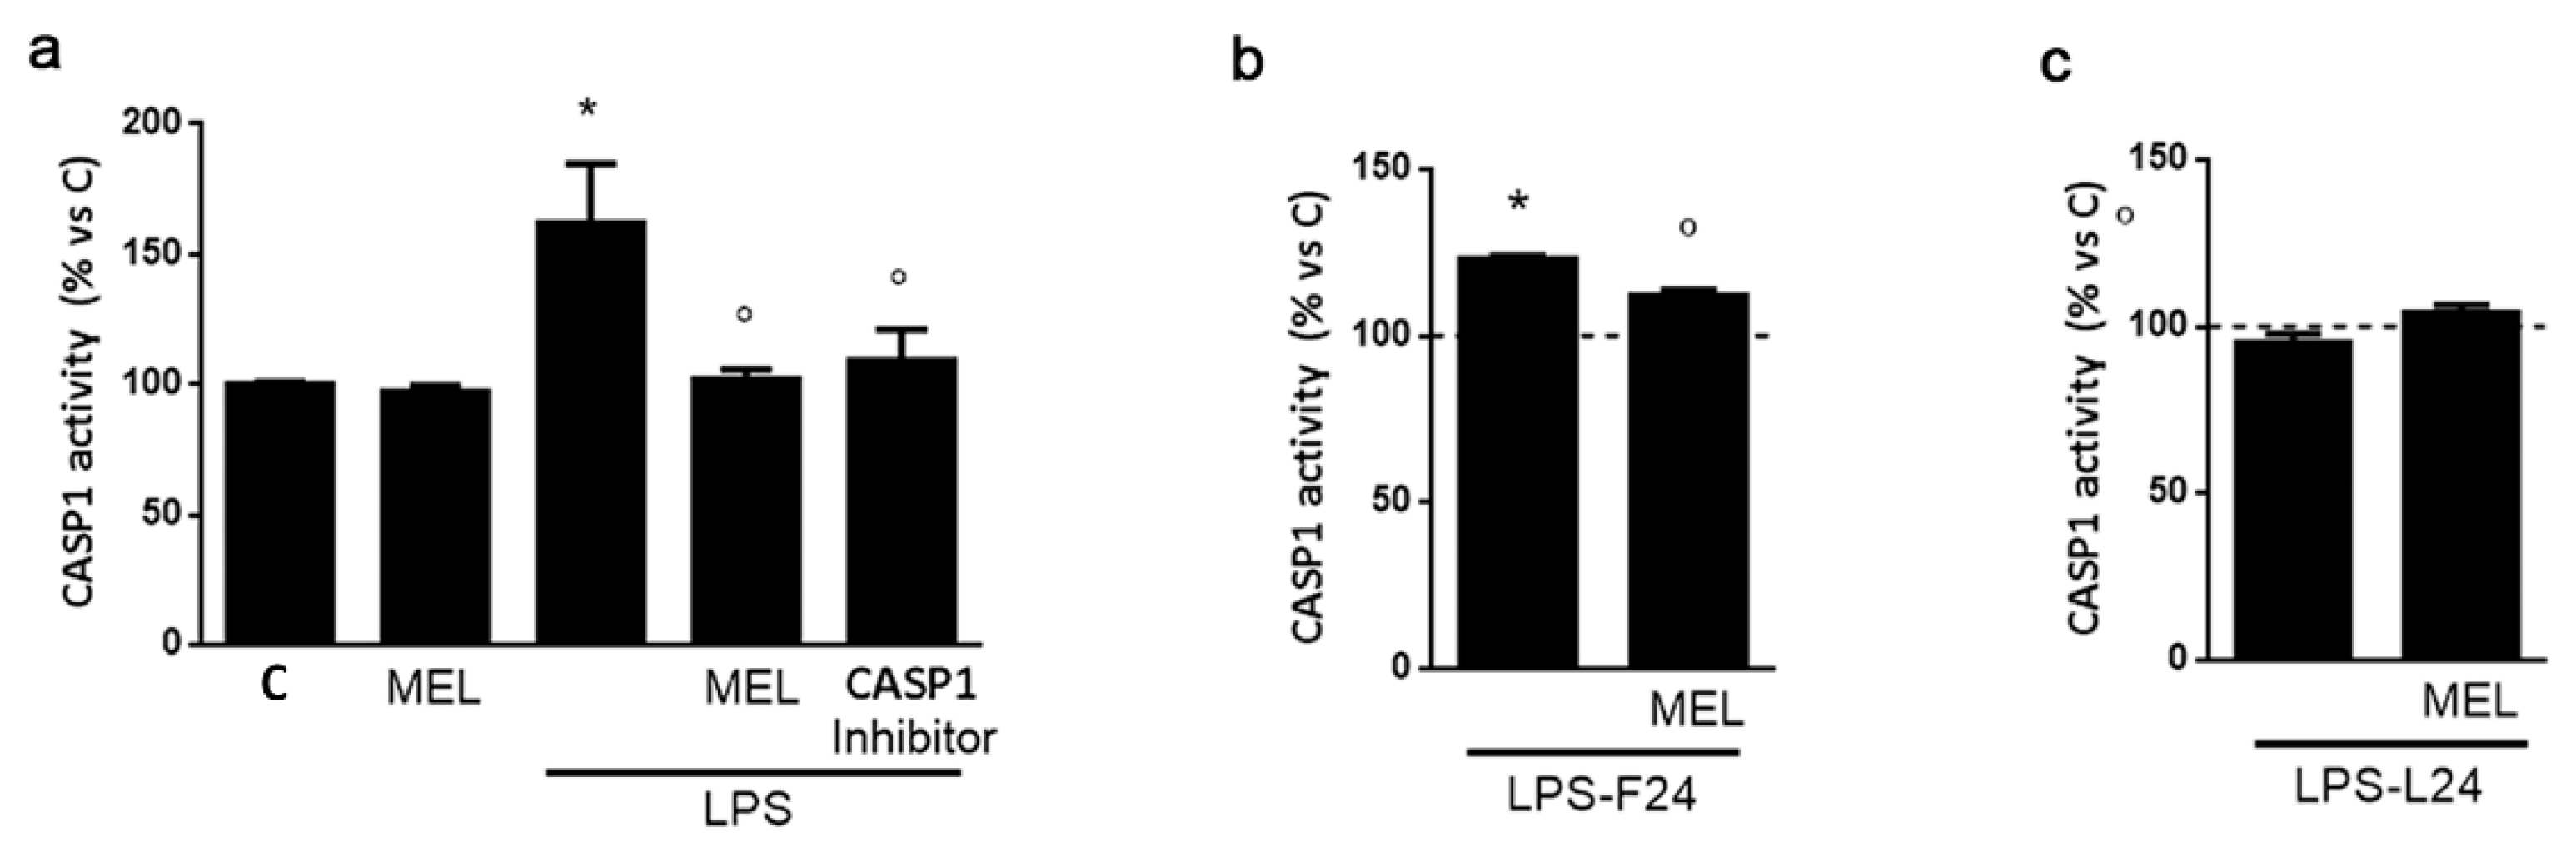
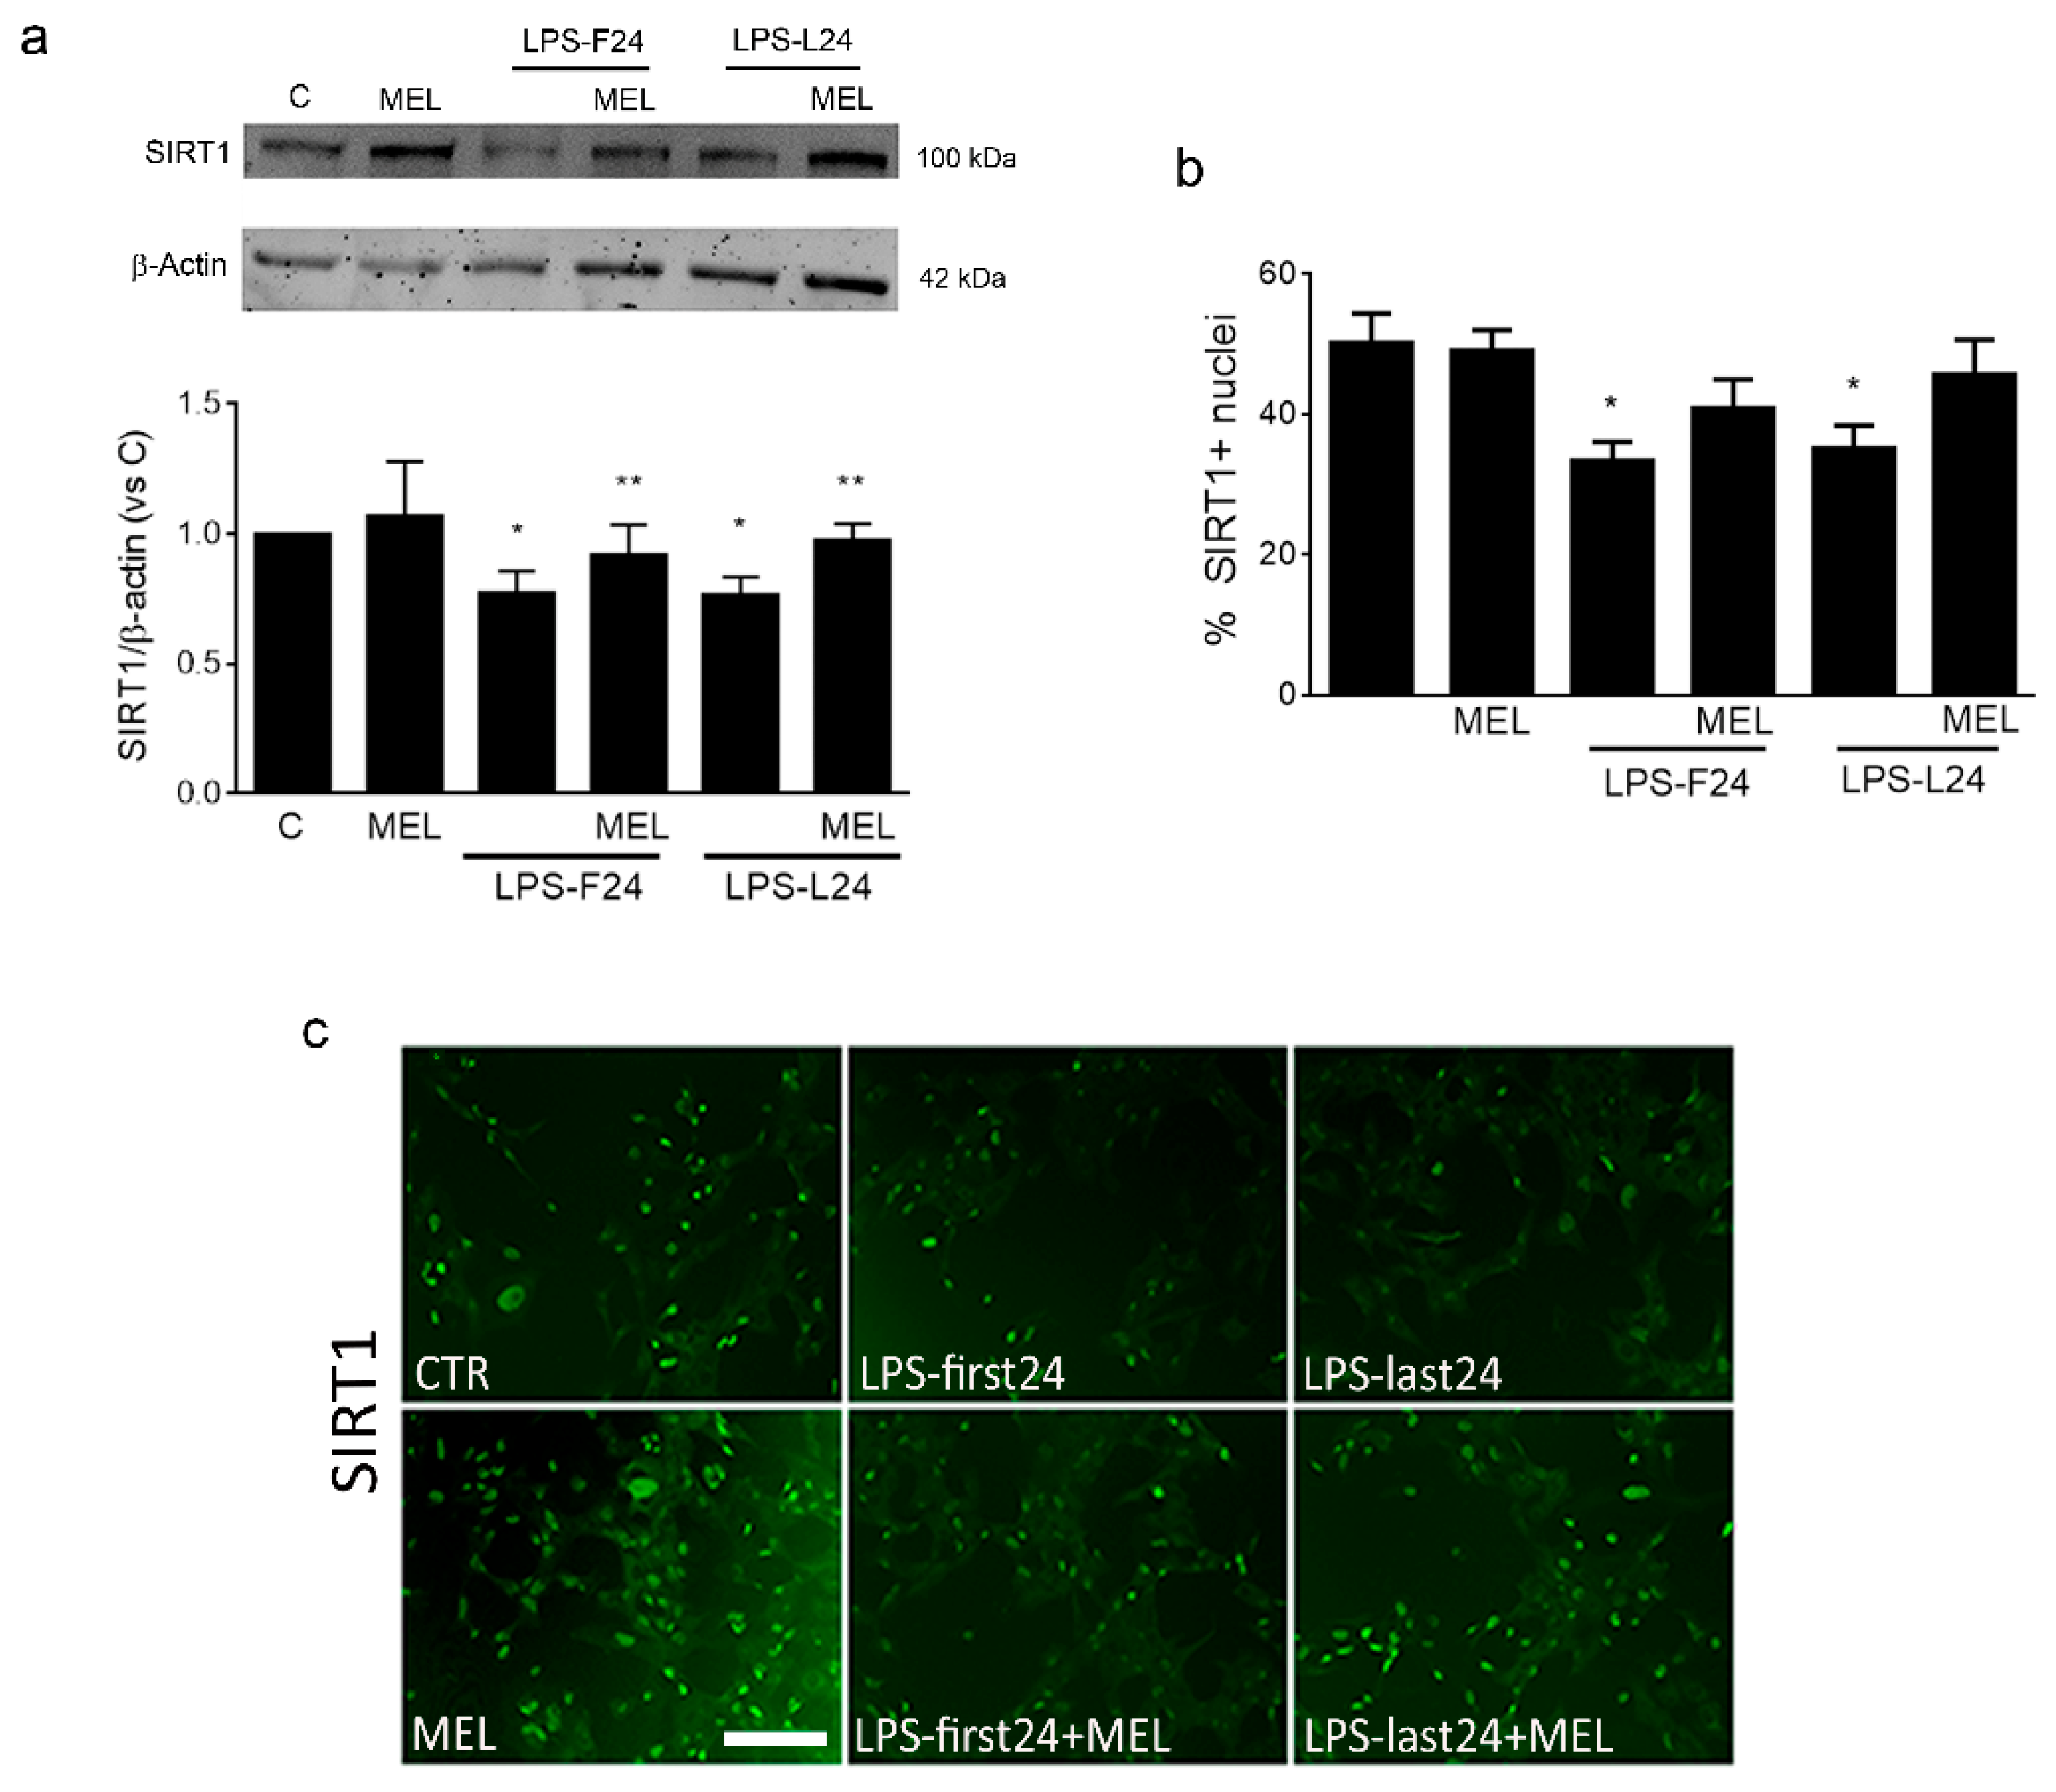
3.4. In HMC3 Microglia MEL Retains Anti-Inflammatory Activity against LPS but Is Devoid of Effects per Se
4. Discussion
Author Contributions
Funding
Institutional Review Board Statement
Conflicts of Interest
References
- Cajochen, C.; Krauchi, K.; Wirz-Justice, A. Role of melatonin in the regulation of human circadian rhythms and sleep. J. Neuroendocrinol. 2003, 15, 432–437. [Google Scholar] [CrossRef] [PubMed] [Green Version]
- Carrascal, L.; Nunez-Abades, P.; Ayala, A.; Cano, M. Role of Melatonin in the Inflammatory Process and its Therapeutic Potential. Curr. Pharm. Des. 2018, 24, 1563–1588. [Google Scholar] [CrossRef] [PubMed]
- Reiter, R.J.; Rosales-Corral, S.; Tan, D.X.; Jou, M.J.; Galano, A.; Xu, B. Melatonin as a mitochondria-targeted antioxidant: One of evolution’s best ideas. Cell. Mol. Life Sci. 2017, 74, 3863–3881. [Google Scholar] [CrossRef] [PubMed]
- Wang, X. The antiapoptotic activity of melatonin in neurodegenerative diseases. CNS Neurosci. Ther. 2009, 15, 345–357. [Google Scholar] [CrossRef]
- Andersen, L.P.; Gogenur, I.; Rosenberg, J.; Reiter, R.J. The Safety of Melatonin in Humans. Clin. Drug Investig. 2016, 36, 169–175. [Google Scholar] [CrossRef]
- Miller, E.; Morel, A.; Saso, L.; Saluk, J. Melatonin redox activity. Its potential clinical applications in neurodegenerative disorders. Curr. Top. Med. Chem. 2015, 15, 163–169. [Google Scholar] [CrossRef]
- Alghamdi, B.S. The neuroprotective role of melatonin in neurological disorders. J. Neurosci. Res. 2018, 96, 1136–1149. [Google Scholar] [CrossRef] [Green Version]
- Chen, D.; Zhang, T.; Lee, T.H. Cellular Mechanisms of Melatonin: Insight from Neurodegenerative Diseases. Biomolecules 2020, 10, 1158. [Google Scholar] [CrossRef]
- Tordjman, S.; Chokron, S.; Delorme, R.; Charrier, A.; Bellissant, E.; Jaafari, N.; Fougerou, C. Melatonin: Pharmacology, Functions and Therapeutic Benefits. Curr. Neuropharmacol. 2017, 15, 434–443. [Google Scholar] [CrossRef]
- Emet, M.; Ozcan, H.; Ozel, L.; Yayla, M.; Halici, Z.; Hacimuftuoglu, A. A Review of Melatonin, Its Receptors and Drugs. Eurasian J. Med. 2016, 48, 135–141. [Google Scholar] [CrossRef]
- Ng, K.Y.; Leong, M.K.; Liang, H.; Paxinos, G. Melatonin receptors: Distribution in mammalian brain and their respective putative functions. Brain Struct. Funct. 2017, 222, 2921–2939. [Google Scholar] [CrossRef]
- Audinot, V.; Bonnaud, A.; Grandcolas, L.; Rodriguez, M.; Nagel, N.; Galizzi, J.P.; Balik, A.; Messager, S.; Hazlerigg, D.G.; Barrett, P.; et al. Molecular cloning and pharmacological characterization of rat melatonin MT1 and MT2 receptors. Biochem. Pharmacol. 2008, 75, 2007–2019. [Google Scholar] [CrossRef] [PubMed]
- Ma, H.; Kang, J.; Fan, W.; He, H.; Huang, F. ROR: Nuclear Receptor for Melatonin or Not? Molecules 2021, 26, 2693. [Google Scholar] [CrossRef] [PubMed]
- Smirnov, A.N. Nuclear melatonin receptors. Biochemistry 2001, 66, 19–26. [Google Scholar] [CrossRef] [PubMed]
- Tan, D.X.; Manchester, L.C.; Terron, M.P.; Flores, L.J.; Tamura, H.; Reiter, R.J. Melatonin as a naturally occurring co-substrate of quinone reductase-2, the putative MT3 melatonin membrane receptor: Hypothesis and significance. J. Pineal. Res. 2007, 43, 317–320. [Google Scholar] [CrossRef] [PubMed]
- Naseem, M.; Parvez, S. Role of melatonin in traumatic brain injury and spinal cord injury. Sci. World J. 2014, 2014, 586270. [Google Scholar] [CrossRef] [Green Version]
- Shen, Z.; Zhou, Z.; Gao, S.; Guo, Y.; Gao, K.; Wang, H.; Dang, X. Melatonin Inhibits Neural Cell Apoptosis and Promotes Locomotor Recovery via Activation of the Wnt/beta-Catenin Signaling Pathway after Spinal Cord Injury. Neurochem. Res. 2017, 42, 2336–2343. [Google Scholar] [CrossRef]
- Paprocka, J.; Kijonka, M.; Rzepka, B.; Sokol, M. Melatonin in Hypoxic-Ischemic Brain Injury in Term and Preterm Babies. Int. J. Endocrinol. 2019, 2019, 9626715. [Google Scholar] [CrossRef]
- Yang, Y.; Jiang, S.; Dong, Y.; Fan, C.; Zhao, L.; Yang, X.; Li, J.; Di, S.; Yue, L.; Liang, G.; et al. Melatonin prevents cell death and mitochondrial dysfunction via a SIRT1-dependent mechanism during ischemic-stroke in mice. J. Pineal. Res. 2015, 58, 61–70. [Google Scholar] [CrossRef]
- Anderson, G.; Reiter, R.J. Melatonin: Roles in influenza, COVID-19, and other viral infections. Rev. Med. Virol. 2020, 30, e2109. [Google Scholar] [CrossRef]
- Reiter, R.J.; Manchester, L.C.; Tan, D.X. Neurotoxins: Free radical mechanisms and melatonin protection. Curr. Neuropharmacol. 2010, 8, 194–210. [Google Scholar] [CrossRef] [PubMed] [Green Version]
- Jurgenson, M.; Zharkovskaja, T.; Noortoots, A.; Morozova, M.; Beniashvili, A.; Zapolski, M.; Zharkovsky, A. Effects of the drug combination memantine and melatonin on impaired memory and brain neuronal deficits in an amyloid-predominant mouse model of Alzheimer’s disease. J. Pharm. Pharmacol. 2019, 71, 1695–1705. [Google Scholar] [CrossRef] [PubMed]
- Hossain, M.F.; Uddin, M.S.; Uddin, G.M.S.; Sumsuzzman, D.M.; Islam, M.S.; Barreto, G.E.; Mathew, B.; Ashraf, G.M. Melatonin in Alzheimer’s Disease: A Latent Endogenous Regulator of Neurogenesis to Mitigate Alzheimer’s Neuropathology. Mol. Neurobiol. 2019, 56, 8255–8276. [Google Scholar] [CrossRef] [PubMed]
- Labban, S.; Alghamdi, B.S.; Alshehri, F.S.; Kurdi, M. Effects of melatonin and resveratrol on recognition memory and passive avoidance performance in a mouse model of Alzheimer’s disease. Behav. Brain Res. 2021, 402, 113100. [Google Scholar] [CrossRef]
- Li, Y.; Zhang, J.; Wan, J.; Liu, A.; Sun, J. Melatonin regulates Abeta production/clearance balance and Abeta neurotoxicity: A potential therapeutic molecule for Alzheimer’s disease. Biomed. Pharmacother. 2020, 132, 110887. [Google Scholar] [CrossRef]
- Mack, J.M.; Schamne, M.G.; Sampaio, T.B.; Pertile, R.A.; Fernandes, P.A.; Markus, R.P.; Prediger, R.D. Melatoninergic System in Parkinson’s Disease: From Neuroprotection to the Management of Motor and Nonmotor Symptoms. Oxid. Med. Cell. Longev. 2016, 2016, 3472032. [Google Scholar] [CrossRef] [Green Version]
- Singhal, N.K.; Srivastava, G.; Agrawal, S.; Jain, S.K.; Singh, M.P. Melatonin as a neuroprotective agent in the rodent models of Parkinson’s disease: Is it all set to irrefutable clinical translation? Mol. Neurobiol. 2012, 45, 186–199. [Google Scholar] [CrossRef]
- Bald, E.M.; Nance, C.S.; Schultz, J.L. Melatonin may slow disease progression in amyotrophic lateral sclerosis: Findings from the Pooled Resource Open-Access ALS Clinic Trials database. Muscle Nerve 2021, 63, 572–576. [Google Scholar] [CrossRef]
- Heneka, M.T.; Kummer, M.P.; Latz, E. Innate immune activation in neurodegenerative disease. Nat. Rev. Immunol. 2014, 14, 463–477. [Google Scholar] [CrossRef]
- DiSabato, D.J.; Quan, N.; Godbout, J.P. Neuroinflammation: The devil is in the details. J. Neurochem. 2016, 139 (Suppl. 2), 136–153. [Google Scholar] [CrossRef] [Green Version]
- Merlo, S.; Spampinato, S.F.; Beneventano, M.; Sortino, M.A. The contribution of microglia to early synaptic compensatory responses that precede beta-amyloid-induced neuronal death. Sci. Rep. 2018, 8, 7297. [Google Scholar] [CrossRef] [PubMed] [Green Version]
- Merlo, S.; Spampinato, S.F.; Sortino, M.A. Early compensatory responses against neuronal injury: A new therapeutic window of opportunity for Alzheimer’s Disease? CNS Neurosci. Ther. 2019, 25, 5–13. [Google Scholar] [CrossRef] [Green Version]
- Bisicchia, E.; Sasso, V.; Molinari, M.; Viscomi, M.T. Plasticity of microglia in remote regions after focal brain injury. Semin. Cell Dev. Biol. 2019, 94, 104–111. [Google Scholar] [CrossRef] [PubMed]
- Yao, K.; Zu, H.B. Microglial polarization: Novel therapeutic mechanism against Alzheimer’s disease. Inflammopharmacology 2020, 28, 95–110. [Google Scholar] [CrossRef]
- Merlo, S.; Spampinato, S.F.; Caruso, G.I.; Sortino, M.A. The Ambiguous Role of Microglia in Abeta Toxicity: Chances for Therapeutic Intervention. Curr. Neuropharmacol. 2020, 18, 446–455. [Google Scholar] [CrossRef] [PubMed]
- Tang, Y.; Le, W. Differential Roles of M1 and M2 Microglia in Neurodegenerative Diseases. Mol. Neurobiol. 2016, 53, 1181–1194. [Google Scholar] [CrossRef] [PubMed]
- Ransohoff, R.M. A polarizing question: Do M1 and M2 microglia exist? Nat. Neurosci. 2016, 19, 987–991. [Google Scholar] [CrossRef]
- Town, T.; Nikolic, V.; Tan, J. The microglial “activation” continuum: From innate to adaptive responses. J. Neuroinflamm. 2005, 2, 24. [Google Scholar] [CrossRef] [Green Version]
- Shah, S.A.; Khan, M.; Jo, M.H.; Jo, M.G.; Amin, F.U.; Kim, M.O. Melatonin Stimulates the SIRT1/Nrf2 Signaling Pathway Counteracting Lipopolysaccharide (LPS)-Induced Oxidative Stress to Rescue Postnatal Rat Brain. CNS Neurosci. Ther. 2017, 23, 33–44. [Google Scholar] [CrossRef]
- Corpas, R.; Revilla, S.; Ursulet, S.; Castro-Freire, M.; Kaliman, P.; Petegnief, V.; Gimenez-Llort, L.; Sarkis, C.; Pallas, M.; Sanfeliu, C. SIRT1 Overexpression in Mouse Hippocampus Induces Cognitive Enhancement through Proteostatic and Neurotrophic Mechanisms. Mol. Neurobiol. 2017, 54, 5604–5619. [Google Scholar] [CrossRef]
- Xu, J.; Jackson, C.W.; Khoury, N.; Escobar, I.; Perez-Pinzon, M.A. Brain SIRT1 Mediates Metabolic Homeostasis and Neuroprotection. Front. Endocrinol. 2018, 9, 702. [Google Scholar] [CrossRef] [PubMed]
- Lim, J.H.; Lee, Y.M.; Chun, Y.S.; Chen, J.; Kim, J.E.; Park, J.W. Sirtuin 1 modulates cellular responses to hypoxia by deacetylating hypoxia-inducible factor 1alpha. Mol. Cell 2010, 38, 864–878. [Google Scholar] [CrossRef] [PubMed]
- Mendes, K.L.; Lelis, D.F.; Santos, S.H.S. Nuclear sirtuins and inflammatory signaling pathways. Cytokine Growth Factor Rev. 2017, 38, 98–105. [Google Scholar] [CrossRef] [PubMed]
- Vaquero, A.; Scher, M.; Lee, D.; Erdjument-Bromage, H.; Tempst, P.; Reinberg, D. Human SirT1 interacts with histone H1 and promotes formation of facultative heterochromatin. Mol. Cell 2004, 16, 93–105. [Google Scholar] [CrossRef]
- Merlo, S.; Luaces, J.P.; Spampinato, S.F.; Toro-Urrego, N.; Caruso, G.I.; D’Amico, F.; Capani, F.; Sortino, M.A. SIRT1 Mediates Melatonin’s Effects on Microglial Activation in Hypoxia: In Vitro and In Vivo Evidence. Biomolecules 2020, 10, 364. [Google Scholar] [CrossRef] [Green Version]
- Caruso, G.I.; Spampinato, S.F.; Costantino, G.; Merlo, S.; Sortino, M.A. SIRT1-Dependent Upregulation of BDNF in Human Microglia Challenged with Abeta: An Early but Transient Response Rescued by Melatonin. Biomedicines 2021, 9, 466. [Google Scholar] [CrossRef]
- Ullrich, C.; Daschil, N.; Humpel, C. Organotypic vibrosections: Novel whole sagittal brain cultures. J. Neurosci. Methods 2011, 201, 131–141. [Google Scholar] [CrossRef] [Green Version]
- Schneider, C.A.; Rasband, W.S.; Eliceiri, K.W. NIH Image to ImageJ: 25 years of image analysis. Nat. Methods 2012, 9, 671–675. [Google Scholar] [CrossRef]
- Singh, N.; Barnych, B.; Wagner, K.M.; Wan, D.; Morisseau, C.; Hammock, B.D. Adrenic Acid-Derived Epoxy Fatty Acids Are Naturally Occurring Lipids and Their Methyl Ester Prodrug Reduces Endoplasmic Reticulum Stress and Inflammatory Pain. ACS Omega 2021, 6, 7165–7174. [Google Scholar] [CrossRef]
- Bartsch, T.; Wulff, P. The hippocampus in aging and disease: From plasticity to vulnerability. Neuroscience 2015, 309, 1–16. [Google Scholar] [CrossRef]
- Johns, J. Estimation of Melatonin Blood Brain Barrier Permeability. J. Bioanal. Biomed. 2011, 03. [Google Scholar] [CrossRef]
- Tan, D.X. Melatonin and brain. Curr. Neuropharmacol. 2010, 8, 161. [Google Scholar] [CrossRef] [PubMed] [Green Version]
- Mahmood, D. Pleiotropic Effects of Melatonin. Drug Res. 2019, 69, 65–74. [Google Scholar] [CrossRef] [PubMed]
- Shukla, M.; Chinchalongporn, V.; Govitrapong, P.; Reiter, R.J. The role of melatonin in targeting cell signaling pathways in neurodegeneration. Ann. N. Y. Acad. Sci. 2019, 1443, 75–96. [Google Scholar] [CrossRef]
- Posadzki, P.P.; Bajpai, R.; Kyaw, B.M.; Roberts, N.J.; Brzezinski, A.; Christopoulos, G.I.; Divakar, U.; Bajpai, S.; Soljak, M.; Dunleavy, G.; et al. Melatonin and health: An umbrella review of health outcomes and biological mechanisms of action. BMC Med. 2018, 16, 18. [Google Scholar] [CrossRef] [PubMed] [Green Version]
- Merlo, S.; Caruso, G.I.; Bonfili, L.; Spampinato, S.F.; Costantino, G.; Eleuteri, A.M.; Sortino, M.A. Microglial polarization differentially affects neuronal vulnerability to the beta-amyloid protein: Modulation by melatonin. Biochem. Pharmacol. 2022, 202, 115151. [Google Scholar] [CrossRef] [PubMed]
- Hardeland, R. Melatonin and Microglia. Int. J. Mol. Sci. 2021, 22, 8296. [Google Scholar] [CrossRef]
- Wang, X.; Sirianni, A.; Pei, Z.; Cormier, K.; Smith, K.; Jiang, J.; Zhou, S.; Wang, H.; Zhao, R.; Yano, H.; et al. The melatonin MT1 receptor axis modulates mutant Huntingtin-mediated toxicity. J. Neurosci. 2011, 31, 14496–14507. [Google Scholar] [CrossRef] [Green Version]
- Gu, C.; Wang, F.; Zhang, Y.T.; Wei, S.Z.; Liu, J.Y.; Sun, H.Y.; Wang, G.H.; Liu, C.F. Microglial MT1 activation inhibits LPS-induced neuroinflammation via regulation of metabolic reprogramming. Aging Cell 2021, 20, e13375. [Google Scholar] [CrossRef]
- Elibol, B.; Kilic, U. High Levels of SIRT1 Expression as a Protective Mechanism Against Disease-Related Conditions. Front. Endocrinol. 2018, 9, 614. [Google Scholar] [CrossRef]
- Vachharajani, V.T.; Liu, T.; Wang, X.; Hoth, J.J.; Yoza, B.K.; McCall, C.E. Sirtuins Link Inflammation and Metabolism. J. Immunol. Res. 2016, 2016, 8167273. [Google Scholar] [CrossRef] [PubMed] [Green Version]
- Caruso, G.I.; Korde, D.S.; Humpel, C. Melatonin supports the survival of cholinergic neurons in organotypic brain slices of the basal nucleus of Meynert. Pharmacology 2023, 1–8. [Google Scholar] [CrossRef] [PubMed]
- Wright-Jin, E.C.; Gutmann, D.H. Microglia as Dynamic Cellular Mediators of Brain Function. Trends Mol. Med. 2019, 25, 967–979. [Google Scholar] [CrossRef] [PubMed]
- Torii, K.; Takagi, S.; Yoshimura, R.; Miyata, S. Microglial proliferation attenuates sickness responses in adult mice during endotoxin-induced inflammation. J. Neuroimmunol. 2022, 365, 577832. [Google Scholar] [CrossRef] [PubMed]
- Pepe, G.; De Maglie, M.; Minoli, L.; Villa, A.; Maggi, A.; Vegeto, E. Selective proliferative response of microglia to alternative polarization signals. J. Neuroinflamm. 2017, 14, 236. [Google Scholar] [CrossRef] [PubMed] [Green Version]
- He, Y.; Taylor, N.; Yao, X.; Bhattacharya, A. Mouse primary microglia respond differently to LPS and poly(I:C) in vitro. Sci. Rep. 2021, 11, 10447. [Google Scholar] [CrossRef]
- Sasaki, Y.; Ohsawa, K.; Kanazawa, H.; Kohsaka, S.; Imai, Y. Iba1 is an actin-cross-linking protein in macrophages/microglia. Biochem. Biophys. Res. Commun. 2001, 286, 292–297. [Google Scholar] [CrossRef]
- Wittekindt, M.; Kaddatz, H.; Joost, S.; Staffeld, A.; Bitar, Y.; Kipp, M.; Frintrop, L. Different Methods for Evaluating Microglial Activation Using Anti-Ionized Calcium-Binding Adaptor Protein-1 Immunohistochemistry in the Cuprizone Model. Cells 2022, 11, 1723. [Google Scholar] [CrossRef]
- Christgen, S.; Place, D.E.; Kanneganti, T.D. Toward targeting inflammasomes: Insights into their regulation and activation. Cell Res. 2020, 30, 315–327. [Google Scholar] [CrossRef] [Green Version]
- Li, H.; Zhang, X.; Chen, M.; Chen, J.; Gao, T.; Yao, S. Dexmedetomidine inhibits inflammation in microglia cells under stimulation of LPS and ATP by c-Fos/NLRP3/caspase-1 cascades. EXCLI J. 2018, 17, 302–311. [Google Scholar] [CrossRef]
- Mayo, J.C.; Sainz, R.M.; Gonzalez Menendez, P.; Cepas, V.; Tan, D.X.; Reiter, R.J. Melatonin and sirtuins: A “not-so unexpected” relationship. J. Pineal. Res. 2017, 62, e12391. [Google Scholar] [CrossRef] [Green Version]
- Guo, P.; Pi, H.; Xu, S.; Zhang, L.; Li, Y.; Li, M.; Cao, Z.; Tian, L.; Xie, J.; Li, R.; et al. Melatonin Improves mitochondrial function by promoting MT1/SIRT1/PGC-1 alpha-dependent mitochondrial biogenesis in cadmium-induced hepatotoxicity in vitro. Toxicol. Sci. 2014, 142, 182–195. [Google Scholar] [CrossRef] [PubMed] [Green Version]
- Yao, C.; Liu, X.; Zhou, Z.; Xiang, Y.; Yuan, S.; Xie, W.; Zhou, M.; Hu, Z.; Li, Y.; Ji, A.; et al. Melatonin attenuates expression of cyclooxygenase-2 (COX-2) in activated microglia induced by lipopolysaccharide (LPS). J. Toxicol. Environ. Health A 2019, 82, 437–446. [Google Scholar] [CrossRef] [PubMed]
- Park, E.; Chun, H.S. Melatonin Attenuates Manganese and Lipopolysaccharide-Induced Inflammatory Activation of BV2 Microglia. Neurochem. Res. 2017, 42, 656–666. [Google Scholar] [CrossRef] [PubMed]
- Min, K.J.; Jang, J.H.; Kwon, T.K. Inhibitory effects of melatonin on the lipopolysaccharide-induced CC chemokine expression in BV2 murine microglial cells are mediated by suppression of Akt-induced NF-kappaB and STAT/GAS activity. J. Pineal. Res. 2012, 52, 296–304. [Google Scholar] [CrossRef] [PubMed]


Disclaimer/Publisher’s Note: The statements, opinions and data contained in all publications are solely those of the individual author(s) and contributor(s) and not of MDPI and/or the editor(s). MDPI and/or the editor(s) disclaim responsibility for any injury to people or property resulting from any ideas, methods, instructions or products referred to in the content. |
© 2023 by the authors. Licensee MDPI, Basel, Switzerland. This article is an open access article distributed under the terms and conditions of the Creative Commons Attribution (CC BY) license (https://creativecommons.org/licenses/by/4.0/).
Share and Cite
Merlo, S.; Caruso, G.I.; Korde, D.S.; Khodorovska, A.; Humpel, C.; Sortino, M.A. Melatonin Activates Anti-Inflammatory Features in Microglia in a Multicellular Context: Evidence from Organotypic Brain Slices and HMC3 Cells. Biomolecules 2023, 13, 373. https://doi.org/10.3390/biom13020373
Merlo S, Caruso GI, Korde DS, Khodorovska A, Humpel C, Sortino MA. Melatonin Activates Anti-Inflammatory Features in Microglia in a Multicellular Context: Evidence from Organotypic Brain Slices and HMC3 Cells. Biomolecules. 2023; 13(2):373. https://doi.org/10.3390/biom13020373
Chicago/Turabian StyleMerlo, Sara, Grazia Ilaria Caruso, Dhwani Sunil Korde, Alla Khodorovska, Christian Humpel, and Maria Angela Sortino. 2023. "Melatonin Activates Anti-Inflammatory Features in Microglia in a Multicellular Context: Evidence from Organotypic Brain Slices and HMC3 Cells" Biomolecules 13, no. 2: 373. https://doi.org/10.3390/biom13020373