Article

From Genetics to Clinical Implications: A Study of 675 Dutch Osteogenesis Imperfecta Patients

by
Silvia Storoni
1,2,†,
Sara J. E. Verdonk
1,2,†,
Lidiia Zhytnik
2,3,4,
Gerard Pals
3,
Sanne Treurniet
1,2,
Mariet W. Elting
3,
Ralph J. B. Sakkers
5,
Joost G. van den Aardweg
6,
Elisabeth M. W. Eekhoff
1,2,*,‡ and
Dimitra Micha
2,3,‡
1
Department of Internal Medicine Section Endocrinology, Amsterdam UMC Location Vrije Universiteit Amsterdam, De Boelelaan 1117, 1081 HV Amsterdam, The Netherlands
2
Rare Bone Disease Center Amsterdam, De Boelelaan 1117, 1081 HV Amsterdam, The Netherlands
3
Department of Human Genetics, Amsterdam UMC Location Vrije Universiteit Amsterdam, De Boelelaan 1117, 1081 HV Amsterdam, The Netherlands
4
Department of Traumatology and Orthopeadics, University of Tartu, L. Puusepa 8, 50406 Tartu, Estonia
5
Department of Orthopedic Surgery, University Medical Center Utrecht, Heidelberglaan 100, 3584 CX Utrecht, The Netherlands
6
Department of Respiratory Medicine, Amsterdam University Medical Center, Location AMC, Meibergdreef 9, 1105 AZ Amsterdam, The Netherlands
*
Author to whom correspondence should be addressed.
These authors contributed equally to this work.
Biomolecules 2023, 13(2), 281; https://doi.org/10.3390/biom13020281
Submission received: 14 December 2022 / Revised: 18 January 2023 / Accepted: 30 January 2023 / Published: 2 February 2023
(This article belongs to the Special Issue Advance in Genomics of Rare Genetic Diseases)

Abstract

:
Osteogenesis imperfecta (OI) is a heritable connective tissue disorder that causes bone fragility due to pathogenic variants in genes responsible for the synthesis of type I collagen. Efforts to classify the high clinical variability in OI led to the Sillence classification. However, this classification only partially takes into account extraskeletal manifestations and the high genetic variability. Little is known about the relation between genetic variants and phenotype as of yet. The aim of the study was to create a clinically relevant genetic stratification of a cohort of 675 Dutch OI patients based on their pathogenic variant types and to provide an overview of their respective medical care demands. The clinical records of 675 OI patients were extracted from the Amsterdam UMC Genome Database and matched with the records from Statistics Netherlands (CBS). The patients were categorized based on their harbored pathogenic variant. The information on hospital admissions, outpatient clinic visits, medication, and diagnosis-treatment combinations (DTCs) was compared between the variant groups. OI patients in the Netherlands appear to have a higher number of DTCs, outpatient clinic visits, and hospital admissions when compared to the general Dutch population. Furthermore, medication usage seems higher in the OI cohort in comparison to the general population. The patients with a COL1A1 or COL1A2 dominant negative missense non-glycine substitution appear to have a lower health care need compared to the other groups, and even lower than patients with COL1A1 or COL1A2 haploinsufficiency. It would be useful to include the variant type in addition to the Sillence classification when categorizing a patient’s phenotype.

1. Introduction

Osteogenesis imperfecta (OI) is a rare hereditary connective tissue disorder characterized by bone fragility and skeletal deformities [1]. The disease, caused by monogenic mutations, leads to different levels of severity; therefore, using a classification system is inescapable [2]. The establishment of a genotype-based classification system that can accurately predict clinical features has been a challenge for the last several decades. The continuous discovery of new genetic causes for OI has resulted in a genotype-based classification system now listing more than 20 OI types [3,4]. The complexity of this system impedes its practicality, while a major issue remains in its inability to provide a description of distinct clinical types. OI is known to be characterized by great interfamilial and intrafamilial clinical variability, which means that it is currently not possible to safely attribute distinct clinical characteristics to each of the genetic OI types [4,5]. Consequently, the clinical classification system, known as the “Sillence classification,” is predominantly used worldwide [6]. The Sillence classification provides five OI types with clinical features ranging from mild to progressively deforming and lethal phenotypes [1,7,8,9]. Although the Sillence classification is currently the most convenient classification system, OI presentation within types still varies widely [9,10]. Furthermore, additional uncertainty is created by the fact that the clinical classification of patients can potentially change during the course of the disease and can be influenced by treatment [6,11,12].
OI is caused by alterations in the production of the collagen type I protein. Collagen type I is composed of two collagen α1(I) chains and one α2(I) chain [13], encoded by the COL1A1 and COL1A2 genes, respectively [14]. In approximately 85% of the OI cases, OI is caused by an autosomal dominant mutation in COL1A1 or COL1A2 [1]. The remaining cases are caused by mainly recessive variants in genes involved in the post-translational modification of the development of correctly folded collagen type I [1,9,15,16]. The phenotype of patients with variants in the COL1A1 and COL1A2 genes is known to be very diverse, possibly leading to all four of the five Sillence types [3]. Sillence type I is the mildest form of OI, and it is commonly caused by haploinsufficiency (HI) [17]. HI is the result of a nonsense, frameshift, or splice site pathogenic variant, causing a premature termination codon in the coding sequence; hence, a null-allele. With only one functional copy of the gene, fewer collagen α1(I) or α2(I) chains (depending on the affected gene) will be produced, resulting in a quantitative defect [18]. Sillence types II, III, and IV are thought to mostly be associated with a qualitative defect in collagen type I. Collagen type I is formed by the triple helix conformation of the two α1(I) and one α2(I) chains [15,17]. The formation of the helix is defined by a strict amino acid sequence pattern, in which glycine is present in every third residue [13,14]. Given its small side chain size, glycine can fit into the center of the collagen triple helix structure without helix distortion [19]. Studies have shown that clinical variations in severity are associated with the location of the variant as well as the affected chain and amino acid [1,10,20]. The structural abnormalities in collagen type I can result from different types of variants, for instance, missense variants, inframe deletions, and insertions. The missense substitutions can involve both glycine and other amino acids. When glycine is replaced, the formation and stability of the triple helix are damaged to a greater extent than compared to the substitution of other amino acids [21]. Consequently, missense substitutions of glycine are reported to occur more often in lethal cases of OI in comparison to other missense substitutions [17,21,22,23].
To date, a genotype-based classification system that can guide medical professionals with disease prognosis and treatment guidelines does not exist. It remains challenging to fully understand how pathogenic variants correlate with clinical features. Investigating the clinical consequences of different types of variants might give insight into the pathophysiological mechanisms underlying OI. In this study, clinical features, such as hospitalizations, outpatient clinic visits, and medication usage, are compared between patients with different pathogenic variant types. This study aims to give insight into the genotype-phenotype correlation, supporting the realization of a possible new classification system that combines both genetic and clinical features of OI. Additionally, this study provides a complete overview of health care demand in the Dutch OI population.

2. Methods

2.1. Study Participants

During the period between December 1991 and April 2021, all patients genetically diagnosed with OI at the national reference center for the molecular diagnosis of OI at the Amsterdam UMC were eligible for inclusion in this study. The pathogenic OI gene variants were identified in COL1A1, COL1A2, CRTAP, TMEM38B, IFITM5, CREB3L1, FKBP10, PLOD2, SP7, SERPINF1, P3H1, BMP1, and PPIB. [15] Pathogenic variants in SERPINH1 and KDELR2 were excluded since these variants had been found in the research setting and were not yet included in the diagnostic database. Based on the type of the pathogenic gene variant, patients were divided into six groups. The groups were haploinsufficiency (HI), dominant negative missense variants in an amino acid other than glycine in either the COL1A1 or COL1A2 gene (DN missense p.other), dominant negative missense variants of glycine substitution in the COL1A1 gene (DN COL1A1 missense glycine), dominant negative variants of glycine substitution in the COL1A2 gene (DN COL1A2 missense glycine), dominant negative inframe deletions or insertions in the COL1A1 or COL1A2 gene (DN inframe deletions or insertions) and recessive variants (recessive). These groups were determined based on the expected effects of the variants [9,17,24,25]. In addition to the patients’ genetic variant, the Sillence classification was provided as evaluated by the referring physician. The patients with OI type V (IFITM5) were excluded; due to the low patient number (<10 patients), this group could not be described.

2.2. Data Extraction

A cohort of 675 patients was extracted from the Amsterdam UMC Genome Database. CBS has anonymized health care data on the Dutch population, which is available for research upon request by health authorities and academic institutions. A match between the Amsterdam UMC Genome Database cohort and the CBS cohort was established in 95% (n = 644) of the OI patients. Information regarding patients’ age and, when applicable, age at time of death (available between 1995 and 2019) was extracted from the CBS database. In addition, data on “Diagnosis Treatment Combination” (DTC), outpatient clinic visits, number of X-rays, hospital admissions, and medication usage were extracted. The Dutch healthcare system makes use of DTCs. A DTC care product is the sum of all consultations, tests, and therapies a patient typically receives in a hospital for a specific diagnosis. Data on the registered medical specialty and the number of DTCs (available between 2013 and 2017) were retrieved. In addition, data on outpatient clinic visits and the number of X-rays were accessible from 2013 to 2017. Visits at the outpatient clinic included consultations and the provision of limited treatment, during which the patient was not admitted to the hospital. Information on the type of consultation (first or follow-up appointment, telephonic consultation, or emergency room visit) and registered medical specialty was extracted. Data on hospitalizations was available from 2013 to 2019. Information on the date of admission, type of admission (inpatient admission or day-care admission), the length of the admission, and the medical specialty at release were all collected. Data on medication usage was available in different years. This included information on the primary anatomical drug class to which the prescription medication belonged [26]. First-line medications, which might have been prescribed by both a general practitioner and a specialist, were included in the retrieved data; however, information on the duration of the prescription was not provided. As information on medication usage during different years could not be compiled due to possible (small) differences in which drugs were accepted as first-line medications, we chose to extract information on medication usage for the year 2017 only.

2.3. Data Analysis

The characteristics of the cohort (age and Sillence classification) were described for the total cohort as well as for the different genetic groups: haploinsufficiency, DN missense p.other, DN COL1A1 missense glycine, DN COL1A2 missense glycine, DN inframe deletions or insertions, recessive. The data is presented as absolute numbers and percentages. For age, the median and the 25th and 75th percentiles were reported.
In addition, the characteristics of hospital admissions, DTCs, and outpatient clinic visits are reported in absolute numbers and percentages. The yearly average number of hospital admissions, DTCs, outpatient clinic visits, and X-rays was reported for the cohort and for the different genetic groups using the mean, median, and standard deviation (SD). The average number of admissions specified per medical specialty per year was reported per 100 patient years. Generalized linear regression analyses were performed to estimate the effects of different pathogenic variants on the number of hospital admissions, number of DTCs, number of outpatient clinic visits, and number of X-rays (on average per year). As age could possibly serve as an effect modifier, when statistically significant, the patients’ mean age during follow-up was added to the model. p-values were adjusted for multiple testing using Tukey’s honest significance difference (HSD) test. A p-value of ≤0.05 was deemed statistically significant. The average number of drug prescriptions in 2017 was reported for the cohort as a whole as well as for seven age categories: 0 to 14, 15 to 24, 25 to 34, 35 to 44, 45 to 64, 65 to 74, and 75 years and older. The group of patients who were 75 years and older was analyzed but not described due to the low patient number. As group numbers would be too low, it was not possible to subdivide according to genetic group based on age.
When possible, health care data was compared to the general Dutch population using public data from the CBS (“www.cbs.nl (last accessed on 1 October 2022)”). Data on the number of hospital admissions, the number of DTCs, and the proportion of people using medication were available for the total Dutch population. Incidence rate ratios (IRR) were calculated for both hospital admissions and DTCs by genetic group for the OI population compared to the total Dutch population. The proportion of patients using medication in the OI cohort was compared to the proportion of people using medication in the total Dutch population based on the aforementioned age categories. The data is reported as percentages.
In order to ensure patient confidentiality, information regarding patient groups lower than 10 is not shown in the results. Groups with fewer than 10 patients are only shown when they cannot be directly traced back to single patients. Descriptive analyses were performed using IBM SPSS Statistics for Windows version 25 (IBM Corporation, Armonk, NY, USA), and for the generalized linear regression analysis, Rstudio v3.6.2 (RStudio: Integrated Development for R., PBC, Boston, MA, USA) was used.

2.4. Ethical Consideration

The Medical Ethics Review Committee (MERC) of the Amsterdam UMC (Amsterdam, The Netherlands) waived the need for ethics approval and the need to obtain consent for the analysis and publication of the retrospectively obtained and anonymized data for this non-intervention study (MERC study number 2021.0085).

3. Results

In total, the Amsterdam UMC genome database consisted of 675 patients genetically diagnosed with OI. Table 1 shows the different pathogenic variant types found in the cohort, including information on the affected gene, exon position, and general information about the type of variant. 353 patients (52%) had a HI variant, 45 patients (7%) had a DN missense p.other variant, 86 patients (13%) had a DN COL1A1 missense glycine variant, 121 patients (18%) had a DN COL1A2 missense glycine variant, 26 patients (4%) had a DN inframe deletion or insertion, and 35 patients (5%) had a recessive variant (Table 1). Information on the suspected Sillence classification was available for 73% (n = 490) of this cohort. Figure 1 shows the distribution of the gene variant groups and the Sillence classification.
A match between the Amsterdam UMC Genome Database cohort and the CBS cohort was established in 95% (n = 644) of the OI patients. In 2019, the median age of patients with a HI variant was 32 years [interquartile range (IQR): 13–48 years], patients with a DN missense p.other variant had a median age of 32 years [IQR: 19–50 years], patients with a DN COL1A1 missense glycine had a median age of 31 years [IQR: 13–43 years], patients with a DN COL1A2 missense glycine had a median age of 30 years [IQR: 9–44 years], patients with a DN inframe deletion or insertion had a median age of 33 years [IQR: 14–58 years], and patients with a recessive variant had a median age of 20 years [IQR: 5–47 years].
In total, 8587 DTCs were opened for OI patients between 2013 and 2017, of which 84% were opened during an outpatient clinic visit, 9% during an admission as a daycare patient, and 7% during an inpatient admission. In Table 2, the IRRs comparing the number of opened DTCs per person in the OI population to the number of DTCs opened in the total Dutch population are presented. For OI patients, a DTC was opened 2.6 times more often per person compared to the total Dutch population. Pairwise comparisons of the generalized linear regression analyses showed that patients with a HI variant had significantly fewer opened DTCs compared to patients with a DN inframe deletion or insertion (Tukey’s HSD adjusted p-value is 0.0078). In addition, statistically significant differences were found between the DN missense p.other and DN COL1A1 missense glycine, DN inframe deletions or insertions, and recessive groups (Tukey’s HSD adjusted p-values are 0.0226, 0.0008, and 0.0220, respectively). In Table 3, the average number of DTCs per year for a patient of 30 years is reported for the different genetic groups.
During the period between 2013 and 2017, 14,315 outpatient clinic visits were registered (for 588 OI patients on average). A total of 26% were first-time outpatient clinic visits, 47% were follow-up outpatient clinic visits, and 9% were emergency clinic visits. OI patients had an average of 4.9 visits per year (median 3.8, SD 4.37). No statistically significant differences were found between the different genetic groups. Table 3 shows the average number of outpatient clinic visits reported per year for a 30-year-old patient. In addition, between 2013 and 2017, 4708 X-rays were performed. The mean number of X-rays per year was 1.60 (median 0.80, SD 2.11). Pairwise comparisons of the generalized linear regression analyses showed that patients with a DN missense p.other variant underwent statistically significantly fewer X-rays compared to patients with a DN COL1A1 missense glycine, DN inframe deletions or insertions, and recessive variants (the Tukey’s HSD adjusted p-values are 0.0192, 0.0198, and 0.0340, respectively). Table 3 shows the average number of X-rays performed per year for a 30-year-old patient in each genetic group.
Additionally, between 2013 and 2019, 2133 hospital admissions were reported in the OI population. A total of 26% of the OI population was never admitted; 41% had one to three admissions, 16% had four to six admissions; 9% had seven to ten admissions, and 7% had more than 11 admissions. The percentage of patients having at least one admission, regarding the different genetic groups, was 56% for DN missense p.other, 73% for HI, 75% for DN COL1A2 missense glycine, 80% for DN COL1A1 missense glycine, 78% for recessive, and 80% for DN inframe deletions or insertions. Table 2 shows the average number of hospital admissions per year per 100 people in the OI population. Patients with a HI or DN missense p.other variant had statistically significantly fewer hospital admissions compared to patients with a DN inframe deletion or insertion (the Tukey’s HSD adjusted p-values are 0.0076 and 0.0052, respectively). In addition, the IRR, representing the mean yearly admissions per OI patient compared to a member of the Dutch population, is reported for the whole OI group as well as per genetic group.
In 2017, a total of 1734 medication prescriptions were registered for 605 OI patients. The average number of drugs used per OI patient 0-14 years old was 1.2 (median 1.0, SD 1.4), which was 2.5 for 15–24 year old patients (median 2.0, SD 2.3), 2.6 for patients 25–34 years old (median 2.0, SD 3.0), 2.9 for patients 35–44 years old (median 2.0, SD 3.0), and 3.7 and 6.0, respectively, for the groups of 55–64 and 65–74 years old (55–64 yr median 5.0, SD 5.0; 65–74 yr median 7.0, SD 3.5). Figure 2 shows the proportion of patients (expressed in percentages) that used medication in 2017 per age category.

4. Discussion

OI is a connective tissue disorder caused by defects in genes involved in the correct formation of collagen type I [27]. The patients with OI present puzzlingly great variability in phenotype [5,11]. A clinical classification system is predominantly used in clinical practice as a genetic classification system confidently predicting clinical features and prognosis is not available. The aim of this study was to provide more insight in the correlation between the type of genetic defect and phenotype. This was performed by examining the medical data in different genetic groups. In doing so, we also aimed to provide a complete overview of the medical care demand among Dutch OI patients.
Additionally, when comparing patient health care demands across the different pathogenic variant groups, there appears to be a recurring pattern. Patients with a DN missense p.other variant seem to have a lower demand for medical care compared to patients with other pathogenic variants. Statistically significant differences were discovered for the number of opened DTCs between patients with DN missense p.other variants and patients with either a DN COL1A1 missense glycine variant, a DN inframe deletion or insertion, or a recessive variant (Table 3). Limited knowledge exists about the effects and clinical severity of DN missense p.other variants, especially in relation to other pathogenic variant types. Geneticists can disagree on the level of pathogenicity. OI patients with p.other, non-glycine missense substitutions are reported to present with variable severity, including mild OI [28,29]. It has been established that the mildest OI type (Sillence type I) is caused by both quantitative (HI) and qualitative variants [17,25]. This was also found in our cohort (Figure 1C). It is interesting to note that in patients with a DN missense p.other variant, a higher percentage of the mildest OI form was detected, compared to patients with other DN variants. The proportion of Sillence OI type I seemed similar in DN missense p.other and HI (Figure 1C); however, due to missing Sillence classification data, this is difficult to assess. Previous research on differences between quantitative and qualitative variants in young adults with OI type I reported no differences in phenotype apart from shorter stature [30]. Although not statistically significant, in our cohort, patients with a DN missense p.other variant seem to have on average fewer DTCs, fewer outpatient clinic visits, and fewer hospital admissions per person per year compared to HI (Table 3). As HI is considered to induce the mildest form of OI, our findings seem to contradict past literature [9,17,24]. It is important to take into account that certain qualitative variants are also likely to cause a mild form of OI, similarly to some glycine substitutions, and treatment options could work differently in people with different genetic backgrounds [31]. This is, for example, the case in the study of Orwell et al., in which teriparatide was hypothesized to be more effective in patients with a quantitative variant and thus more beneficial in patients with OI type I [32]. Future studies are expected to shed light on the clinical characteristics of OI patients with p.other non-glycine missense substitutions.
In our cohort, patients with DN COL1A1 missense glycine variants, DN COL1A2 missense glycine variants, DN inframe deletions or insertions, or recessive variants all seemed to have a higher medical care demand in comparison to patients with a DN missense p.other or an HI variant. Patients with a DN inframe deletion or insertion exhibited the highest medical care demand (Table 2) compared to other pathogenic variant types. Statistically significant differences were found for the number of opened DTCs and the number of hospital admissions between patients with DN inframe deletions or insertions and patients with either a DN missense p.other or an HI variant (Table 3). The effect of deletions and insertions is mostly unknown. In the studies by Maioli et al. and Lindahl et al., out of 587 patients, only three had a deletion; none were reported to have an insertion [17,30]. Of these three patients, two had Sillence type IV, while the Sillence type of the other patient was not reported. According to Byers et al., the majority of deletions they encountered resulted in the lethal OI type, which led them to hypothesize that the disease severity of a deletion likely depends on its location and size [9]. In our cohort, patients had both smaller (<10 exons) and larger deletions and insertions (>10 exons). Due to the small group sizes, we were not able to differentiate based on the size and/or location of the mutations. In our cohort, patients with a DN COL1A1 missense glycine variant appeared to have a higher need for medical care than patients with a DN COL1A2 missense glycine variant. This is in accordance with earlier research, which investigated glycine-to-serine substitutions, the most frequent amino acid substitution [30]. Lindahl et al. identified a more severe phenotype in COL1A1 substitutions, which included lower BMD and stature and a higher presence of dentinogenesis imperfecta. Missense glycine substitutions in COL1A1 were also shown to be more likely to be lethal in the prenatal period than missense glycine variants in COL1A2 [24]. A recent analysis of the entries in the international OI database also demonstrated a higher risk of a lethal phenotype for carriers of glycine substitutions in COL1A1 than COL1A2 [23]. Based on previous literature, recessive variants are believed to cause a relatively severe phenotype [33,34]. This is comparable with our findings: patients with a recessive pathogenic variant demonstrated the second highest need for medical care. We were unable to examine possible differences between recessive genes because of their low number, which necessitated their consideration as one group.
During 2013 and 2019, the Dutch OI population seemed to have, on average, a higher need for hospital care compared to the total Dutch population. Compared to the total Dutch population, patients with OI appeared to have 2.6 times more DTCs and 2.7 times more hospital admissions; in addition, a higher proportion of the OI population used medication (Figure 2). The results of our study support the findings of a Danish study describing the morbidity and mortality of OI patients [35,36]. In addition to a higher demand for medical care, they found a higher risk of death due to respiratory diseases, gastrointestinal diseases, trauma caused by bone fractures, and diseases of the nervous system. Consistent with their findings, our study showed that relatively more OI patients were prescribed medication compared to the total Dutch population for the following categories: alimentary tract and metabolism, respiratory system, cardiovascular system, and nervous system medication (Figure 2). Relatively higher drug use in the aforementioned categories supports the role of extraskeletal complications in terms of morbidity and mortality in OI patients. Although extraskeletal complications in OI are still under-investigated, there is growing awareness concerning the impact of extraskeletal features on OI patients’ health [36,37,38,39,40,41,42,43]. It is important to consider that the category of alimentary tract and metabolic medication also includes vitamin D and calcium. Therefore, the higher use of medication in this category can also be attributed to the use of vitamin D and calcium. Moreover, since the reason for the prescription and the length of drug use are not known, we can only speculate that extraskeletal complications are the cause of the relatively higher number of patients using a certain medication. More research is needed to better understand how extraskeletal complications impact OI patients’ health.
Although a very large cohort of patients with OI was examined, subdividing the patients according to their pathogenic variants resulted in relatively small group sizes. Therefore, it was not possible to differentiate between the location of missense substitutions or to distinguish between deletions and insertions and their sizes. Due to the small group size, all recessive variants are currently combined in one group. For the Sillence classification, we relied on the information communicated by numerous healthcare professionals across the Netherlands who provided this information when requesting the molecular diagnosis. Misclassification of patients cannot be ruled out, considering that classification according to Sillence can be difficult for medical professionals who are not familiar with OI. There are also numerous strengths. The cohort included a large number of OI patients with available genetic characterization. The Amsterdam Genome Database provides a comprehensive overview of the genetic background of the Dutch OI population, since this database is estimated to contain 85% of the Dutch OI population [44]. Using this OI patient cohort, we were able to match genetic groups to health care data. We believe that the health care data we used can provide a derivative of disease severity. The number of outpatient clinic visits and the number of hospital admissions give a clear indication of the consequences of disease on the patients’ quality of life. In addition, DTCs and data on medication use contribute to the understanding of the healthcare needs of OI patients, about which very few studies have been previously conducted [17,30].
In conclusion, our study clearly showed a trend in OI patients with a DN missense p.other variant having the lowest average need for health care, possibly indicating a milder phenotype than HI. In terms of health care demand, DN missense p.other is followed in ascending order by HI, DN COL1A2 missense glycine, DN COL1A1 missense glycine, recessive variants, and DN inframe deletions or insertions. Dutch OI patients seem to have a higher need for medical care compared to the total Dutch population. The increased use of medication in the OI cohort highlights the importance of better understanding the role of extraskeletal features in OI patients, such as cardiac, pulmonary, gastroenterological, and nervous system complications. Currently, when classifying a patient’s phenotype, it would be useful to add the variant type in addition to the Sillence classification. Future research on the effect of the type of variant on the clinical characteristics of OI patients is important in order to understand how we can eventually improve the prediction of the clinical outcome in order to facilitate an accurate prognosis, treatment, and follow-up.

Author Contributions

Conceptualization, S.S., S.J.E.V., L.Z., G.P., M.W.E., J.G.v.d.A., E.M.W.E. and D.M.; Methodology, S.S., S.J.E.V., L.Z. and G.P.; Validation, S.J.E.V., G.P., E.M.W.E. and D.M.; Formal analysis, S.S. and S.J.E.V.; Data curation, L.Z., G.P., E.M.W.E. and D.M.; Writing—original draft, S.S., S.J.E.V., J.G.v.d.A. and E.M.W.E.; Writing—review & editing, S.S., S.J.E.V., L.Z., G.P., S.T., M.W.E., R.J.B.S., J.G.v.d.A., E.M.W.E. and D.M.; Supervision, J.G.v.d.A., E.M.W.E. and D.M. All authors listed have made a substantial, direct, and intellectual contribution to the work and have approved it for publication. All authors have read and agreed to the published version of the manuscript.

Funding

This research received no external funding.

Institutional Review Board Statement

The study was conducted in accordance with the Declaration of Helsinki, and approved by the Institutional Review Board of The Medical Ethics Review Committee (MERC) of the Amsterdam UMC (Amsterdam, The Netherlands) (MERC study number 2021.0085).

Informed Consent Statement

Patient consent was waived due to the retrospectively obtained and anonymized data for a non-intervention study.

Data Availability Statement

The original contributions presented in the study are included in the article. Further inquiries can be directed to the corresponding author.

Acknowledgments

We would like to acknowledge J. Claesen from the epidemiology and biostatistics department of the Amsterdam UMC for providing support with statistical analyses.

Conflicts of Interest

The authors declare no conflict of interest.

References

  1. Marini, J.C.; Forlino, A.; Bächinger, H.P.; Bishop, N.J.; Byers, P.H.; Paepe, A.; Fassier, F.; Fratzl-Zelman, N.; Kozloff, K.M.; Krakow, D.; et al. Osteogenesis imperfecta. Nat. Rev. Dis. Prim. 2017, 3, 17052. [Google Scholar] [CrossRef]
  2. Forlino, A.; Marini, J.C. Osteogenesis imperfecta. Lancet 2016, 387, 1657–1671. [Google Scholar] [CrossRef]
  3. Marom, R.; Rabenhorst, B.M.; Morello, R. Osteogenesis imperfecta: An update on clinical features and therapies. Eur. J. Endocrinol. 2020, 183, R95–R106. [Google Scholar] [CrossRef]
  4. Mortier, G.R.; Cohn, D.H.; Cormier-Daire, V.; Hall, C.; Krakow, D.; Mundlos, S.; Nishimura, G.; Robertson, S.; Sangiorgi, L.; Savarirayan, R.; et al. Nosology and classification of genetic skeletal disorders: 2019 revision. Am. J. Med. Genet. A 2019, 179, 2393–2419. [Google Scholar] [CrossRef]
  5. Zhytnik, L.; Maasalu, K.; Reimand, T.; Duy, B.H.; Kõks, S.; Märtson, A. Inter- and Intrafamilial Phenotypic Variability in Individuals with Collagen-Related Osteogenesis Imperfecta. Clin. Transl. Sci. 2020, 13, 960–971. [Google Scholar] [CrossRef]
  6. Sillence, D.O.; Senn, A.; Danks, D.M. Genetic heterogeneity in osteogenesis imperfecta. J. Med. Genet. 1979, 16, 101–116. [Google Scholar] [CrossRef]
  7. van Dijk, F.S.; Cobben, J.M.; Kariminejad, A.; Maugeri, A.; Nikkels, P.G.; van Rijn, R.R.; Pals, G. Osteogenesis Imperfecta: A Review with Clinical Examples. Mol. Syndromol. 2011, 2, 1–20. [Google Scholar] [CrossRef]
  8. Van Dijk, F.S.; Sillence, D.O. Osteogenesis imperfecta: Clinical diagnosis, nomenclature and severity assessment. Am. J. Med. Genet. A 2014, 164, 1470–1481. [Google Scholar] [CrossRef] [PubMed]
  9. Byers, P.H.; Wallis, G.A.; Willing, M.C. Osteogenesis imperfecta: Translation of mutation to phenotype. J. Med. Genet. 1991, 28, 433–442. [Google Scholar] [CrossRef]
  10. Symoens, S.; Hulmes, D.J.; Bourhis, J.M.; Coucke, P.J.; De Paepe, A.; Malfait, F. Type I procollagen C-propeptide defects: Study of genotype-phenotype correlation and predictive role of crystal structure. Hum. Mutat. 2014, 35, 1330–1341. [Google Scholar] [CrossRef]
  11. Sillence, D.O.; Rimoin, D.L.; Danks, D.M. Clinical variability in osteogenesis imperfecta-variable expressivity or genetic heterogeneity. Birth Defects Orig. Artic. Ser. 1979, 15, 113–129. [Google Scholar]
  12. Monti, E.; Mottes, M.; Fraschini, P.; Brunelli, P.; Forlino, A.; Venturi, G.; Doro, F.; Perlini, S.; Cavarzere, P.; Antoniazzi, F. Current and emerging treatments for the management of osteogenesis imperfecta. Ther. Clin. Risk Manag. 2010, 6, 367–381. [Google Scholar] [CrossRef] [PubMed]
  13. Ramachandran, G.N. Molecular structure of collagen. Int. Rev. Connect. Tissue Res. 1963, 1, 127–182. [Google Scholar] [CrossRef]
  14. Rich, A.; Crick, F.H. The molecular structure of collagen. J. Mol. Biol. 1961, 3, 483–506. [Google Scholar] [CrossRef] [PubMed]
  15. Claeys, L.; Storoni, S.; Eekhoff, M.; Elting, M.; Wisse, L.; Pals, G.; Bravenboer, N.; Maugeri, A.; Micha, D. Collagen transport and related pathways in Osteogenesis Imperfecta. Hum. Genet. 2021, 140, 1121–1141. [Google Scholar] [CrossRef]
  16. Leiden Open Variation Database. The Human Varione Project: Disease #05296 Osteogenesis Imperfecta. Available online: https://databases.lovd.nl/shared/diseases/05296 (accessed on 17 November 2022).
  17. Maioli, M.; Gnoli, M.; Boarini, M.; Tremosini, M.; Zambrano, A.; Pedrini, E.; Mordenti, M.; Corsini, S.; D’Eufemia, P.; Versacci, P.; et al. Genotype-phenotype correlation study in 364 osteogenesis imperfecta Italian patients. Eur. J. Hum. Genet. 2019, 27, 1090–1100. [Google Scholar] [CrossRef]
  18. Byers, P.H. Collagens: Building blocks at the end of the development line. Clin. Genet. 2000, 58, 270–279. [Google Scholar] [CrossRef]
  19. Bella, J.; Eaton, M.; Brodsky, B.; Berman, H.M. Crystal and molecular structure of a collagen-like peptide at 1.9 A resolution. Science 1994, 266, 75–81. [Google Scholar] [CrossRef]
  20. Raghunath, M.; Bruckner, P.; Steinmann, B. Delayed triple helix formation of mutant collagen from patients with osteogenesis imperfecta. J. Mol. Biol. 1994, 236, 940–949. [Google Scholar] [CrossRef]
  21. Marini, J.C.; Forlino, A.; Cabral, W.A.; Barnes, A.M.; San Antonio, J.D.; Milgrom, S.; Hyland, J.C.; Körkkö, J.; Prockop, D.J.; De Paepe, A.; et al. Consortium for osteogenesis imperfecta mutations in the helical domain of type I collagen: Regions rich in lethal mutations align with collagen binding sites for integrins and proteoglycans. Hum. Mutat. 2007, 28, 209–221. [Google Scholar] [CrossRef]
  22. Xiao, J.; Cheng, H.; Silva, T.; Baum, J.; Brodsky, B. Osteogenesis imperfecta missense mutations in collagen: Structural consequences of a glycine to alanine replacement at a highly charged site. Biochemistry 2011, 50, 10771–10780. [Google Scholar] [CrossRef] [PubMed] [Green Version]
  23. Garibaldi, N.; Besio, R.; Dalgleish, R.; Villani, S.; Barnes, A.M.; Marini, J.C.; Forlino, A. Dissecting the phenotypic variability of osteogenesis imperfecta. Dis. Model. Mech. 2022, 15, dmm049398. [Google Scholar] [CrossRef] [PubMed]
  24. Ben Amor, I.M.; Glorieux, F.H.; Rauch, F. Genotype-phenotype correlations in autosomal dominant osteogenesis imperfecta. J. Osteoporos. 2011, 2011, 540178. [Google Scholar] [CrossRef]
  25. Yang, L.; Liu, B.; Dong, X.; Wu, J.; Sun, C.; Xi, L.; Cheng, R.; Wu, B.; Wang, H.; Tong, S.; et al. Clinical severity prediction in children with osteogenesis imperfecta caused by COL1A1/2 defects. Osteoporos. Int. 2022, 33, 1373–1384. [Google Scholar] [CrossRef]
  26. WHO Collaborating Centre for Drug Statistics Methodology. ATC/DDD Index 2022. Available online: https://www.whocc.no/atc_ddd_index (accessed on 14 November 2022).
  27. Nijhuis, W.H.; Eastwood, D.M.; Allgrove, J.; Hvid, I.; Weinans, H.H.; Bank, R.A.; Sakkers, R.J. Current concepts in osteogenesis imperfecta: Bone structure, biomechanics and medical management. J. Child. Orthop. 2019, 13, 1–11. [Google Scholar] [CrossRef]
  28. Makareeva, E.; Sun, G.; Mirigian, L.S.; Mertz, E.L.; Vera, J.C.; Espinoza, N.A.; Yang, K.; Chen, D.; Klein, T.E.; Byers, P.H.; et al. Substitutions for arginine at position 780 in triple helical domain of the α1(I) chain alter folding of the type I procollagen molecule and cause osteogenesis imperfecta. PLoS ONE 2018, 13, e0200264. [Google Scholar] [CrossRef]
  29. Pollitt, R.; McMahon, R.; Nunn, J.; Bamford, R.; Afifi, A.; Bishop, N.; Dalton, A. Mutation analysis of COL1A1 and COL1A2 in patients diagnosed with osteogenesis imperfecta type I-IV. Hum. Mutat. 2006, 27, 716. [Google Scholar] [CrossRef]
  30. Lindahl, K.; Åström, E.; Rubin, C.J.; Grigelioniene, G.; Malmgren, B.; Ljunggren, Ö.; Kindmark, A. Genetic epidemiology, prevalence, and genotype-phenotype correlations in the Swedish population with osteogenesis imperfecta. Eur. J. Hum. Genet. 2015, 23, 1042–1050. [Google Scholar] [CrossRef]
  31. Starman, B.J.; Eyre, D.; Charbonneau, H.; Harrylock, M.; Weis, M.A.; Weiss, L.; Graham, J.M., Jr.; Byers, P.H. Osteogenesis imperfecta. The position of substitution for glycine by cysteine in the triple helical domain of the pro alpha 1(I) chains of type I collagen determines the clinical phenotype. J. Clin. Investig. 1989, 84, 1206–1214. [Google Scholar] [CrossRef]
  32. Orwoll, E.S.; Shapiro, J.; Veith, S.; Wang, Y.; Lapidus, J.; Vanek, C.; Reeder, J.L.; Keaveny, T.M.; Lee, D.C.; Mullins, M.A.; et al. Evaluation of teriparatide treatment in adults with osteogenesis imperfecta. J. Clin. Investig. 2014, 124, 491–498. [Google Scholar] [CrossRef]
  33. Rohrbach, M.; Giunta, C. Recessive osteogenesis imperfecta: Clinical, radiological, and molecular findings. Am. J. Med. Genet. C Semin. Med. Genet. 2012, 160C, 175–189. [Google Scholar] [CrossRef]
  34. Baldridge, D.; Schwarze, U.; Morello, R.; Lennington, J.; Bertin, T.K.; Pace, J.M.; Pepin, M.G.; Weis, M.; Eyre, D.R.; Walsh, J.; et al. CRTAP and LEPRE1 mutations in recessive osteogenesis imperfecta. Hum. Mutat. 2008, 29, 1435–1442. [Google Scholar] [CrossRef]
  35. Folkestad, L.; Hald, J.D.; Canudas-Romo, V.; Gram, J.; Hermann, A.P.; Langdahl, B.; Abrahamsen, B.; Brixen, K. Mortality and Causes of Death in Patients With Osteogenesis Imperfecta: A Register-Based Nationwide Cohort Study. J. Bone Miner. Res. 2016, 31, 2159–2166. [Google Scholar] [CrossRef]
  36. Folkestad, L. Mortality and morbidity in patients with osteogenesis imperfecta in Denmark. Dan. Med. J. 2018, 65, B5454. [Google Scholar]
  37. Storoni, S.; Treurniet, S.; Micha, D.; Celli, M.; Bugiani, M.; van den Aardweg, J.G.; Eekhoff, E.M.W. Pathophysiology of respiratory failure in patients with osteogenesis imperfecta: A systematic review. Ann. Med. 2021, 53, 1676–1687. [Google Scholar] [CrossRef]
  38. Khan, S.I.; Yonko, E.A.; Carter, E.M.; Dyer, D.; Sandhaus, R.A.; Raggio, C.L. Cardiopulmonary Status in Adults with Osteogenesis Imperfecta: Intrinsic Lung Disease May Contribute More Than Scoliosis. Clin. Orthop. Relat. Res. 2020, 478, 2833–2843. [Google Scholar] [CrossRef]
  39. McAllion, S.J.; Paterson, C.R. Causes of death in osteogenesis imperfecta. J. Clin. Pathol. 1996, 49, 627–630. [Google Scholar] [CrossRef]
  40. Ashournia, H.; Johansen, F.T.; Folkestad, L.; Diederichsen, A.C.; Brixen, K. Heart disease in patients with osteogenesis imperfecta—A systematic review. Int. J. Cardiol. 2015, 196, 149–157. [Google Scholar] [CrossRef]
  41. Rush, E.T.; Li, L.; Goodwin, J.L.; Kreikemeier, R.M.; Craft, M.; Danford, D.A.; Kutty, S. Echocardiographic phenotype in osteogenesis imperfecta varies with disease severity. Heart 2017, 103, 443–448. [Google Scholar] [CrossRef]
  42. Carré, F.; Achard, S.; Rouillon, I.; Parodi, M.; Loundon, N. Hearing impairment and osteogenesis imperfecta: Literature review. Eur. Ann. Otorhinolaryngol. Head Neck Dis. 2019, 136, 379–383. [Google Scholar] [CrossRef]
  43. Treurniet, S.; Burger, P.; Ghyczy, E.A.E.; Verbraak, F.D.; Curro-Tafili, K.R.; Micha, D.; Bravenboer, N.; Ralston, S.H.; de Vries, R.; Moll, A.C.; et al. Ocular characteristics and complications in patients with osteogenesis imperfecta: A systematic review. Acta Ophthalmol. 2022, 100, e16–e28. [Google Scholar] [CrossRef]
  44. Storoni, S.; Treurniet, S.; Maugeri, A.; Pals, G.; van den Aardweg, J.G.; van der Pas, S.L.; Elting, M.W.; Kloen, P.; Micha, D.; Eekhoff, E.M.W. Prevalence and Hospital Admissions in Patients With Osteogenesis Imperfecta in The Netherlands: A Nationwide Registry Study. Front. Endocrinol. 2022, 13, 869604. [Google Scholar] [CrossRef]
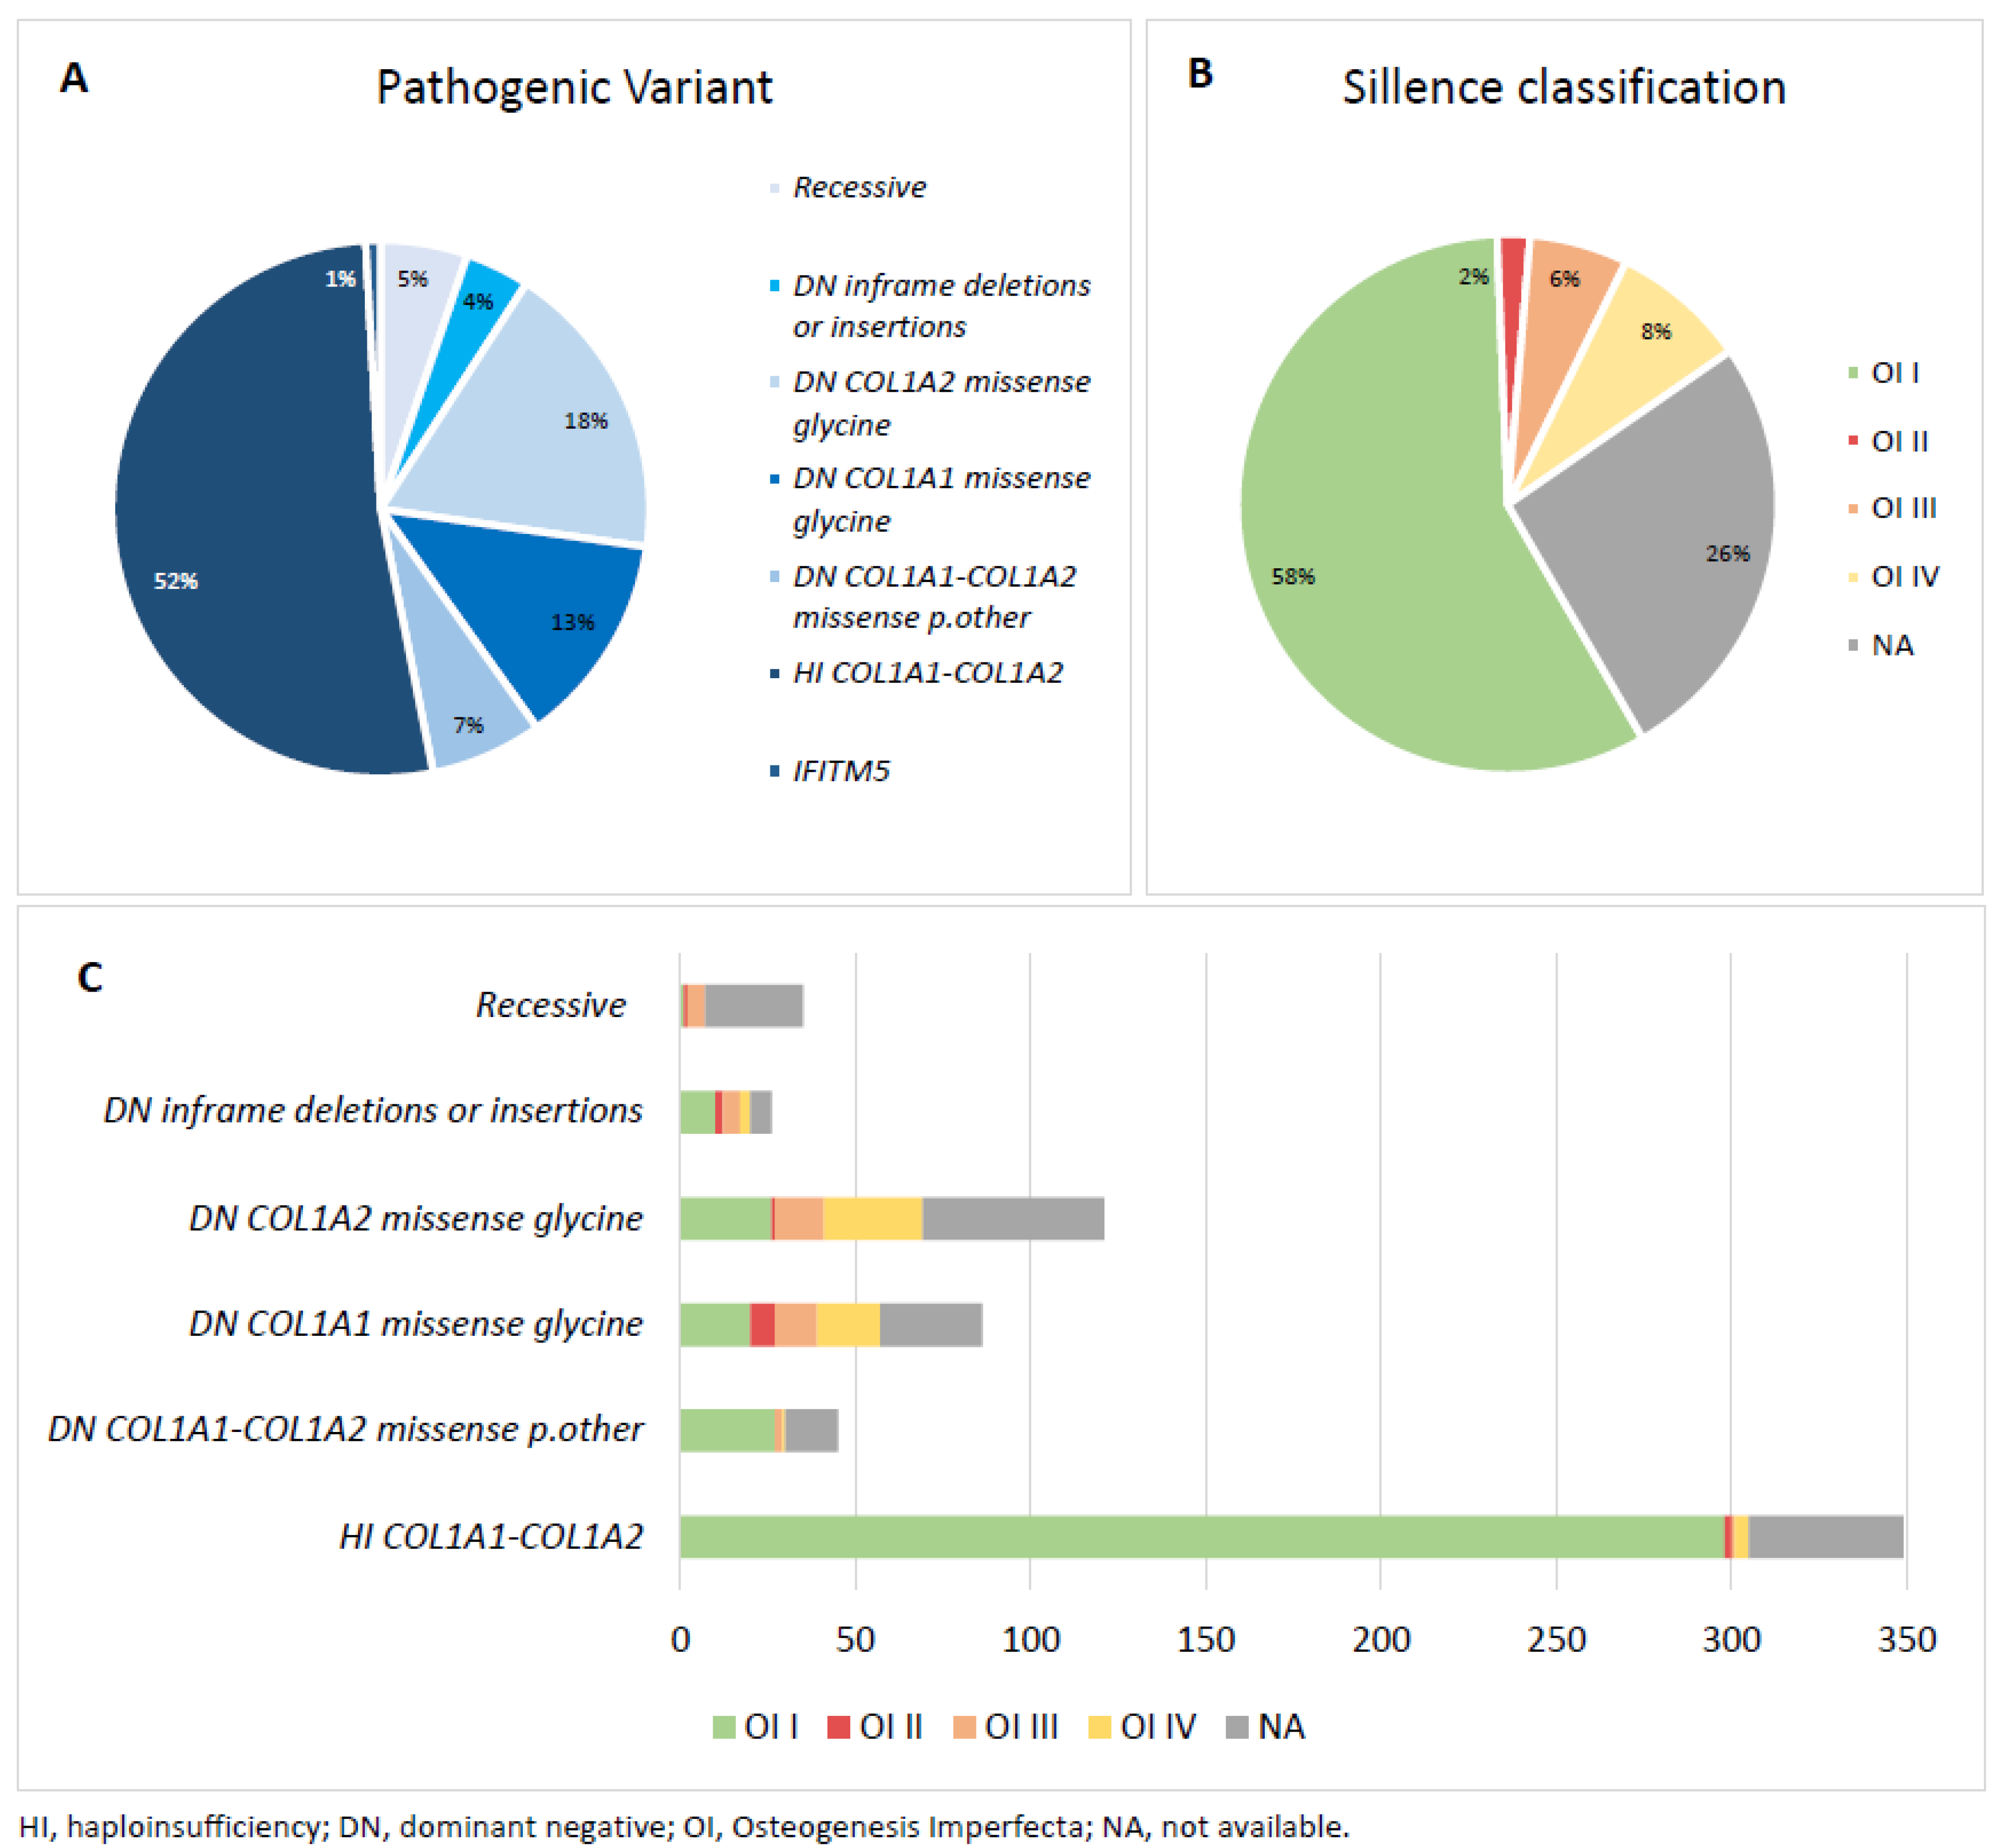
Figure 1. (A) The distribution of pathogenic variants found in the Dutch OI cohort. (B) The distribution of Sillence classification types in the Dutch OI cohort. (C) Combined overview of the Sillence classification type and pathogenic variants found in the Dutch OI cohort.
Biomolecules 13 00281 g001
Figure 2. Proportion of the Dutch OI cohort and total Dutch population using medication belonging to specific ATC categories.OI, Osteogenesis Imperfecta; Y, year. * Due to low patient number exact percentage is not shown (* = <4%). Further information on ATC categories: “https://www.whocc.no/atc_ddd_index/” (last accessed on 14 November 2022).
Biomolecules 13 00281 g002
Table 1. Pathogenic variants identified in the Dutch Osteogenesis Imperfecta cohort.
Pathogenic Variants Total
675
HI COL1A1-COL1A2
HI COL1A1 349
HI COL1A2 <10
DN COL1A1-COL1A2 missense p.other 45
DN COL1A1 missense p.other: exon 1–5<10
exon 6–10<10
exon 11–42<10
exon 43–48<10
exon 49–51<10
DN COL1A2 missense p.other: exon 1–5<10
exon 6–10<10
exon 11–42<10
exon 43–48<10
exon 49–51<10
DN COL1A1 missense glycine 86
DN COL1A1 missense glycine: exon 6–10<10
exon 11–42 63
exon 43–48<20
DN COL1A2 missense glycine 121
DN COL1A2 missense glycine: exon 1–5<10
exon 6–10<10
exon 11–42108
exon 43–48<10
exon 49–51<10
DN inframe deletions or insertions 26
DN COL1A1 inframe deletion exon 1–5<10
exon 6–10<10
exon 11–42<10
DN COL1A1 inframe insertion: exon 11–42<10
DN COL1A2 inframe deletion: exon 6–10<10
exon 11–42<10
exon 43–48<10
DN COL1A2 inframe insertion: exon 11–42<10
exon 43–48<10
Recessive 35
CRTAP, TMEM38B, CREB3L1, FKBP10, PLOD2, SP7, SERPINF1, P3H1, BMP, PPIB
IFITM5 <10
HI, haploinsufficiency; DN, dominant negative. Due to patient confidentiality, group numbers lower than 10 cannot be shown.
Table 2. The number of diagnosis-treatment combinations and hospital admissions in the Dutch OI cohort compared to the total Dutch cohort.
A The Number of Diagnosis Treatment Combinations per Person in the OI Cohort Compared to the Total Dutch Population on Average during 2013–2017
Medical SpecialtyDN Missense p.OtherHIDN COL1A2 Missense GlycineDN COL1A1 Missense GlycineRecessiveDN Inframe Deletions or InsertionsTotal
Total1.82.42.83.13.34.12.6
Ophthalmology0.91.11.00.81.31.91.1
Otolaryngology1.72.32.51.41.33.32.2
Surgery1.93.22.33.41.72.02.9
Surgery (plastics)0.91.71.40.710.26.51.7
Orthopedic surgery4.66.38.29.39.213.27.4
Urology0.10.90.71.11.30.20.8
Gynecology2.11.52.31.40.61.01.6
Dermatology0.90.80.50.92.00.70.9
Internal medicine1.11.81.52.31.82.61.7
Pediatrics6.68.412.711.213.413.29.9
Gastroenterology1.30.80.60.5000.7
Cardiology0.60.70.40.41.00.30.6
Pulmonology1.61.41.85.25.43.62.3
Rheumatology0.50.90.60.44.42.40.8
Rehabilitation11.515.325.429.228.054.020.9
Geriatrics02.001.41.301.2
Anesthesiology0.31.31.93.02.62.71.6
Clinical genetics 17.622.831.224.434.645.825.8
Audiology3.77.58.79.0013.97.5
B The number of hospital admissions per 100 people on average per year in the dutch OI cohort during 2013–2019
Medical specialtyDN missense p.otherHIDN COL1A2 missense glycineDN COL1A1 missense glycinerecessiveDN inframe deletions or insertions Total
Total36.059.885.491.5112.4124.071.5per 100 people
Pediatrics12.020.941.642.261.449.629.6per 100 people
Surgery4.09.86.410.511.010.49.0per 100 people
Orthopedic surgery8.410.318.523.122.828.014.4per 100 people
Internal medicine0.92.54.33.41.424.83.7per 100 people
Neurology01.71.73.42.83.21.9per 100 people
Otolaryngology2.73.11.52.04.11.62.6per 100 people
Ophthalmology01.10.40.32.11.60.9per 100 people
Gynecology3.12.75.72.60.70.83.1per 100 people
Gastroenterology4.02.51.30.60.70.82.0per 100 people
Cardiology0.41.40.80.61.401.0per 100 people
Pulmonology01.40.80.900.81.0per 100 people
Urology00.90.80.90.70.80.8per 100 people
Dentistry0.40.60.90.92.80.80.8per 100 people
Other00.90.80.30.70.80.7per 100 people
The number of hospital admissions per person in the OI cohort compared to the total dutch population on average between during 2013–2019
Mean yearly admission rate in total Dutch population 0.19
Mean yearly admission rate in the OI cohort 0.26 (median: 0.1, std. dev: 0.4)0.43 (median: 0.3, std. dev: 0.5)0.61 (median: 0.3, std. dev: 0.9)0.65 (median: 0.3, std. dev: 0.8)0.8 (median: 0.4, std. dev: 1.1)0.89 (median: 0.6, std. dev: 1.0)0.51 (median: 0.3, std. dev: 0.7)
Incidence rate ratio OI cohort vs. total Dutch population1.352.253.213.444.234.66 2.69
A. Numbers should be interpreted as follows: an OI patient belonging to a specific genetic group has X times more chance of having a DTC in use compared to a person in the total Dutch population during 2013–2017. B. In the first part, the numbers should be interpreted as follows: 100 OI patients belonging to a specific genetic group had X hospital admissions on average during 2013–2019. In the second part, the number of hospital admissions in the Dutch OI cohort is compared to the number of hospital admissions in the total Dutch population. Numbers should be interpreted as follows: an OI patient belonging to a specific genetic group has X times more chance of having a hospital admission compared to a person in the total Dutch population during 2013–2019. DTC, diagnosis-treatment combination; OI, Osteogenesis Imperfecta; DN, dominant negative; HI, haploinsufficiency.
Table 3. The average number of units of medical care used per year for different genetic groups of the Dutch OI cohort.
Hospital Admissions (2013–2019)Exp (Estimate)95% CI
HI0.410.33–0.50
DN missense p.other0.240.13–0.45
DN COL1A1 missense glycine0.580.42–0.81
DN COL1A2 missense glycine0.530.40–0.71
DN inframe deletions or insertions0.890.56–1.41ⱡ,ꬸ
Recessive0.660.43–1.00
Diagnosis treatment combinations (DTCs) (2013–2017)Exp (estimate)95% CI
HI2.682.32–3.08
DN missense p.other2.041.52–2.72ꬸ,ꬷ,†
DN COL1A1 missense glycine3.412.76–4.21
DN COL1A2 missense glycine3.062.54–3.67
DN inframe deletions or insertions4.593.34–6.30ⱡ,ꬸ
Recessive3.762.78–5.08
Outpatient clinic visits (2013–2017)Exp (estimate)95% CI
HI4.664.01–5.41
DN missense p.other3.732.79–4.99
DN COL1A1 missense glycine5.514.39–6.91
DN COL1A2 missense glycine4.803.95–5.83
DN inframe deletions or insertions6.374.47–9.08
Recessive5.744.13–7.98
X-rays (2013–2017)Exp (estimate)95% CI
HI1.371.13–1.67
DN missense p.other0.910.60–1.40ꬸ,ꬷ,†
DN COL1A1 missense glycine1.931.44–2.59
DN COL1A2 missense glycine1.661.29–2.14
DN inframe deletions or insertions2.301.46–3.61
Recessive2.091.38–3.16
Presented is the data of the pairwise comparisons of the generalized linear regression analyses. The numbers should be interpreted as follows: a 30-year-old osteogenesis imperfecta patient belonging to a specific genetic group has on average X medical care units per year. Medical care units are the number of hospital admissions, the number of opened DTCs, the number of outpatient clinic visits, or the number of X-rays. ⱡ, ꬸ, ꬷ, † show if a statistically significant difference was found between two groups. DTC, diagnosis-treatment combination; OI, Osteogenesis Imperfecta; HI, haploinsufficiency, DN, dominant negative.
Disclaimer/Publisher’s Note: The statements, opinions and data contained in all publications are solely those of the individual author(s) and contributor(s) and not of MDPI and/or the editor(s). MDPI and/or the editor(s) disclaim responsibility for any injury to people or property resulting from any ideas, methods, instructions or products referred to in the content.

