1. Introduction
Lung cancer is the leading cause of cancer mortality, with the second-highest incidence rate worldwide as of 2020 [
1]. Lung cancer has two major histological subtypes, non-small-cell lung cancer (NSCLC) and small-cell lung cancer. NSCLC, which accounts for approximately 85% of all lung cancers, can be further subdivided into lung adenocarcinoma (LUAD), lung squamous cell carcinoma (LUSC), and large cell carcinoma. At a drastically low level, lung cancer survival trends have shown some improvements from 26% among men with NSCLC at the time of diagnosis in 2001 to 35% among men diagnosed in 2014; this tendency is also true for women with NSCLC, and this improvement in NSCLC survival has also been confirmed for all races and ethnicities [
2]. This observed progress in survival has taken advantage of targeted therapies and immunotherapies based on targetable or actionable gene mutations (e.g.,
EGFR,
BRAF, and
KRAS) and fusion/rearrangements (i.e.,
ALK,
ROS-1,
RET,
NTRK) [
3,
4,
5,
6,
7,
8,
9]. However, because a considerable number of patients are diagnosed at advanced stages and/or are negative for targetable gene alterations, there remains an immense clinical need for diagnosis as early as possible to increase the therapeutic response rate, low recurrence, and, ultimately, increase the survival rate. Aside from actionable mutations or structural variants, non-idiopathic, common diagnostic modalities are necessary for successful and effective early diagnosis of cancers.
Particularly in lung cancer, radiological images and histopathological phenotypes are more adequately considered as gold standards in tumor diagnosis and staging, but are also crucial predictors of response to therapies and prognosis. Further, artificial intelligence, primarily machine learning (ML) and deep learning (DL), has been successfully implemented in oncology in collaboration with radiology or histopathology to maximize sensitivity, specificity, and precision, especially in lung cancer [
10,
11,
12]. In addition, combined with the ML/DL model, next-generation sequencing-based single omics, representing a part of the entire pool of genome, transcriptome, methylome, proteome, and metabolome, has gradually evolved not only to diagnose lung cancer but also guide therapeutic decision-making [
13,
14,
15,
16,
17]. Numerous efforts have been made to develop the ML/DL algorithm, providing decision support tools that assist clinicians to correctly diagnose cancers. However, the implementation of classical diagnostic methods and single omics still has not resulted in sufficient resolution to prove causal relationships among genotypes, molecular aberrations, and etiological phenotypes. Each set of omics data may present its own key features associated with aspects such as transcription, post-translational modification, metabolic pathways, gene–environment interactions, the immune system, and the tumor microenvironment. Therefore, if integrated adequately, multi-omics analysis is reasonably expected to provide a more comprehensive view on cancer biomarker signatures and untangle the complexity of cancer initiation, progression, and metastasis in a synergistic manner.
Among such attempts, graph convolutional network (GCN)-based models have proven useful in multi-omics data stratification, correlation learning, weighted value order, and biomarker feature identification [
18,
19]. Thus, in this study, by applying the directed acyclic graph structure into the GCN architecture, we successfully integrated multi-modal features into a cancer prediction model. We primarily focused on the integration of omics features derived from RNA sequencing and DNA methylation sequencing. Subsequently, we evaluated the lung cancer prediction performance of the proposed model by means of sensitivity, specificity, accuracy, precision, area under the curve–receiver operating characteristic (AUC-ROC), macro F1-score, and weighted F1-score in comparison with those of other ML/DL models.
Implementing a screening program to diagnose patients at an early stage is a critical factor to decrease lung cancer-related deaths and improve survival. This multimodal model may provide a solid basis for early diagnosis of NSCLC.
2. Materials and Methods
2.1. Dataset
The lung cancer patient data comprised DNA sequencing, gene expression, and DNA methylation (
Table 1). Baseline demographic data were retrieved and anonymized (
Table 2).
The Gene Expression Omnibus (GEO) database is used as an authorized array- and sequence-based database in cancer-related studies. Gene expression and DNA methylation data were retrieved to build the study dataset from June to August 2021.
The RNA-sequencing data (including mRNA, microRNA, and long non-coding RNA) of lung cancer were obtained from The Cancer Genome Atlas (TCGA) data repository in June–August 2021. RNA-sequencing data of patients with LUAD derived from TCGA contained 504 samples: stage I (n = 274), stage II (n = 120), stage III (n = 84), and stage IV (n = 26). Patients with LUSC were classified as stage I (n = 242), stage II (n = 160), stage III (n = 84), and stage IV (n = 7).
DNA methylation data of LUAD retrieved from the GDC Portal (
https://portal.gdc.cancer.gov (accessed on 14 May 2021) included 502 patients: stage I (n = 279), stage II (n = 120), stage III (n = 81), and stage IV (n = 22). For LUSC patients, the data comprised stage I (n = 199), stage II (n = 142), stage III (n = 62), stage IV (n = 5). Genomic data, including single nucleotide variants (SNV), indels, fusions, and rearrangements, from 818 patients with NSCLC were obtained from the same GDC portal. GTEx was developed in an ongoing effort to establish a comprehensive public resource for studying tissue-specific gene expression and regulation. In this study, 578 lung samples from nondiseased GTEx v8 tissues were used.
Somatic mutations, single nucleotide polymorphisms, and gene expression data utilized in this study were mapped to protein-coding regions to make it easier to perceive the results and integrate all omics data.
2.2. Mathematical Concepts
Considering message passing as information flow, the aim of our main model is to build a function of data features on a subgraph of a multimodal data graph
, with node set
and edge set
, which assists binary classifications with respect to each single-omics data item. To train this function, each GCN module in the model utilizes two types of matrices: the weight matrix
induced from each single-omics data item and the relation network among nodes in the subgraph. However, to produce matrices of two different types, one GCN module requires only one single-omics data item, not two inputs. To input single-omics data into the module, we represent it as a feature matrix
, where
is the number of samples, and
is the number of input features. We set
differently with respect to the size of each dataset, and
differently with respect to the characteristics of the data, as described in
Section 3.1.
In this module, an adjacency matrix is formed with respect to each . In this study, we set such that between nodes and node , where , are the rows of is the cosine similarity, and if and otherwise. Furthermore, we set if for some threshold , which was determined empirically. From this point forward, we focus on the mathematical structure of our model.
An original GCN can be constructed by multiple graph convolutional layers,
where
is the input of the
-th layer such that
, and
is the weight matrix of the
-th layer. Here,
denotes an activation function, for which we choose LeakyReLU with a slope of 0.25 for the negative
-axis. Using the Kipf–Welling method [
20], we can change
to the rearranged adjacency matrix
, which is expressed as follows:
where
with the identity matrix
, and
is a degree matrix such that
. We take
as an adjacency matrix for each of our GCN modules.
Using the
-th single-omics data matrix
and
-optimized GCN module
, we can obtain the predicted label matrix
. Here, we denote
to the
-th row of
. For the common true label matrix
and its
-th row
, the cross-entropy loss function on the GCN–fully connected (FC) module can be written as
where
denotes the cross-entropy function. Similarly, in the terminal FC layer, namely the Mutation FC layer, the cross-entropy loss can be evaluated as follows:
where
denotes the layer operation on the Mutation FC layer, which includes two single-omics feature concatenations and rule-based filtering to match most suitable anti-cancer agent derived from DNA sequencing data. In brief, the total loss function
of our model is as follows:
with
. Empirically, we set
for the stability of the model.
2.3. DL Model Architecture and Weight Optimization
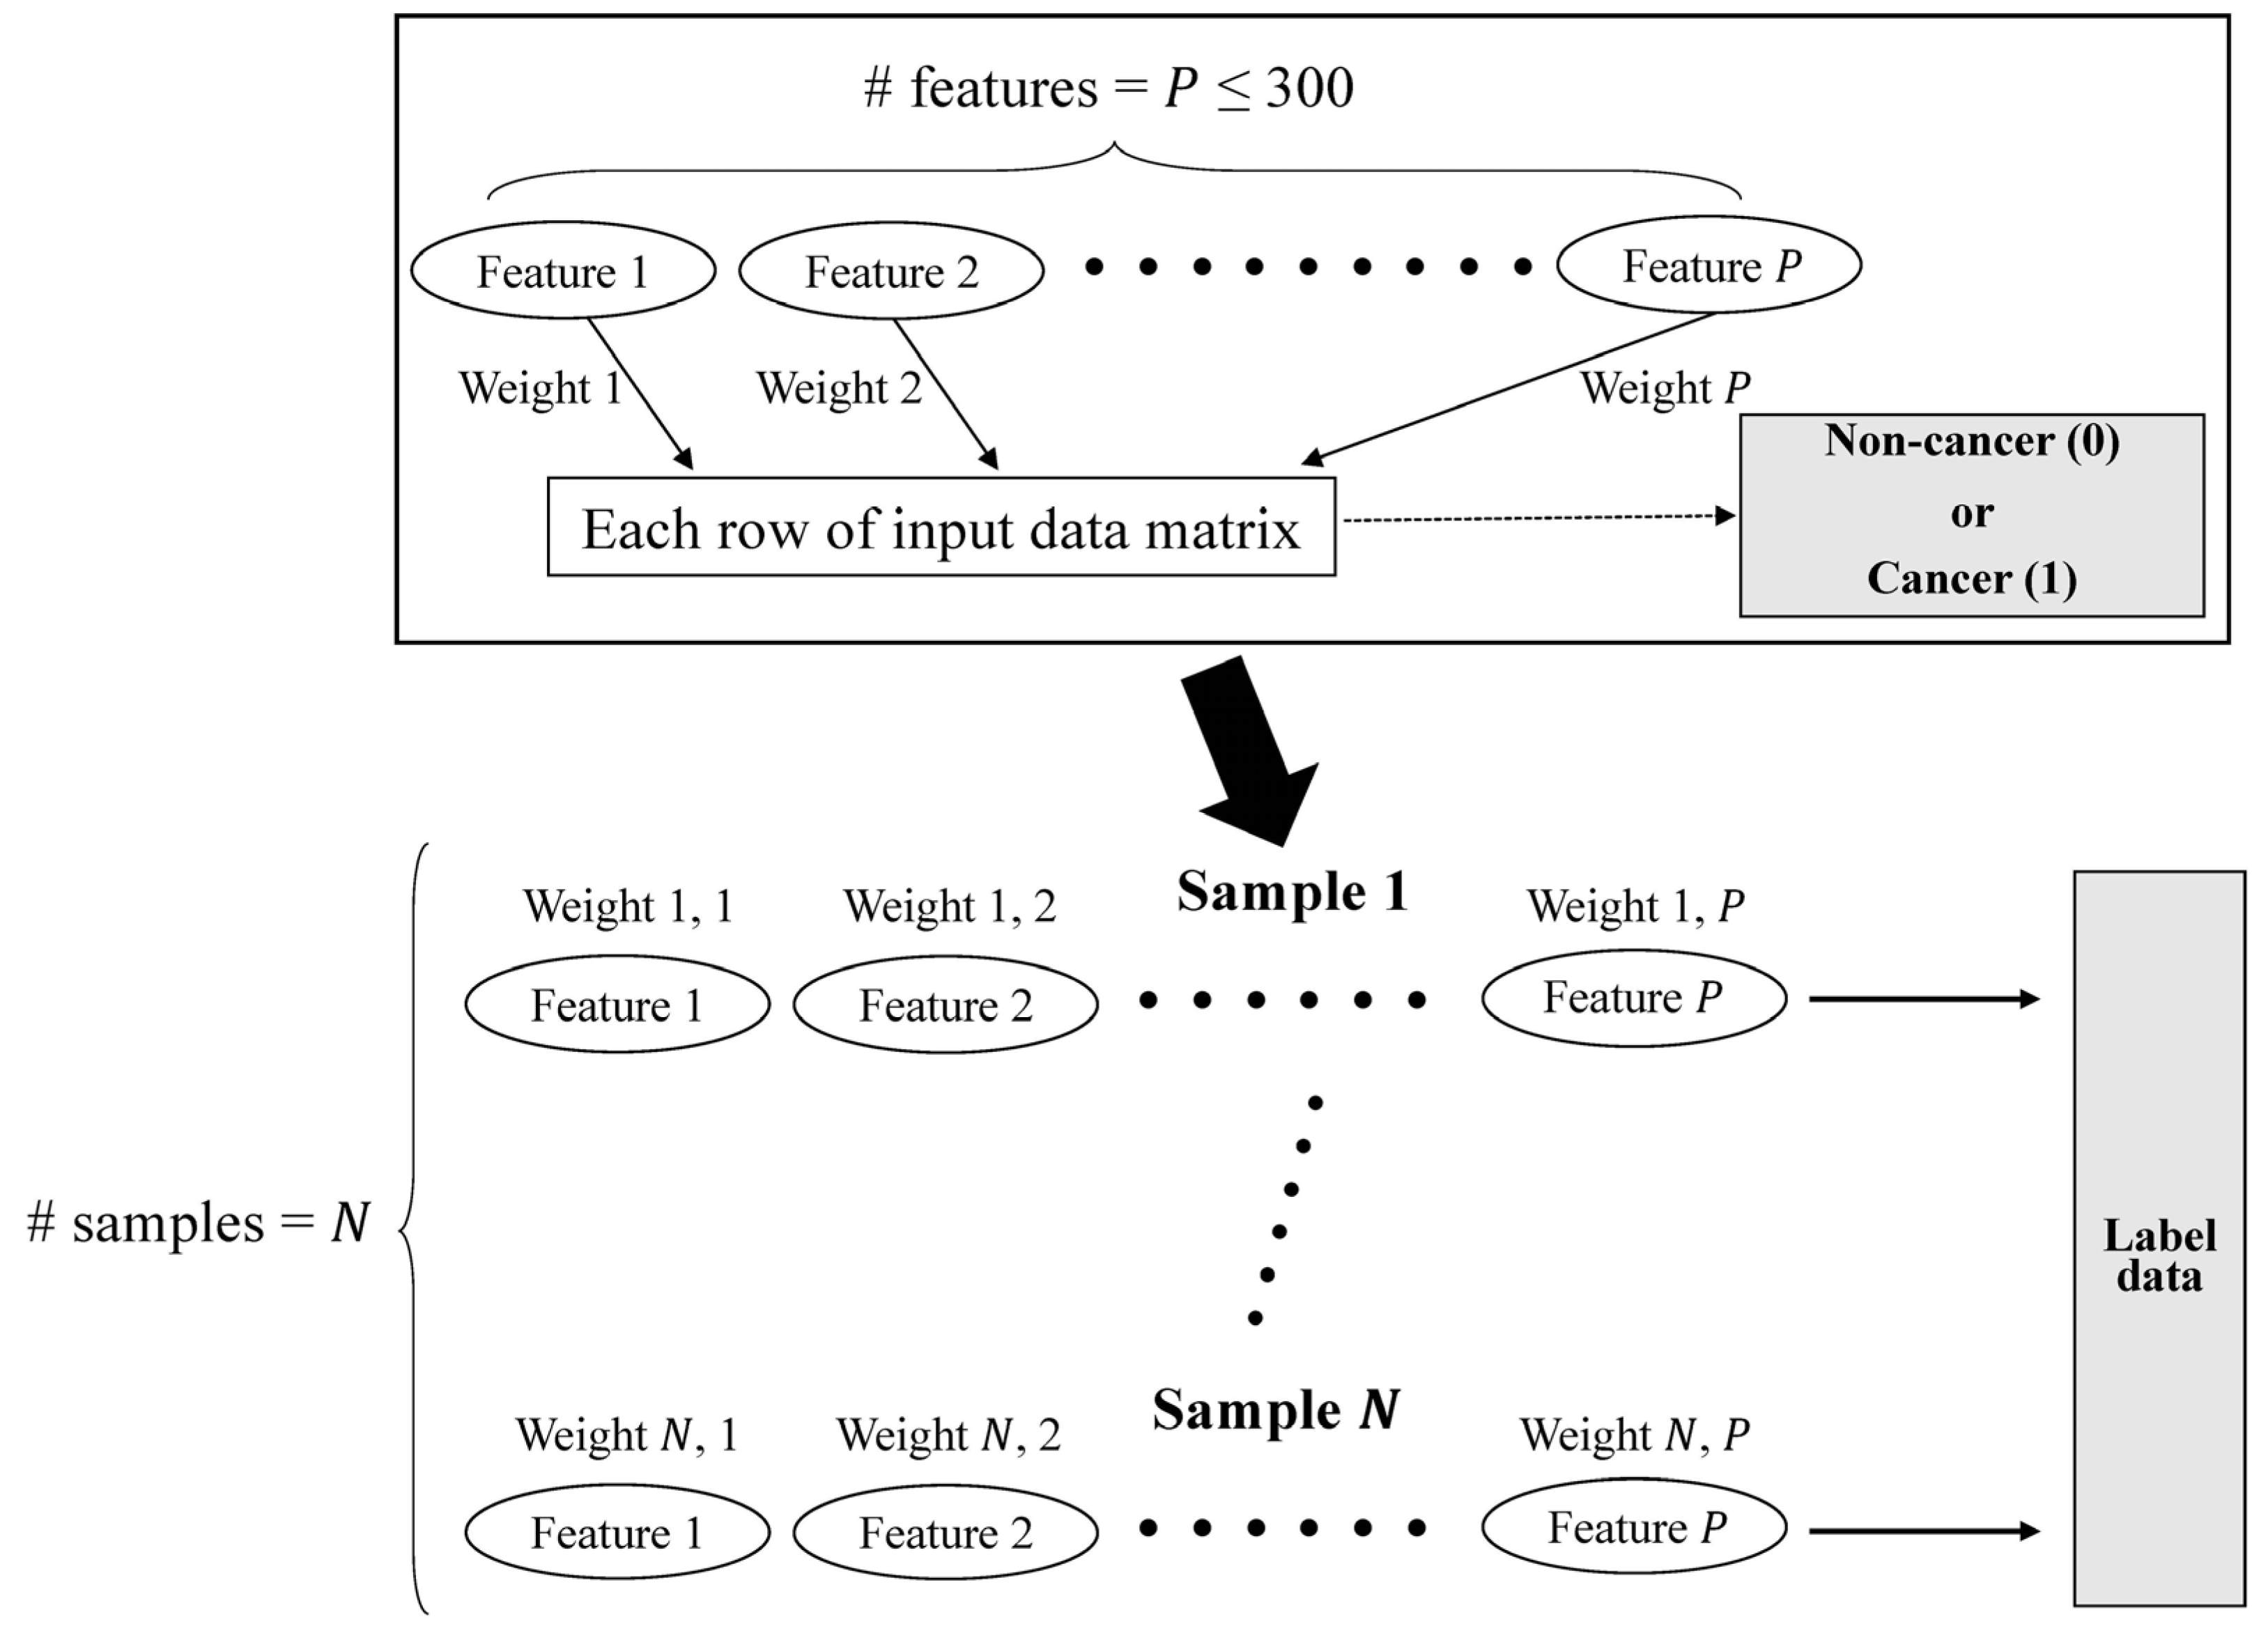
The preprocessing module was implemented by virtue of the GCN architecture, which is sufficient to emphasize the directed acyclic graph (DAG) structure. In accordance with the DAG structure, which represents the data flow from one activity to another and has a defined direction, we can smoothly parallelize the evaluation with each set of multi-omics data and can be free of the total number of features (
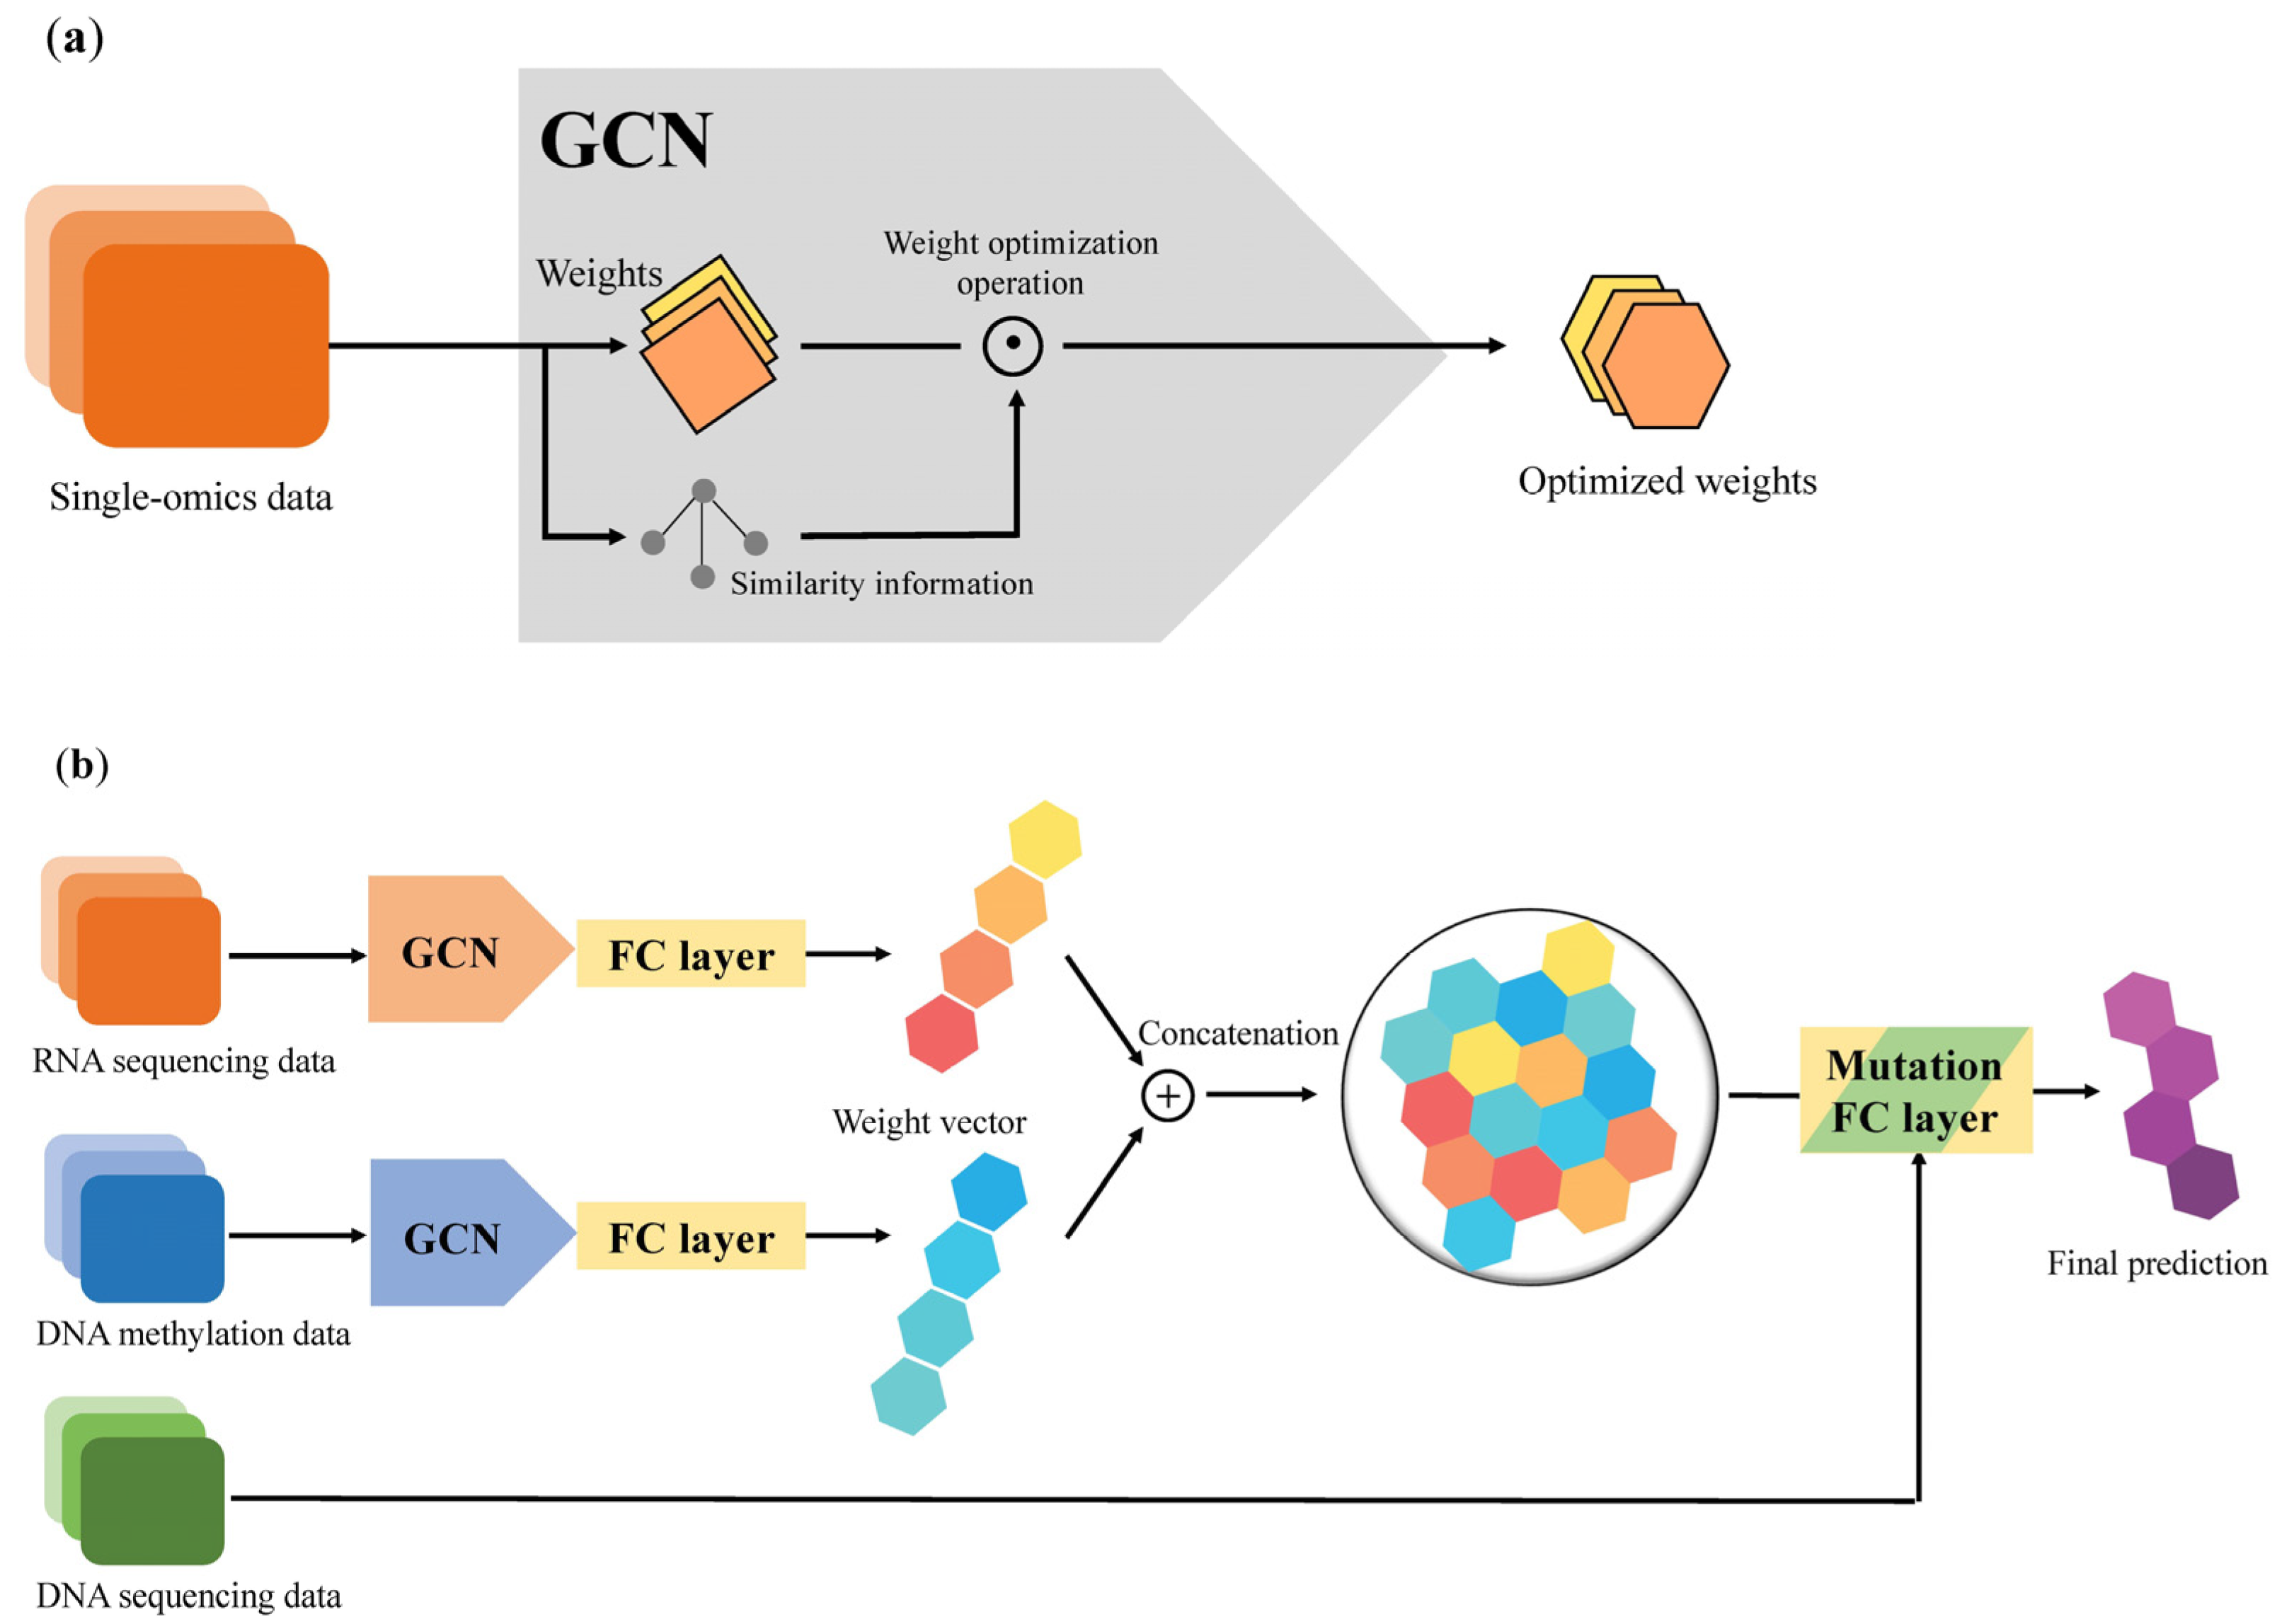
Figure 1). Preprocessing equipped with a DAG structure can benefit from a decrease in the time required for training a model standardization of input forms of multi-omics data, which have different numbers of features (
Figure 2a).
After applying a weighted sample similarity computed from the preprocessing module, each modified weight from the single-omics data is concatenated to an FC layer, and these vectors are then integrated as a multimodal weight vector in the same layer. In the Mutation FC layer, it collects all multimodal weight vectors and employs those vectors to generate the prediction of a binary label. Consequently, an NSCLC prediction model with a GCN–FC–FC architecture was established using multiple modalities (
Figure 2b).
We selected the cosine function as a similarity function and Leaky ReLU with a slope of 0.25 for the negative x-axis as an activation function. We employed the Adam optimizer and cross-entropy loss, and Xavier weight initialization. We also pretrained our model for 500 epochs and then fine-tuned it for 2500 epochs. The number of hidden units in our model was 400 and the dimension of all FC layers was 200. The search space for all three learning rates (pre-training, training, and terminal classification) was {1 × 10⁻⁷, 5 × 10⁻⁷, 1 × 10⁻⁶, 5 × 10⁻⁶, 1 × 10⁻⁵, 5 × 10⁻⁵, 1 × 10⁻⁴, 5 × 10⁻⁴, 0.001, 0.005}. We selected a dropout rate of 0.5 and a sum method for node neighbor aggregations. The model was implemented using Python 3.8.10 and PyTorch 1.8.1 on an Intel(R) Core(TM) CPU i7-9800X, with 126 GB of memory, and a TITAN RTX 24 GB GPU with CUDA 10.2.
To optimize the weights of this GCN-based model, weight vectors of samples were obtained from the feature data of each sample, whose components were the feature values of the samples. Furthermore, we evaluated the similarities between two nodes in each sample–sample graph, especially within the 1-hop network of the graphs. With these similarities, the preprocessing module can restrict protruded components of the weight vector by adjusting the marginal value from the mean value of each feature, and hence smooth links, or directed edges, from each node to a binary label. For example, if one node with label 0 is located among nodes, and most nodes have label 1, then the weight of the link to label 0 decreases, and that of the link to label 1 increases at the same time. In this process, the similarity threshold
presented in
Section 2.2 is determined as a function with respect to the numbers of linked nodes.
2.4. Feature Identification
To find the most relevant features while avoiding redundant ones, log2 fold change and p value criteria were adopted for the selection of features or genes that were hypermethylated or hypomethylated and up- or down-regulated, respectively.
More specifically, after filtering for biomarkers with
p value < 0.05 and absolute value of log
2 fold change >0.5, thousands of features or genes were initially identified. To curtail the total number of biomarker candidates, we used Welch’s
t-test for every feature or gene, on the assumption that the probability distribution is independent, displaying normality, and having unequal variances, according to the cancer positivity and negativity of the samples. The data were randomly divided into training, validation, and testing sets in 55%, 15%, and 30% ratios, respectively. The training set was utilized to establish the DL model, the validation set was used to determine the parameters of the model, and the testing set was applied to evaluate the performance of the DL algorithm. Five-fold cross-validation was performed to determine the optimal parameters for each training and validation model. We conducted the influence test for features by observing the increment of the F1-score between the inclusion and exclusion of each differentially methylated and expressed genes. Among the features, the feature for
-th gene is called
, and the degree of influence of
on the F1-score is defined as difference between the F1-score including
and the F1-score excluding
. The influence on the F1-score was calculated for all features, and features with high influence were selected according to influence on the F1-score ranking. The top 200 gene expression and 300 methylation features ranked by the GCN-based algorithm were selected, followed by subsequent analysis (
Table S1). The diagnostic potentials of the model were determined and assessed using sensitivity, specificity, precision, accuracy, ROC curve, macro F1-score, and weighted F1-score.
2.5. Algorithm Comparisons
To compare our model with common ML/DL models, we implemented convolutional neural network (CNN), logistic regression, and naïve Bayes models, and set these models as the baseline. Although the original Naïve Bayes is an ML model, we built this model as a DL-structured model. We used an activation function, optimizer, and loss function for all baseline models, similar to our model, namely, Leaky ReLU, Adam, and cross-entropy loss. Moreover, we set the number of baseline hidden units to 400 and the dimension of the baseline FC layer to 200, based on the construction of our model. Furthermore, we attached baselines with hidden FC layers, whose numbers were the same as the hidden layers in our model.
For the CNN model, we chose a one-dimensional filter for convolution layers, max pooling with a kernel size of two, stride of one, and zero padding as the pooling method. Since we obtained better metric results when the dropout method was used, we used it at a rate of 0.5, instead of batch normalization. For the logistic regression model, we applied the batch normalizations for each batch and used a dropout method at a rate of 0.5. For the naïve Bayes model, we implemented each layer in a manner similar to the FC layer, using a standard normal distribution as a prior probability distribution.
The three baseline algorithms were compared for their prediction performance on this study’s NSCLC multimodal data. Seven metrics were adopted to compute the classification performances of the competitor methods. By applying the same preprocessed data, the performances of the implemented algorithms were compared pairwise via five-fold cross-validation.
2.6. Functional Annotation and Pathway Analysis
To further investigate the etiologic and molecular biological characteristics of NSCLC biomarkers revealed by this study, we conducted enrichment and pathway analysis implementing Gene Ontology (GO), Kyoto Encyclopedia of Genes and Genomes (KEGG), and REACTOME, which were performed using DAVID 6.8 or analyzed using Cytoscape 3.9.0. GO terms and pathways derived from enrichment were visualized using the ClueGO v2.5.8 and CluePedia v1.5.8 plug-ins. The enrichment library used for GO Biological Process terms is “GO_BiologicalProcess-EBI-UniProt-GOA-ACAP-ARAP_13.05.2021_00h00.” GO selection criteria for representative pathways included three–eight GO levels, a minimum of three genes/term, and mapped genes representing at least 4% of the total associated genes. The Kappa score was used to define term–term interactions and associate terms and pathways into functional groups based on the shared genes between the terms. Ensemble gene ID was used as a gene identifier for all analyses. FDR and p values corrected with Bonferroni less than 0.05 were considered significant. These analyses were performed and accessed between November and December 2021.
2.7. Statistics
All statistical data were confirmed using SPSS Statistics (version 22.0; IBM, Armonk, NY, USA) and MedCalc Statistical Software version 14.8.1 (MedCalc Software Ltd., Ostend, Belgium). Model performance comparisons were visualized using GraphPad Prism version 8.0.1 (GraphPad Software, San Diego, CA, USA). ROC curve analysis was performed to measure the area under the ROC curve (AUC), sensitivity, specificity, accuracy, and precision.
3. Results
3.1. Multi-Omics Datasets, Preprocessing, and Model Training
In the algorithm training step, we used the TCGA-LUAD, TCGA-LUSC, and Korean lung carcinoma datasets (GSE40419). These sets contain three types of data, including mRNA gene expression, DNA methylation, and genomic data, which are suitable for disease classification. We primarily focused on transcriptomics and DNA methylation in the identification of lung cancer prediction signatures. Genomic data, including SNVs, indels, and fusions/rearrangements, are expected to discriminate between the predictors that match the most suitable chemo- and/or immune-therapeutic agents.
The datasets were split into 777 training datasets (55.7%), 195 validation datasets (14.0%), and 423 test datasets (30.3%). These data included more than 10,000 features, which may affect the classification performance and undermine the algorithm training. To remove noise and redundant features from each multi-omics dataset, we first employed Welch’s t-test (p < 0.05) on reliable assumptions. Then, we employed the influence test for features by observing the increment of the F1-score between the inclusion and exclusion of each feature. Using these approaches, we were able to specify 200 RNA-sequencing and 300 methylation features.
We used the macro F1-score, weighted F1-score, and accuracy as performance metrics, and the AUC-ROC score as sub-metrics. For efficient training and validation, we used five-fold cross-validation. Training was performed to carry out initial class prediction using omics features and the corresponding sample similarity generated from omics data.
Our GCN-based algorithm with DAG structure can diagnose lung cancer, more specifically NSCLC, based on two single omics data, transcriptomics, and DNA methylation.
Major RNA expression and DNA methylation features identified by this GCN-based prediction algorithm were parallel to the GO enrichment and pathway analysis (
Table 3).
3.2. NSCLC Prediction Model Validation
Regarding accuracy and specificity, five-fold cross-validation of this NSCLC prediction model (
Figure S1) showed that the performance of DNA methylation single-omics data was slightly better than that of RNA-sequencing unimodal data. Notably, in the case of specificity, the metric values were recorded as 1.0, in most folds, after rounding-off. This case implies that the influence of methylation data is exiguously significant, where our model correctly predicts a healthy subject as non-cancerous. Conversely, we observed that the F1-scores using each data point are almost the same on average. Because the F1-score is a discrimination score for both non-cancer/cancer cases of NSCLC, the observation clarifies that the effect scales of both data are nearly equal in the simultaneous classification of both cases.
3.3. Comparison of NSCLC Prediction Model with Other Classifier Models
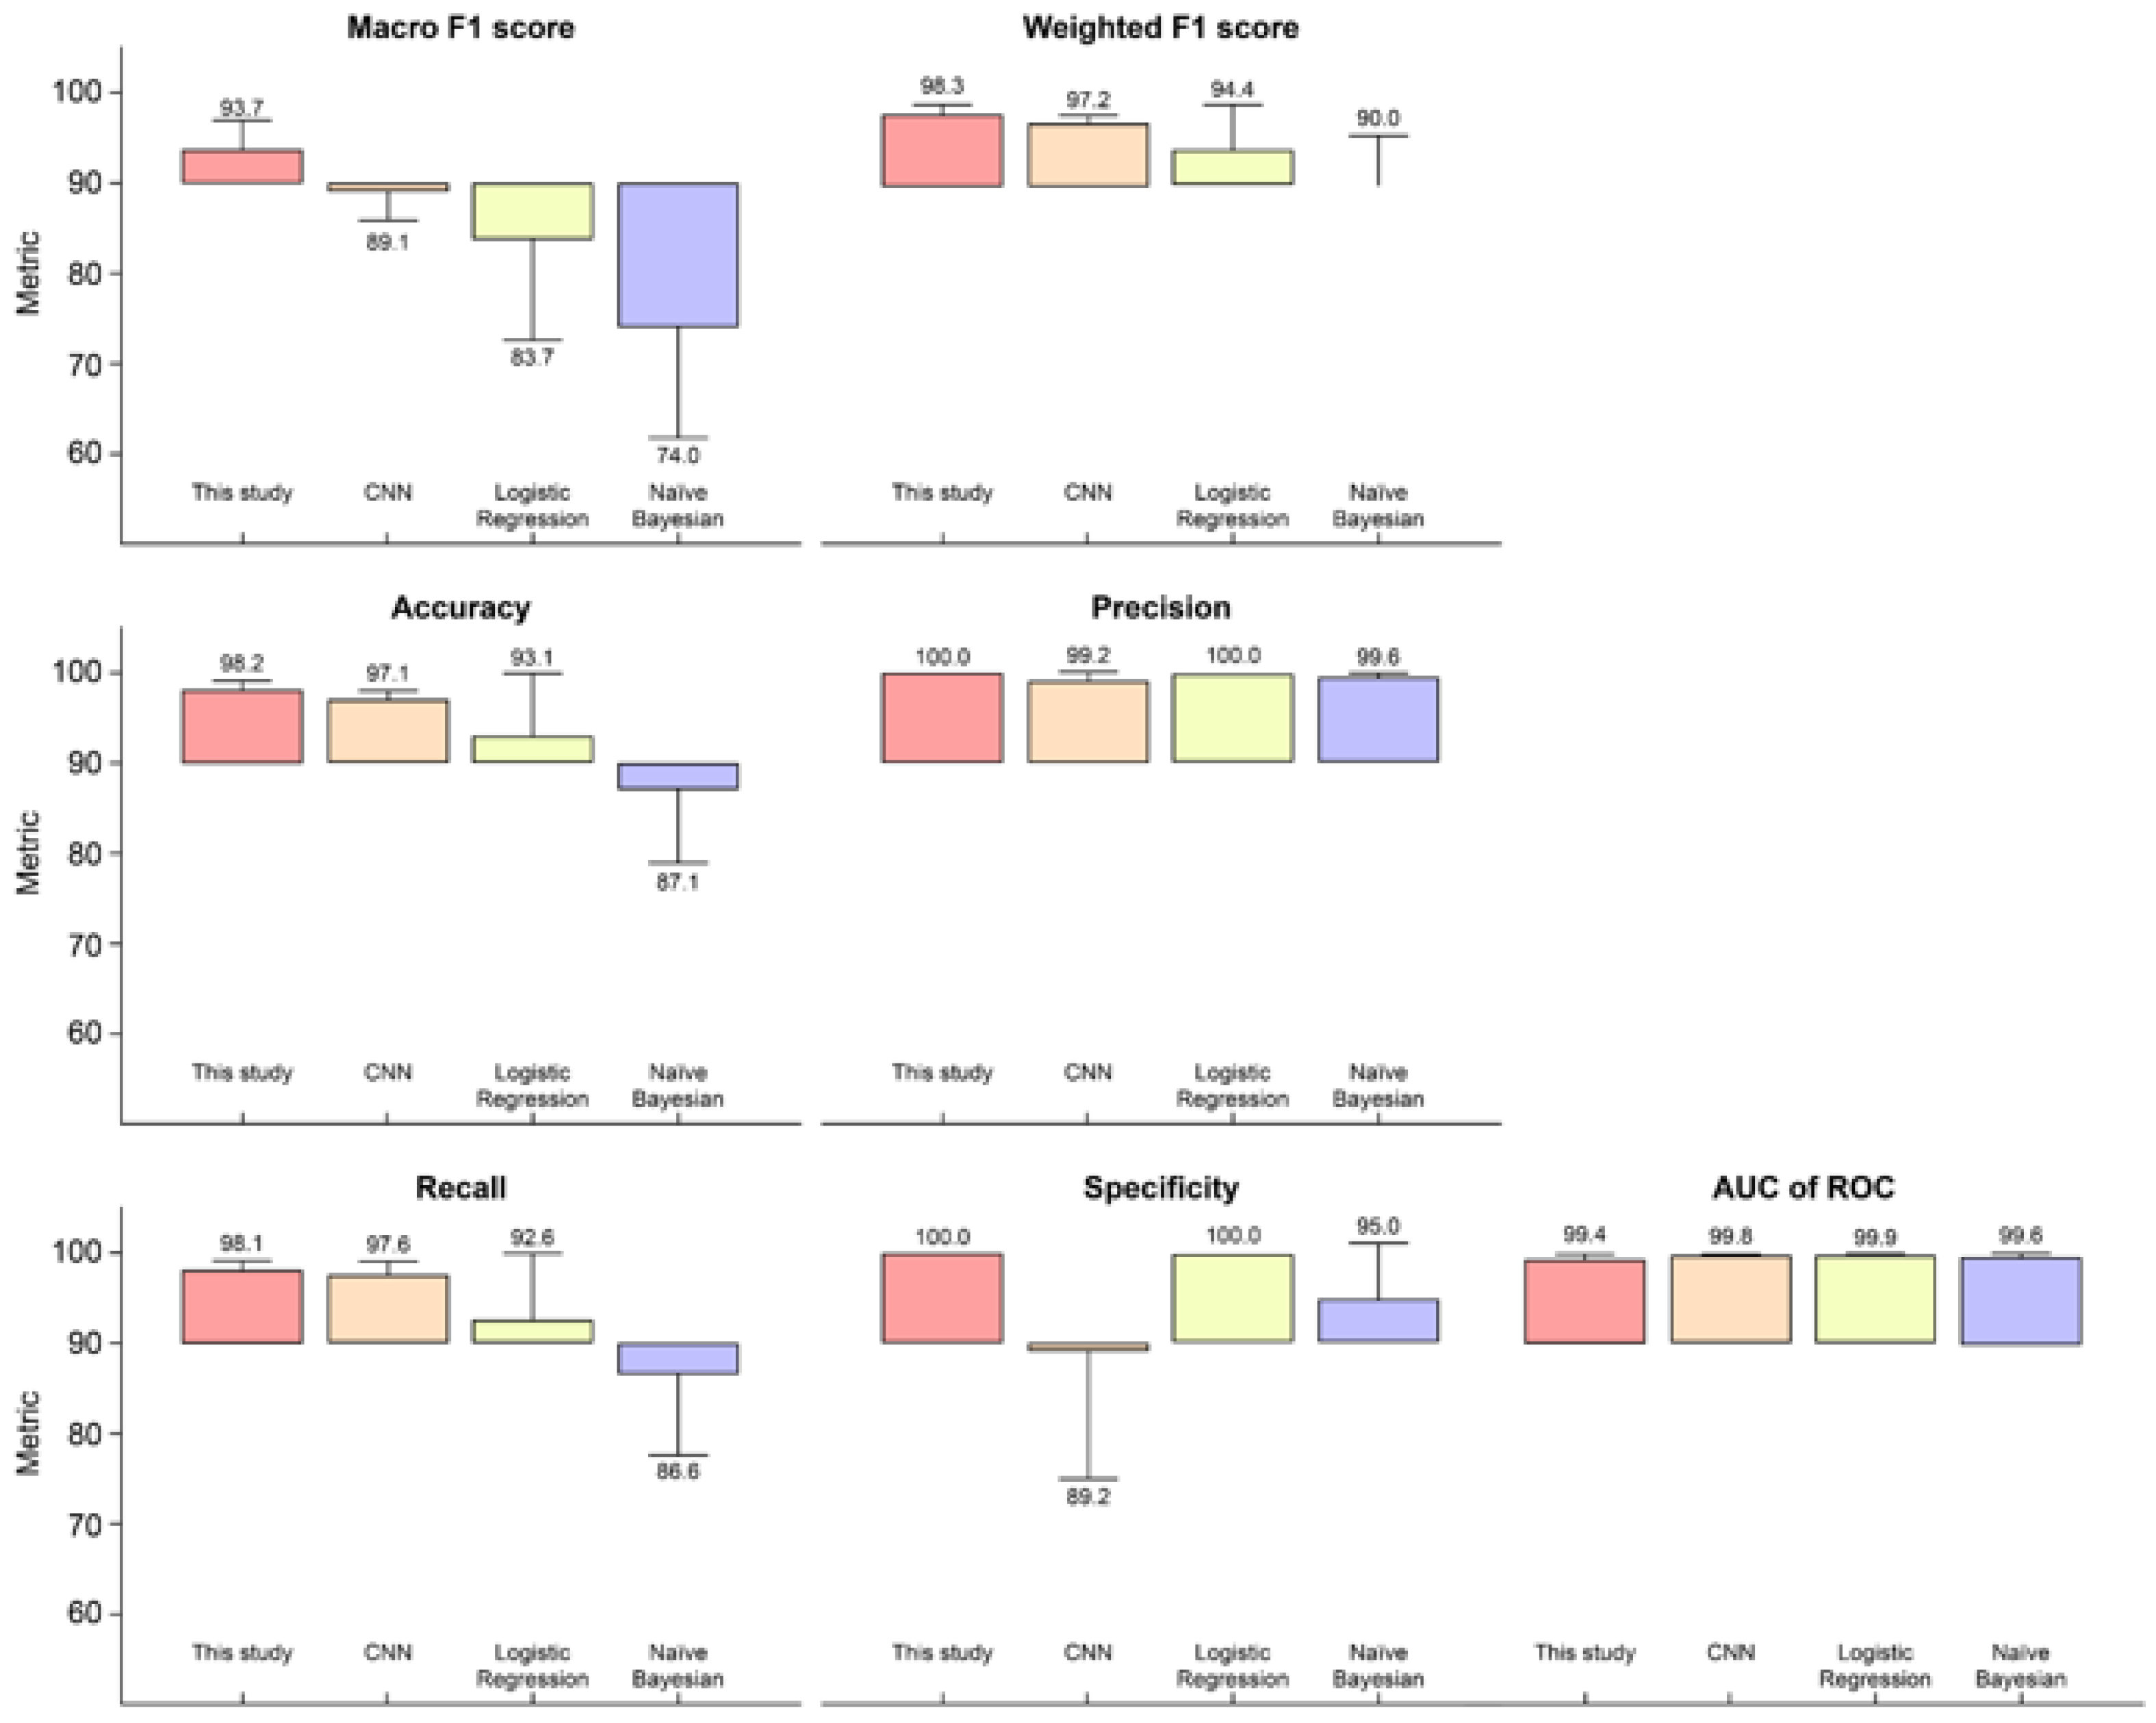
The prediction performance of this model was compared with that of existing DL and ML algorithms: CNN, logistic regression, and naïve Bayes. All four methods were compared using the same preprocessed data and the mean ± standard deviation of the evaluation metrics (
Figure 3 and
Table S3). Actual prediction results of this model based on TCGA samples were compared with those of other classifier models (
Table S4).
To compare the model performances of the baseline and the proposed model, we adopted sensitivity, specificity, accuracy, precision, AUC-ROC, macro F1-score, and weighted F1-score for the binary classification of NSCLC. The best model varied depending on the performance metric, but the proposed model was at least equal to or higher than that of the other multi-omics integrative algorithms on six of the seven metrics we analyzed. In other words, the proposed model outperformed the other algorithms on most performance metrics.
More specifically, when comparing the models with the same number of hidden layers and the same activation function, we observed that our model outperformed the competitors in terms of accuracy,
sensitivity,
macro F1-
score, and
weighted F1
-score.
Precision, which is the ratio of correctly labeled samples to all labeled samples, can vary depending on the classifier threshold. Meanwhile, the
sensitivity may remain unchanged.
where
true positives indicate the number of NSCLC samples that have been correctly predicted,
false positives denote the number of non-cancer samples that are misclassified as cancer samples, and
false negatives signify the number of NSCLC samples that are misclassified as non-cancer samples. The
F1
-score, the harmonic mean of
precision and
sensitivity, is a useful measure in binary classification and was calculated according to Equation (8):
Macro F1 can be computed using the sum of the
F1
-score for
actual positives and
actual negatives, and was calculated according to Equation (9):
Our NSCLC prediction model achieved a 93.7%
macro F1
-score. The highest
macro F1
-score indicated that the values for
false positives and
false negatives were sufficiently low to prove that this algorithm is best for classifying the correct class (
Figure 3).
To calculate the metrics for each label and adjust their
macro F1 weighted by both the
actual positives and
negatives,
weighted F1 was applied as per Equation (10):
Weighted F1, considering the number of actual occurrences per label, was 98.3% and it outperformed the competitor model, with an imbalanced dataset, that is, DNA methylation in this study. The proposed NSCLC prediction model demonstrated that it outperforms three other models applied using identical frameworks that are desirable for multi-omics data classification capability on identical datasets.
3.4. Functional Annotation and Pathway Analysis
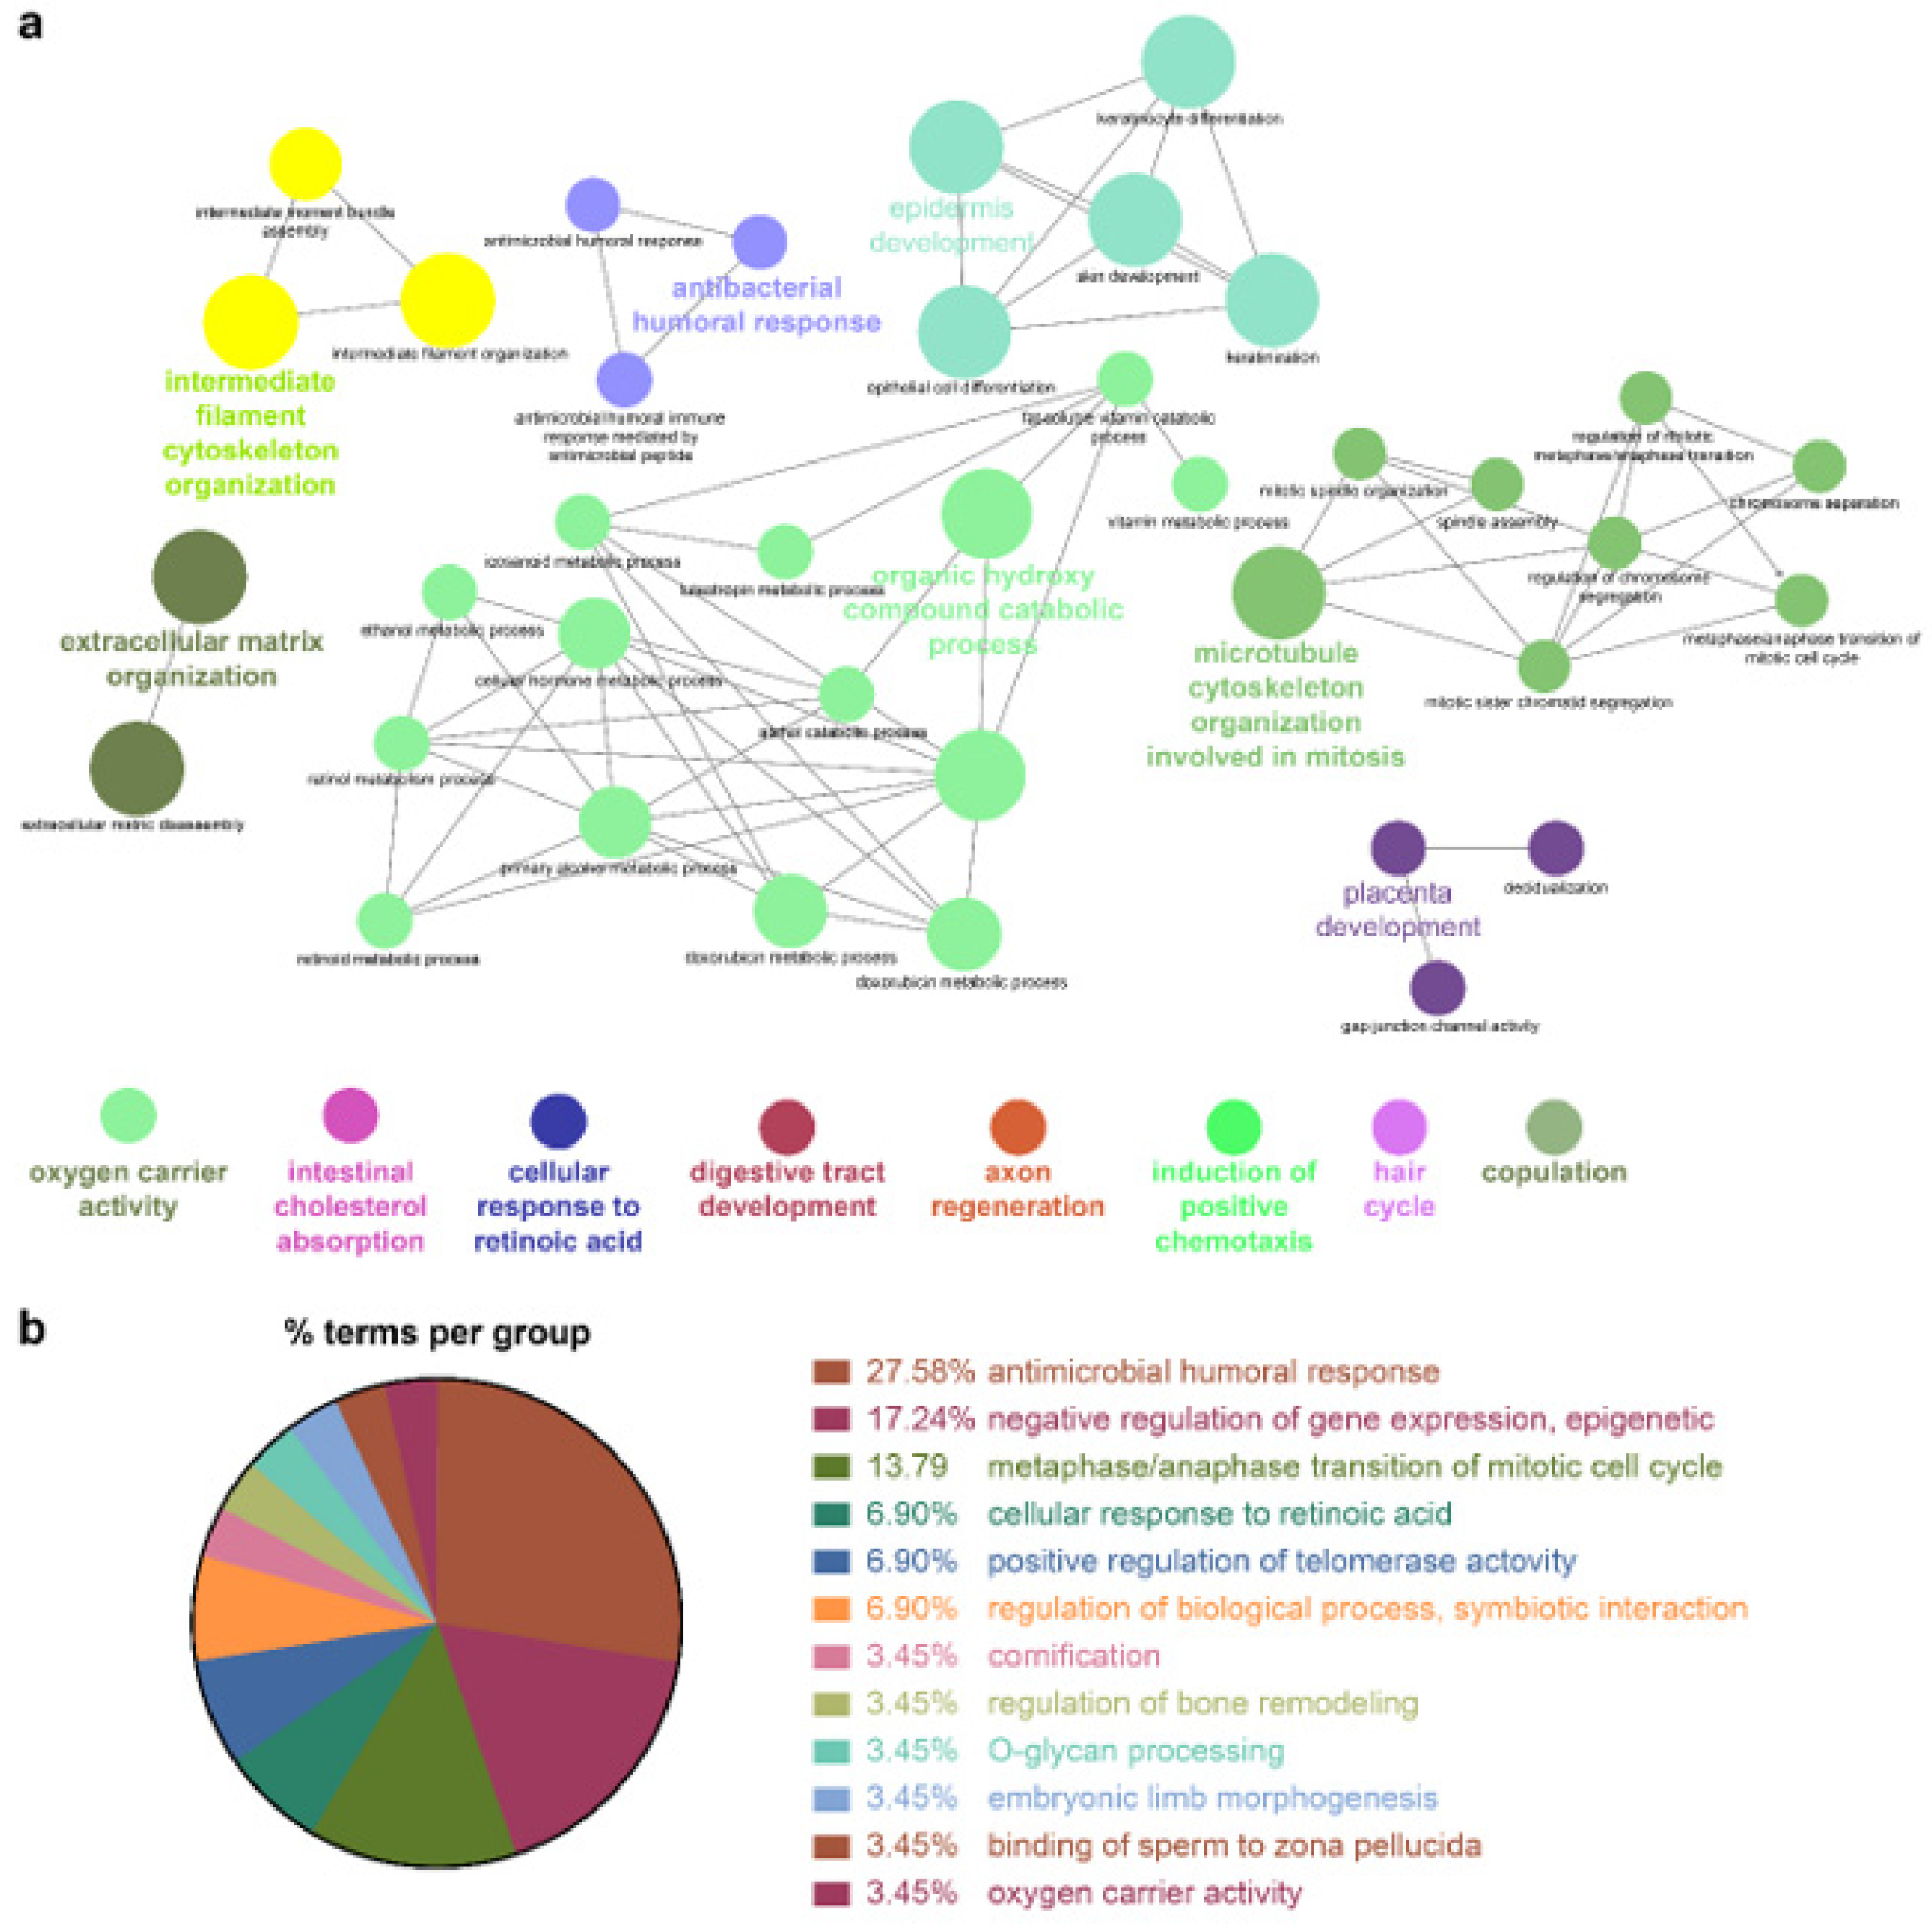
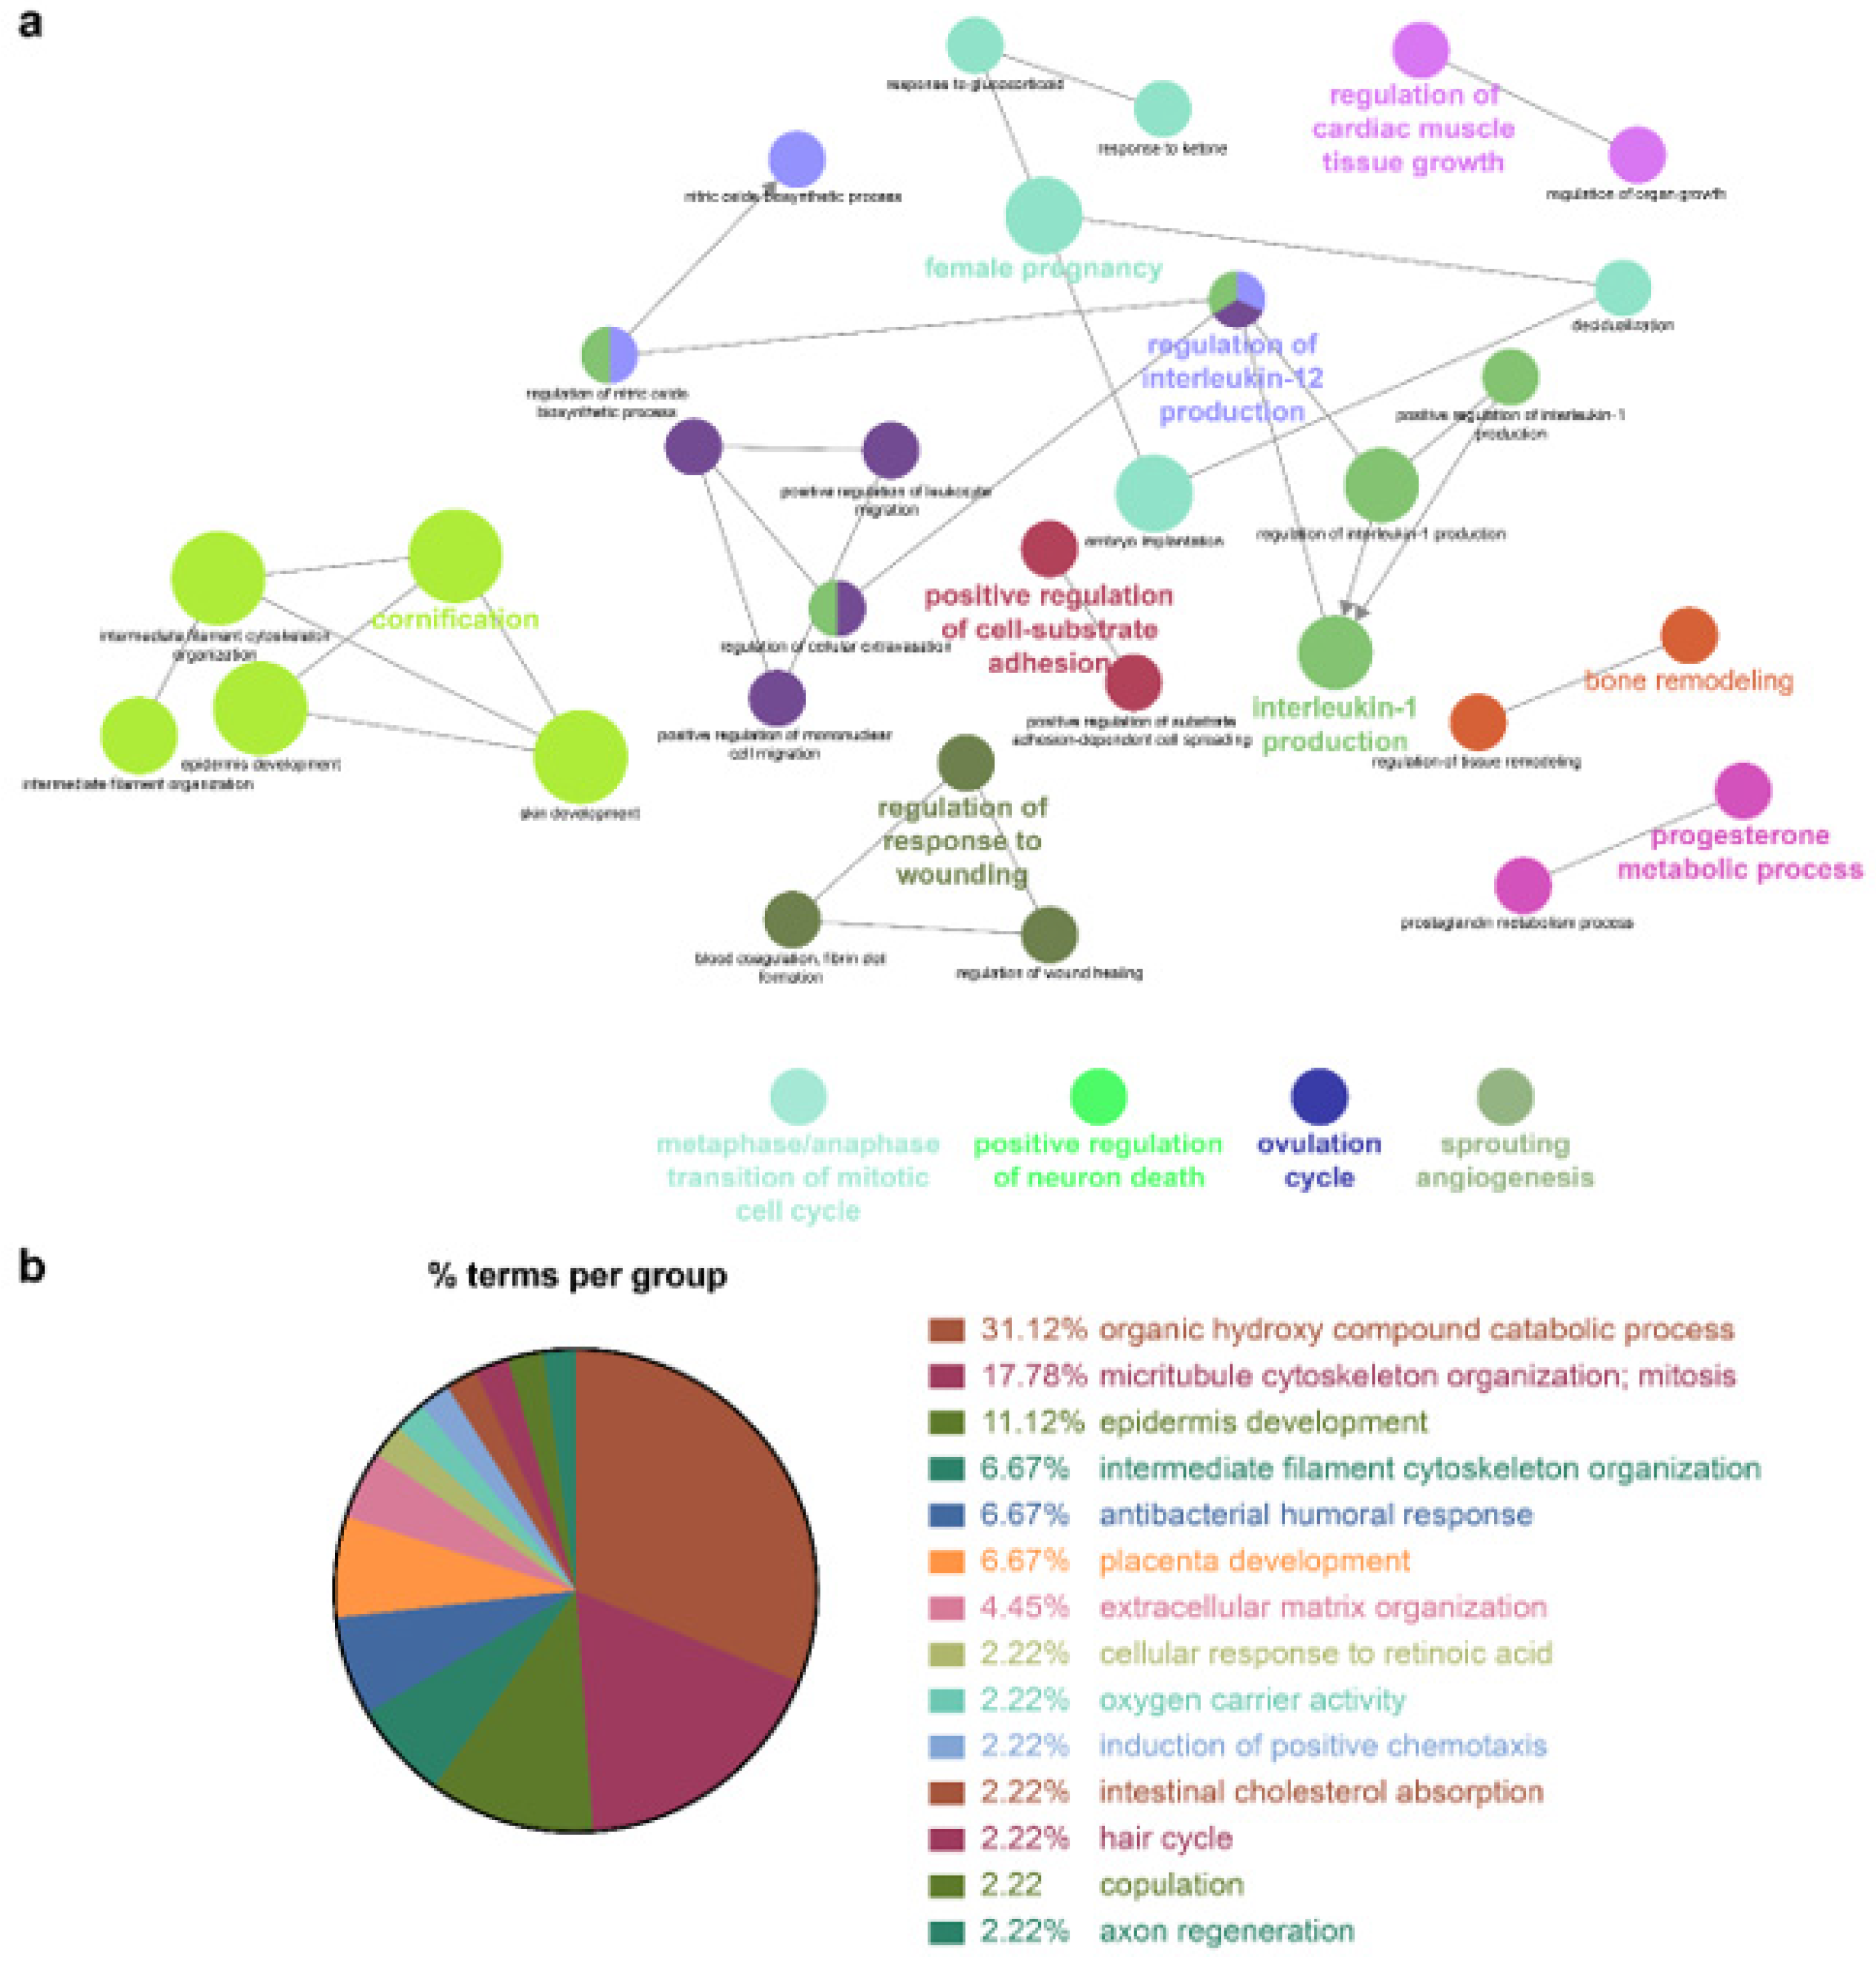
Because the biomarkers identified by the NSCLC prediction model were quite diverse, further analysis of their molecular functions and biological processes was performed. LUAD and LUSC not only shared identical biological processes but also exhibited specific processes. GO term enrichment, KEGG, and REACTOME pathway analyses were performed on the identified biomarkers using Cytoscape software 3.9.0. and the DAVID database. In the NSCLC multimodal features, the GO term of cornification (GO:0070268) originated from LUAD features, whereas epidermis development (GO:0008544) was derived from LUSC features (
Table 4,
Figure 4,
Figure 5 and
Figure 6).
Genes associated with the two GO terms cornification and epidermis development showed distinct downregulation in NSCLC (
Figure S2). GO terms related to the inflammatory response, that is, positive regulation of IL-1 production (GO:0032732), regulation of IL-12 production (GO:0032655), and the IL-17 signaling pathway (GO:04657), were enriched in NSCLC. In this inflammatory response network, up- and downregulation were intermingled, but upregulated genes prevailed (
Figure S2 and
Table 4).
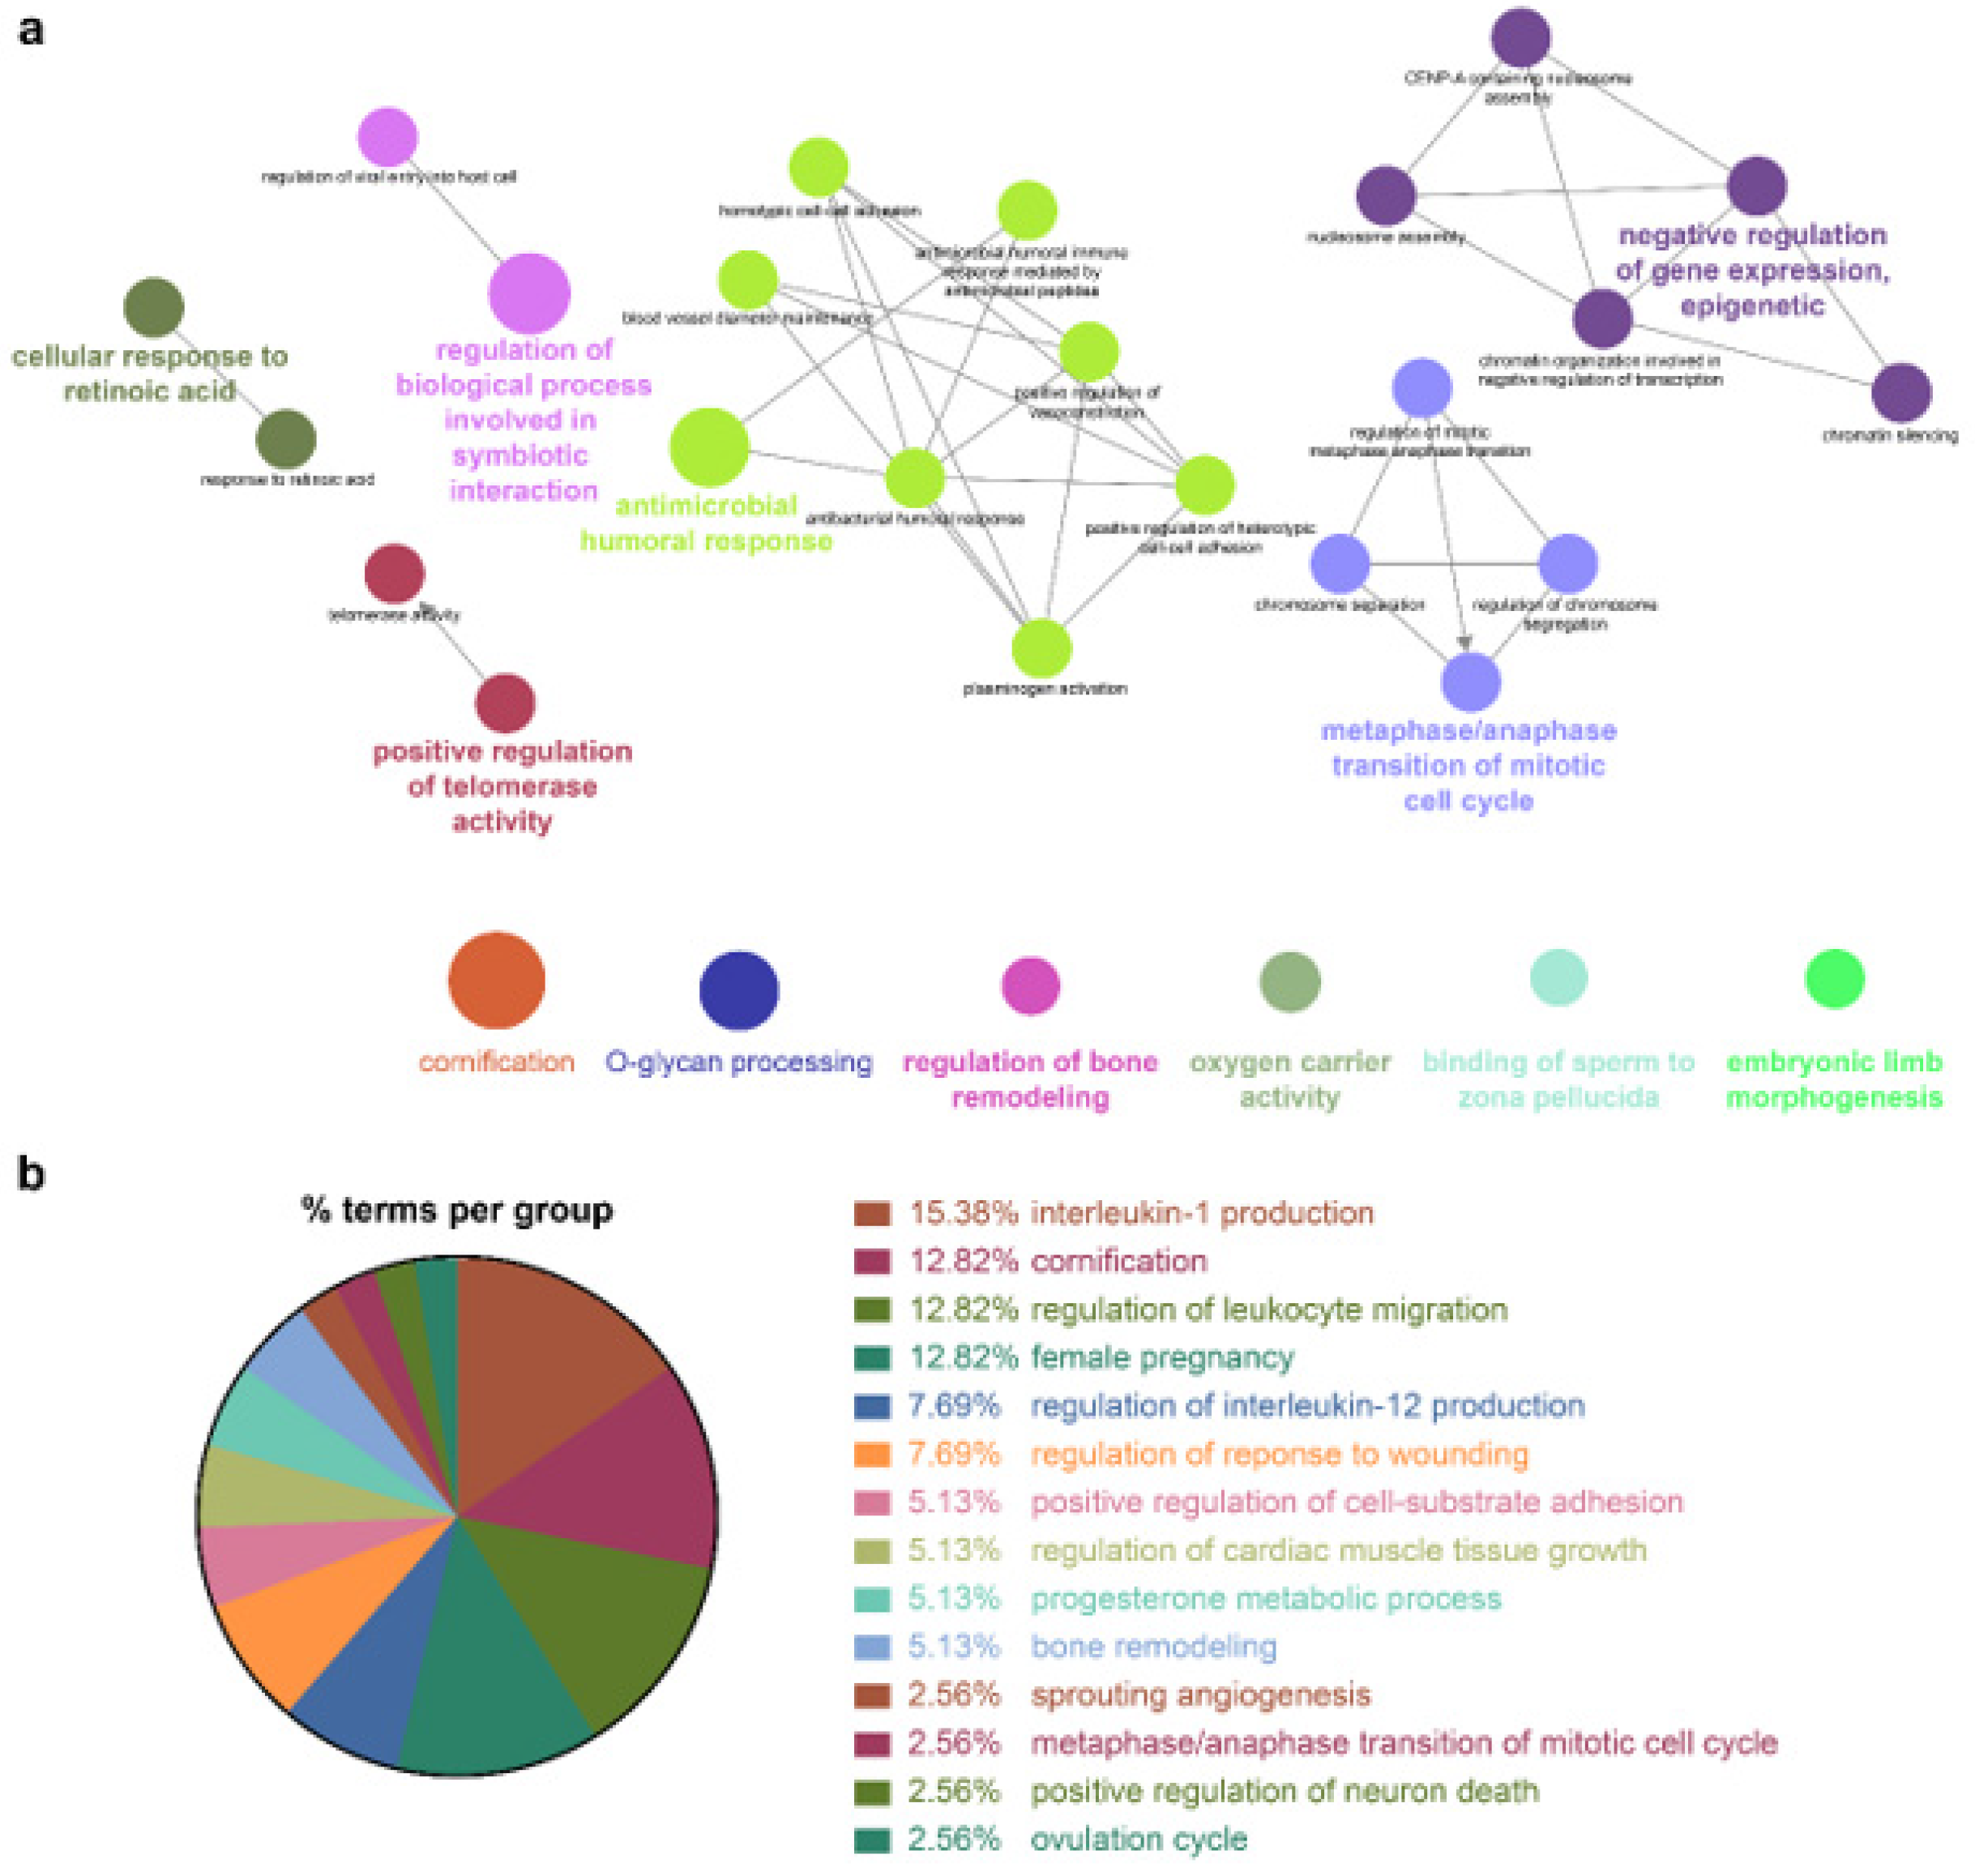
Cellular responses to retinoic acid (GO:0071300) and antimicrobial humoral responses (GO:0019730) were shared by both LUAD and LUSC (
Figure 5 and
Figure 6 and
Table 4). REACTOME pathway analysis indicated that the formation of the cornified envelope (R-HAS:6809371) pathway also had a common term in both LUAD and LUSC (
Table 4). O-linked glycosylation (R-HAS:5173105) was distinctive in LUAD, and degradation of the extracellular matrix (R-HAS:1474228) was peculiar to LUSC (
Table 4). KEGG pathway analysis revealed that the REACTOME term estrogen signaling pathway (KEGG:04915) was highly enriched in LUSC features, which was in turn applied to the NSCLC multimodal model. In this estrogen signaling pathway,
KRT13,
KRT14,
KRT15,
KRT16, and
KRT17 were enriched genes, which allowed us to predict that these genes contribute to the downregulation of the estrogen signaling pathway (
Table 4).
All the details of the GO terms, KEGG, and REACTOME pathway analyses are displayed in
Table 4 and
Table S2. GO enrichment analysis using Cytoscape and its plug-ins ClueGO and CluePedia was successfully reproduced in the analysis using the DAVID database. Representative enriched GO terms (-Log
10 p value <2.4; fold change +5–−8) of NSCLC multimodal features, analyzed from the DAVID database, are summarized in
Figure S3.
4. Discussion
Owing to the exponential growth of omics technologies and NGS-based big consortium studies, labeled omics datasets with comprehensive annotations are continuously being developed. Therefore, it is increasingly important to employ labeled omics data to highly accurately predict disease diagnosis, tumor grading, and subtyping. Considering approximately 85% of lung cancers, NSCLC has two of the most common subtypes, LUAD and LUSC, which have considerably different biological signatures, although they are usually treated in the same way and classified identically into NSCLC. There are few biomarkers of NSCLC based on the implementation of multimodal feature selection methods. One of the main reasons for this is histologic and molecular heterogeneity, even within the same histological subtype. Hence, to accurately and robustly predict NSCLC, this study focused on the multi-omics integrative classification of NSCLC.
Although multi-omics data integration usually leads to better outcomes, some studies have suggested that this is not always the case. Existing reviews comprehensively cover this challenging issue [
21,
22]. Poor performance can arise if the algorithm is not adapted for a particular aim or for particular multi-omics datasets. Some ML/DL models cannot handle enormous matrices, noise, and outliers, which are worse in multi-omics studies. However, as discussed by Picard et al., if an algorithm and integration strategy are chosen discretely, multi-omics-based models should always outperform single-omics models [
21].
A supervised omics integrative model has been reported to take advantage of a GCN for multi-omics data learning to perform effective disease classification and biomarker identification. Wang et al. utilized both omics features and correlations among samples represented by similarity networks for better classification capability in cancers and Alzheimer’s disease [
19]. Ramirez et al. reported that a GCN with prior knowledge in the form of protein–protein interaction networks and gene co-expression networks was able to achieve excellent prediction accuracies (89.9–94.7%) among 33 cancer types and normal tissue on TCGA data [
23].
Numerous multi-omics integration studies have proposed the applicability of DL for cancer diagnosis and prognosis. However, there are a few challenges and limitations to the extensive implementation of multi-omics DL in clinical practice. First, the fundamental problem encountered is the difficulty in resolving the relationship between the compressed features and biological meanings. Therefore, to verify the explainable performance in real-world applications, a clinical study must be carried out with external cohorts, followed by complete functional analysis. Second, owing to the large number of parameters, DL algorithms are difficult to train, must be tuned accurately, have unclear methods concerning handling data variability derived from data transformation and normalization, and often experience overfitting. In addition, their performance depends heavily on the size of the samples, which is limited [
21,
24]. Strict performance evaluation is particularly demanding owing to the innate high complexity of artificial intelligence networks, as apparently well-performing DL models might use inadvertent and possibly false features and respond unexpectedly to seemingly irrelevant changes in input data. Failure to perform a strict evaluation might have diminished the credibility of the research findings and would be worthless in the clinical field [
25].
Another issue likely to be encountered when incorporating ML models trained using multi-omics data is the expense. It might not be practical to perform multimodal sequencing or microarray analyses routinely for all new patients. To implement cost-effective and high-throughput analysis for NSCLC diagnosis and/or prognosis, we further differentiate central or core biomarkers (approximately 30–50) out of a few hundreds of multi-omics feature pools, while maintaining comparable performance in NSCLC prediction.
The superior performance of the macro F1 metric of this NSCLC prediction model can be explained by a previous DL cancer classification study. The macro F1-score has been applied as a useful measure of the effectiveness of individual algorithms on the rare classes because macro F1 is more heavily influenced by performance on the minority classes, that is, cancers vs. non-cancers [
26]. There is a need for further evaluation of this NSCLC prediction performance by training and testing on different patient cohorts from different institutions and ethnicities.
Gene Ontology (GO) annotates genes (i.e., features) using ontology. GO analysis is widely used for specifying cellular location, molecular function, and biological process. One of main purpose of implementing GO is to perform enrichment analysis on a given feature list [
27]. GO annotations smoothen the way for capturing the complexity of gene and function relationships. Pathway analysis (e.g., KEGG, STRING, PANTHER) groups genes or features into ‘pathways’ which basically enlist them to participate in the same biological process. Thus, it can identify the specific protein functions, biological pathways, and physical interactions that are enriched in a given feature panel [
28]. This study unveiled genes that were more correlated with LUAD, or more specifically to LUSC, and universally contributed to both subtypes (
Table 4). A particularly enriched GO term in this NSCLC algorithm is cornification (GO:0070268), which is a distinct type of cell death featuring terminal keratinocyte differentiation with a slow, coordinated process time spatially, allowing the formation of a dead cell (corneocyte) layer to create a physical barrier for the skin [
29]. The SPRR family of proteins is located in the region of the epidermal differentiation complex. Wang et al. demonstrated that
SPRR1A expression in LUAD indicates a more advanced stage and unfavorable prognosis [
30]. Further, Zhang et al. reported that
SPRR1B expression in LUAD may predict poor prognosis [
31]. Additionally, Patterson et al. stated that the loss of
SPRR1B expression disrupts or alters the cornification process, resulting in irreversible malignant transformation [
32]. We intend to investigate the molecular functions of the SPRR family genes (
Table 4) unveiled from this study and their correlation with NSCLC.
This study demonstrated that
KRT6A (log
2FC −5.47),
KRT14 (log
2FC −3.71),
S100A2 (log
2FC −3.23), and
KRT17 (log
2FC −2.56) have significant diagnostic potential for NSCLC (
Table S1), consistent with a previous study using overlapping feature selection methods in which these genes were ranked as having one of the highest diagnostic potentials for classifying LUAD and LUSC [
33]. In alignment with top-ranked features, GO biological processes were similarly concatenated with “Epidermis development,” “Intermediate filament cytoskeleton organization,” and “Intermediate filament-based process.” These GO terms, originating from LUSC, suggested that LUSC expresses more genes related to epidermal development and cytoskeleton organization, which is different from LUAD.
Novel microRNA, long non-coding RNA, and differentially methylated regions, which regulate or are the nearest genes to these RNAs, were unveiled. The exact mechanisms underlying these novel RNA biomarkers in NSCLC development should be clarified in future studies.

 ,
, 


