
Boosting the Full Potential of PyMOL with Structural Biology Plugins


Abstract
:1. Introduction
2. Protein Sequences and Structures Analyses (PSSAs)
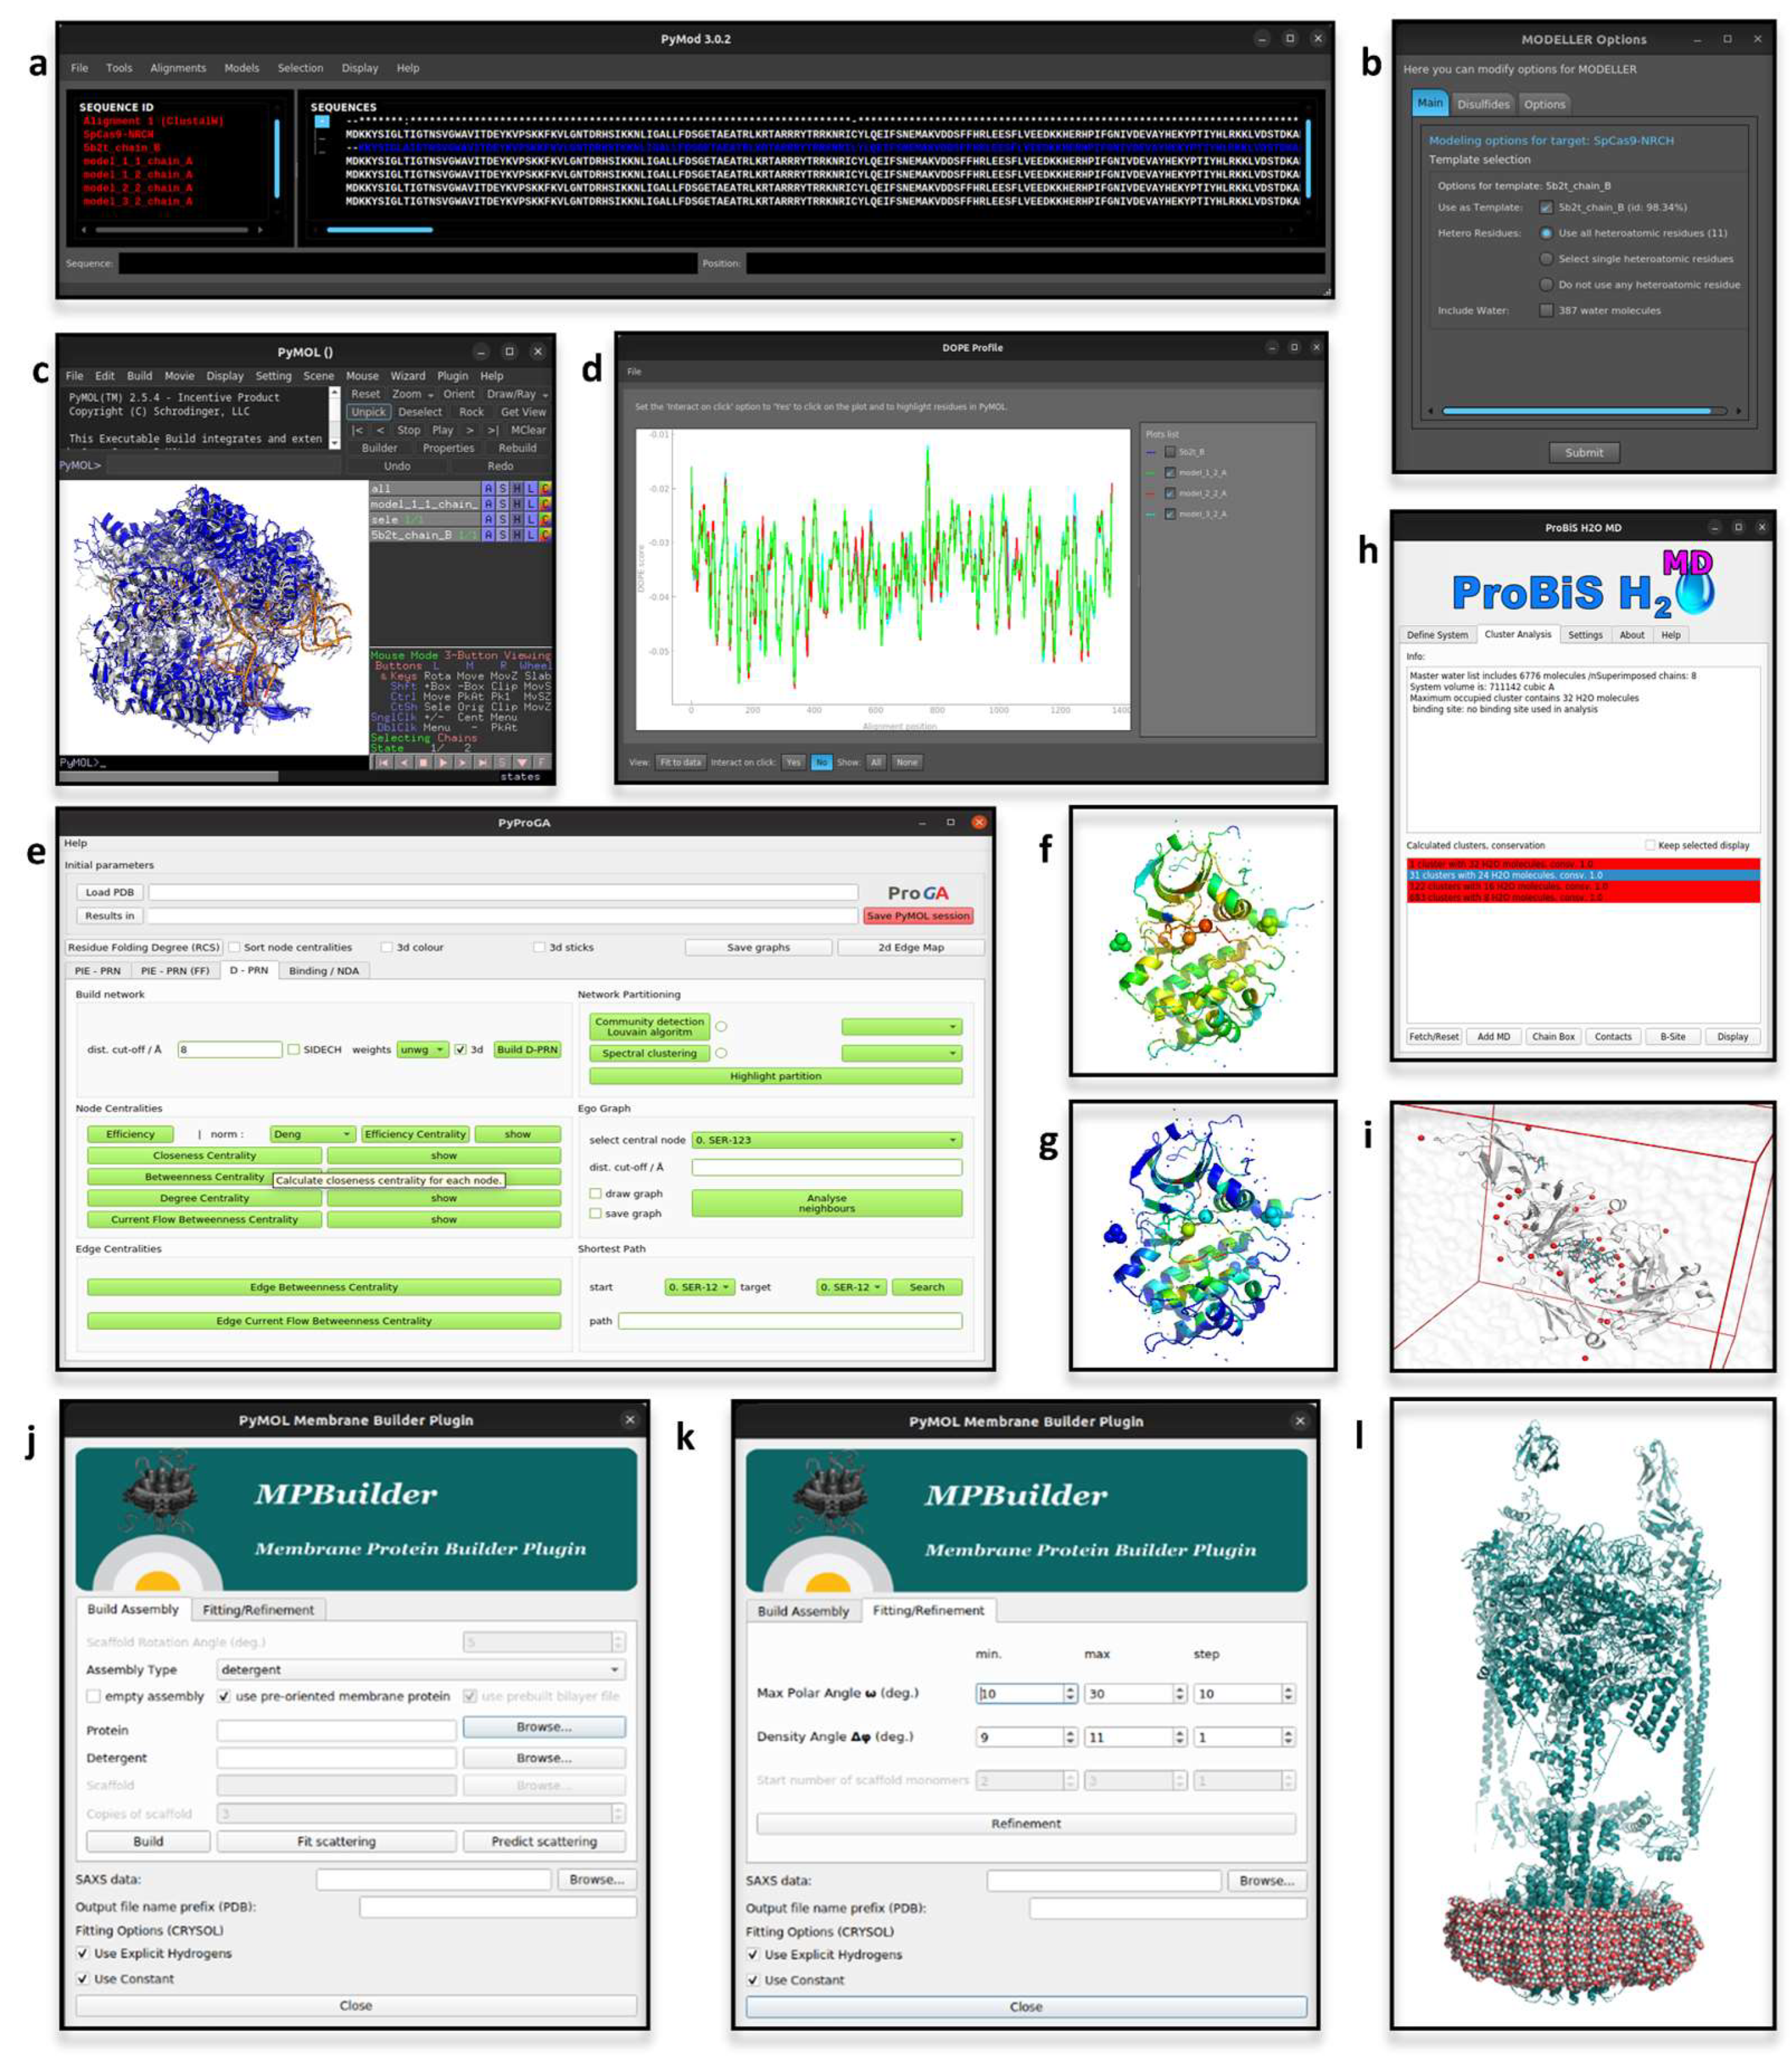
2.1. PyMod
2.2. pyProGA
2.3. MPBuilder
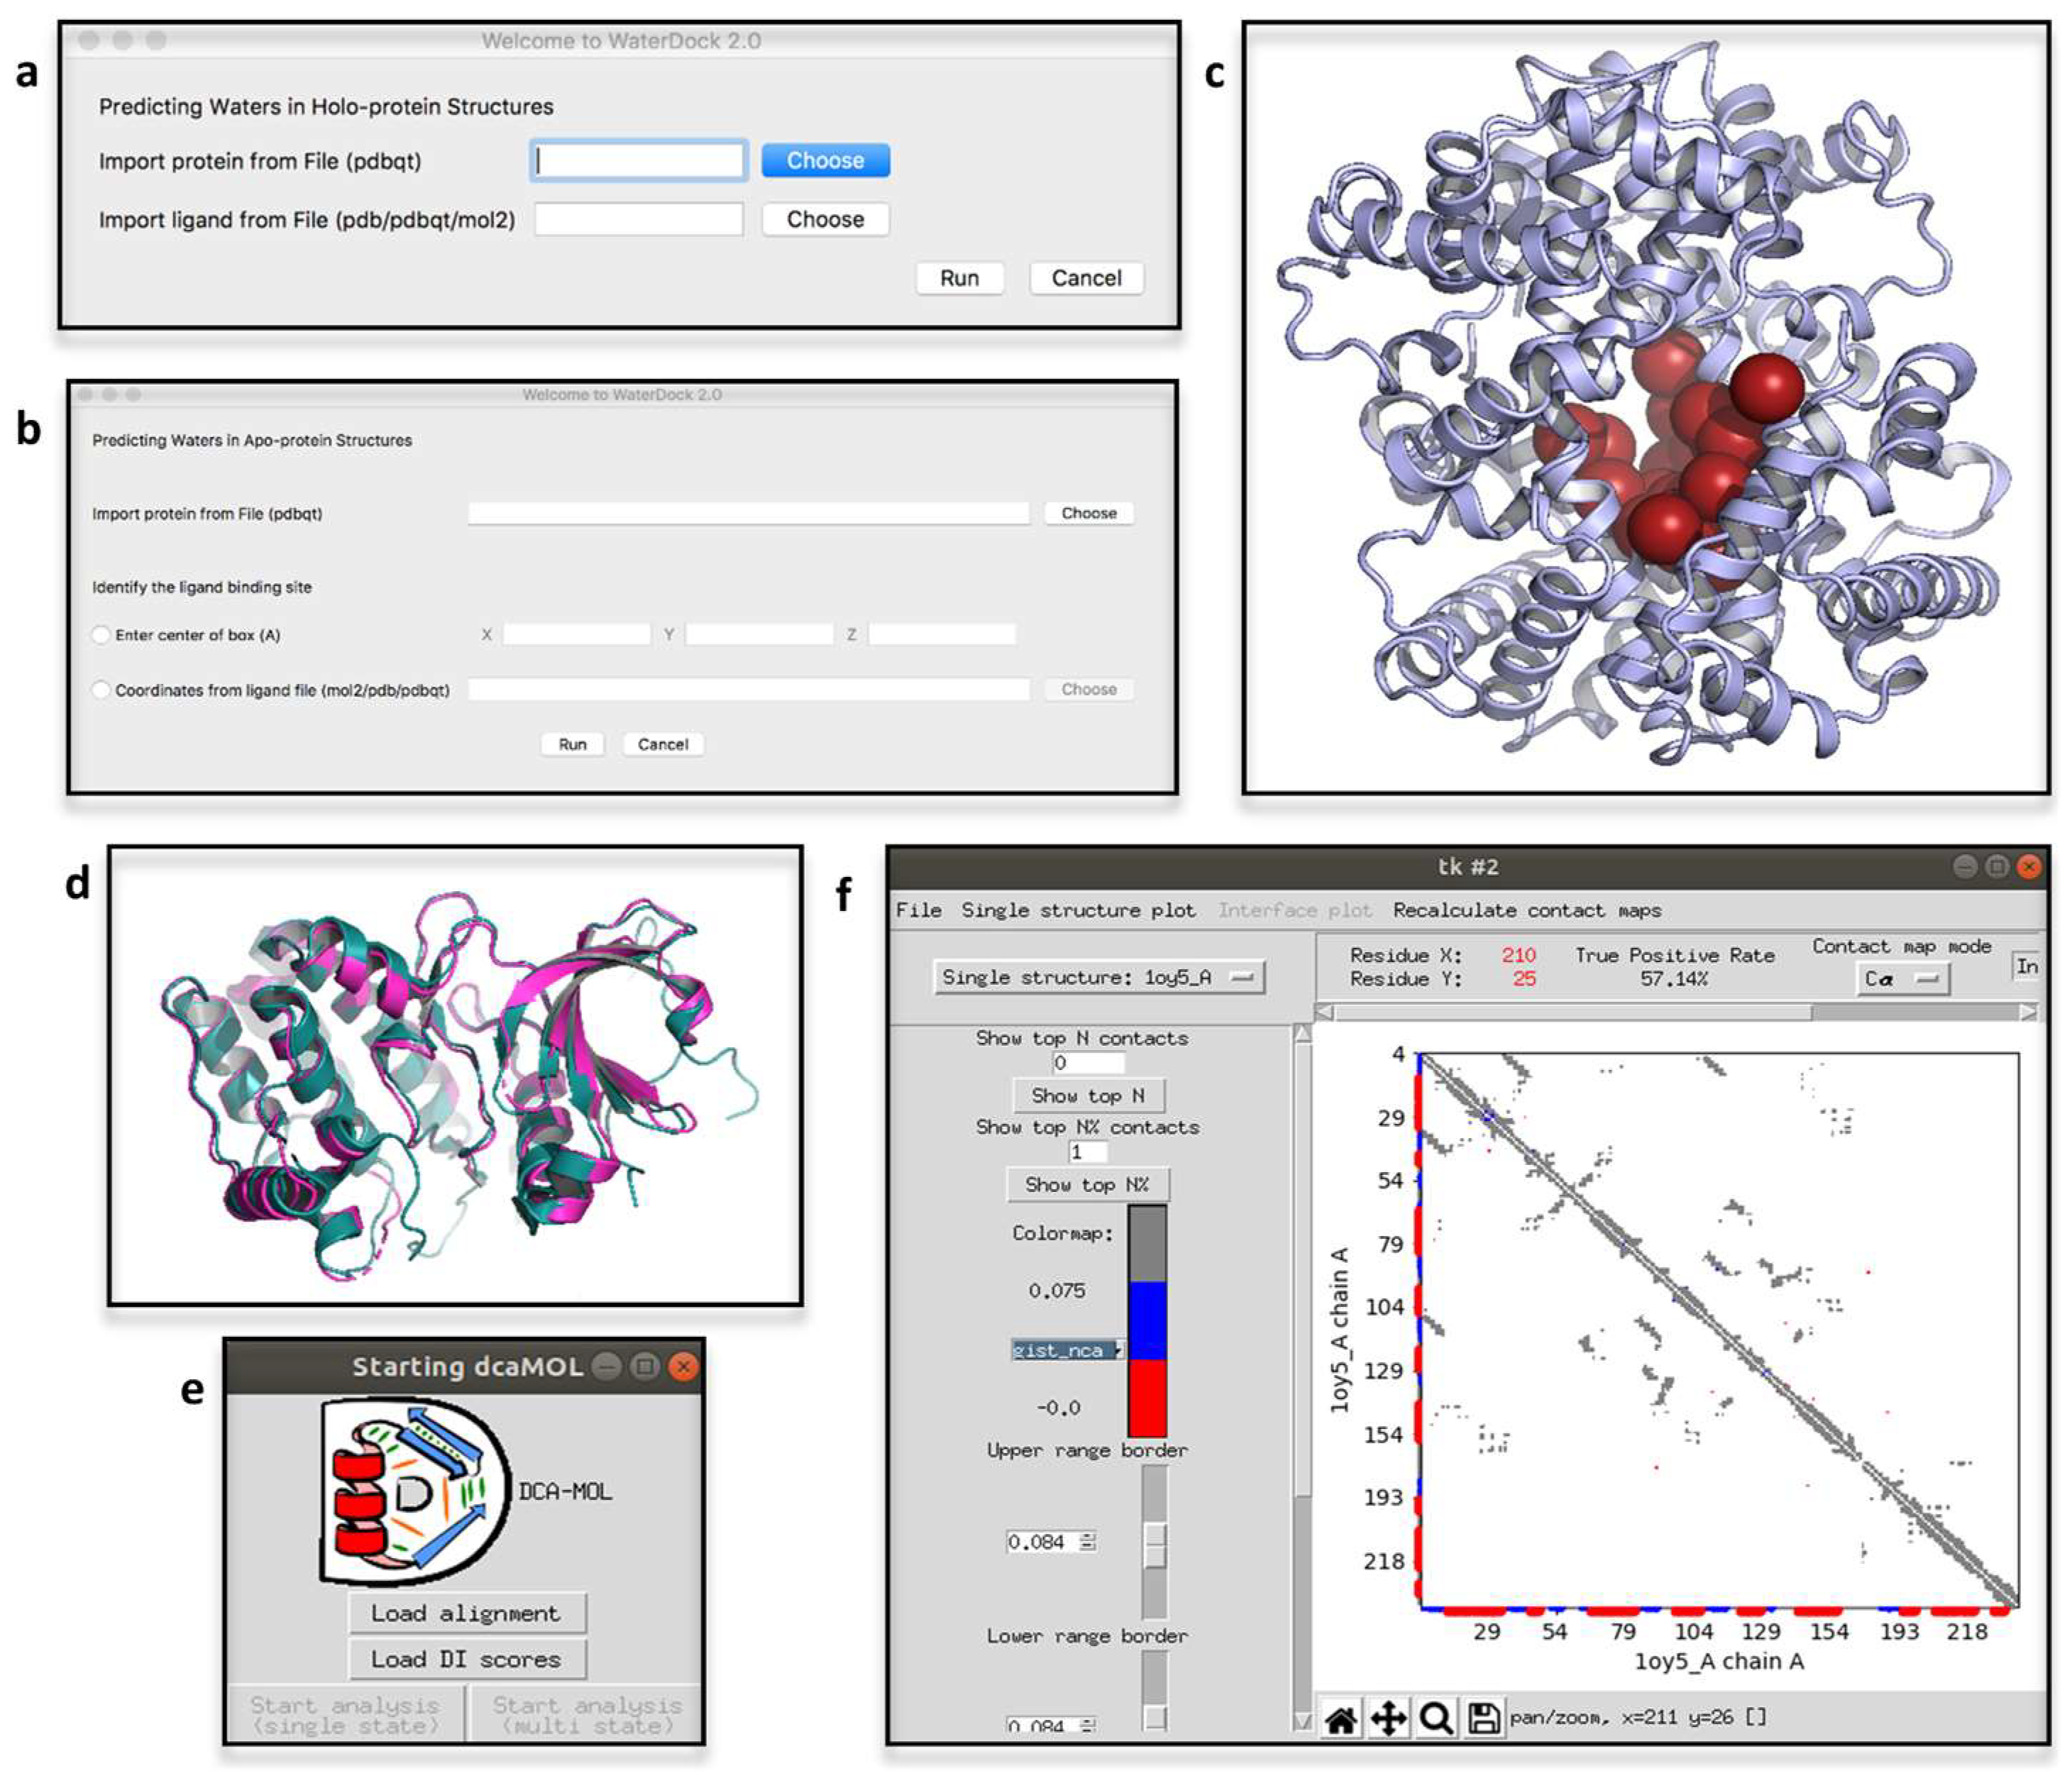
2.4. ProBiS H2O, ProBiS H2O MD and Waterdock 2.0
2.5. iPBAvizu
2.6. DCA-MOL
3. Protein-Ligand Interactions
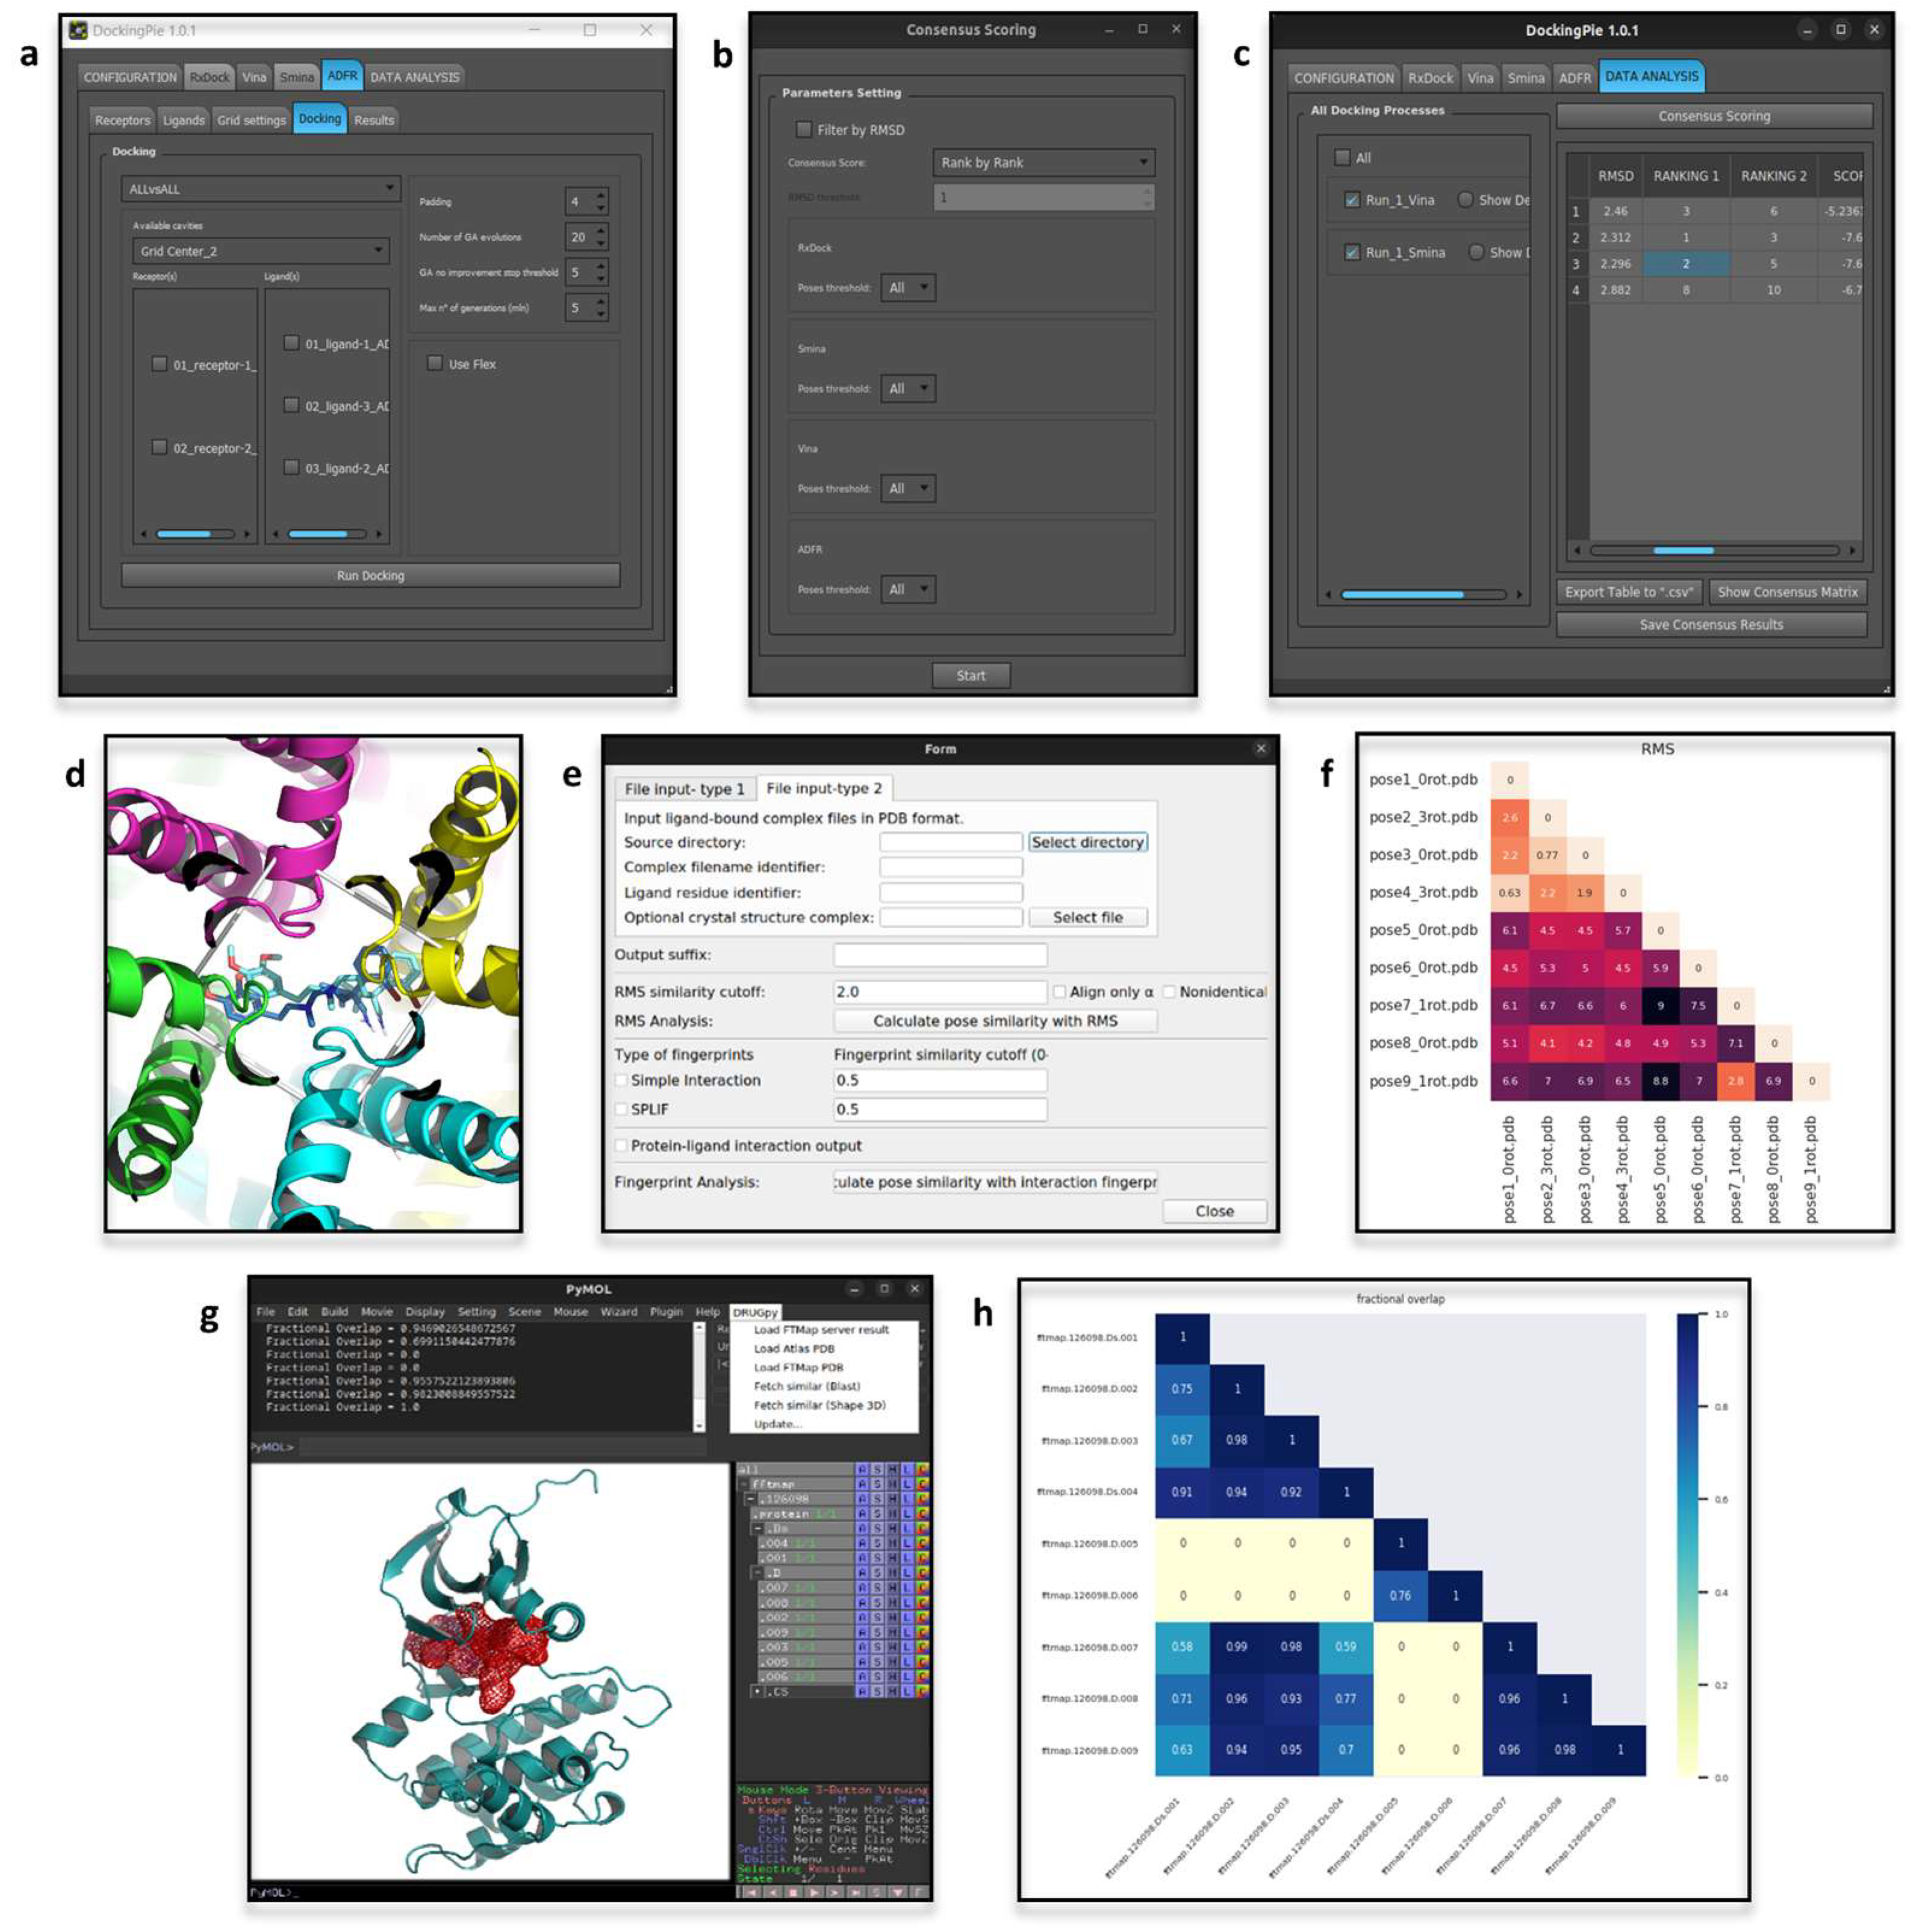
3.1. DockingPie
3.2. DRUGpy

3.3. PoseFilter
4. Protein Dynamics
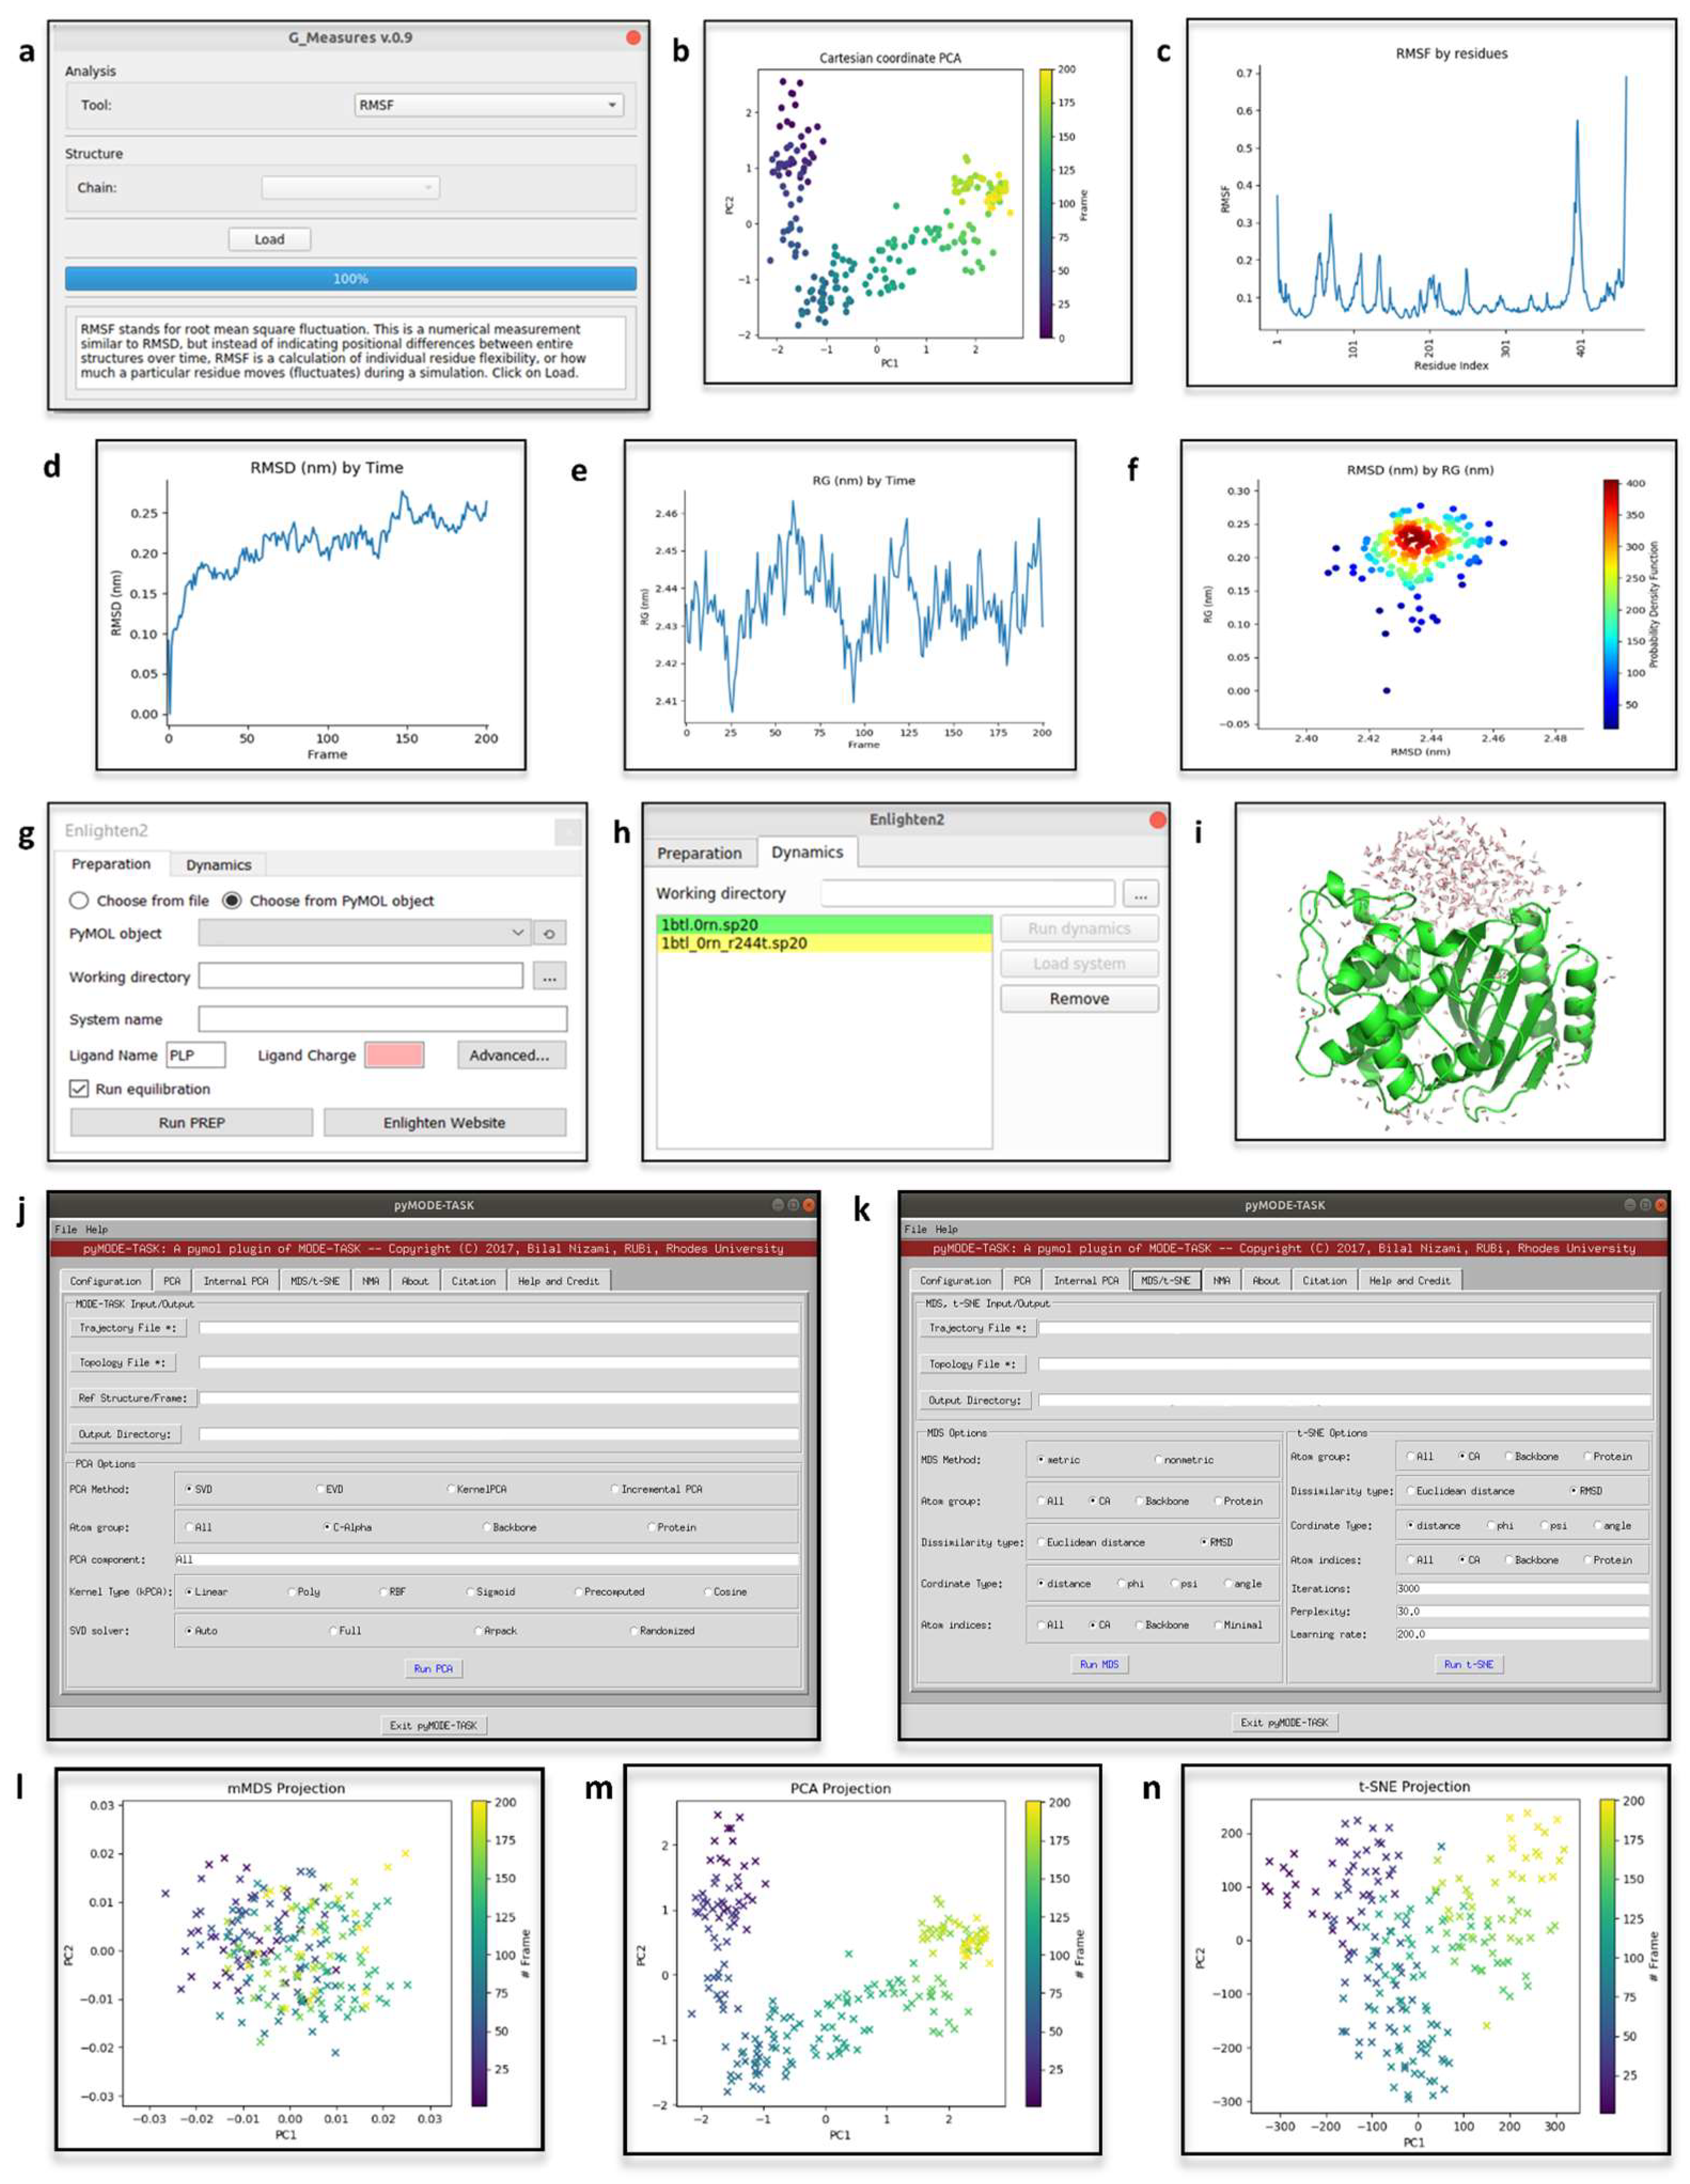
4.1. Geo-Measures
4.2. Enlighten2

4.3. pyMODE-TASK
5. Conclusions
Author Contributions
Funding
Institutional Review Board Statement
Informed Consent Statement
Conflicts of Interest
References
- DeLano, W.L. The PyMOL Molecular Graphics System; DeLano Scientific: San Carlos, CA, USA, 2002. [Google Scholar]
- PyMOL. Available online: http://www.pymol.org/pymol (accessed on 14 October 2022).
- Summerfield, M. Rapid GUI Programming with Python and Qt: The Definitive Guide to PyQt Programming; Prentice Hall: Upper Saddle River, NJ, USA, 2008; ISBN 9780132354189. [Google Scholar]
- An Introduction to Tkinter. Available online: www.Pythonware.Com/Library/Tkinter/Introduction/Index.Htm (accessed on 14 October 2022).
- Anaconda Software Distribution. Anaconda Documentation. Available online: https://docs.anaconda.com/ (accessed on 14 October 2022).
- Van Rossum, G.; Drake, F.L. Python 3 Reference Manual; CreateSpace: Scotts Valley, CA, USA, 2009; ISBN 1441412697. [Google Scholar]
- Woo, M.; Neider, J.; Davis, T.; Shreiner, D. OpenGL Programming Guide: The Official Guide to Learning OpenGL, version 1.2; Addison-Wesley Longman Publishing Co. Inc.: Boston, MA, USA, 1999. [Google Scholar]
- Mooers, B.H.M. Shortcuts for faster image creation in PyMOL. Protein Sci. 2020, 29, 268–276. [Google Scholar] [CrossRef] [PubMed] [Green Version]
- Goodsell, D.S.; Jenkinson, J. Molecular Illustration in Research and Education: Past, Present, and Future. J. Mol. Biol. 2018, 430, 3969–3981. [Google Scholar] [CrossRef] [PubMed]
- Martinez, X.; Krone, M.; Alharbi, N.; Rosem, A.S.; Laramee, R.S.; O’Donoghue, S.; Baaden, M.; Chavent, M. Molecular Graphics: Bridging Structural Biologists and Computer Scientists. Structure 2019, 27, 1617–1623. [Google Scholar] [CrossRef]
- Lill, M.A.; Danielson, M.L. Computer-aided drug design platform using PyMOL. J. Comput. Aided Mol. Des. 2011, 25, 13–19. [Google Scholar] [CrossRef] [PubMed]
- Yuan, S.; Chan, H.C.S.; Hu, Z. Using PyMOL as a platform for computational drug design. Wiley Interdiscip. Rev. Comput. Mol. Sci. 2017, 7, e1298. [Google Scholar] [CrossRef]
- Chovancova, E.; Pavelka, A.; Benes, P.; Strnad, O.; Brezovsky, J.; Kozlikova, B.; Gora, A.; Sustr, V.; Klvana, M.; Medek, P.; et al. CAVER 3.0: A tool for the analysis of transport pathways in dynamic protein structures. PLoS Comput. Biol. 2012, 8, e1002708. [Google Scholar] [CrossRef] [Green Version]
- Chaudhury, S.; Lyskov, S.; Gray, J.J. PyRosetta: A script-based interface for implementing molecular modeling algorithms using Rosetta. Bioinformatics 2010, 26, 689–691. [Google Scholar] [CrossRef] [Green Version]
- Makarewicz, T.; Kaźmierkiewicz, R. Molecular dynamics simulation by GROMACS using GUI plugin for PyMOL. J. Chem. Inf. Model. 2013, 53, 1229–1234. [Google Scholar] [CrossRef]
- Jurrus, E.; Engel, D.; Star, K.; Monson, K.; Brandi, J.; Felberg, L.E.; Brookes, D.H.; Wilson, L.; Chen, J.; Liles, K.; et al. Improvements to the APBS biomolecular solvation software suite. Protein Sci. 2018, 27, 112–128. [Google Scholar] [CrossRef] [Green Version]
- Janson, G.; Paiardini, A. PyMod 3: A complete suite for structural bioinformatics in PyMOL. Bioinformatics 2021, 37, 1471–1472. [Google Scholar] [CrossRef]
- Altschul, S.; Madden, T.; Schäffer, A.; Zhang, J.; Zhang, Z.; Miller, W.; Lipman, D. Gapped BLAST and PSI-BLAST: A new generation of protein database search programs. Nucleic Acids Res. 1997, 25, 3389–3402. [Google Scholar] [CrossRef] [Green Version]
- Edgar, R.C. MUSCLE: Multiple sequence alignment with high accuracy and high throughput. Nucleic Acids Res. 2004, 32, 1792–1797. [Google Scholar] [CrossRef] [Green Version]
- Thompson, J.D.; Higgins, D.G.; Gibson, T.J. CLUSTAL W: Improving the sensitivity of progressive multiple sequence alignment through sequence weighting, position-specific gap penalties and weight matrix choice. Nucleic Acids Res. 1994, 22, 4673–4680. [Google Scholar] [CrossRef] [PubMed] [Green Version]
- Sievers, F.; Wilm, A.; Dineen, D.; Gibson, T.J.; Karplus, K.; Li, W.; Lopez, R.; McWilliam, H.; Remmert, M.; Söding, J.; et al. Fast, scalable generation of high-quality protein multiple sequence alignments using Clustal Omega. Mol. Syst. Biol. 2011, 7, 539. [Google Scholar] [CrossRef] [PubMed]
- Crooks, G.E.; Hon, G.; Chandonia, J.M.; Brenner, S.E. WebLogo: A sequence logo generator. Genome Res. 2004, 14, 1188–1190. [Google Scholar] [CrossRef] [PubMed] [Green Version]
- Robert, X.; Gouet, P. Deciphering key features in protein structures with the new ENDscript server. Nucl. Acids Res. 2014, 42, W320–W324. [Google Scholar] [CrossRef] [Green Version]
- Paiardini, A.; Bossa, F.; Pascarella, S. CAMPO, SCR_FIND and CHC_FIND: A suite of web tools for computational structural biology. Nucleic Acids Res. 2005, 33, W50–W55. [Google Scholar] [CrossRef] [Green Version]
- Jones, D.T. Protein secondary structure prediction based on position-specific scoring matrices. J. Mol. Biol. 1999, 292, 195–202. [Google Scholar] [CrossRef] [Green Version]
- Webb, B.; Sali, A. Comparative Protein Structure Modeling Using MODELLER. Curr. Protoc. Bioinform. 2016, 54, 5.6.1–5.6.37. [Google Scholar] [CrossRef] [Green Version]
- Madhusudhan, M.S.; Webb, B.M.; Marti-Renom, M.A.; Eswar, N.; Sali, A. Alignment of multiple protein structures based on sequence and structure features. Protein Eng. Des. Sel. 2009, 22, 569–574. [Google Scholar] [CrossRef]
- Shen, M.Y.; Sali, A. Statistical potential for assessment and prediction of protein structures. Protein Sci. 2006, 15, 2507–2524. [Google Scholar] [CrossRef] [PubMed] [Green Version]
- Rasool, S.; Veyron, S.; Soya, N.; Eldeeb, M.A.; Lukacs, G.L.; Fon, E.A.; Trempe, J.F. Mechanism of PINK1 activation by autophosphorylation and insights into assembly on the TOM complex. Mol. Cell 2022, 82, 44–59.e6. [Google Scholar] [CrossRef] [PubMed]
- Hofrichter, M.; Kellner, H.; Herzog, R.; Karich, A.; Kiebist, J.; Scheibner, K.; Ullrich, R. Peroxide-Mediated Oxygenation of Organic Compounds by Fungal Peroxygenases. Antioxidants 2022, 11, 163. [Google Scholar] [CrossRef]
- Hsin, K.T.; Hsieh, M.C.; Lee, Y.H.; Lin, K.C.; Cheng, Y.S. Insight into the Phylogeny and Binding Ability of WRKY Transcription Factors. Int. J. Mol. Sci. 2022, 23, 2895. [Google Scholar] [CrossRef] [PubMed]
- Trabalzini, L.; Ercoli, J.; Trezza, A.; Schiavo, I.; Macrì, G.; Moglia, A.; Spiga, O.; Finetti, F. Pharmacological and In Silico Analysis of Oat Avenanthramides as EGFR Inhibitors: Effects on EGF-Induced Lung Cancer Cell Growth and Migration. Int. J. Mol. Sci. 2022, 23, 8534. [Google Scholar] [CrossRef]
- Jumper, J.; Evans, R.; Pritzel, A.; Green, T.; Figurnov, M.; Ronneberger, O.; Tunyasuvunakool, K.; Bates, R.; Žídek, A.; Potapenko, A.; et al. Highly accurate protein structure prediction with AlphaFold. Nature 2021, 596, 583–589. [Google Scholar] [CrossRef]
- Ferrario, E.; Miggiano, R.; Rizzi, M.; Ferraris, D.M. The integration of AlphaFold-predicted and crystal structures of human trans-3-hydroxy-l-proline dehydratase reveals a regulatory catalytic mechanism. Comput. Struct. Biotechnol. J. 2022, 20, 3874–3883. [Google Scholar] [CrossRef]
- Hirano, S.; Nishimasu, H.; Ishitani, R.; Nureki, O. Structural Basis for the Altered PAM Specificities of Engineered CRISPR-Cas9. Mol. Cell 2016, 61, 886–894. [Google Scholar] [CrossRef] [Green Version]
- Bayliss, R.; Sardon, T.; Vernos, I.; Conti, E. Structural basis of Aurora-A activation by TPX2 at the mitotic spindle. Mol. Cell 2003, 12, 851–862. [Google Scholar] [CrossRef]
- Ghavasieh, A.; Nicolini, C.; De Domenico, M. Statistical physics of complex information dynamics. Phys. Rev. E 2020, 102, 052304. [Google Scholar] [CrossRef]
- Di Paola, L.; De Ruvo, M.; Paci, P.; Santoni, D.; Giuliani, A. Protein contact networks: An emerging paradigm in chemistry. Chem. Rev. 2013, 113, 1598–1613. [Google Scholar] [CrossRef] [PubMed]
- Ribeiro, A.A.; Ortiz, V. Determination of Signaling Pathways in Proteins through Network Theory: Importance of the Topology. J. Chem. Theory Comput. 2014, 10, 1762–1769. [Google Scholar] [CrossRef] [PubMed]
- Del Sol, A.; Fujihashi, H.; O’Meara, P. Topology of small-world networks of protein-protein complex structures. Bioinformatics 2005, 21, 1311–1315. [Google Scholar] [CrossRef] [PubMed] [Green Version]
- Guarnera, E.; Tan, Z.W.; Zheng, Z.; Berezovsky, I.N. AlloSigMA: Allosteric signaling and mutation analysis server. Bioinformatics 2017, 33, 3996–3998. [Google Scholar] [CrossRef] [Green Version]
- Higman, V.A.; Greene, L.H. Elucidation of conserved long-range interaction networks in proteins and their significance in determining protein topology. Physica A 2006, 368, 595–606. [Google Scholar] [CrossRef]
- Sladek, V.; Yamamoto, Y.; Harada, R.; Shoji, M.; Shigeta, Y.; Sladek, V. pyProGA-A PyMOL plugin for protein residue network analysis. PLoS ONE 2021, 16, e0255167. [Google Scholar] [CrossRef]
- Fedorov, D.G.; Nagata, T.; Kitaura, K. Exploring chemistry with the fragment molecular orbital method. Phys. Chem. Chem. Phys. 2012, 14, 7562–7577. [Google Scholar] [CrossRef]
- Case, D.A.; Cheatham, T.E., 3rd; Darden, T.; Gohlke, H.; Luo, R.; Merz, K.M., Jr.; Onufriev, A.; Simmerling, C.; Wang, B.; Woods, R.J. The Amber biomolecular simulation programs. J. Comput. Chem. 2005, 26, 1668–1688. [Google Scholar] [CrossRef] [Green Version]
- Sladek, V.; Harada, R.; Shigeta, Y. Protein Dynamics and the Folding Degree. J. Chem. Inf. Model. 2020, 60, 1559–1567. [Google Scholar] [CrossRef]
- Sladek, V.; Harada, R.; Shigeta, Y. Residue Folding Degree-Relationship to Secondary Structure Categories and Use as Collective Variable. Int. J. Mol. Sci. 2021, 22, 13042. [Google Scholar] [CrossRef]
- Huang, P.S.; Feldmeier, K.; Parmeggiani, F.; Velasco, D.A.F.; Höcker, B.; Baker, D. De novo design of a four-fold symmetric TIM-barrel protein with atomic-level accuracy. Nat. Chem. Biol. 2016, 12, 29–34. [Google Scholar] [CrossRef] [PubMed] [Green Version]
- Moraes, I.; Evans, G.; Sanchez-Weatherby, J.; Newstead, S.; Stewart, P.D. Membrane protein structure determination—The next generation. Biochim. Biophys. Acta 2014, 1838, 78–87. [Google Scholar] [CrossRef] [PubMed] [Green Version]
- Almeida, J.G.; Preto, A.J.; Koukos, P.I.; Bonvin, A.M.J.J.; Moreira, I.S. Membrane proteins structures: A review on computational modeling tools. Biochim. Biophys. Acta Biomembr. 2017, 1859, 2021–2039. [Google Scholar] [CrossRef] [PubMed]
- Vinothkumar, K.R.; Henderson, R. Structures of membrane proteins. Q Rev. Biophys. 2010, 43, 65–158. [Google Scholar] [CrossRef] [Green Version]
- Schneidman-Duhovny, D.; Hammel, M. Modeling Structure and Dynamics of Protein Complexes with SAXS Profiles. Methods Mol. Biol. 2018, 1764, 449–473. [Google Scholar] [CrossRef] [Green Version]
- Baranowski, M.; Pérez, J. Solution X-Ray Scattering for Membrane Proteins. Methods Mol. Biol. 2020, 2168, 177–197. [Google Scholar] [CrossRef]
- Molodenskiy, D.S.; Svergun, D.I.; Mertens, H.D.T. MPBuilder: A PyMOL Plugin for Building and Refinement of Solubilized Membrane Proteins Against Small Angle X-ray Scattering Data. J. Mol. Biol. 2021, 433, 166888. [Google Scholar] [CrossRef]
- Anandan, A.; Dunstan, N.W.; Ryan, T.M.; Mertens, H.D.T.; Lim, K.Y.L.; Evans, G.L.; Kahler, C.M.; Vrielink, A. Conformational flexibility of EptA driven by an interdomain helix provides insights for enzyme-substrate recognition. IUCrJ 2021, 8, 732–746. [Google Scholar] [CrossRef]
- Spyrakis, F.; Ahmed, M.H.; Bayden, A.S.; Cozzini, P.; Mozzarelli, A.; Kellogg, G.E. The Roles of Water in the Protein Matrix: A Largely Untapped Resource for Drug Discovery. J. Med. Chem. 2017, 60, 6781–6827. [Google Scholar] [CrossRef]
- Barillari, C.; Taylor, J.; Viner, R.; Essex, J.W. Classification of water molecules in protein binding sites. J. Am. Chem. Soc. 2007, 129, 2577–2587. [Google Scholar] [CrossRef]
- Jukič, M.; Konc, J.; Gobec, S.; Janežič, D. Identification of Conserved Water Sites in Protein Structures for Drug Design. J. Chem. Inf. Model. 2017, 57, 3094–3103. [Google Scholar] [CrossRef] [PubMed]
- Jukič, M.; Konc, J.; Janežič, D.; Bren, U. ProBiS H2O MD Approach for Identification of Conserved Water Sites in Protein Structures for Drug Design. ACS Med. Chem. Lett. 2020, 11, 877–882. [Google Scholar] [CrossRef] [PubMed] [Green Version]
- Spitaleri, A.; Zia, S.R.; Di Micco, P.; Al-Lazikani, B.; Soler, M.A.; Rocchia, W. Tuning Local Hydration Enables a Deeper Understanding of Protein-Ligand Binding: The PP1-Src Kinase Case. J. Phys. Chem. Lett. 2021, 12, 49–58. [Google Scholar] [CrossRef] [PubMed]
- Sridhar, A.; Ross, G.A.; Biggin, P.C. Waterdock 2.0: Water placement prediction for Holo-structures with a pymol plugin. PLoS ONE 2017, 12, e0172743. [Google Scholar] [CrossRef] [Green Version]
- Dileep, K.V.; Ihara, K.; Mishima-Tsumagari, C.; Kukimoto-Niino, M.; Yonemochi, M.; Hanada, K.; Shirouzu, M.; Zhang, K. Crystal structure of human acetylcholinesterase in complex with tacrine: Implications for drug discovery. Int. J. Biol. Macromol. 2022, 210, 172–181. [Google Scholar] [CrossRef]
- Holm, L.; Rosenström, P. Dali server: Conservation mapping in 3D. Nucleic Acids Res. 2010, 38, W545–W549. [Google Scholar] [CrossRef]
- Shindyalov, I.N.; Bourne, P.E. Protein structure alignment by incremental combinatorial extension (CE) of the optimal path. Protein Eng. 1998, 11, 739–747. [Google Scholar] [CrossRef]
- Orengo, C.A.; Taylor, W.R. SSAP: Sequential structure alignment program for protein structure comparison. Methods Enzymol. 1996, 266, 617–635. [Google Scholar] [CrossRef]
- Gelly, J.C.; Joseph, A.P.; Srinivasan, N.; de Brevern, A.G. iPBA: A tool for protein structure comparison using sequence alignment strategies. Nucleic Acids Res. 2011, 39, W18–W23. [Google Scholar] [CrossRef] [Green Version]
- Faure, G.; Joseph, A.P.; Craveur, P.; Narwani, T.J.; Srinivasan, N.; Gelly, J.C.; Rebehmed, J.; de Brevern, A.G. iPBAvizu: A PyMOL plugin for an efficient 3D protein structure superimposition approach. Source Code Biol. Med. 2019, 14, 5. [Google Scholar] [CrossRef]
- Bima, A.I.H.; Elsamanoudy, A.Z.; Alghamdi, K.S.; Shinawi, T.; Mujalli, A.; Kaipa, P.R.; Aljeaid, D.; Awan, Z.; Shaik, N.A.; Banaganapalli, B. Molecular profiling of melanocortin 4 receptor variants and agouti-related peptide interactions in morbid obese phenotype: A novel paradigm from molecular docking and dynamics simulations. Biologia 2022, 77, 1481–1496. [Google Scholar] [CrossRef]
- Anies, S.; Jallu, V.; Diharce, J.; Narwani, T.J.; de Brevern, A.G. Analysis of Integrin αIIb Subunit Dynamics Reveals Long-Range Effects of Missense Mutations on Calf Domains. Int. J. Mol. Sci. 2019, 23, 858. [Google Scholar] [CrossRef] [PubMed]
- Rahman, M.S.; Hoque, M.N.; Islam, M.R.; Akter, S.; Rubayet Ul Alam, A.; Siddique, M.A.; Saha, O.; Rahaman, M.M.; Sultana, M.; Crandall, K.A.; et al. Epitope-based chimeric peptide vaccine design against S, M and E proteins of SARS-CoV-2, the etiologic agent of COVID-19 pandemic: An in silico approach. PeerJ 2020, 8, e9572. [Google Scholar] [CrossRef] [PubMed]
- Chatzou, M.; Magis, C.; Chang, J.M.; Kemena, C.; Bussotti, G.; Erb, I.; Notredame, C. Multiple sequence alignment modeling: Methods and applications. Brief Bioinform. 2016, 17, 1009–1023. [Google Scholar] [CrossRef] [Green Version]
- Edgar, R.C.; Batzoglou, S. Multiple sequence alignment. Curr. Opin. Struct. Biol. 2006, 16, 368–373. [Google Scholar] [CrossRef]
- Weigt, M.; White, R.A.; Szurmant, H.; Hoch, J.A.; Hwa, T. Identification of direct residue contacts in protein-protein interaction by message passing. Proc. Natl. Acad. Sci. USA 2009, 106, 67–72. [Google Scholar] [CrossRef] [Green Version]
- Thompson, J.D.; Linard, B.; Lecompte, O.; Poch, O. A comprehensive benchmark study of multiple sequence alignment methods: Current challenges and future perspectives. PLoS ONE 2011, 6, e18093. [Google Scholar] [CrossRef]
- Hogeweg, P.; Hesper, B. The alignment of sets of sequences and the construction of phyletic trees: An integrated method. J. Mol. Evol. 1984, 20, 175–186. [Google Scholar] [CrossRef]
- Michel, M.; Skwark, M.J.; Menendez Hurtado, D.; Ekeberg, M.; Elofsson, A. Predicting accurate contacts in thousands of Pfam domain families using PconsC3. Bioinformatics 2017, 33, 28592866. [Google Scholar] [CrossRef] [Green Version]
- Morcos, F.; Pagnani, A.; Lunt, B.; Bertolino, A.; Marks, D.S.; Sander, C.; Zecchina, R.; Onuchic, J.N.; Hwa, T.; Weigt, M. Direct-coupling analysis of residue coevolution captures native contacts across many protein families. J. Chem. Inf. Model. 2011, 108, E1293–E1301. [Google Scholar] [CrossRef]
- Morcos, F.; Jana, B.; Hwa, T.; Onuchic, J.N. Coevolutionary signals across protein lineages help capture multiple protein conformations. Proc. Natl. Acad. Sci. USA 2013, 110, 20533–20538. [Google Scholar] [CrossRef] [PubMed] [Green Version]
- Jarmolinska, A.I.; Zhou, Q.; Sulkowska, J.I.; Morcos, F. DCA-MOL: A PyMOL Plugin To Analyze Direct Evolutionary Couplings. J. Chem. Inf. Model. 2019, 59, 625–629. [Google Scholar] [CrossRef] [PubMed]
- Dos Santos, R.N.; Ferreira, L.G.; Andricopulo, A.D. Practices in Molecular Docking and Structure-Based Virtual Screening. Methods Mol. Biol. 2018, 1762, 31–50. [Google Scholar] [CrossRef] [PubMed]
- Rosignoli, S.; Paiardini, A. DockingPie: A consensus docking plugin for PyMOL. Bioinformatics 2022, 38, 4233–4234. [Google Scholar] [CrossRef] [PubMed]
- Koes, D.R.; Baumgartner, M.P.; Camacho, C.J. Lessons learned in empirical scoring with smina from the CSAR 2011 benchmarking exercise. J. Chem. Inf. Model. 2013, 53, 1893–1904. [Google Scholar] [CrossRef] [PubMed] [Green Version]
- Eberhardt, J.; Santos-Martins, D.; Tillack, A.F.; Forli, S. AutoDock Vina 1.2.0: New Docking Methods, Expanded Force Field, and Python Bindings. J. Chem. Inf. Model. 2021, 61, 3891–3898. [Google Scholar] [CrossRef]
- Ruiz-Carmona, S.; Alvarez-Garcia, D.; Foloppe, N.; Garmendia-Doval, A.B.; Juhos, S.; Schmidtke, P.; Barril, X.; Hubbard, R.E.; Morley, S.D. rDock: A fast, versatile and open source program for docking ligands to proteins and nucleic acids. PLoS Comput. Biol. 2014, 10, e1003571. [Google Scholar] [CrossRef] [Green Version]
- Morley, S.D.; Afshar, M. Validation of an empirical RNA-ligand scoring function for fast flexible docking using Ribodock. J. Comput. Aided Mol. Des. 2004, 18, 189–208. [Google Scholar] [CrossRef]
- Ravindranath, P.A.; Forli, S.; Goodsell, D.S.; Olson, A.J.; Sanner, M.F. AutoDockFR: Advances in Protein-Ligand Docking with Explicitly Specified Binding Site Flexibility. J. PLoS Comput. Biol. 2015, 11, e1004586. [Google Scholar] [CrossRef] [Green Version]
- Houston, D.R.; Walkinshaw, M.D. Consensus docking: Improving the reliability of docking in a virtual screening context. J. Chem. Inf. Model. 2013, 53, 384–390. [Google Scholar] [CrossRef]
- Palacio-Rodríguez, K.; Lans, I.; Cavasotto, C.N.; Cossio, P. Exponential consensus ranking improves the outcome in docking and receptor ensemble docking. Sci. Rep. 2019, 9, 5142. [Google Scholar] [CrossRef] [PubMed] [Green Version]
- Brenke, R.; Kozakov, D.; Chuang, G.Y.; Beglov, D.; Hall, D.; Landon, M.R.; Mattos, C.; Vajda, S. Fragment-based identification of druggable ’hot spots’ of proteins using Fourier domain correlation techniques. Bioinformatics 2009, 25, 621–627. [Google Scholar] [CrossRef] [PubMed] [Green Version]
- Teixeira, O.; Lacerda, P.; Froes, T.Q.; Nonato, M.C.; Castilho, M.S. Druggable hot spots in trypanothione reductase: Novel insights and opportunities for drug discovery revealed by DRUGpy. J. Comput. Aided Mol. Des. 2021, 35, 871–882. [Google Scholar] [CrossRef] [PubMed]
- Tang, L.; Gamal El-Din, T.M.; Swanson, T.M.; Pryde, D.C.; Scheuer, T.; Zheng, N.; Catterall, W.A. Structural basis for inhibition of a voltage-gated Ca2+ channel by Ca2+ antagonist drugs. Nature 2016, 537, 117–121. [Google Scholar] [CrossRef] [Green Version]
- Williams, J.C.; Kalyaanamoorthy, S. PoseFilter: A PyMOL Plugin for filtering and analyzing small molecule docking in symmetric binding sites. Bioinformatics 2021, 37, 3367–3368. [Google Scholar] [CrossRef]
- Kagami, L.P.; das Neves, G.M.; Timmers, L.F.S.M.; Caceres, R.A.; Eifler-Lima, V.L. Geo-Measures: A PyMOL plugin for protein structure ensembles analysis. J. Comput. Biol. Chem. 2020, 87, 107322. [Google Scholar] [CrossRef]
- McGibbon, R.T.; Beauchamp, K.A.; Harrigan, M.P.; Klein, C.; Swails, J.M.; Hernández, C.X.; Schwantes, C.R.; Wang, L.P.; Lane, T.J.; Pande, V.S. MDTraj: A Modern Open Library for the Analysis of Molecular Dynamics Trajectories. Biophys. J. 2015, 109, 1528–1532. [Google Scholar] [CrossRef] [Green Version]
- Ghosh, A.; Sarmah, P.; Patel, H.; Mukerjee, N.; Mishra, R.; Alkahtani, S.; Varma, R.S.; Baishya, D. Nonlinear molecular dynamics of quercetin in Gynocardia odorata and Diospyros malabarica fruits: Its mechanistic role in hepatoprotection. PLoS ONE 2022, 17, e0263917. [Google Scholar] [CrossRef]
- Mukerjee, N.; Das, A.; Maitra, S.; Ghosh, A.; Khan, P.; Alexiou, A.; Dey, A.; Baishya, D.; Ahmad, F.; Sachdeva, P.; et al. Dynamics of natural product Lupenone as a potential fusion inhibitor against the spike complex of novel Semliki Forest Virus. PLoS ONE 2022, 17, e0263853. [Google Scholar] [CrossRef]
- Zinovjev, K.; van der Kamp, M.W. Enlighten2: Molecular dynamics simulations of protein-ligand systems made accessible. Bioinformatics 2020, 36, 5104–5106. [Google Scholar] [CrossRef]
- Ponder, J.W.; Case, D.A. Force fields for protein simulations. Adv. Protein Chem. 2003, 66, 27–85. [Google Scholar] [CrossRef] [PubMed]
- Rice, K.; Batul, K.; Whiteside, J.; Kelso, J.; Papinski, M.; Schmidt, E.; Pratasouskaya, A.; Wang, D.; Sullivan, R.; Bartlett, C.; et al. The predominance of nucleotidyl activation in bacterial phosphonate biosynthesis. Nat. Commun. 2019, 10, 3698. [Google Scholar] [CrossRef] [Green Version]
- Wang, L.; Parnell, A.; Williams, C.; Bakar, N.A.; Challand, M.R.; van der Kamp, M.W.; Simpson, T.J.; Race, P.R.; Crump, M.P.; Willis, C.L. A Rieske oxygenase/epoxide hydrolase-catalysed reaction cascade creates oxygen heterocycles in mupirocin biosynthesis. Nat. Catal. 2018, 1, 968–976. [Google Scholar] [CrossRef] [Green Version]
- Byrne, M.J.; Lees, N.R.; Han, L.C.; van der Kamp, M.W.; Mulholland, A.J.; Stach, J.E.; Willis, C.L.; Race, P.R. The Catalytic Mechanism of a Natural Diels-Alderase Revealed in Molecular Detail. J. Am. Chem. Soc. 2018, 138, 6095–6098. [Google Scholar] [CrossRef] [Green Version]
- Drulyte, I.; Obajdin, J.; Trinh, C.H.; Kalverda, A.P.; van der Kamp, M.W.; Hemsworth, G.R.; Berry, A. Crystal structure of the putative cyclase IdmH from the indanomycin nonribosomal peptide synthase/polyketide synthase. IUCrJ 2019, 6, 1120–1133. [Google Scholar] [CrossRef] [PubMed] [Green Version]
- Wang, J.; Wang, W.; Kollman, P.A.; Case, D.A. Automatic atom type and bond type perception in molecular mechanical calculations. J. Mol. Graph. Model. 2006, 25, 247–260. [Google Scholar] [CrossRef] [PubMed]
- Olsson, M.H.; Søndergaard, C.R.; Rostkowski, M.; Jensen, J.H. PROPKA3: Consistent Treatment of Internal and Surface Residues in Empirical pKa Predictions. J. Chem. Theory Comput. 2011, 7, 525–537. [Google Scholar] [CrossRef]
- Warkentin, R.; Kwan, D.H. Resources and Methods for Engineering “Designer” Glycan-Binding Proteins. Molecules 2021, 26, 380. [Google Scholar] [CrossRef]
- Thakker, R.V. Multiple endocrine neoplasia type 1 (MEN1). Best Pract. Res. Clin. Endocrinol. Metab. 2010, 24, 355–370. [Google Scholar] [CrossRef]
- Jelsch, C.; Mourey, L.; Masson, J.M.; Samama, J.P. Crystal structure of Escherichia coli TEM1 beta-lactamase at 1.8 A resolution. Proteins 1993, 16, 364–383. [Google Scholar] [CrossRef]
- Ross, C.; Nizami, B.; Glenister, M.; Sheik Amamuddy, O.; Atilgan, A.R.; Atilgan, C.; Tastan Bishop, Ö. MODE-TASK: Large-scale protein motion tools. Bioinformatics 2018, 34, 3759–3763. [Google Scholar] [CrossRef] [PubMed] [Green Version]
- Rajpoot, S.; Kumar, A.; Zhang, K.Y.J.; Gan, S.H.; Baig, M.S. TIRAP-mediated activation of p38 MAPK in inflammatory signaling. Sci. Rep. 2022, 12, 5601. [Google Scholar] [CrossRef] [PubMed]


| Name | Description | Release Date |
|---|---|---|
| DockingPie | A platform for molecular and consensus docking (PLI) | 2022 |
| PyMod | Environment for structural bioinformatics (PSSAs) | 2021 |
| pyProGA | Analysis of static protein residue networks (PSSAs) | 2021 |
| MPBuilder | Building and Refinement of Solubilized Membrane Proteins Against SAXS Data (PSSAs) | 2021 |
| PoseFilter | Filtering small molecule conformations ensemble (PLI) | 2021 |
| DRUGpy | Druggable hot spots identification (PLI) | 2021 |
| Geo-Measures | Analyses of protein structures ensemble (PD) | 2020 |
| Enlighten2 | A platform for MD simulations (PD) | 2020 |
| ProBiS H2O MD | MD-based prediction of conserved water sites (PSSAs) | 2020 |
| iPBAVizu 1 | Protein structure superposition approach (PSSAs) | 2019 |
| DCA-MOL 1 | Analysis of Direct Evolutionary Couplings (PSSAs) | 2019 |
| pyMODE-TASK 1 | Environment for MD trajectories analyses (PD) | 2018 |
| Waterdock 2.0 | Water placement prediction (PSSAs) | 2017 |
| ProBiS H2O | Conserved water sites identification (PSSAs) | 2017 |
Publisher’s Note: MDPI stays neutral with regard to jurisdictional claims in published maps and institutional affiliations. |
© 2022 by the authors. Licensee MDPI, Basel, Switzerland. This article is an open access article distributed under the terms and conditions of the Creative Commons Attribution (CC BY) license (https://creativecommons.org/licenses/by/4.0/).
Share and Cite
Rosignoli, S.; Paiardini, A. Boosting the Full Potential of PyMOL with Structural Biology Plugins. Biomolecules 2022, 12, 1764. https://doi.org/10.3390/biom12121764
Rosignoli S, Paiardini A. Boosting the Full Potential of PyMOL with Structural Biology Plugins. Biomolecules. 2022; 12(12):1764. https://doi.org/10.3390/biom12121764
Chicago/Turabian StyleRosignoli, Serena, and Alessandro Paiardini. 2022. "Boosting the Full Potential of PyMOL with Structural Biology Plugins" Biomolecules 12, no. 12: 1764. https://doi.org/10.3390/biom12121764