
Spatial Analysis of NQO1 in Non-Small Cell Lung Cancer Shows Its Expression Is Independent of NRF1 and NRF2 in the Tumor Microenvironment
 , , and
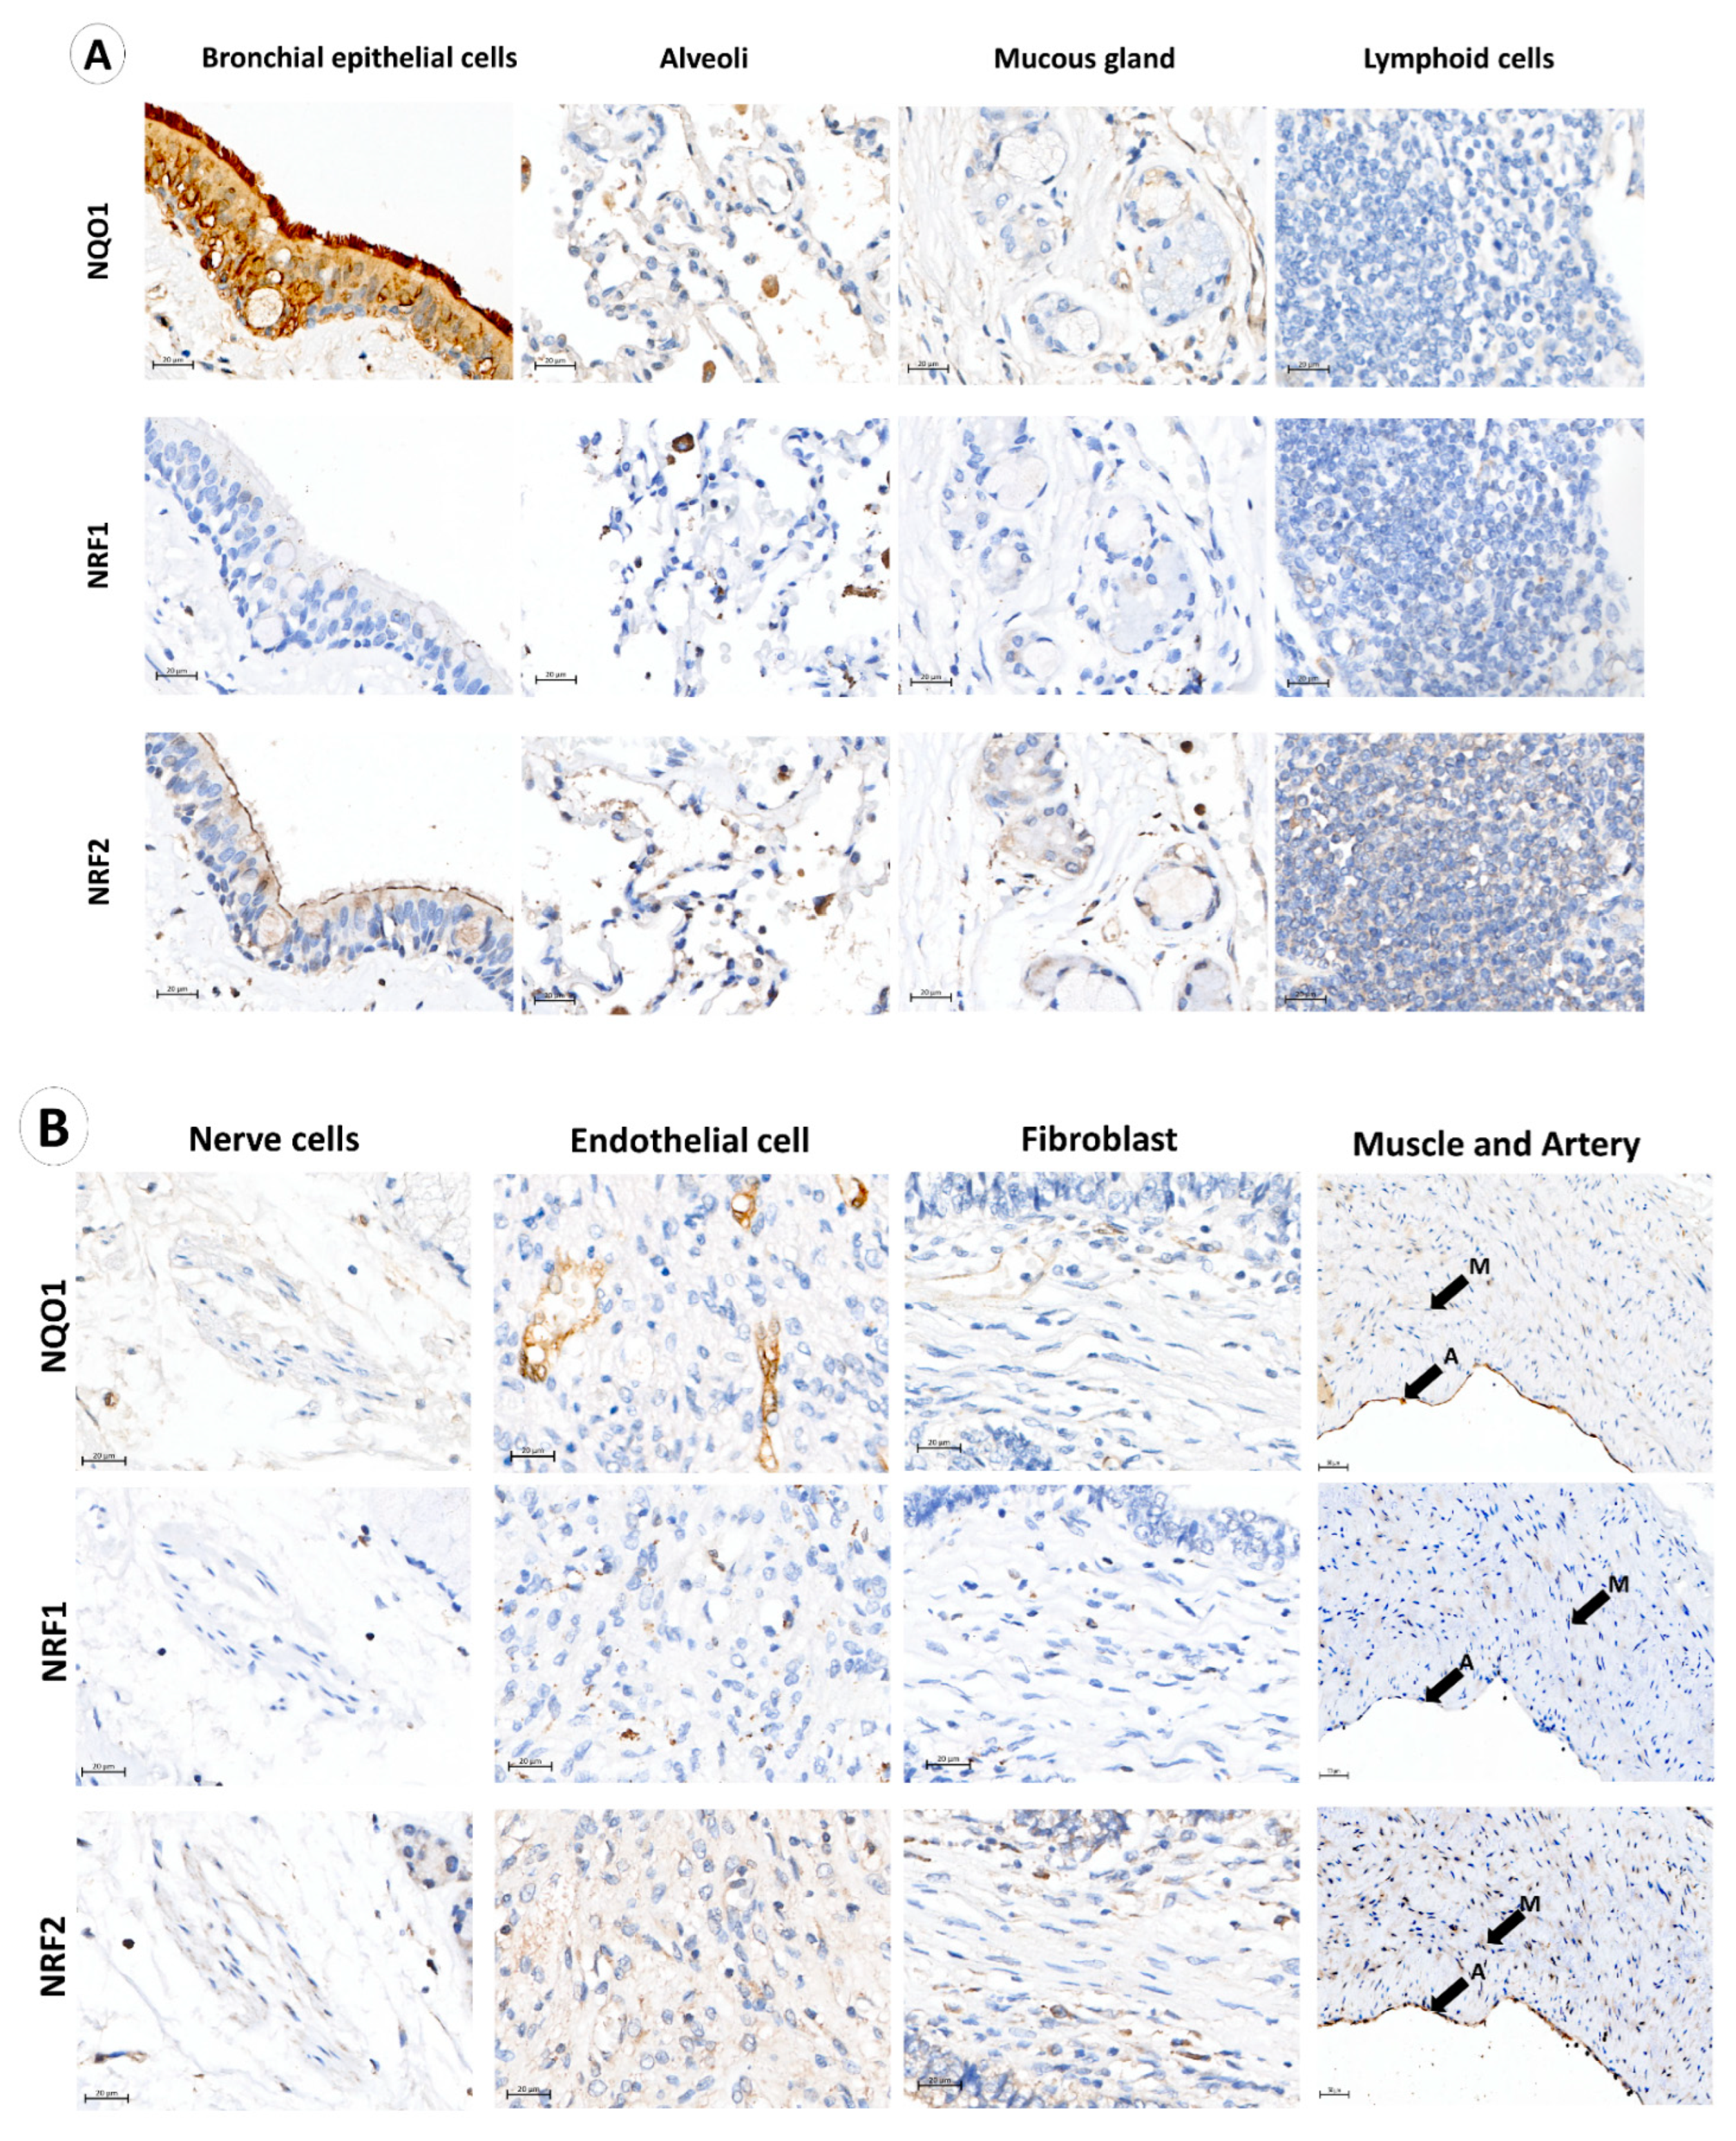
Abstract
:1. Introduction
2. Materials and Methods
2.1. Patients
2.2. Multiplexed Immunofluorescence (mIF) and Image Acquisition
2.3. Bioimage Analysis
2.4. Statistical Analysis
3. Results
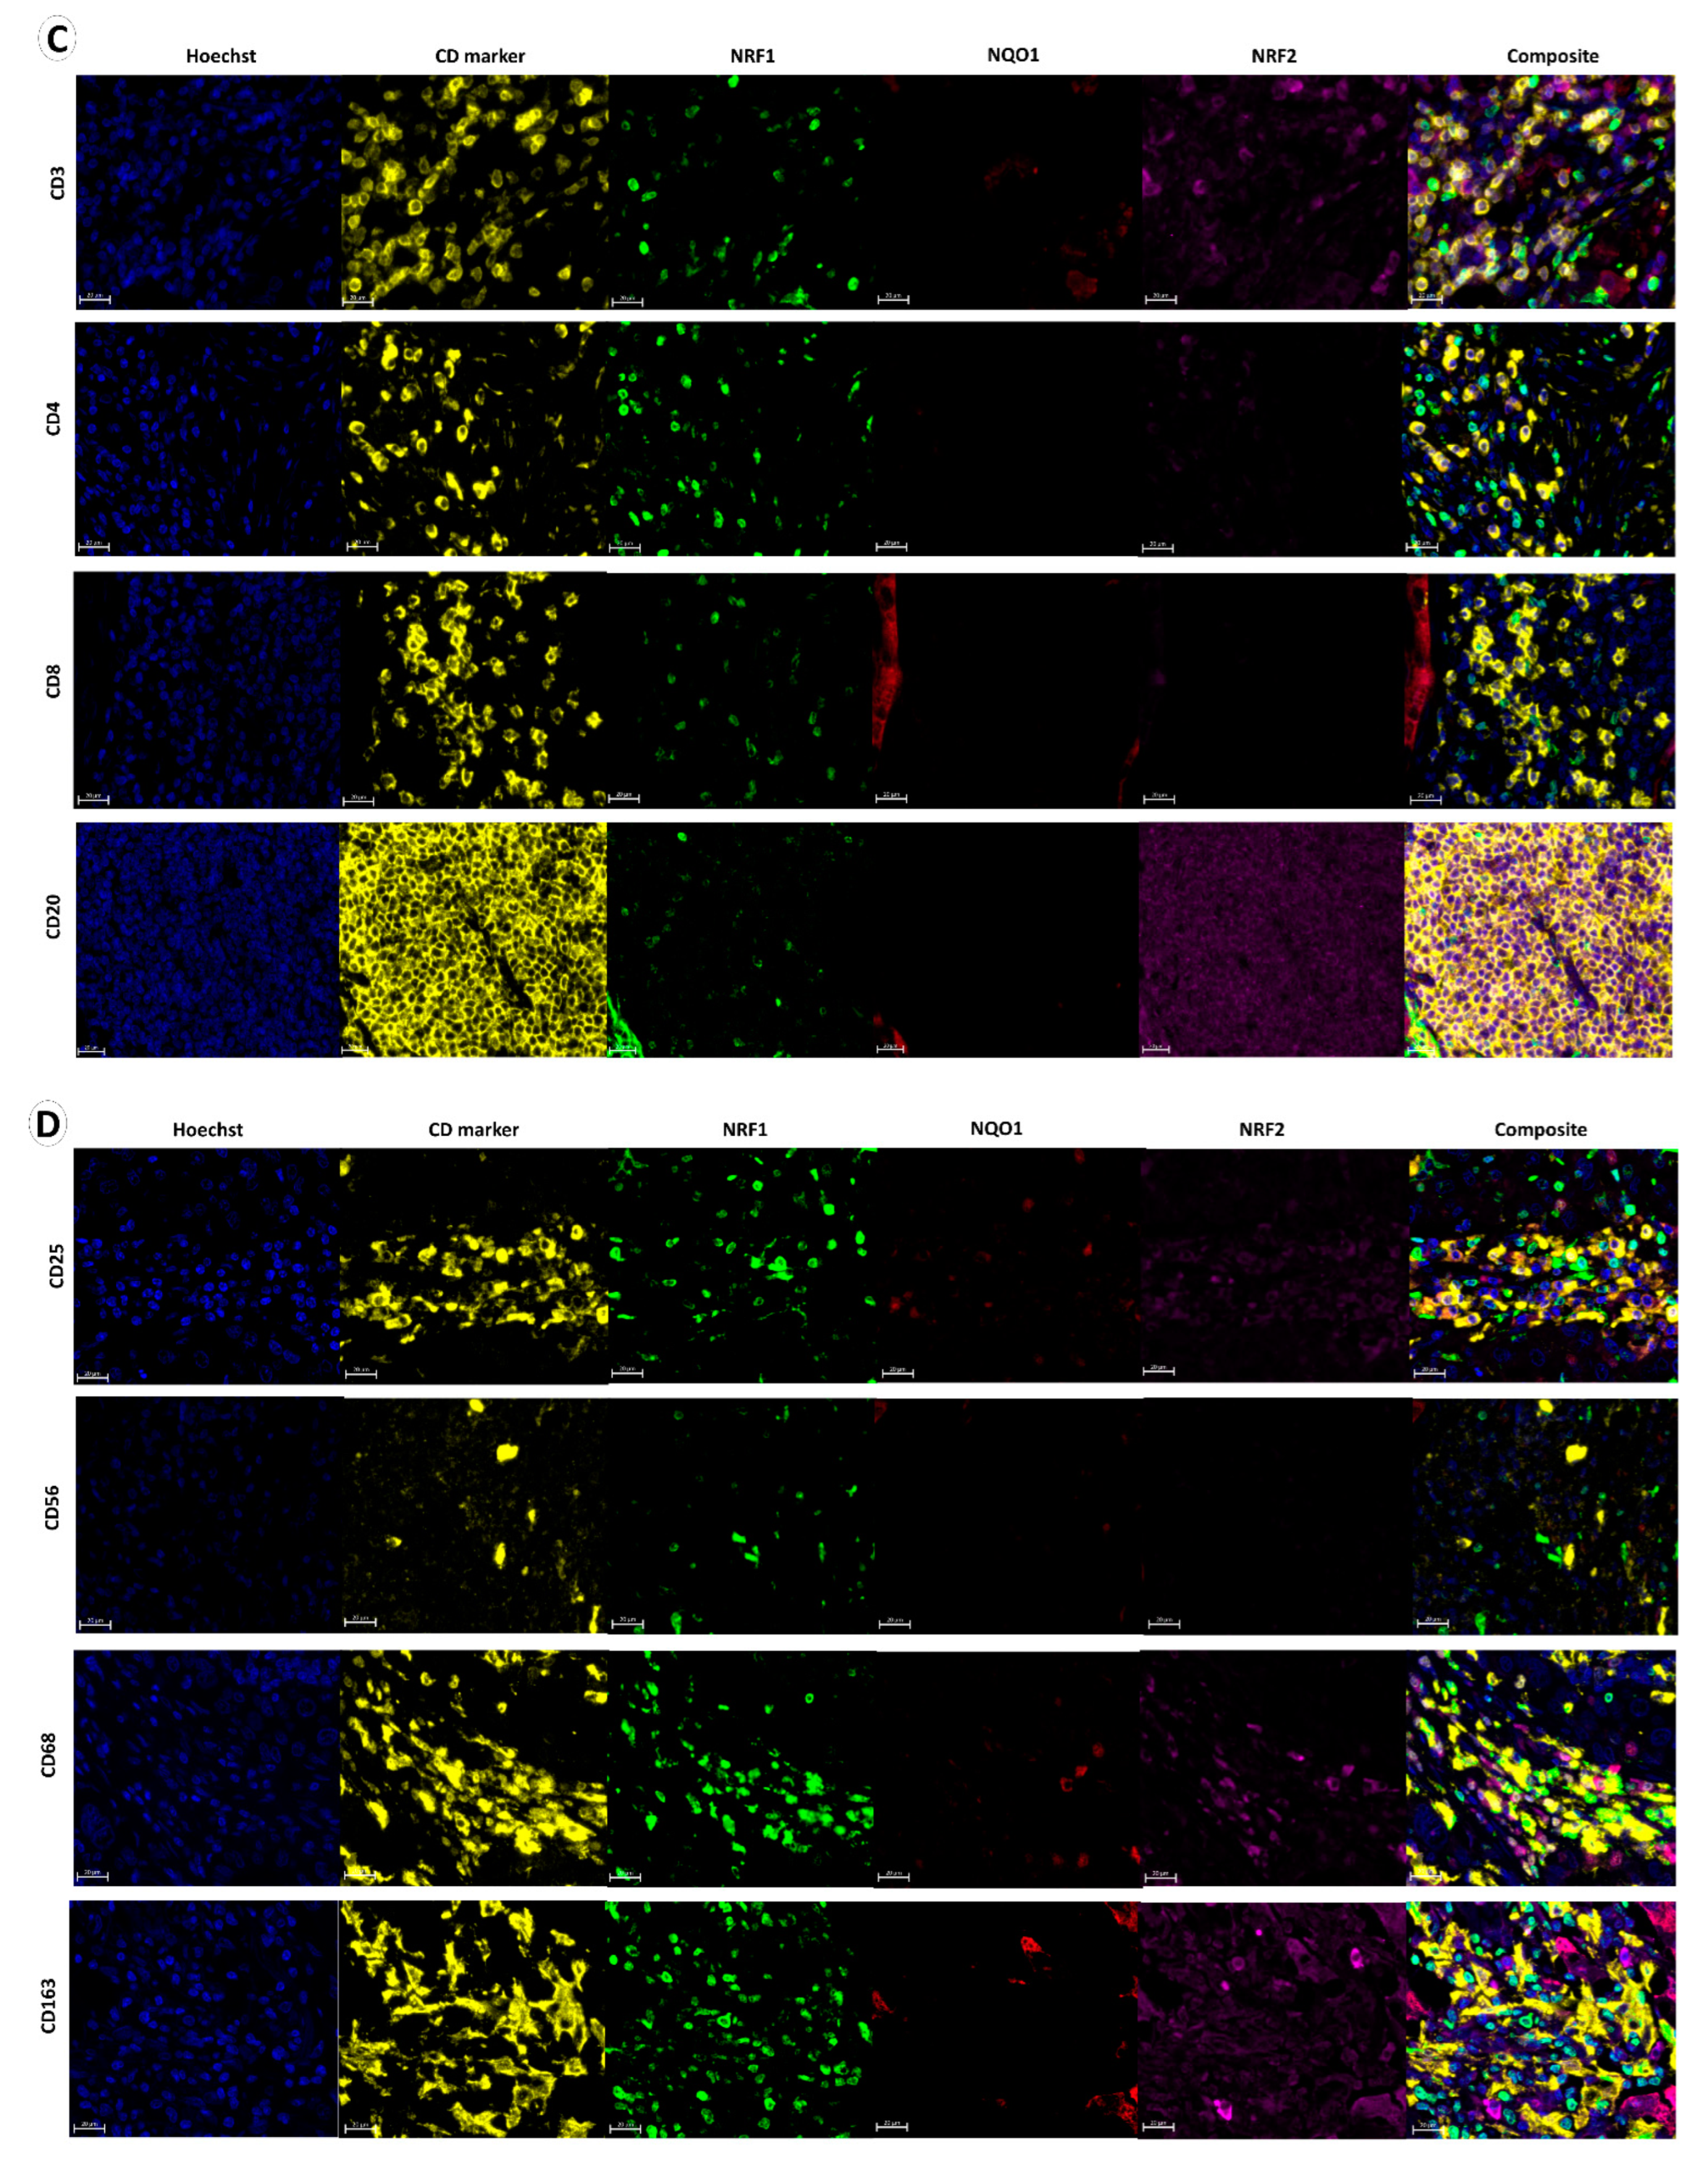
3.1. NQO1, NRF1 and NRF2 Expression in Normal Lung, Immune, Stromal and Cancer Cells
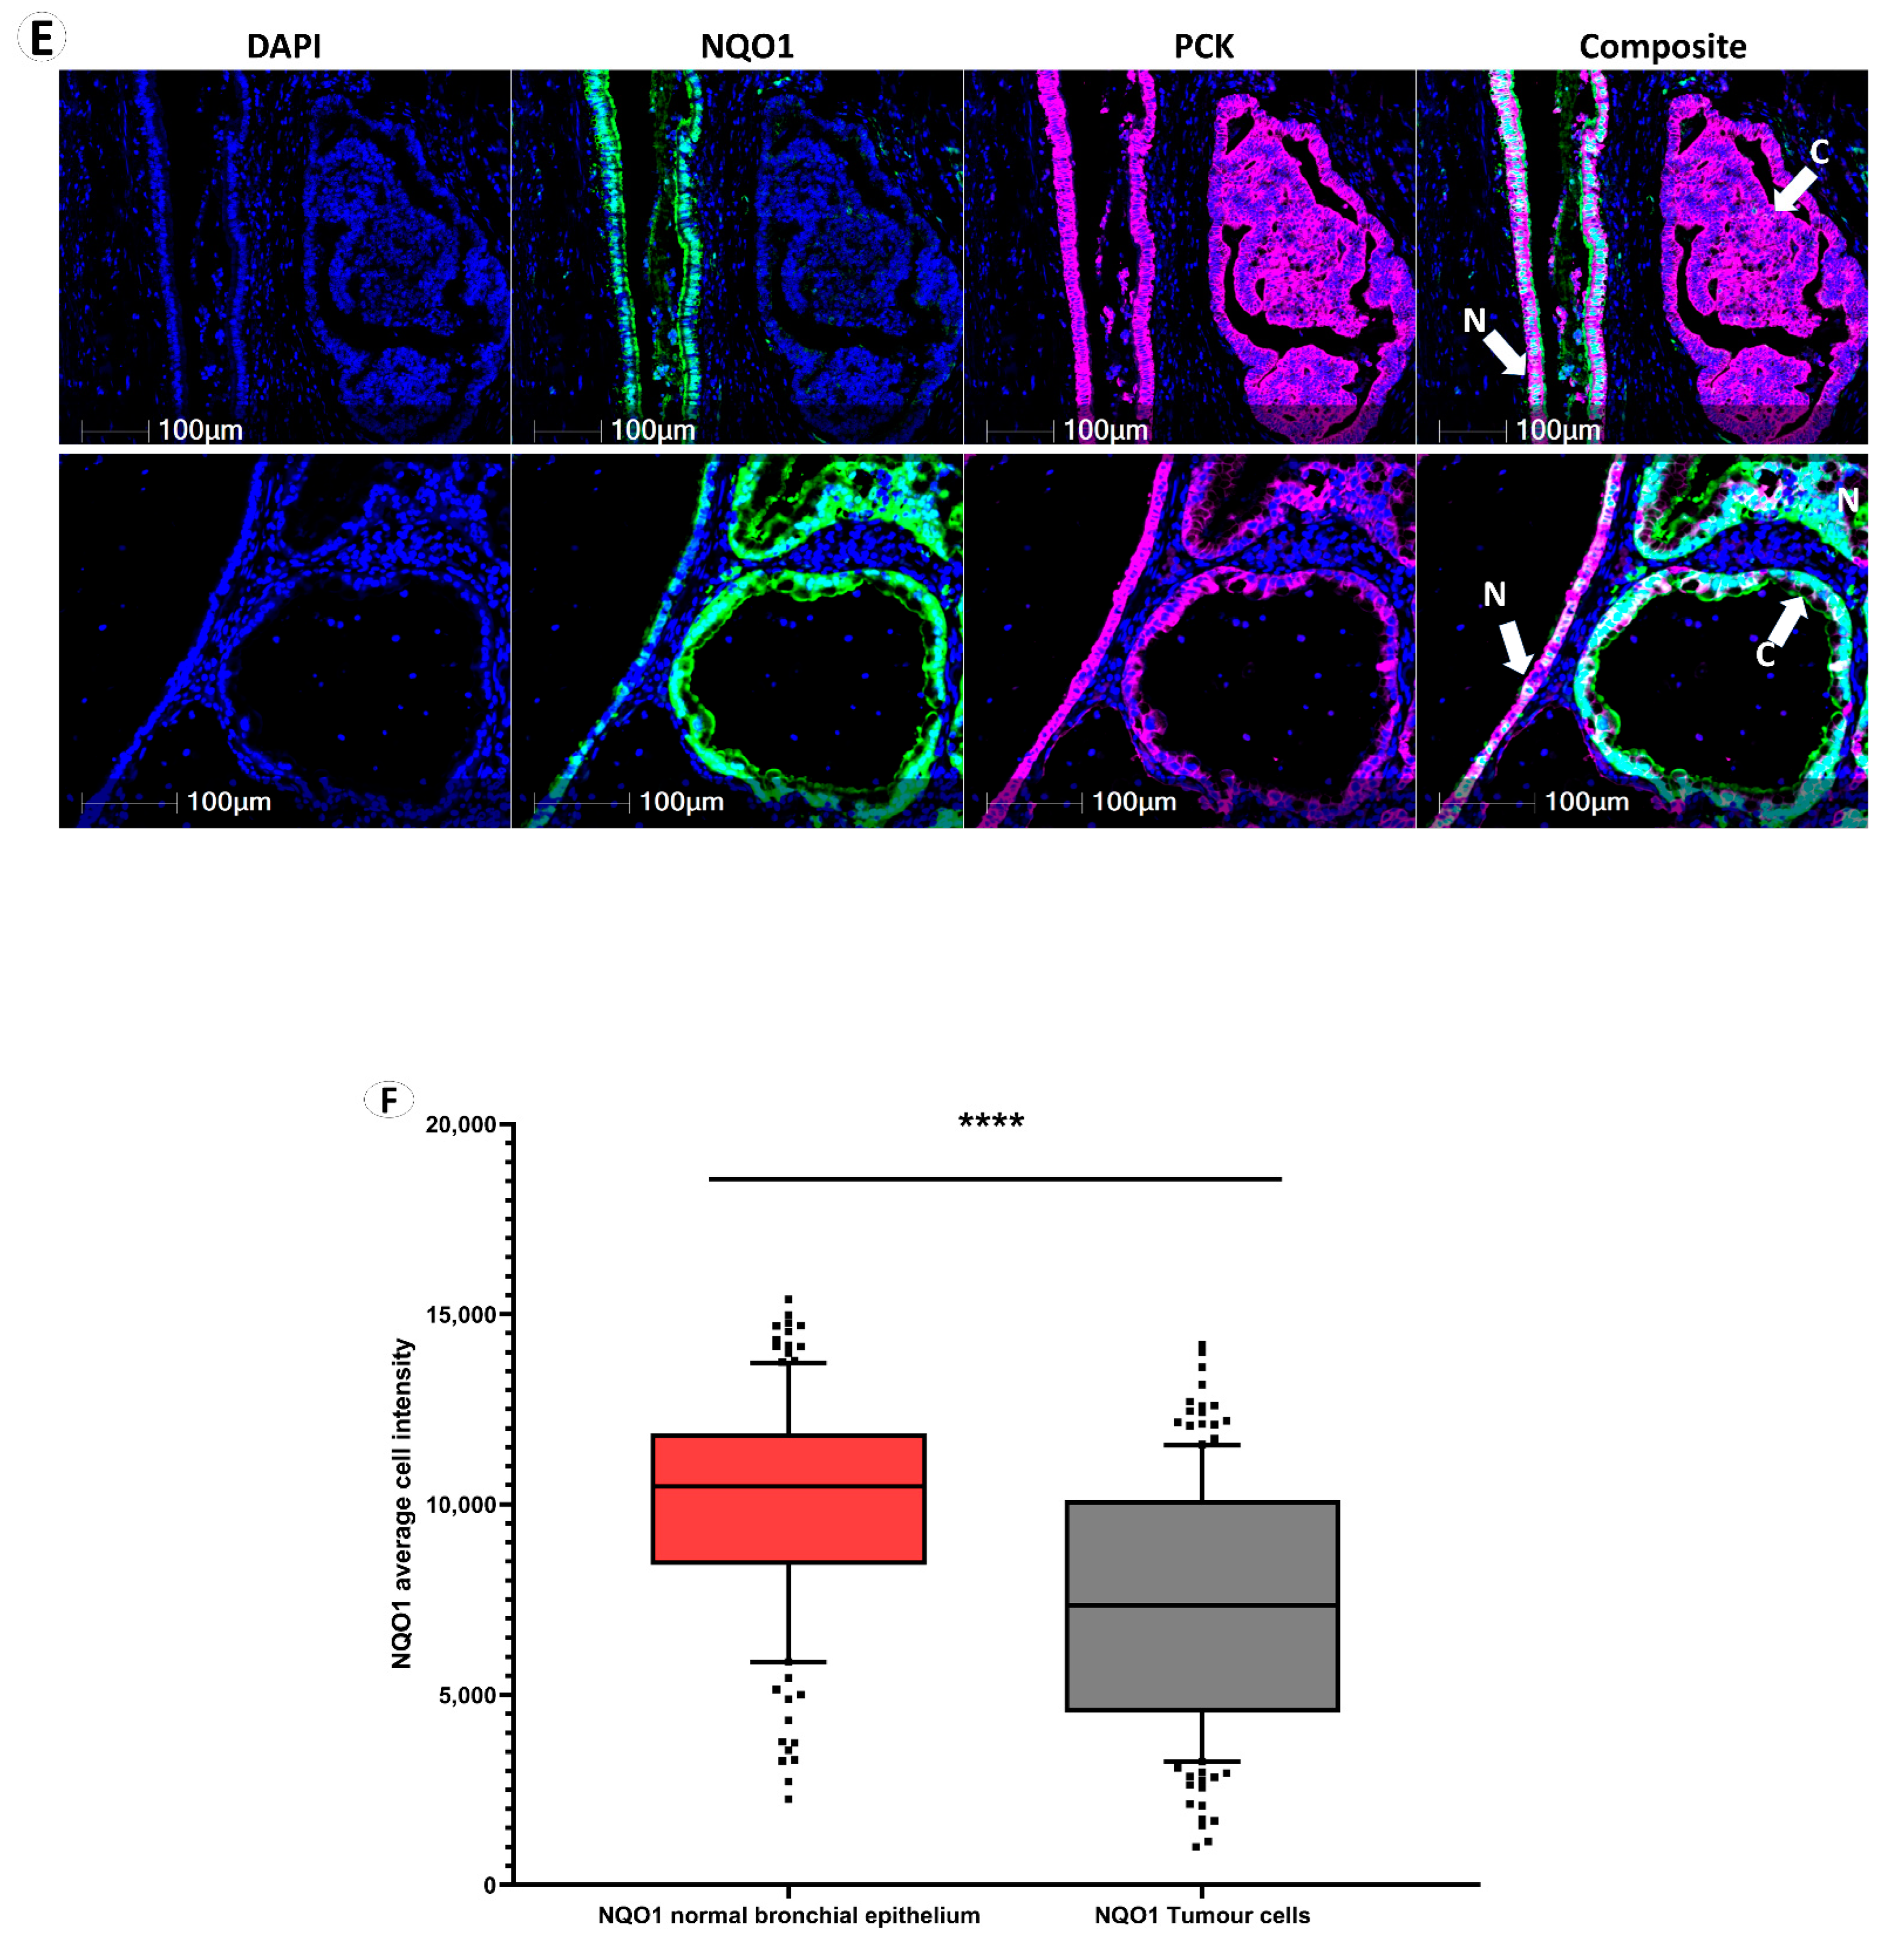
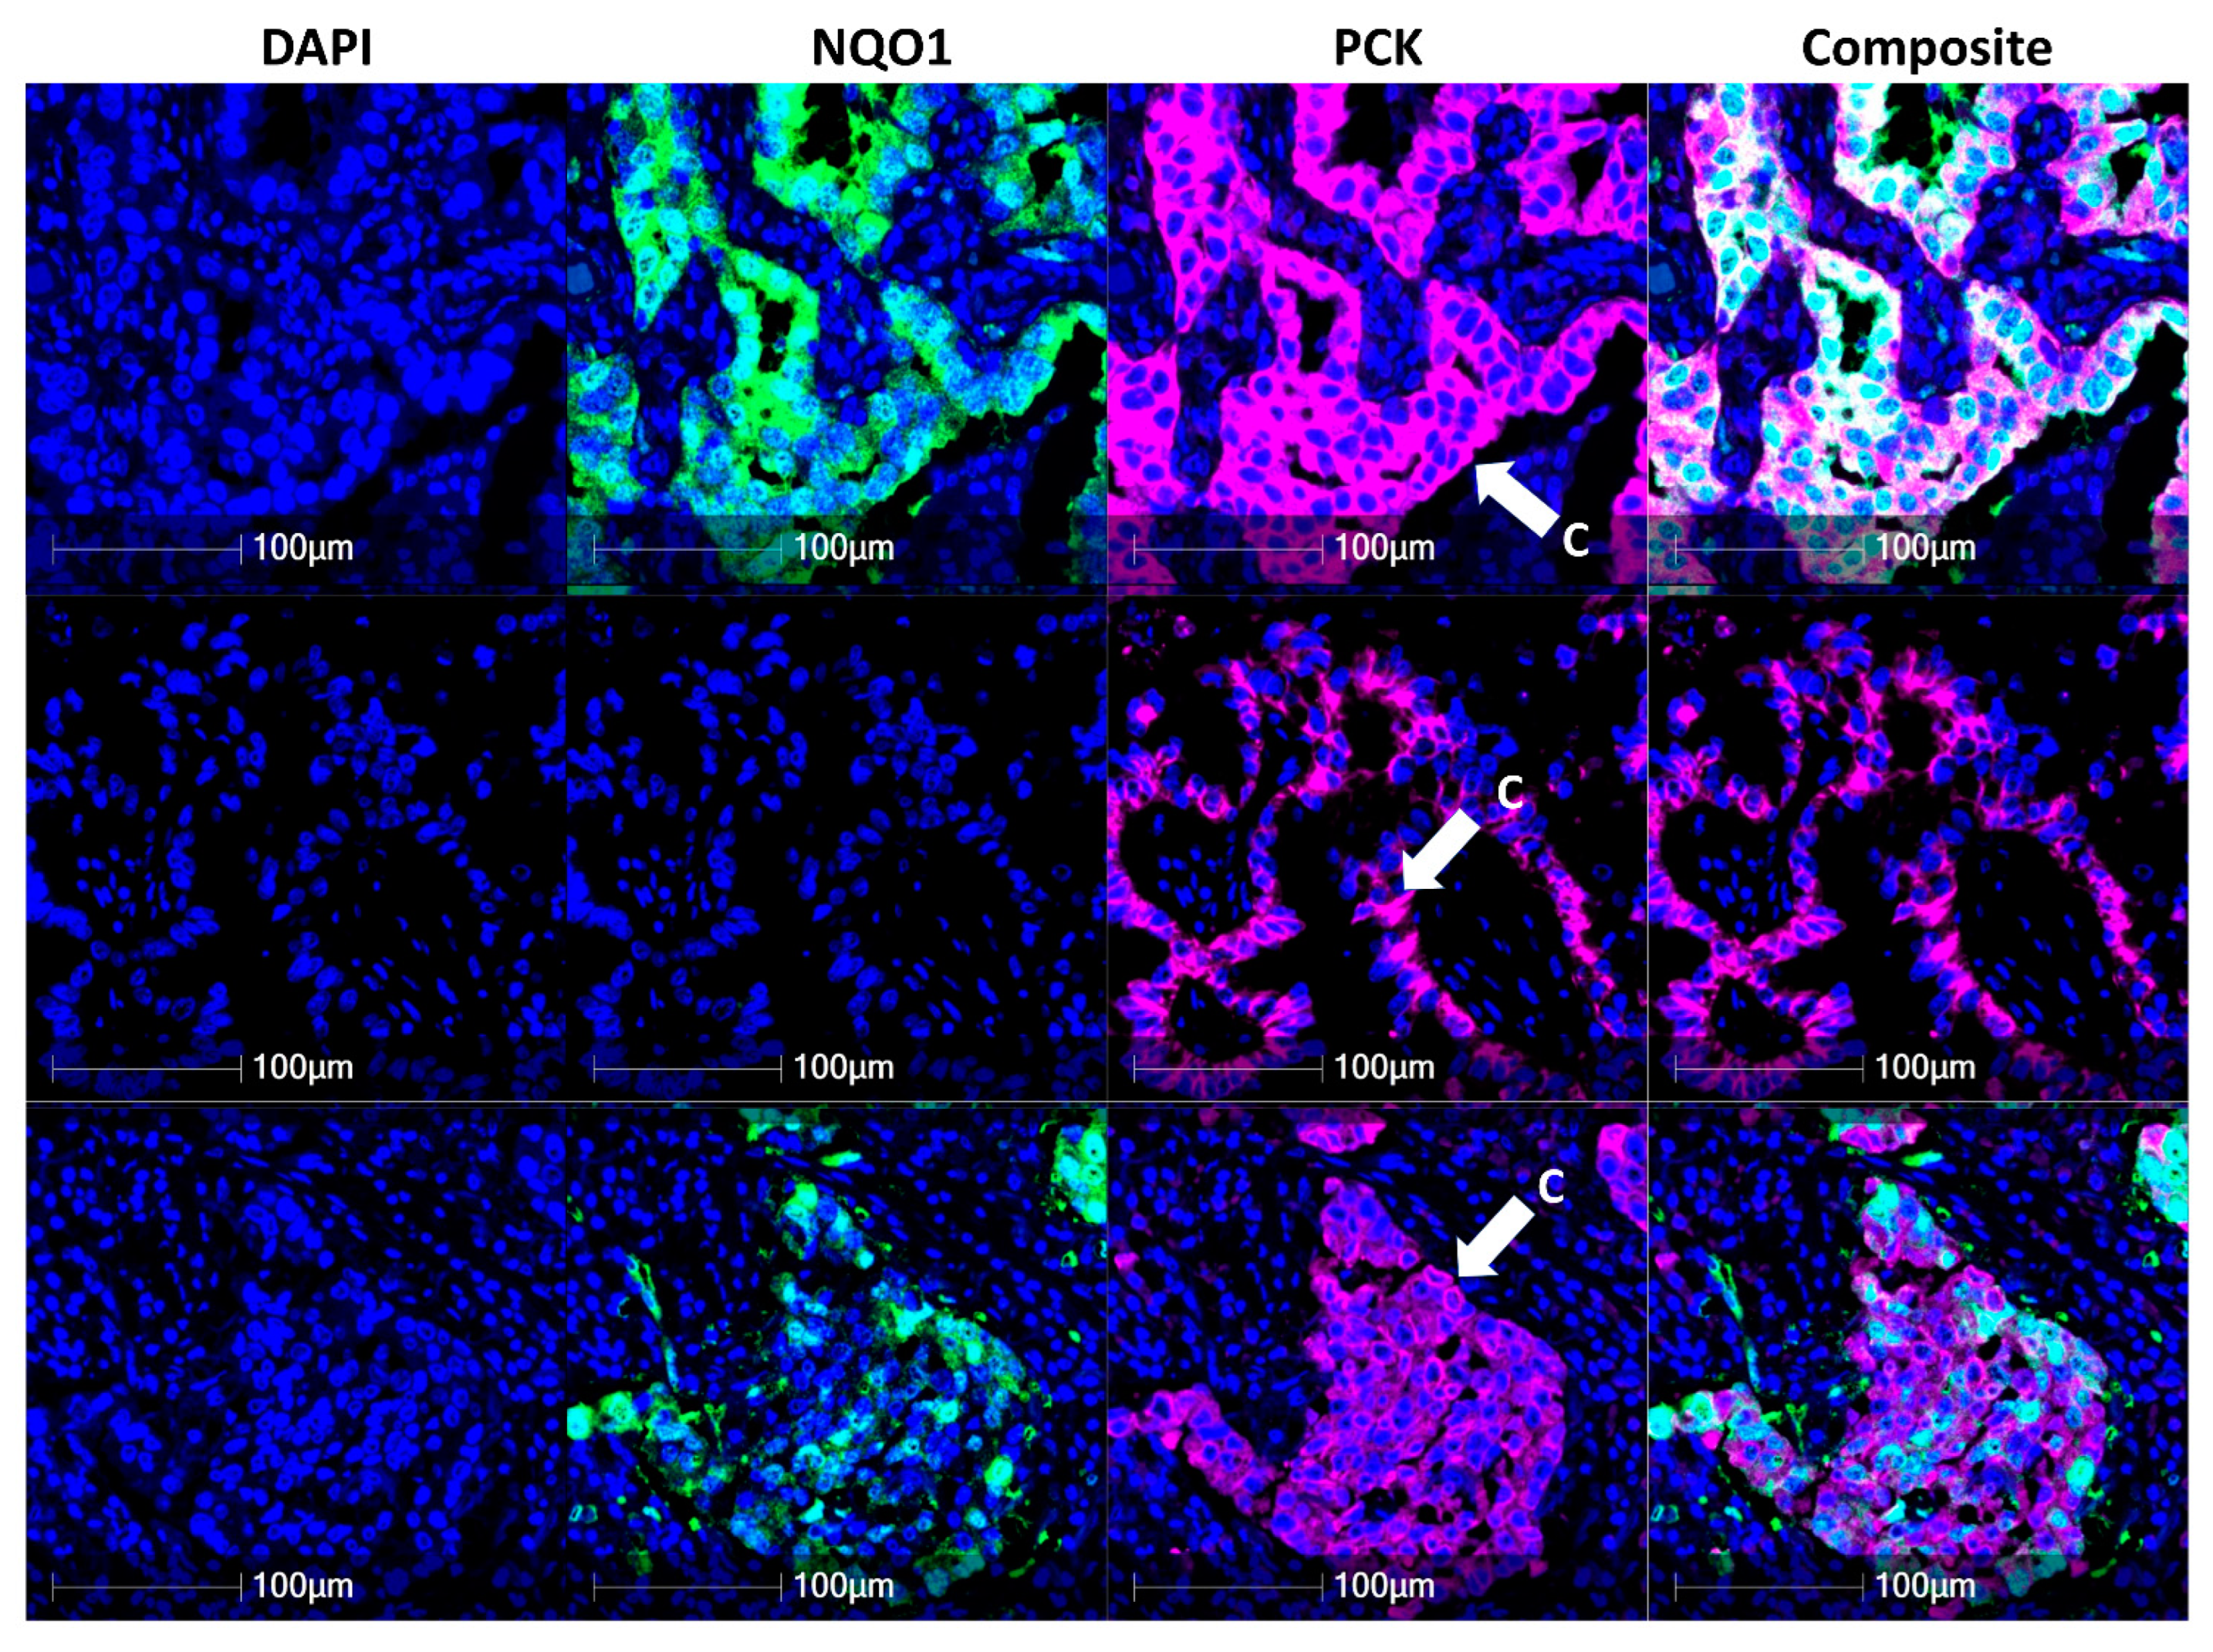
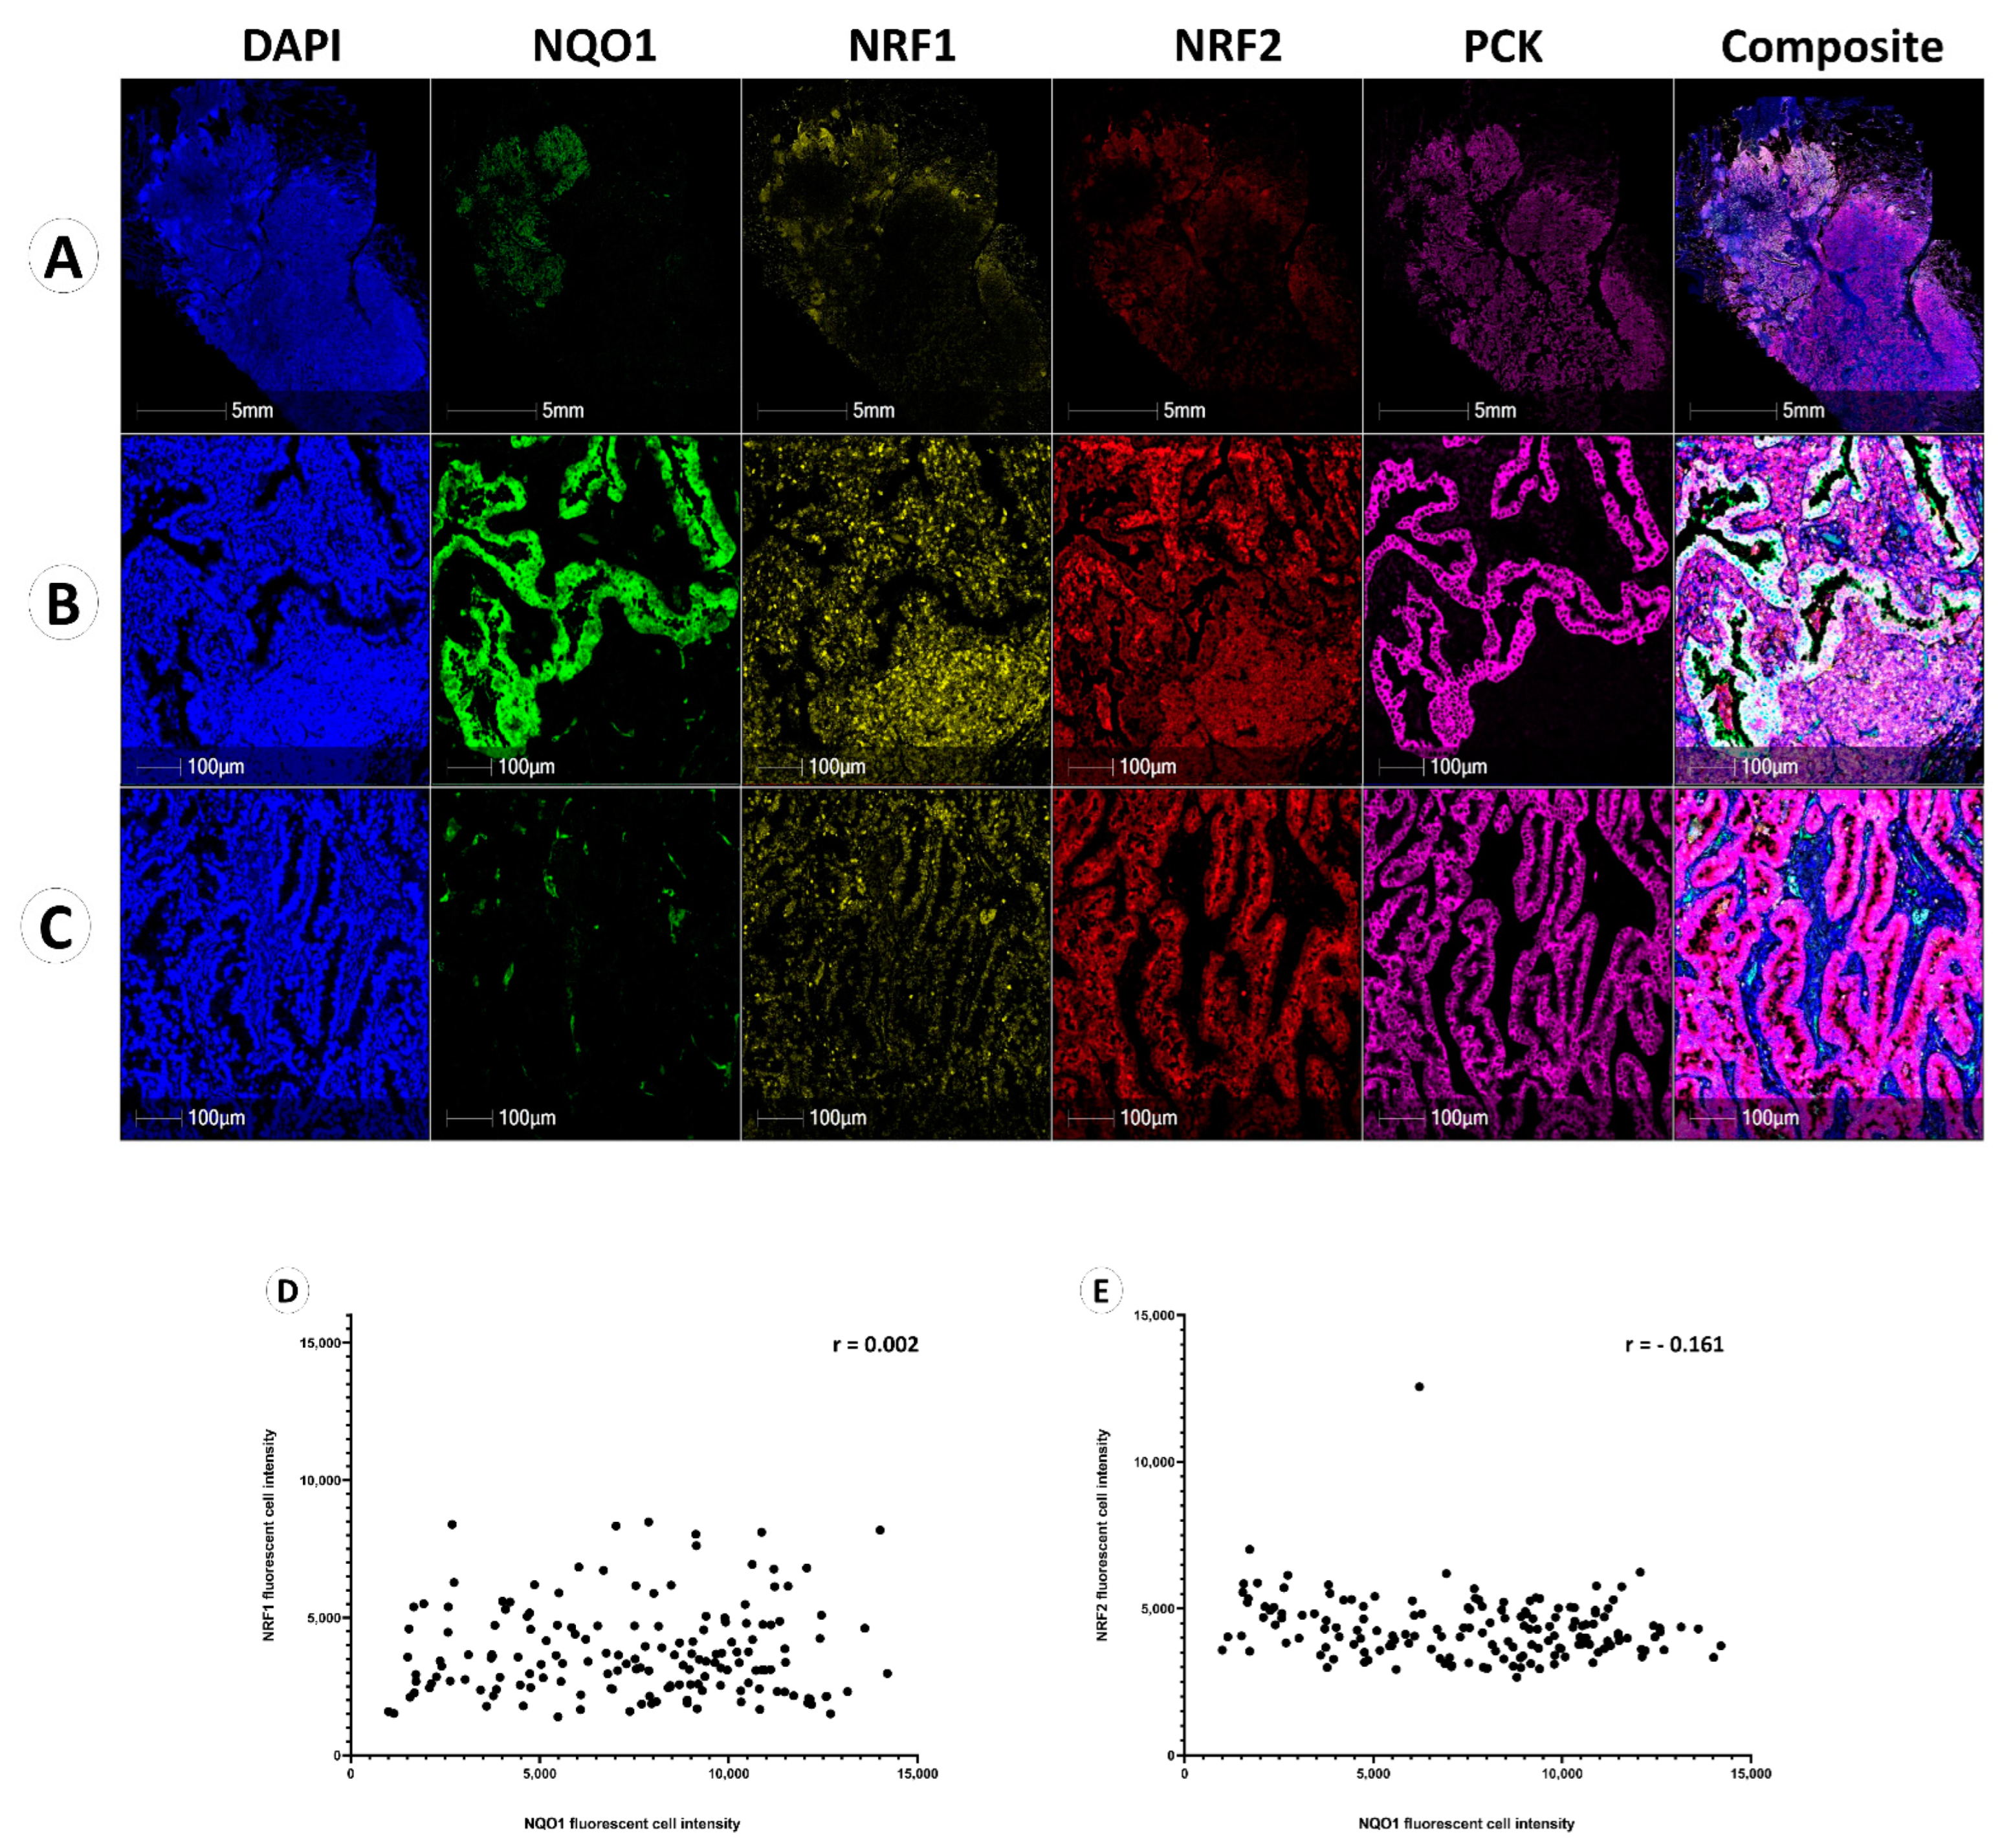
3.2. NQO1 Expression Is Heterogenous in Cancer
3.3. NQO1 Protein Expression Is Independent of NRF1 and NRF2
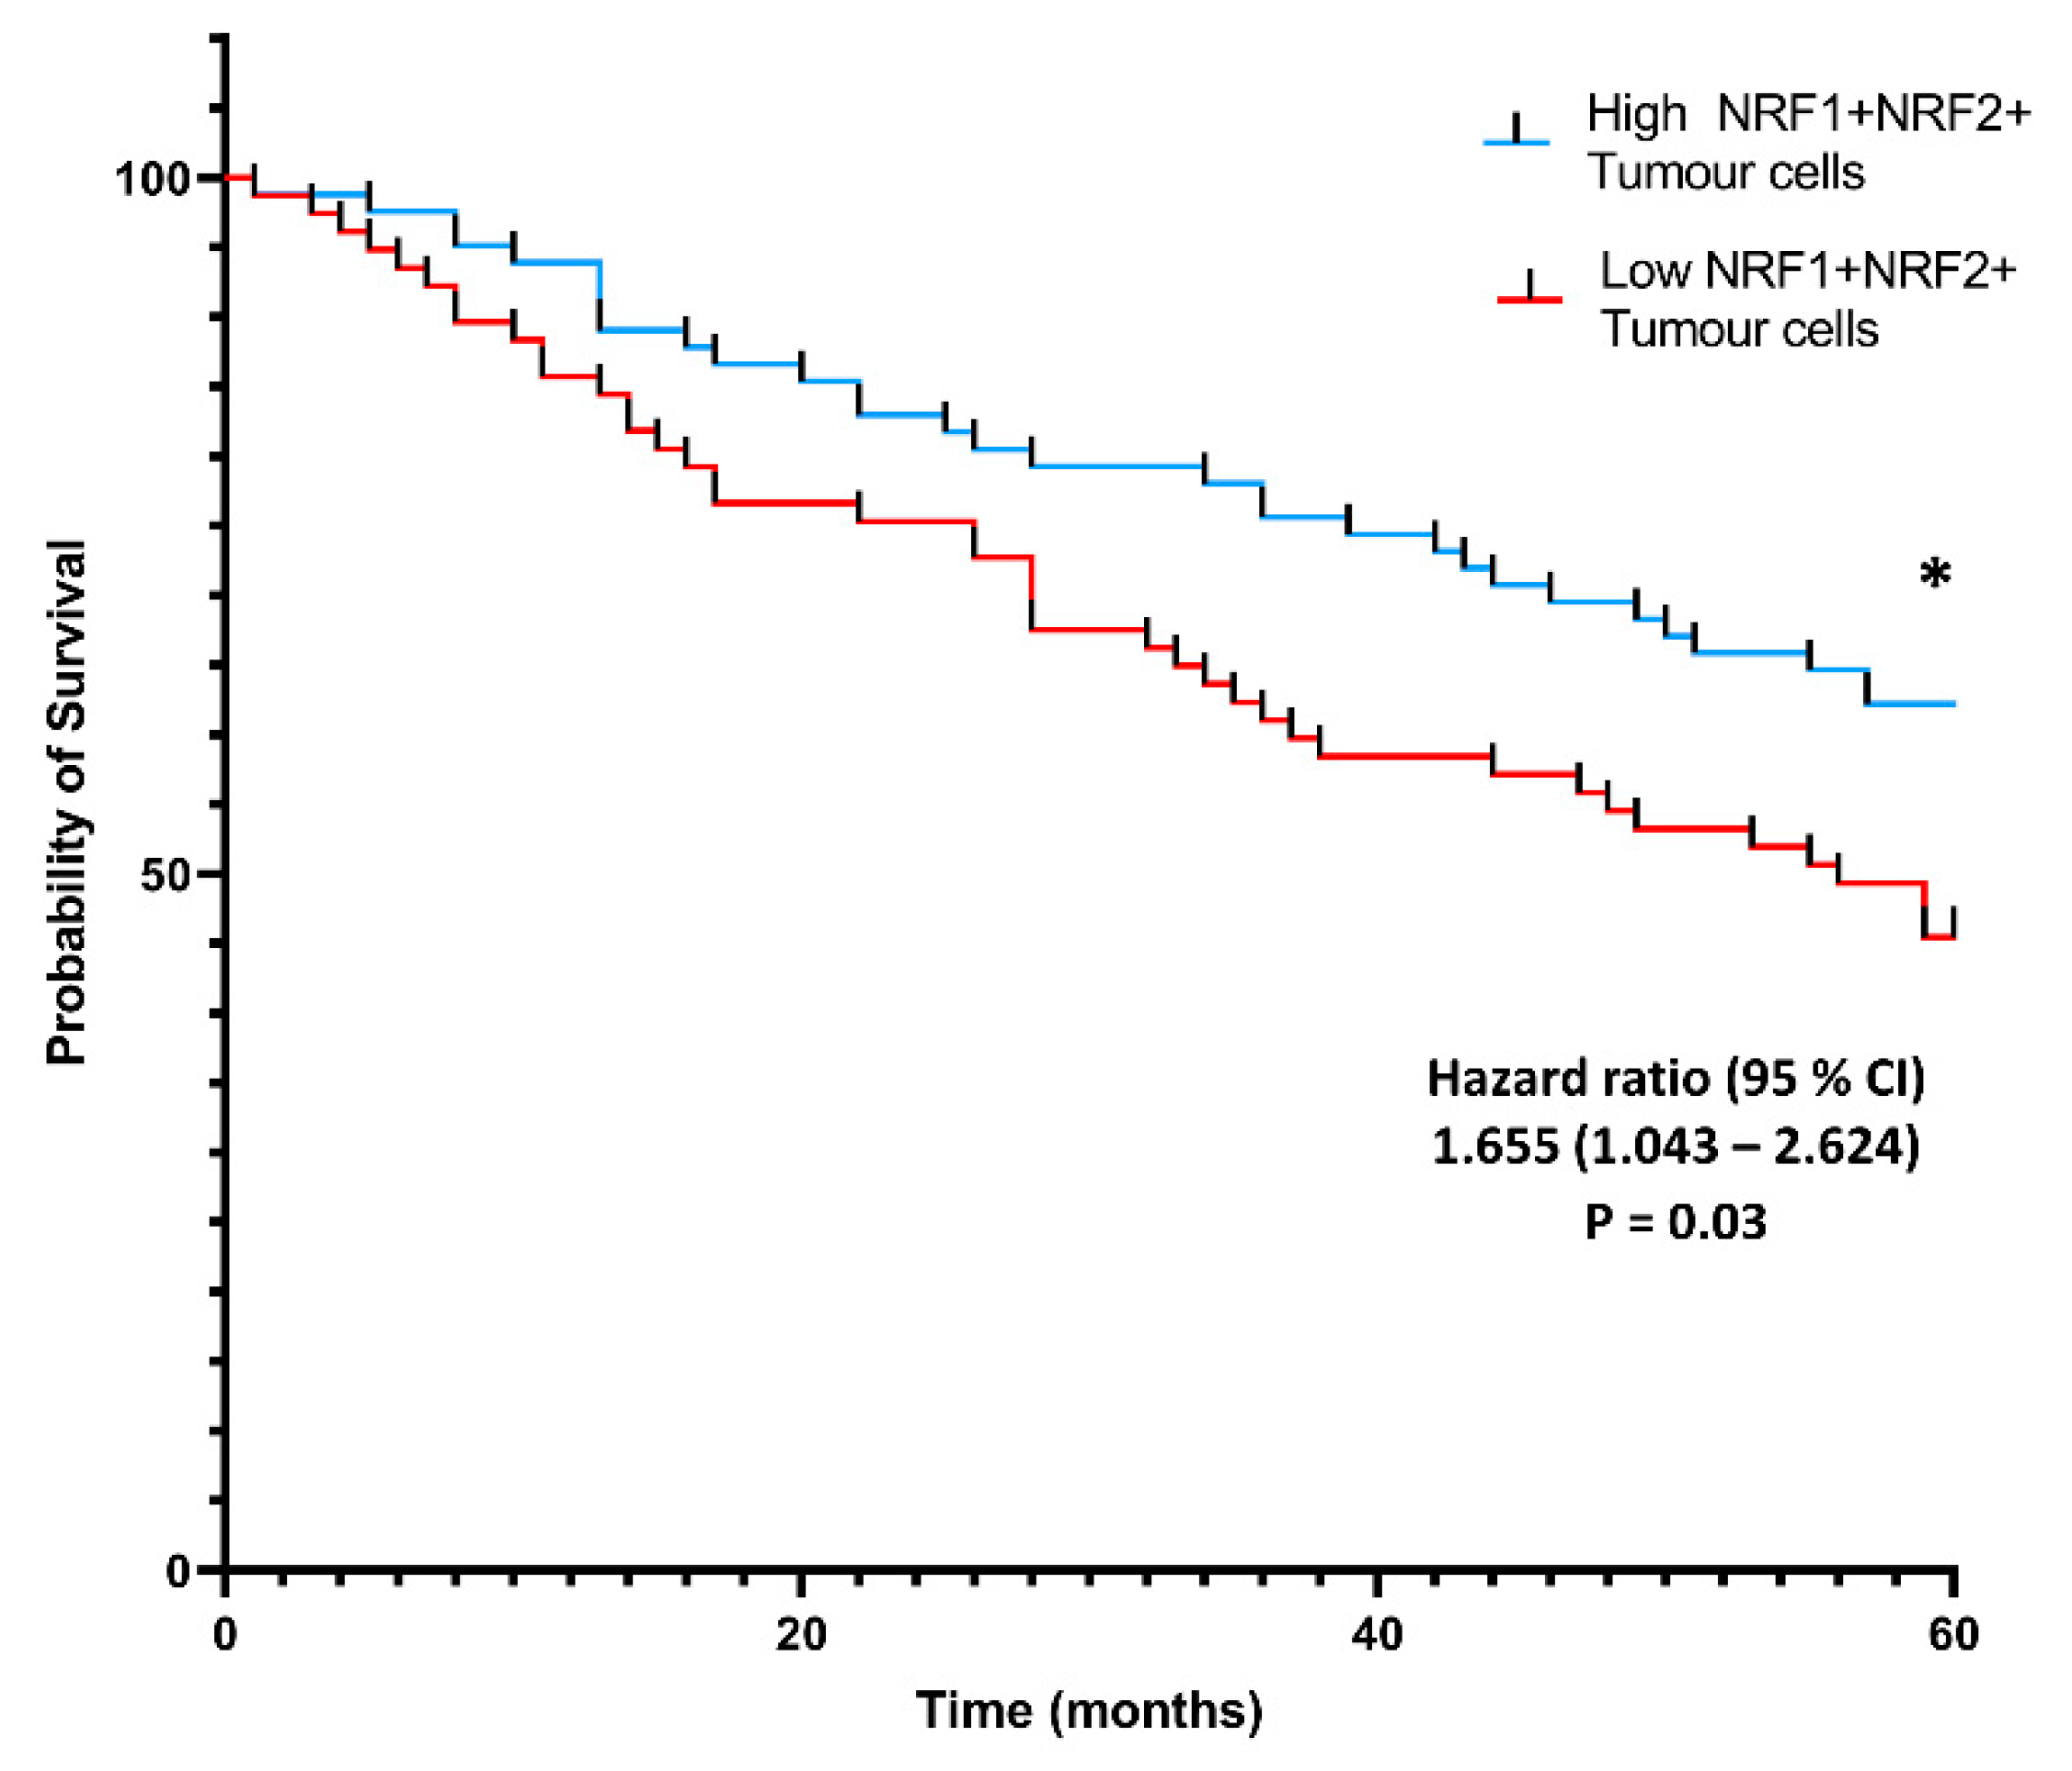
3.4. Co-Localization of NRF1 and NRF2 in Cancer Cells Is Associated with Higher Patient Probability of Survival
4. Discussion
Author Contributions
Funding
Institutional Review Board Statement
Informed Consent Statement
Data Availability Statement
Acknowledgments
Conflicts of Interest
References
- Bray, F.; Ferlay, J.; Soerjomataram, I.; Siegel, R.L.; Torre, L.A.; Jemal, A. Global cancer statistics 2018: GLOBOCAN estimates of incidence and mortality worldwide for 36 cancers in 185 countries. CA Cancer J. Clin. 2018, 68, 394–424. [Google Scholar] [CrossRef] [PubMed] [Green Version]
- Oser, M.G.; Niederst, M.J.; Sequist, L.V.; Engelman, J.A. Transformation from non-small-cell lung cancer to small-cell lung cancer: Molecular drivers and cells of origin. Lancet Oncol. 2015, 16, e165–e172. [Google Scholar] [CrossRef] [Green Version]
- American Cancer Society. Lung Cancer Survival Rates|5-Year Survival Rates for Lung Cancer; American Cancer Society: Atlanta, GA, USA, 2019; Available online: https://www.cancer.org/cancer/lung-cancer/detection-diagnosis-staging/survival-rates.html (accessed on 31 August 2022).
- Siegel, R.L.; Miller, K.D.; Jemal, A. Cancer statistics, 2015. CA Cancer J. Clin. 2015, 65, 5–29. [Google Scholar] [CrossRef] [PubMed]
- Cruz, C.S.D.; Tanoue, L.T.; Matthay, R.A. Lung Cancer: Epidemiology, Etiology, and Prevention. Clin. Chest Med. 2011, 32, 605–644. [Google Scholar] [CrossRef] [PubMed] [Green Version]
- Hanahan, D. Hallmarks of Cancer: New Dimensions. Cancer Discov. 2022, 12, 31–46. [Google Scholar] [CrossRef] [PubMed]
- Inamura, K. Lung cancer: Understanding its molecular pathology and the 2015 WHO classification. Front. Oncol. 2017, 7, 193. [Google Scholar] [CrossRef] [PubMed] [Green Version]
- Franco, P.I.R.; Rodrigues, A.P.; de Menezes, L.B.; Miguel, M.P. Tumor microenvironment components: Allies of cancer progression. Pathol. Res. Pract. 2020, 216, 1. [Google Scholar]
- Wu, F.; Fan, J.; He, Y.; Xiong, A.; Yu, J.; Li, Y.; Zhang, Y.; Zhao, W.; Zhou, F.; Li, W.; et al. Single-cell profiling of tumor heterogeneity and the microenvironment in advanced non-small cell lung cancer. Nat. Commun. 2021, 12, 2540. [Google Scholar] [CrossRef] [PubMed]
- Surace, M.; Rognoni, L.; Rodriguez-Canales, J.; Steele, K.E. Characterization of the immune microenvironment of NSCLC by multispectral analysis of multiplex immunofluorescence images. Methods Enzymol. 2020, 635, 33–50. [Google Scholar] [CrossRef]
- Valavanidis, A.; Vlachogianni, T.; Fiotakis, K.; Loridas, S. Pulmonary Oxidative Stress, Inflammation and Cancer: Respirable Particulate Matter, Fibrous Dusts and Ozone as Major Causes of Lung Carcinogenesis through Reactive Oxygen Species Mechanisms. Int. J. Environ. Res. Public Health 2013, 10, 3886–3907. [Google Scholar] [CrossRef] [PubMed]
- Satoh, H.; Moriguchi, T.; Taguchi, K.; Takai, J.; Maher, J.M.; Suzuki, T., Jr.; Raman, V.; Ebina, M.; Nukiwa, T. Nrf2-deficiency creates a responsive microenvironment for metastasis to the lung. Carcinogenesis 2010, 31, 1833–1843. [Google Scholar] [CrossRef] [PubMed]
- Raskov, H.; Orhan, A.; Christensen, J.P.; Gögenur, I. Cytotoxic CD8+ T cells in cancer and cancer immunotherapy. Br. J. Cancer 2020, 124, 359–367. [Google Scholar] [CrossRef]
- Nagaraj, S.; Youn, J.-I.; Gabrilovich, D.I. Reciprocal Relationship between Myeloid-Derived Suppressor Cells and T Cells. J. Immunol. 2013, 191, 17–23. [Google Scholar] [CrossRef] [PubMed] [Green Version]
- Kim, H.M.; Han, J.W.; Chan, J.Y. Nuclear Factor Erythroid-2 Like 1 (NFE2L1): Structure, function and regulation. Gene 2016, 584, 17–25. [Google Scholar] [CrossRef]
- Mitsuishi, Y.; Taguchi, K.; Kawatani, Y.; Shibata, T.; Nukiwa, T.; Aburatani, H.; Yamamoto, M.; Motohashi, H. Nrf2 Redirects Glucose and Glutamine into Anabolic Pathways in Metabolic Reprogramming. Cancer Cell 2012, 22, 66–79. [Google Scholar] [CrossRef] [Green Version]
- Bury, M.; Le Calve, B.; Lessard, F.; Del Maso, T.; Saliba, J.; Michiels, C.; Ferbeyre, G.; Blnak, V. FE2L3 Controls Colon Cancer Cell Growth through Regulation of DUX4, a CDK1 Inhibitor. Cell Rep. 2019, 29, 1469–1481.e9. [Google Scholar] [CrossRef] [PubMed]
- Tang, Z.; Li, C.; Kang, B.; Gao, G.; Li, C.; Zhang, Z. GEPIA: A web server for cancer and normal gene expression profiling and interactive analyses. Nucleic Acids Res. 2017, 45, W98–W102. [Google Scholar] [CrossRef] [PubMed] [Green Version]
- Zhang, Y.; Xiang, Y. Molecular and cellular basis for the unique functioning of Nrf1, an indispensable transcription factor for maintaining cell homoeostasis and organ integrity. Biochem. J. 2016, 473, 961–1000. [Google Scholar] [CrossRef] [PubMed]
- Nioi, P.; McMahon, M.; Itoh, K.; Yamamoto, M.; Hayes, J.D. Identification of a novel NRF2-regulated antioxidant response element (ARE) in the mouse NAD(P)H:quinone oxidoreductase 1 gene: Reassessment of the ARE consensus se-quence. Biochem. J. 2003, 374, 337–348. [Google Scholar] [CrossRef]
- Ross, D.; Siegel, D. Functions of NQO1 in Cellular Protection and CoQ10 Metabolism and its Potential Role as a Redox Sensitive Molecular Switch. Front. Physiol. 2017, 8, 595. [Google Scholar] [CrossRef] [PubMed] [Green Version]
- Li, Z.; Zhang, Y.; Jin, T.; Men, J.; Lin, Z.; Qi, P.; Piao, Y.; Yan, G. NQO1 protein expression predicts poor prognosis of non-small cell lung cancers. BMC Cancer 2015, 15, 1–9. [Google Scholar] [CrossRef] [PubMed]
- Siegel, D.; Franklin, W.A.; Ross, D. Immunohistochemical detection of NAD(P)H:quinone oxidoreductase in human lung and lung tumors. Clin. Cancer Res. 1998, 4, 2065–2070. [Google Scholar] [PubMed]
- De La Vega, M.R.; Chapman, E.; Zhang, D.D. NRF2 and the Hallmarks of Cancer. Cancer Cell 2018, 34, 21–43. [Google Scholar] [CrossRef]
- Sánchez-Ortega, M.; Carrera, A.; Garrido, A. Role of NRF2 in Lung Cancer. Cells 2021, 10, 1879. [Google Scholar] [CrossRef]
- Scalera, S.; Mazzotta, M.; Cortile, C.; Krasniqi, E.; De Maria, R.; Cappuzzo, F.; Ciliberto, G.; Maugeri-Saccà, M. KEAP1-Mutant NSCLC: The Catastrophic Failure of a Cell-Protecting Hub. J. Thorac. Oncol. 2022, 17, 751–757. [Google Scholar] [CrossRef] [PubMed]
- Hiramoto, K.; Satoh, H.; Suzuki, T.; Moriguchi, T.; Pi, J.; Shimosegawa, T.; Yamamoto, M. Myeloid Lineage–Specific Deletion of Antioxidant System Enhances Tumor Metastasis. Cancer Prev. Res. 2014, 7, 835–844. [Google Scholar] [CrossRef] [PubMed] [Green Version]
- Maj, T.; Wang, W.; Crespo, J.; Zhang, H.; Wang, W.; Wei, S.; Zhao, L.; Vatan, L.; Shao, I.; Szeliga, W.; et al. Oxidative stress controls regulatory T cell apoptosis and suppressor activity and PD-L1-blockade resistance in tumor. Nat. Immunol. 2017, 18, 1332–1341. [Google Scholar] [CrossRef] [Green Version]
- Tong, Y.-H.; Zhang, B.; Yan, Y.-Y.; Fan, Y.; Yu, J.-W.; Kong, S.-S.; Zhang, D.; Fang, L.; Su, D.; Lin, N.-M. Dual-negative expression of Nrf2 and NQO1 predicts superior outcomes in patients with non-small cell lung cancer. Oncotarget 2017, 8, 45750–45758. [Google Scholar] [CrossRef] [Green Version]
- Tsvetkov, P.; Adler, J.; Myers, N.; Biran, A.; Reuven, N.; Shaul, Y. Oncogenic addiction to high 26S proteasome level. Cell Death Dis. 2018, 9, 1–14. [Google Scholar] [CrossRef] [Green Version]
- Koizumi, S.; Hamazaki, J.; Murata, S. Transcriptional regulation of the 26S proteasome by Nrf1. Proc. Jpn. Acad. Ser. B 2018, 94, 325–336. [Google Scholar] [CrossRef] [Green Version]
- Nikitina, A.S.; Sharova, E.; Danilenko, S.A.; Butusova, T.B.; Vasiliev, A.O.; Govorov, A.V.; Prilepskaya, E.A.; Pushkar, D.Y.; Kostryukova, E.S. Novel RNA biomarkers of prostate cancer revealed by RNA-seq analysis of formalin-fixed samples obtained from Russian patients. Oncotarget 2017, 8, 32990–33001. [Google Scholar] [CrossRef] [PubMed]
- Bueno, R.; Hughes, E.; Wagner, S.; Gutin, A.S.; Lanchbury, J.S.; Zheng, Y.; Archer, M.A.; Gustafson, C.; Jones, J.T.; Rushton, K.; et al. Validation of a Molecular and Pathological Model for Five-Year Mortality Risk in Patients with Early Stage Lung Adenocarcinoma. J. Thorac. Oncol. 2015, 10, 67–73. [Google Scholar] [CrossRef] [PubMed] [Green Version]
- Nearchou, I.P.; Gwyther, B.M.; Georgiakakis, E.C.T.; Gavriel, C.G.; Lillard, K.; Kajiwara, Y.; Ueno, H.; Harrison, D.; Caie, P. Spatial immune profiling of the colorectal tumor microenvironment predicts good outcome in stage II patients. NPJ Digit. Med. 2020, 3, 1–10. [Google Scholar] [CrossRef]
- Camp, R.L.; Dolled-Filhart, M.; Rimm, D.L. X-tile: A new bio-informatics tool for biomarker assessment and outcome-based cut-point optimization. Clin. Cancer Res. 2004, 10, 7252–7259. [Google Scholar] [CrossRef] [PubMed] [Green Version]
- Bordeaux, J.; Welsh, A.W.; Agarwal, S.; Kiliam, E.; Baquero, M.T.; Hanna, J.A.; Anagnostou, V.K.; Rimm, D.L. Antibody validation. Biotechniques 2010, 48, 197. [Google Scholar] [CrossRef] [PubMed] [Green Version]
- Yang, Y.; Zhang, Y.; Wu, Q.; Cui, X.; Lin, Z.; Liu, S.; Chen, L. Clinical implications of high NQO1 expression in breast cancers. J. Exp. Clin. Cancer Res. 2014, 33, 14. [Google Scholar] [CrossRef] [PubMed] [Green Version]
- Liu, P.; Dodson, M.; Fang, D.; Chapman, E.; Zhang, D.D. NRF2 negatively regulates primary ciliogenesis and hedgehog signaling. PLoS Biol. 2020, 18, e3000620. [Google Scholar] [CrossRef] [PubMed] [Green Version]
- Gennert, D.G.; Lynn, R.C.; Granja, J.M.; Weber, E.W.; Mumbach, M.R.; Zhao, Y.; Duren, Z.; Sotillo, E.; Greenleaf, W.J.; Wong, W.H.; et al. Dynamic chromatin regulatory landscape of human CAR T cell exhaustion. Proc. Natl. Acad. Sci. USA 2021, 118. [Google Scholar] [CrossRef]
- Lugade, A.A.; Vethanayagam, R.R.; Nasirikenari, M.; Bogner, P.N.; Segal, B.H.; Thanavala, Y. Nrf2 Regulates Chronic Lung Inflammation and B-Cell Responses to Nontypeable Haemophilus influenzae. Am. J. Respir. Cell Mol. Biol. 2011, 45, 557–565. [Google Scholar] [CrossRef] [Green Version]
- Chiu, W.C.; Lee, Y.L.; Chou, S.H.; Lee, Y.C.; Su, Y.H.; Hou, Y.A.; Chiang, H.H.; Yin, H.L.; Hu, S.C.S.; Huang, M.Y.; et al. Expression of redox sensing factor Nrf2 in lung macrophages and type II pneumocytes as a prognostic factor in pneumothorax recurrence. J. Thorac. Dis. 2017, 9, 2498–2509. [Google Scholar] [CrossRef] [Green Version]
- Saddawi-Konefka, R.; Seelige, R.; Gross, E.T.; Levy, E.; Searles, S.C.; Washington, A.; Santosa, E.K.; Liu, B.; O’Sullivan, T.E.; Harismendy, O.; et al. Nrf2 Induces IL-17D to Mediate Tumor and Virus Surveillance. Cell Rep. 2016, 16, 2348–2358. [Google Scholar] [CrossRef] [PubMed]
- Malik, M.A.; Zargar, S.A.; Mittal, B. Role of NQO1 609C>T and NQO2 −3423G>A gene polymorphisms in esophageal cancer risk in Kashmir valley and meta analysis. Mol. Biol. Rep. 2012, 39, 9095–9104. [Google Scholar] [CrossRef] [PubMed]
- Dickinson, B.C.; Chang, C.J. Chemistry and biology of reactive oxygen species in signaling or stress responses. Nat. Chem. Biol. 2011, 7, 504–511. [Google Scholar] [CrossRef] [PubMed] [Green Version]
- Qiu, L.; Yang, Q.; Zhao, W.; Xing, Y.; Li, P.; Zhou, X.; Ning, H.; Shi, R.; Gou, S.; Chen, Y.; et al. Dysfunction of the energy sensor NFE2L1 triggers uncontrollable AMPK signaling and glucose metabolism reprogramming. Cell Death Dis. 2022, 13, 1–11. [Google Scholar] [CrossRef]
- Nguyen, T.; Nioi, P.; Pickett, C.B. The Nrf2-Antioxidant Response Element Signaling Pathway and Its Activation by Oxidative Stress. J. Biol. Chem. 2009, 284, 13291–13295. [Google Scholar] [CrossRef] [PubMed] [Green Version]
- Siegel, D.; Anwar, A.; Winski, S.L.; Kepa, J.K.; Zolman, K.L.; Ross, D. Rapid Polyubiquitination and Proteasomal Degradation of a Mutant Form of NAD(P)H:quinone Oxidoreductase 1. Mol. Pharmacol. 2001, 59, 263–268. [Google Scholar] [CrossRef] [PubMed] [Green Version]
- Kobayashi, E.H.; Suzuki, T.; Funayama, R.; Nagashima, T.; Hayashi, M.; Sekine, H.; Tanaka, N.; Moriguchi, T.; Motohashi, H.; Nakayama, K.; et al. Nrf2 suppresses macrophage inflammatory response by blocking proinflammatory cytokine transcription. Nat. Commun. 2016, 7, 11624. [Google Scholar] [CrossRef]


Publisher’s Note: MDPI stays neutral with regard to jurisdictional claims in published maps and institutional affiliations. |
© 2022 by the authors. Licensee MDPI, Basel, Switzerland. This article is an open access article distributed under the terms and conditions of the Creative Commons Attribution (CC BY) license (https://creativecommons.org/licenses/by/4.0/).
Share and Cite
Kaghazchi, B.; Um, I.H.; Elshani, M.; Read, O.J.; Harrison, D.J. Spatial Analysis of NQO1 in Non-Small Cell Lung Cancer Shows Its Expression Is Independent of NRF1 and NRF2 in the Tumor Microenvironment. Biomolecules 2022, 12, 1652. https://doi.org/10.3390/biom12111652
Kaghazchi B, Um IH, Elshani M, Read OJ, Harrison DJ. Spatial Analysis of NQO1 in Non-Small Cell Lung Cancer Shows Its Expression Is Independent of NRF1 and NRF2 in the Tumor Microenvironment. Biomolecules. 2022; 12(11):1652. https://doi.org/10.3390/biom12111652
Chicago/Turabian StyleKaghazchi, Boback, In Hwa Um, Mustafa Elshani, Oliver J. Read, and David J. Harrison. 2022. "Spatial Analysis of NQO1 in Non-Small Cell Lung Cancer Shows Its Expression Is Independent of NRF1 and NRF2 in the Tumor Microenvironment" Biomolecules 12, no. 11: 1652. https://doi.org/10.3390/biom12111652