
Machine Learning Approach to Understand Worsening Renal Function in Acute Heart Failure
 , , , , , ,
Abstract
:1. Introduction
2. Materials and Methods
2.1. Study Population
2.2. Worsening of the Renal Function Evaluation
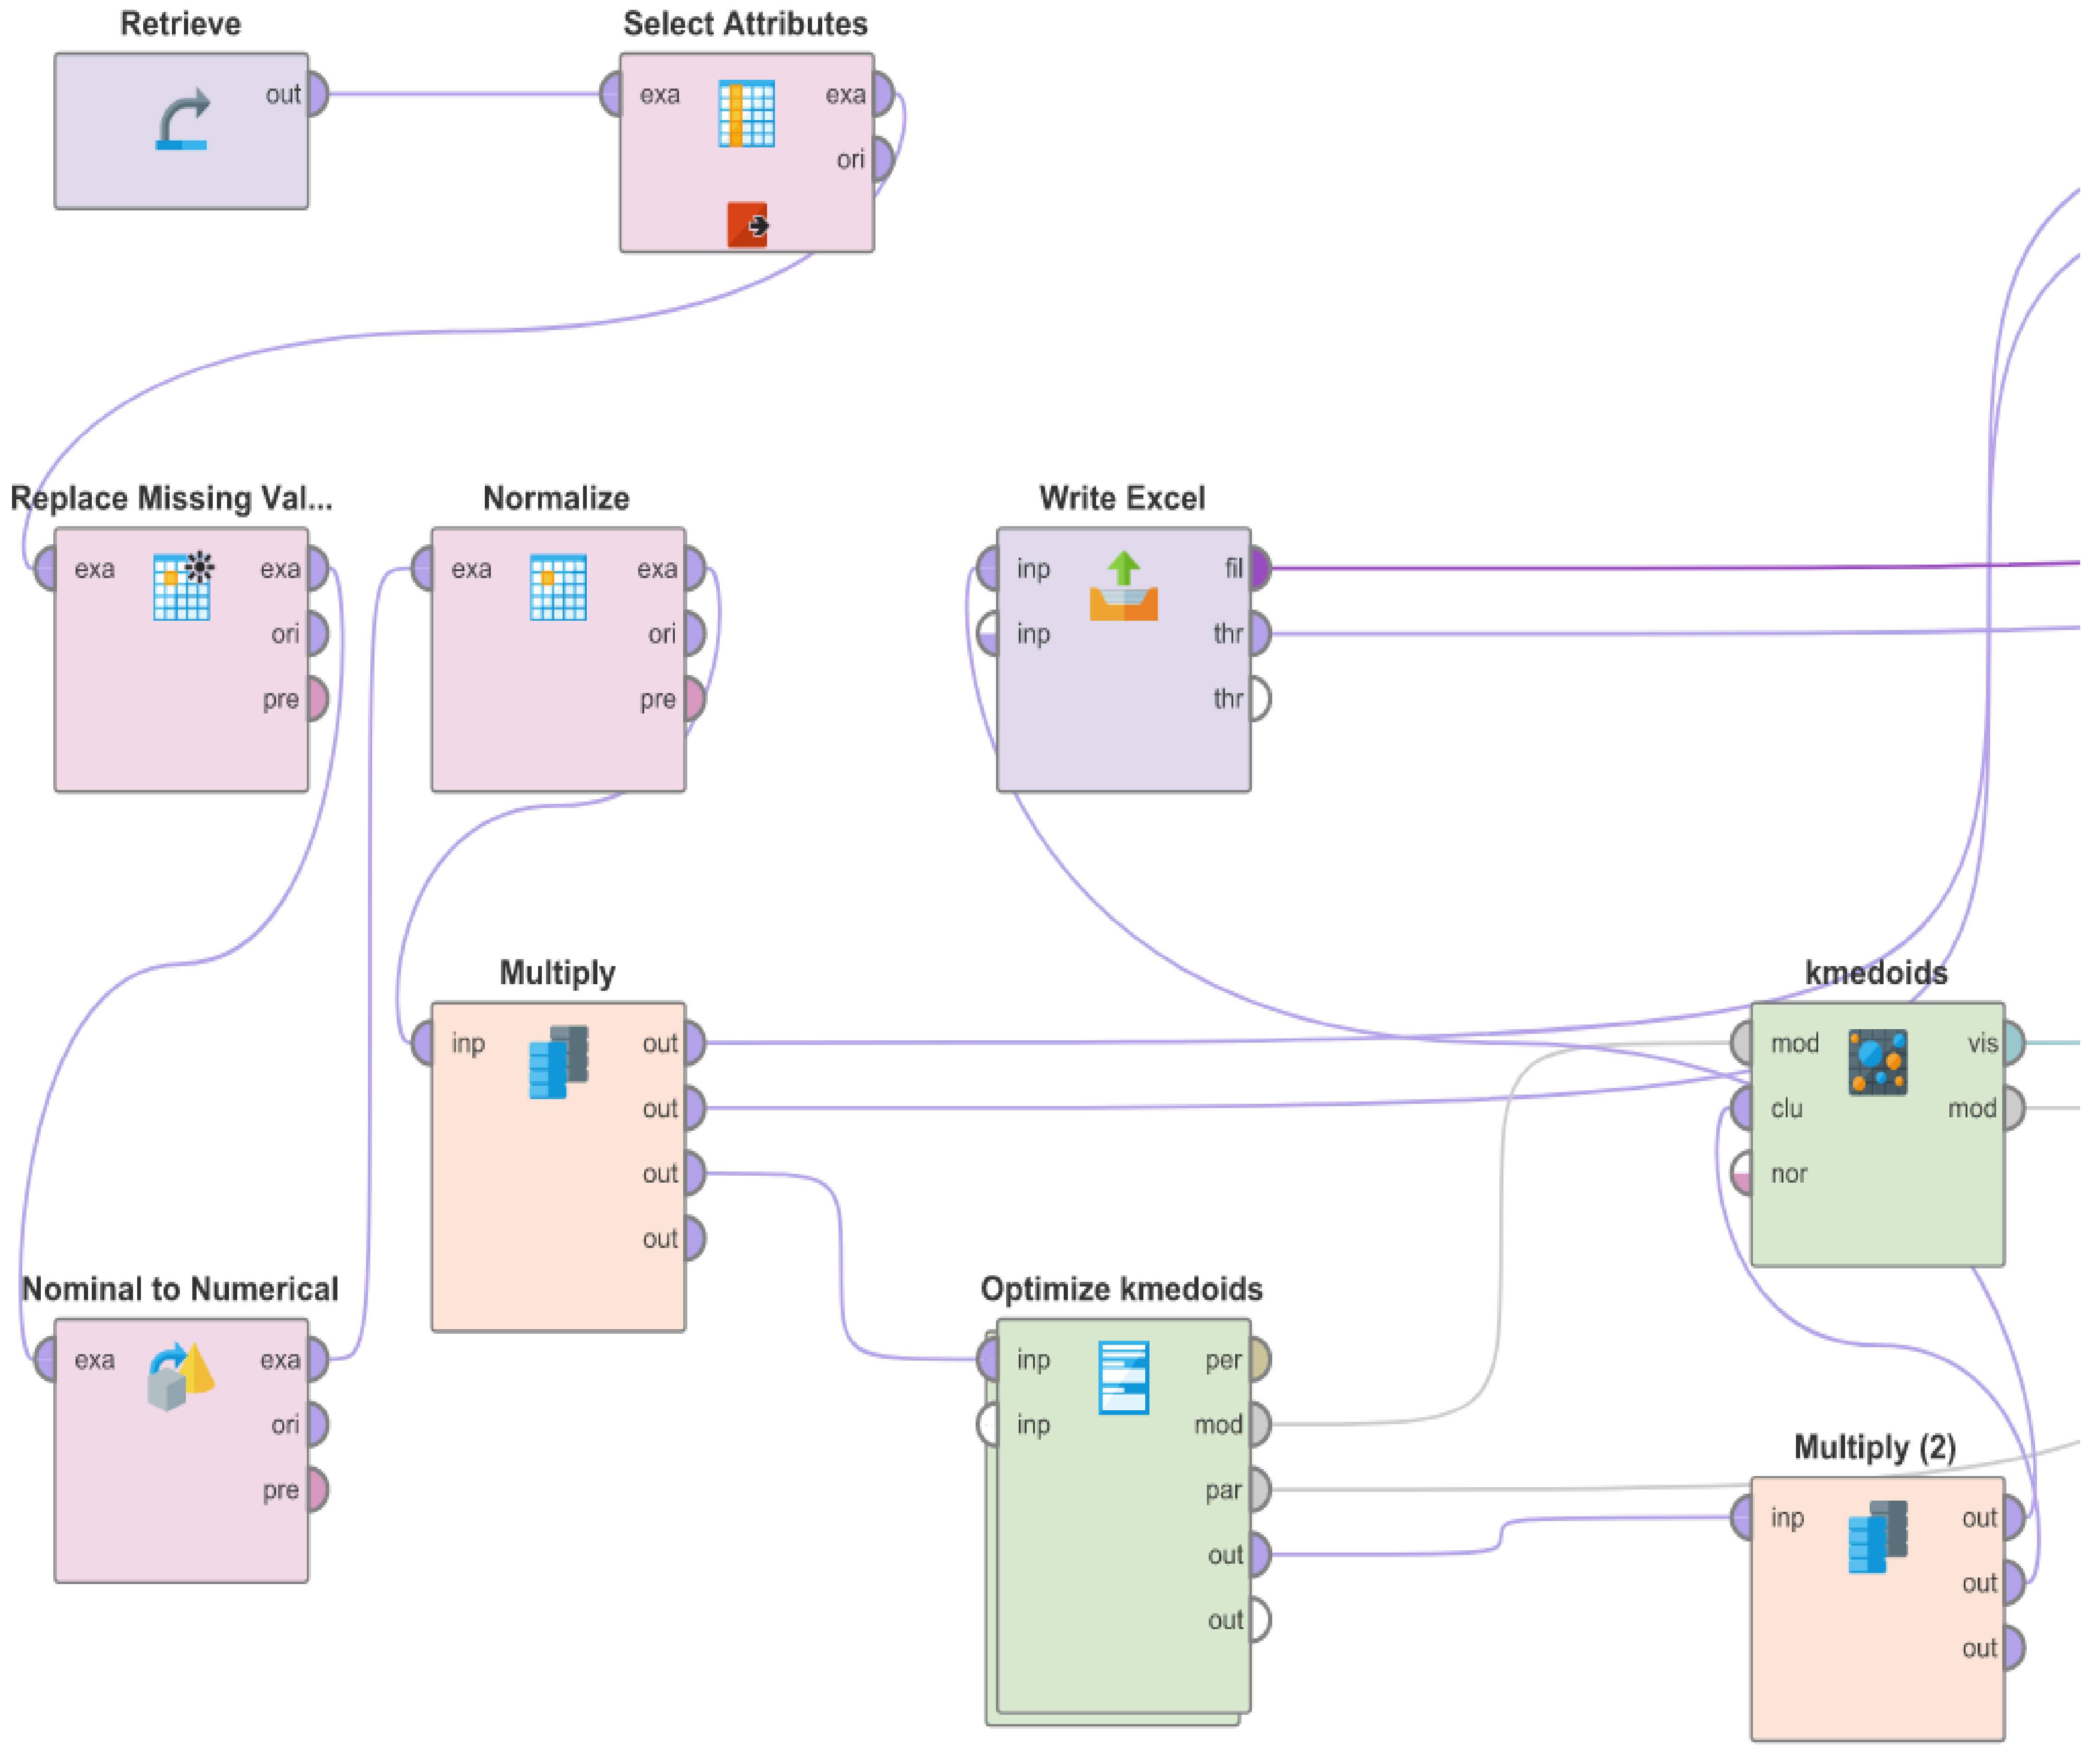
2.3. Clustering and Data Analysis
3. Results
3.1. Population Characteristics
3.2. Clustering
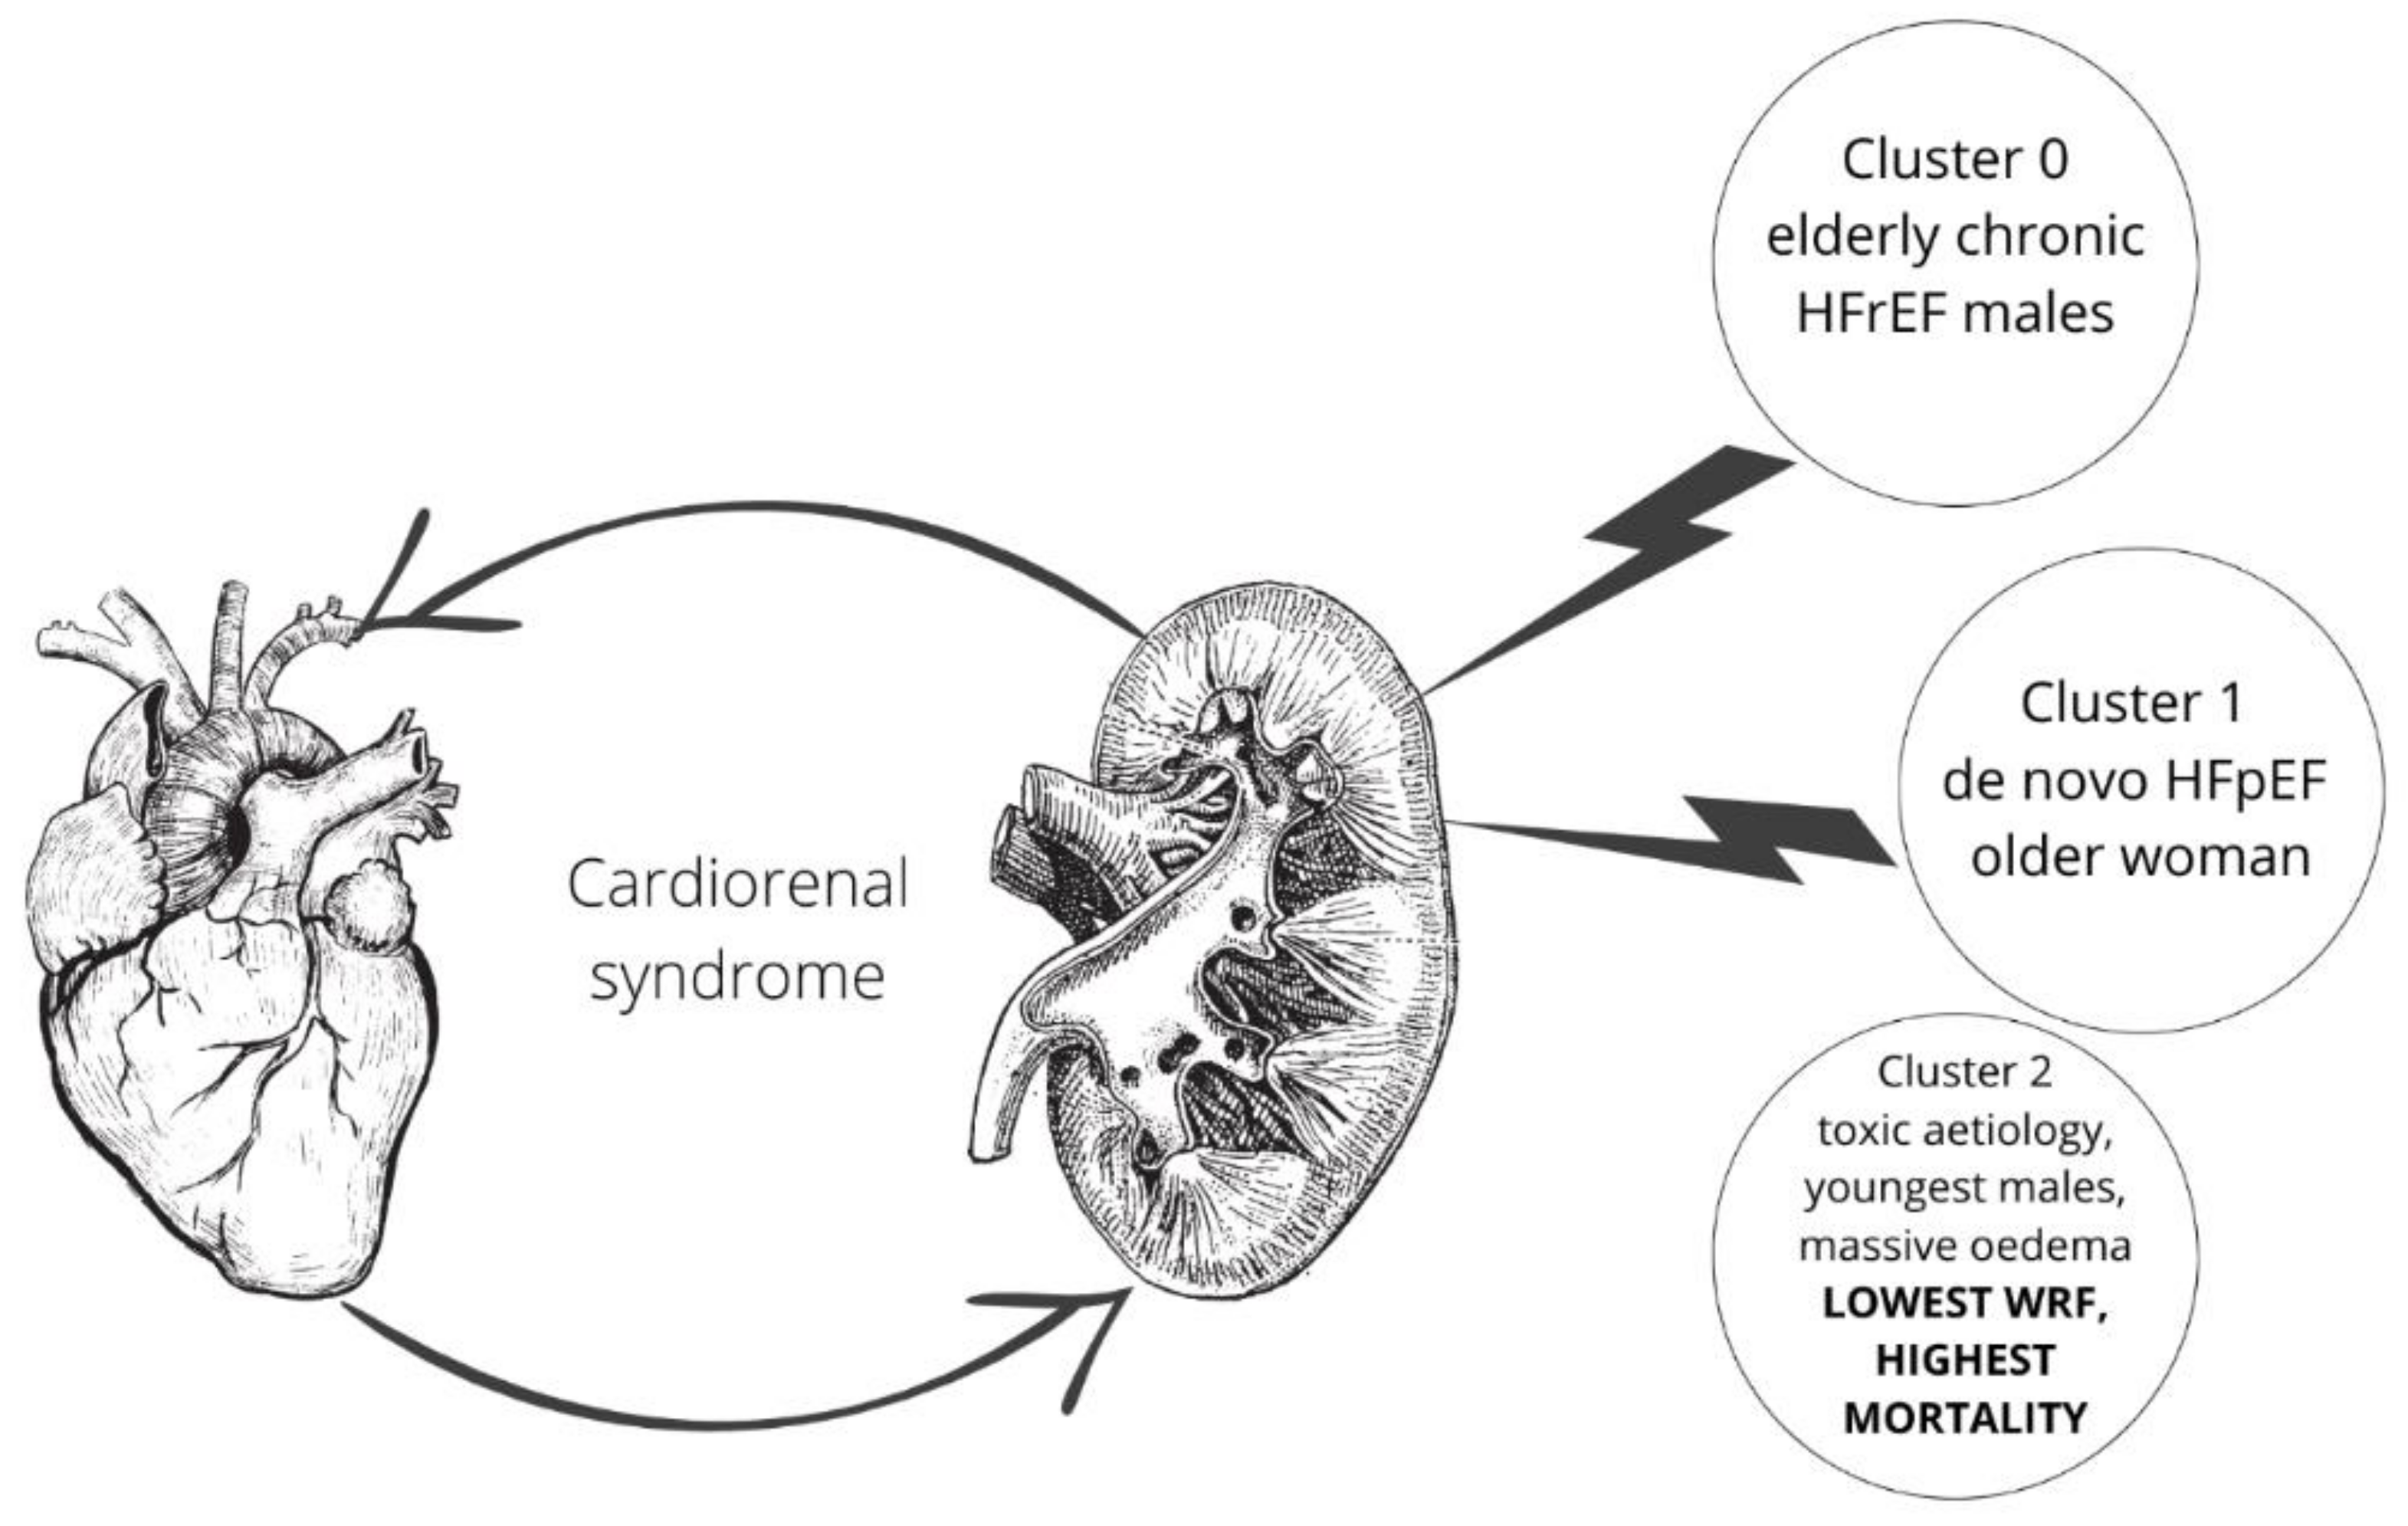
3.2.1. Cluster 0
3.2.2. Cluster 1
3.2.3. Cluster 2
3.3. Outcome
4. Discussion
4.1. Cluster 0
4.2. Cluster 1
4.3. Cluster 2
4.4. Limitations
5. Conclusions
Supplementary Materials
Author Contributions
Funding
Institutional Review Board Statement
Informed Consent Statement
Data Availability Statement
Conflicts of Interest
References
- Savarese, G.; Becher, P.M.; Lund, L.H.; Seferovic, P.; Rosano, G.M.C.; Coats, A.J.S. Global burden of heart failure: A comprehensive and updated review of epidemiology. Cardiovasc. Res. 2022, 1–16. [Google Scholar] [CrossRef] [PubMed]
- McDonagh, T.A.; Metra, M.; Adamo, M.; Gardner, R.S.; Baumbach, A.; Böhm, M.; Burri, H.; Butler, J.; Čelutkienė, J.; Chioncel, O.; et al. 2021 ESC Guidelines for the diagnosis and treatment of acute and chronic heart failure. Eur. Heart J. 2021, 42, 3599–3726. [Google Scholar] [CrossRef] [PubMed]
- Ronco, C.; Haapio, M.; House, A.A.; Anavekar, N.; Bellomo, R. Cardiorenal syndrome. J. Am. Coll. Cardiol. 2008, 52, 1527–1539. [Google Scholar] [CrossRef] [PubMed] [Green Version]
- Gottlieb, S.S.; Abraham, W.; Butler, J.; Forman, D.E.; Loh, E.; Massie, B.M.; O’Connor, C.M.; Rich, M.W.; Stevenson, L.W.; Young, J.; et al. The prognostic importance of different definitions of worsening renal function in congestive heart failure. J. Card. Fail. 2002, 8, 136–141. [Google Scholar] [CrossRef]
- Bellomo, R.; Ronco, C.; Mehta, R.L.; Asfar, P.; Boisramé-Helms, J.; Darmon, M.; Diehl, J.-L.; Duranteau, J.; Hoste, E.A.J.; Olivier, J.-B.; et al. Acute kidney injury in the ICU: From injury to recovery: Reports from the 5th Paris International Conference. Ann. Intensiv. Care 2017, 7, 49. [Google Scholar] [CrossRef]
- Maeder, M.T.; Rickli, H.; Pfisterer, M.E.; Muzzarelli, S.; Ammann, P.; Fehr, T.; Hack, D.; Weilenmann, D.; Dieterle, T.; Kiencke, S.; et al. Incidence, clinical predictors, and prognostic impact of worsening renal function in elderly patients with chronic heart failure on intensive medical therapy. Am. Heart J. 2012, 163, 407–414.e1. [Google Scholar] [CrossRef]
- Damman, K.; Navis, G.; Voors, A.A.; Asselbergs, F.; Smilde, T.D.; Cleland, J.G.; van Veldhuisen, D.J.; Hillege, H.L. Worsening Renal Function and Prognosis in Heart Failure: Systematic Review and Meta-Analysis. J. Card. Fail. 2007, 13, 599–608. [Google Scholar] [CrossRef] [PubMed]
- Ghazi, L.; Ahmad, T.; Wilson, F.P. A Clinical Framework for Evaluating Machine Learning Studies. Heart Fail. 2022, 10, 648–650. [Google Scholar] [CrossRef]
- Pondel, M.; Korczak, J. Recommendations based on collective intelligence–case of customer segmentation. In Information Technology for Management: Emerging Research and Applications; Springer: Cham, Switzerland, 2018. [Google Scholar]
- Zymliński, R.; Sokolski, M.; Siwolowski, P.; Biegus, J.; Nawrocka, S.; Jankowska, E.; Todd, J.; Yerramilli, R.; Estis, J.; Banasiak, W.; et al. Elevated troponin I level assessed by a new high-sensitive assay and the risk of poor outcomes in patients with acute heart failure. Int. J. Cardiol. 2017, 230, 646–652. [Google Scholar] [CrossRef]
- Ponikowski, P.; Voors, A.A.; Anker, S.D.; Bueno, H.; Cleland, J.G.F.; Coats, A.J.S.; Falk, V.; González-Juanatey, J.R.; Harjola, V.-P.; Jankowska, E.A.; et al. 2016 ESC Guidelines for the diagnosis and treatment of acute and chronic heart failure: The Task Force for the diagnosis and treatment of acute and chronic heart failure of the European Society of Cardiology (ESC) Developed with the special contribution of the Heart Failure Association (HFA) of the ESC. Eur. Heart J. 2016, 37, 2129–2200. [Google Scholar] [CrossRef]
- McMurray, J.J.; Adamopoulos, S.; Anker, S.D.; Auricchio, A.; Böhm, M.; Dickstein, K.; Falk, V.; Filippatos, G.; Fonseca, C.; Gomez-Sanchez, M.A.; et al. ESC Guidelines for the diagnosis and treatment of acute and chronic heart failure 2012: The Task Force for the Diagnosis and Treatment of Acute and Chronic Heart Failure 2012 of the European Society of Cardiology. Developed in collaboration with the Heart Failure Association (HFA) of the ESC. Eur. Heart J. 2012, 33, 1787–1847. [Google Scholar] [CrossRef]
- Khwaja, A. KDIGO Clinical Practice Guidelines for Acute Kidney Injury. Nephron 2012, 120, c179–c184. [Google Scholar] [CrossRef]
- Tan, P.; Steinbach, M.; Karpatne, A.; Kumar, V. Introduction to Data Mining, 2nd ed.; Pearson: San Antonio, TX, USA, 2018. [Google Scholar]
- Davies, D.L.; Bouldin, D.W. A Cluster Separation Measure. IEEE Trans. Pattern Anal. Mach. Intell. 1979, PAMI-1, 224–227. [Google Scholar] [CrossRef]
- Holgado, J.L.; Lopez, C.; Fernandez, A.; Sauri, I.; Uso, R.; Trillo, J.L.; Vela, S.; Nuñez, J.; Redon, J.; Ruiz, A. Acute kidney injury in heart failure: A population study. ESC Heart Fail. 2020, 7, 415–422. [Google Scholar] [CrossRef] [Green Version]
- Chen, J.-J.; Lee, T.-H.; Kuo, G.; Yen, C.-L.; Chen, S.-W.; Chu, P.-H.; Fan, P.-C.; Wu, V.C.-C.; Chang, C.-H. Acute Kidney Disease After Acute Decompensated Heart Failure. Kidney Int. Rep. 2022, 7, 526–536. [Google Scholar] [CrossRef] [PubMed]
- Mullens, W.; Abrahams, Z.; Francis, G.S.; Sokos, G.; Taylor, D.O.; Starling, R.C.; Young, J.B.; Tang, W.W. Importance of Venous Congestion for Worsening of Renal Function in Advanced Decompensated Heart Failure. J. Am. Coll. Cardiol. 2009, 53, 589–596. [Google Scholar] [CrossRef] [PubMed] [Green Version]
- Błaziak, M.; Urban, S.; Wietrzyk, W.; Jura, M.; Iwanek, G.; Stańczykiewicz, B.; Kuliczkowski, W.; Zymliński, R.; Pondel, M.; Berka, P.; et al. An Artificial Intelligence Approach to Guiding the Management of Heart Failure Patients Using Predictive Models: A Systematic Review. Biomedicines 2022, 10, 2188. [Google Scholar] [CrossRef]
- Schrub, F.; Oger, E.; Bidaut, A.; Hage, C.; Charton, M.; Daubert, J.C.; Leclercq, C.; Linde, C.; Lund, L.; Donal, E. Heart failure with preserved ejection fraction: A clustering approach to a heterogenous syndrome. Arch. Cardiovasc. Dis. 2020, 113, 381–390. [Google Scholar] [CrossRef]
- Casebeer, A.; Horter, L.; Hayden, J.; Simmons, J.; Evers, T. Phenotypic clustering of heart failure with preserved ejection fraction reveals different rates of hospitalization. J. Cardiovasc. Med. 2020, 22, 45–52. [Google Scholar] [CrossRef]
- Henneges, C.; Morbach, C.; Sahiti, F.; Scholz, N.; Frantz, S.; Ertl, G.; Angermann, C.E.; Störk, S. Sex-specific bimodal clustering of left ventricular ejection fraction in patients with acute heart failure. ESC Heart Fail. 2021, 9, 786–790. [Google Scholar] [CrossRef]
- Tsoi, K.K.; Chan, N.B.; Yiu, K.K.; Poon, S.K.; Lin, B.; Ho, K. Machine Learning Clustering for Blood Pressure Variability Applied to Systolic Blood Pressure Intervention Trial (SPRINT) and the Hong Kong Community Cohort. Hypertension 2020, 76, 569–576. [Google Scholar] [CrossRef]
- Janssen, D.J.; Rechberger, S.; Wouters, E.F.; Schols, J.M.; Johnson, M.J.; Currow, D.C.; Curtis, J.R.; Spruit, M.A. Clustering of 27,525,663 Death Records from the United States Based on Health Conditions Associated with Death: An Example of big Health Data Exploration. J. Clin. Med. 2019, 8, 922. [Google Scholar] [CrossRef] [PubMed] [Green Version]
- Urban, S.; Błaziak, M.; Jura, M.; Iwanek, G.; Zdanowicz, A.; Guzik, M.; Borkowski, A.; Gajewski, P.; Biegus, J.; Siennicka, A.; et al. Novel Phenotyping for Acute Heart Failure—Unsupervised Machine Learning-Based Approach. Biomedicines 2022, 10, 1514. [Google Scholar] [CrossRef] [PubMed]
- Shah, S.J.; Katz, D.; Selvaraj, S.; Burke, M.A.; Yancy, C.W.; Gheorghiade, M.; Bonow, R.O.; Huang, C.-C.; Deo, R.C. Phenomapping for Novel Classification of Heart Failure With Preserved Ejection Fraction. Circulation 2015, 131, 269–279. [Google Scholar] [CrossRef] [PubMed] [Green Version]
- Yagi, R.; Takei, M.; Kohsaka, S.; Shiraishi, Y.; Ikemura, N.; Shoji, S.; Niimi, N.; Higuchi, S.; Goda, A.; Kohno, T.; et al. Phenomapping in patients experiencing worsening renal function during hospitalization for acute heart failure. ESC Heart Fail. 2021, 8, 5192–5203. [Google Scholar] [CrossRef]
- Komajda, M.; Anker, S.D.; Cowie, M.R.; Filippatos, G.S.; Mengelle, B.; Ponikowski, P.; Tavazzi, L. on behalf of the QUALIFY Investigators Physicians’ adherence to guideline-recommended medications in heart failure with reduced ejection fraction: Data from the QUALIFY global survey. Eur. J. Heart Fail. 2016, 18, 514–522. [Google Scholar] [CrossRef] [Green Version]
- Gheorghiade, M.; Filippatos, G. Reassessing treatment of acute heart failure syndromes: The ADHERE Registry. Eur. Heart J. Suppl. 2005, 7, B13–B19. [Google Scholar] [CrossRef] [Green Version]
- Ruppar, T.M.; Cooper, P.S.; Mehr, D.R.; Delgado, J.M.; Dunbar-Jacob, J.M. Medication Adherence Interventions Improve Heart Failure Mortality and Readmission Rates: Systematic Review and Meta-Analysis of Controlled Trials. J. Am. Heart Assoc. 2016, 5, e002606. [Google Scholar] [CrossRef]
- Dunlay, S.M.; Roger, S.M.D.V.L.; Redfield, S.M.D.V.L.R.M.M. Epidemiology of heart failure with preserved ejection fraction. Nat. Rev. Cardiol. 2017, 14, 591–602. [Google Scholar] [CrossRef]
- Albar, Z.; Albakri, M.; Hajjari, J.; Karnib, M.; Janus, S.E.; Al-Kindi, S.G. Inflammatory Markers and Risk of Heart Failure With Reduced to Preserved Ejection Fraction. Am. J. Cardiol. 2022, 167, 68–75. [Google Scholar] [CrossRef]
- Guzik, M.; Sokolski, M.; Hurkacz, M.; Zdanowicz, A.; Iwanek, G.; Marciniak, D.; Zymliński, R.; Ponikowski, P.; Biegus, J. Serum Osmolarity and Vasopressin Concentration in Acute Heart Failure—Influence on Clinical Course and Outcome. Biomedicines 2022, 10, 2034. [Google Scholar] [CrossRef] [PubMed]
- Anker, S.D.; Butler, J.; Filippatos, G.; Ferreira, J.P.; Bocchi, E.; Böhm, M.; Brunner–La Rocca, H.-P.; Choi, D.-J.; Chopra, V.; Chuquiure-Valenzuela, E.; et al. Empagliflozin in Heart Failure with a Preserved Ejection Fraction. N. Engl. J. Med. 2021, 385, 1451–1461. [Google Scholar] [CrossRef]
- Figtree, G.A.; Rådholm, K.; Barrett, T.D.; Perkovic, V.; Mahaffey, K.W.; De Zeeuw, D.; Fulcher, G.; Matthews, D.R.; Shaw, W.; Neal, B. Effects of Canagliflozin on Heart Failure Outcomes Associated With Preserved and Reduced Ejection Fraction in Type 2 Diabetes Mellitus. Circulation 2019, 139, 2591–2593. [Google Scholar] [CrossRef] [PubMed] [Green Version]
- Solomon, S.D.; McMurray, J.J.; Claggett, B.; de Boer, R.A.; DeMets, D.; Hernandez, A.F.; Inzucchi, S.E.; Kosiborod, M.N.; Lam, C.S.; Martinez, F.; et al. Dapagliflozin in Heart Failure with Mildly Reduced or Preserved Ejection Fraction. N. Engl. J. Med. 2022, 387, 1089–1098. [Google Scholar] [CrossRef] [PubMed]
- Ess, M.; Mussner-Seeber, C.; Mariacher, S.; Lorsbach-Koehler, A.; Pachinger, O.; Frick, M.; Ulmer, H.; Poelzl, G. Gamma-Glutamyltransferase Rather Than Total Bilirubin Predicts Outcome in Chronic Heart Failure. J. Card. Fail. 2011, 17, 577–584. [Google Scholar] [CrossRef] [PubMed]
- Seppä, K.; Laippala, P.; Saarni, M. Macrocytosis as a Consequence of Alcohol Abuse among Patients in General Practice. Alcohol. Clin. Exp. Res. 1991, 15, 871–876. [Google Scholar] [CrossRef]
- Ponikowski, P.; Banasiak, W. Chemosensitivity in chronic heart failure. Heart Fail. Monit. 2001, 1, 126–131. Available online: https://europepmc.org/article/med/12634897 (accessed on 25 September 2022).
- Wasung, M.E.; Chawla, L.S.; Madero, M. Biomarkers of renal function, which and when? Clin. Chim. Acta 2015, 438, 350–357. [Google Scholar] [CrossRef]
- Ahmad, T.; Jackson, K.; Rao, V.S.; Tang, W.W.; Brisco-Bacik, M.A.; Chen, H.H.; Felker, G.M.; Hernandez, A.F.; O’Connor, C.M.; Sabbisetti, V.S.; et al. Worsening Renal Function in Patients With Acute Heart Failure Undergoing Aggressive Diuresis Is Not Associated With Tubular Injury. Circulation 2018, 137, 2016–2028. [Google Scholar] [CrossRef]
- Sokolski, M.; Zymlinski, R.; Biegus, J.; Siwołowski, P.; Nawrocka-Millward, S.; Todd, J.; Yerramilli, M.R.; Estis, J.; Jankowska, E.A.; Banasiak, W.; et al. Urinary levels of novel kidney biomarkers and risk of true worsening renal function and mortality in patients with acute heart failure. Eur. J. Heart Fail. 2017, 19, 760–767. [Google Scholar] [CrossRef] [Green Version]
- Urban, S.; Blaziak, M.; Biegus, J.; Zymlinski, R. Ultrafiltration in acute heart failure: Current knowledge and fields for further research. Adv. Clin. Exp. Med. 2021, 30, 737–746. [Google Scholar] [CrossRef] [PubMed]
- Costanzo, M.R. Verdict In: Congestion Guilty! JACC Heart Fail. 2015, 3, 762–764. [Google Scholar] [CrossRef] [PubMed]
- Brisco, M.A.; Zile, M.; Hanberg, J.S.; Wilson, F.; Parikh, C.; Coca, S.; Tang, W.W.; Testani, J.M. Relevance of Changes in Serum Creatinine During a Heart Failure Trial of Decongestive Strategies: Insights From the DOSE Trial. J. Card. Fail. 2016, 22, 753–760. [Google Scholar] [CrossRef] [PubMed] [Green Version]
- Costanzo, M.R.; Chawla, L.S.; Tumlin, J.A.; Herzog, C.A.; McCullough, P.A.; Kellum, J.A.; Ronco, C. The role of early and sufficient isolated venovenous ultrafiltration in heart failure patients with pul-monary and systemic congestion. Rev. Cardiovasc. Med. 2013, 14, 123–133. [Google Scholar] [CrossRef] [PubMed]
- Horiuchi, Y.; Tanimoto, S.; Latif, A.M.; Urayama, K.Y.; Aoki, J.; Yahagi, K.; Okuno, T.; Sato, Y.; Tanaka, T.; Koseki, K.; et al. Identifying novel phenotypes of acute heart failure using cluster analysis of clinical variables. Int. J. Cardiol. 2018, 262, 57–63. [Google Scholar] [CrossRef]
- Nowak, R.M.; Reed, B.P.; DiSomma, S.; Nanayakkara, P.; Moyer, M.; Millis, S.; Levy, P. Presenting phenotypes of acute heart failure patients in the ED: Identification and implications. Am. J. Emerg. Med. 2017, 35, 536–542. [Google Scholar] [CrossRef]
- Arora, P.; Varshney, S. Analysis of K-Means and K-Medoids Algorithm For Big Data. Procedia Comput. Sci. 2016, 78, 507–512. [Google Scholar] [CrossRef]


| Demographics | Age, Sex |
|---|---|
| HF characteristics | De novo or chronic HF, Etiology |
| Comorbidities | Coronary artery disease, myocardial infarction, PCI/CABG, Hypertension, Valvular heart disease, Diabetes, Diabetes treated with insulin, oral drugs or diet, stroke, COPD |
| Clinical status | Dyspnoea at rest, Dyspnoea at rest (since number of days), NYHA scale at admission, Swelling of the lower limbs, Decrease in exercise tolerance, Decrease in exercise tolerance (since number of days), Body weight, Systolic pressure, Diastolic pressure, Heart rate, Jugular veins pressure, Pulmonary congestion, Pulmonary congestion, Ascites, Hepatomegaly, Implantable device: none = 0, 1-PM, 2-ICD, 3-CRT2 |
| Lifestyle factors | Smoking status (0 = never, 1 = now, 2 = in the past), how many cigarettes did the patient smoke, Active alcohol use, how many cigarettes patients smoke daily, ow many years did/does the patient smoke |
| Laboratory parameters | PH serum, pCO2, pO2, ctO2, BO2, HCO3, HCO3std, ctCO2, BE, sO2, FO2Hb, FHHb, ctHb, Lac, mOsm, HGB, HCT, RBC, MCV, MCH, MCHC, RDW, WBC, LYMPH, MONO, NEUTR, PLT, Na serum, K serum, Creatinine serum, Urea serum, Glucose serum, Ast, Alt, CRP, GGTP, NTproBNP, Total_bilirubin, INR, Albumins serum, Na urine, K urine, Urea urine, Creatinine urine, Fe, TIBC, Tsat, sTfR, Ferritin, IL-6 |
| Echocardiography | Reduced ejection fraction; ejection fraction |
| Parameter | Cluster 0 | Cluster 1 | Cluster 2 | Global | p |
|---|---|---|---|---|---|
| Demographics | |||||
| n | 158 (51%) | 110 (35%) | 44 (14%) | 312 | |
| Sex, male (n) | 138 (87%) | 53 (48%) | 43 (98%) | 234 (75%) | <0.001 |
| Age (years) | 69.192 ± 11.826 | 72.217 ± 11.736 | 56.015 ± 13.273 | 68.4 ± 13.054 | <0.001 |
| AHF characteristics | |||||
| Ejection fraction | 30 (25–38.5) | 43 (30–53.5) | 25 (15–35) | 32 (25–45) | <0.001 |
| Chronic HF (n) | 133 (84%) | 29 (26%) | 34 (77%) | 196 (63%) | <0.001 |
| Reduced EF (n) | 133 (84%) | 59 (54%) | 34 (77%) | 226 (72%) | <0.001 |
| Aetiology | <0.001 | ||||
| Coronary artery disease (n) | 120 (76%) | 19 (17%) | 8 (18%) | 147 (47%) | |
| Valvular (n) | 12 (8%) | 21 (19%) | 6 (14%) | 39 (13%) | |
| Hypertension (n) | 5 (3%) | 6 (5%) | 0 (0%) | 11 (4%) | |
| Other (n) | 21 (13%) | 64 (58%) | 30 (68%) | 115 (37%) | |
| Comorbidities | |||||
| Coronary artery disease (n) | 139 (88%) | 37 (34%) | 7 (16%) | 183 (59%) | <0.001 |
| Myocardial infarction in the past (n) | 73 (46%) | 22 (20%) | 4 (9%) | 99 (32%) | <0.001 |
| PCI/CABG in the past (n) | 75 (47%) | 19 (17%) | 3 (7%) | 97 (31%) | <0.001 |
| Hypertension (n) | 127 (80%) | 100 (91%) | 10 (23%) | 237 (76%) | <0.001 |
| Valvular disease (n) | 113 (72%) | 62 (56%) | 29 (66%) | 204 (65%) | 0.037 |
| Diabetes mellitus (n) | 63 (40%) | 56 (51%) | 5 (11%) | 124 (40%) | <0.001 |
| Diabetes treatment (n) | 0.002 | ||||
| Insulin | 25 (16%) | 11 (10%) | 1 (2%) | 37 (12%) | |
| Oral drugs | 28 (18%) | 25 (23%) | 4 (9%) | 57 (18%) | |
| Diet | 6 (4%) | 4 (4%) | 0 (0%) | 10 (3%) | |
| Stroke (n) | 21 (13%) | 14 (13%) | 6 (14%) | 41 (13%) | 0.986 |
| COPD (n) | 27 (17%) | 9 (8%) | 4 (9%) | 40 (13%) | 0.073 |
| Clinical status | |||||
| Dyspnoea at rest (n) | 131 (83%) | 84 (76%) | 35 (80%) | 250 (80%) | 0.299 |
| Dyspnoea at rest lasts for (number) days | 3 (2–7) | 2 (1–7) | 5.5 (2.5–8.5) | 3 (1–7) | 0.370 |
| Deterioration of effort tolerance (n) | 152 (96%) | 103 (94%) | 39 (89%) | 294 (94%) | 0.175 |
| Deterioration of effort tolerance (number) days | 14 (7–21) | 14 (7–30) | 14 (7–30) | 14 (7–28) | 0.021 |
| NYHA (n) | <0.001 | ||||
| I | 5 (3%) | 3 (3%) | 4 (9%) | 12 (4%) | |
| II | 39 (25%) | 8 (7%) | 9 (20%) | 56 (18%) | |
| III | 42 (27%) | 19 (17%) | 14 (32%) | 75 (24%) | |
| IV | 64 (41%) | 62 (56%) | 14 (32%) | 140 (45%) | |
| Swelling of lower limbs (n) | 0.050 | ||||
| Swelling of lower limbs 0 | 43 (27%) | 32 (29%) | 8 (18%) | 83 (27%) | |
| Swelling of lower limbs 1 | 37 (23%) | 25 (23%) | 8 (18%) | 70 (22%) | |
| Swelling of lower limbs 2 | 50 (32%) | 32 (29%) | 12 (27%) | 94 (30%) | |
| Swelling of lower limbs 3 | 28 (18%) | 20 (18%) | 16 (36%) | 64 (21%) | |
| JVP (n) | 0.005 | ||||
| JVP 1 | 97 (61%) | 70 (64%) | 17 (39%) | 184 (59%) | |
| JVP 2 | 51 (32%) | 38 (35%) | 23 (52%) | 112 (36%) | |
| JVP 3 | 10 (6%) | 1 (1%) | 4 (9%) | 15 (5%) | |
| Pulmonary congestion (n) | 147 (93%) | 91 (83%) | 40 (91%) | 278 (89%) | 0.026 |
| Pulmonary oedema (n) | 0.108 | ||||
| no | 11 (7%) | 18 (16%) | 4 (9%) | 33 (11%) | |
| up to 1/3 of lungs | 102 (65%) | 48 (44%) | 33 (75%) | 183 (59%) | |
| up to 2/3 | 35 (22%) | 24 (22%) | 5 (11%) | 64 (21%) | |
| >2/3 | 10 (6%) | 19 (17%) | 2 (5%) | 31 (10%) | |
| Ascites (n) | 19 (12%) | 7 (6%) | 15 (34%) | 41 (13%) | <0.001 |
| Hepatomegaly (n) | 25 (16%) | 14 (13%) | 26 (59%) | 65 (21%) | <0.001 |
| Implantable device (n) | <0.001 | ||||
| PM | 16 (10%) | 7 (6%) | 1 (2%) | 24 (8%) | |
| ICD | 43 (27%) | 2 (2%) | 3 (7%) | 48 (15%) | |
| CRT | 15 (9%) | 2 (2%) | 4 (9%) | 21 (7%) | |
| Systolic pressure (mmHg) | 130 (110–150) | 145 (124–171) | 110 (100–127) | 130 (110–150) | <0.001 |
| Diastolic pressure (mmHg) | 75.5 (70–87) | 83 (70–100) | 70 (60–83.5) | 80 (70–90) | <0.001 |
| Heart rate (beats per minute) | 78 (70–100) | 90 (72–110) | 100 (80–110) | 83 (70–100) | <0.001 |
| Body weight (kg) | 80 (72.55–93) | 78.25 (68.5–88.6) | 76 (67–87.8) | 79.2 (70–91) | 0.437 |
| Lifestyle factors | |||||
| Smoking status (n) | <0.001 | ||||
| Never | 74 (47%) | 74 (67%) | 15 (34%) | 163 (52%) | |
| Active | 18 (11%) | 15 (14%) | 15 (34%) | 48 (15%) | |
| In the past | 66 (42%) | 21 (19%) | 14 (32%) | 101 (32%) | |
| How many cigarettes patient smoke daily (n) | 10 (0–20) | 10 (0–20) | 10 (0–20) | 10 (0–20) | 0.797 |
| How many years did the patient smoke/does the patient smoke cigarettes (n) | 20 (0–30) | 10 (0–30) | 13 (0–30) | 20 (0–30) | 0.380 |
| Active alcohol use (n) | 40 (25%) | 18 (16%) | 29 (66%) | 87 (28%) | <0.001 |
| Laboratory parameters | |||||
| HGB (g/dL) | 13.232 ± 1.993 | 12.955 ± 1.892 | 13.975 ± 1.759 | 13.239 ± 1.947 | 0.013 |
| HCT (%) | 39.844 ± 5.535 | 39.145 ± 5.233 | 41.766 ± 5.173 | 39.868 ± 5.427 | 0.025 |
| RBC (× 1012/L) | 4.482 ± 0.663 | 4.389 ± 0.568 | 4.552 ± 0.586 | 4.459 ± 0.621 | 0.274 |
| MCV (fL) | 89.195 ± 6 | 89.31 ± 5.743 | 92.125 ± 7.124 | 89.649 ± 6.145 | 0.015 |
| MCH (pg) | 29.597 ± 2.253 | 29.546 ± 2.466 | 30.828 ± 2.992 | 29.749 ± 2.472 | 0.008 |
| WBC (× 109/L) | 8.54 (6.5–10.3) | 8.1 (6.5–10.4) | 8.45 (7.1–9.85) | 8.3 (6.6–10.3) | 0.872 |
| PLT (× 109/L) | 196 (159–242) | 201 (158–248) | 207 (174–250) | 198 (159–245) | 0.777 |
| pH | 7.45 (7.42–7.48) | 7.425 (7.375–7.465) | 7.45 (7.43–7.49) | 7.44 (7.41–7.47) | 0.003 |
| sO2 (%) | 92.85 (90.1–95.45) | 93.55 (91.3–94.9) | 93.8 (88.7–96.3) | 93.2 (90.4–95.4) | 0.946 |
| pO2 (mmHg) | 65.35 (57.9–73.25) | 67.4 (62.4–74.45) | 66.9 (55.2–80.6) | 66.1 (59–74.6) | 0.956 |
| pCO2 (mmHg) | 34.65 (32.15–38.8) | 35.8 (32.4–39.25) | 33.4 (30.4–36.9) | 35.2 (32–38.9) | 0.517 |
| HCO3 (mmol/L) | 24.025 ± 3.223 | 22.805 ± 3.416 | 23.939 ± 4.62 | 23.578 ± 3.558 | 0.025 |
| BE mEq/l | 0.197 ± 3.42 | -1.252 ± 3.712 | 0.3 ± 4.523 | -0.304 ± 3.755 | 0.007 |
| mOsm (Osm/L) | 281 (274–286) | 286 (280–290) | 274 (264-285) | 282 (274–288) | <0.001 |
| Na (mmol/L) | 139 (137–142) | 140 (138–142) | 136.5 (133.5–141) | 139 (136–142) | 0.007 |
| K (mmol/L) | 4.117 ± 0.549 | 4.296 ± 0.627 | 4.107 ± 0.537 | 4.179 ± 0.581 | 0.031 |
| Lactates (mmol/L) | 1.9 (1.5–2.4) | 2 (1.5–2.7) | 2 (1.6–3) | 2 (1.5–2.55) | 0.088 |
| Glucose (mg/dL) | 120 (102–157) | 131 (106–186) | 107.5 (94.5–126.5) | 120 (102.5–152) | 0.001 |
| INR | 1.37 (1.12–1.8) | 1.32 (1.12–1.93) | 1.35 (1.175–1.7) | 1.345 (1.12–1.8) | 0.102 |
| Albumin (g/dL) | 3.775 ± 0.367 | 3.743 ± 0.402 | 3.602 ± 0.42 | 3.738 ± 0.39 | 0.036 |
| Ast (IU/L) | 26 (19–34.5) | 29.5 (22–41) | 28.5 (20.5–40) | 27 (20–38) | 0.004 |
| Alt (IU/L) | 28 (17.5–47) | 31 (20.5–55.5) | 28 (18.5–44) | 29 (19–48) | 0.019 |
| Total bilirubin (mg/dL) | 1.06 (0.77–1.6) | 0.9 (0.63–1.47) | 1.415 (0.905–2.455) | 1.04 (0.72–1.67) | <0.001 |
| GGTP (IU/L) | 70 (45–135) | 54.5 (29–103) | 99 (48–206) | 69.5 (40–123.5) | 0.021 |
| CRP (mg/L) | 7.04 (4–15.4) | 6.2 (2.6–14) | 10.25 (4.35–24.35) | 7.1 (3.4–16.2) | 0.513 |
| IL6 (pg/mL) | 8.346 (1.155–21.1) | 11.705 (3.257–26.299) | 11.352 (6.338–30.117) | 10.056 (2.508–22.9) | 0.734 |
| Ferritin (ng/mL) | 101.9 (51.94–191) | 125.6 (65.5–218.75) | 115.15 (51–287.9) | 105.7 (57.08–212) | 0.372 |
| Tsat (%) | 16.1 (12.3–21.9) | 15.608 (11.9–18.519) | 16.026 (10.7–26.6) | 15.84 (11.82–21.1) | 0.030 |
| sTfR (mg/L) | 1.885 (1.495–2.46) | 1.82 (1.46–2.46) | 1.755 (1.4–2.53) | 1.85 (1.46–2.46) | 0.972 |
| TIBC (μg/dL) | 352.192 ± 72.92 | 338.052 ± 62.645 | 366.357 ± 76.825 | 349.514 ± 70.639 | 0.075 |
| Fe (μg/dL) | 56 (43–79) | 51 (40–64) | 60.5 (43–88) | 54 (42–73) | 0.005 |
| NTproBNP (pg/mL) | 5291 (3081–9203) | 5525 (2755–13,629) | 7106 (5026–11,759) | 5659 (3119–10,572) | 0.021 |
| Creatinine (mg/dL) | 1.21 (1.04–1.47) | 1.23 (0.95–1.62) | 1.14 (0.925–1.44) | 1.21 (1.005–1.49) | 0.761 |
| Urine Creatinine (mg/dL) | 69.4 (37.1–126.5) | 43.5 (27.6–88.7) | 73.6 (34.7–125.9) | 61.5 (31.6–110.9) | 0.026 |
| Urea (mmol/L) | 52 (39–73) | 48 (38–73) | 56 (39–74) | 51 (38–73) | 0.224 |
| Urine Urea (mmol/L) | 841 (506–1413) | 581 (384–1232) | 1122.5 (482–1663) | 813 (433–1437) | 0.023 |
| Urine K (mmol/L) | 30 (20.53–43.27) | 26 (17–39) | 28.415 (19.6–45) | 29 (19–42.59) | 0.249 |
| Urine Na (mmol/L) | 88.253 ± 38.623 | 97.721 ± 32.398 | 84.786 ± 48.268 | 91.05 ± 38.333 | 0.078 |
| Cluster | Key Clinical Features |
|---|---|
| Cluster 0 | Most numerous cluster. Highest: % of chronic and reduced EF HF, CAD, Valvular heart disease, COPD, implanted electric devices, pulmonary congestion, albumins, HCO3, Tsat, insulin-dependent, and diet-treated diabetes. Lowest: deterioration of effort tolerance (number) of days, HR, MCV, Ast, Alt, NT-proBNP. Non-significant: highest % of dyspnea at rest, deterioration of effort tolerance, swelling of the lower limbs 1, 2, body weight, past smokers. Lowest: limbs oedema III, JVP II, active smokers—elderly chronic HFrEF male, with mild congestion, moderate WRF and AKI, and one-year mortality occurrence |
| Cluster 1 | Highest: % of females, age, ejection fraction, % of de novo HF and preserved EF, valvular and hypertension aetiology, hypertension, diabetes, RR, mOsm, Na, K, glucose, Ast, Alt, lowest: ascites, hepatomegaly, HGB, HCT, MCH, pH HCO3, urine creatinine and urea, Non-significant: highest: NYHA IV, limbs oedema I, JVP I, no pulmonary oedema, pCO2, IL-6, ferritin, creatinine, urine Na—first manifestation of HFpEF older woman, with high inflammatory markers, creatinine and osmolarity, highest AKI and WRF occurrence, and moderate one-year mortality |
| Cluster 2 | Highest: % of males, other aetiology, stroke history, ascites, hepatomegaly, HR, active alcohol users, HGB, HCT, MCV, bilirubin, GGTP, Fe, NT-proBNP, and urine creatinine and urea. Lowest: age, ejection fraction, CAD history, RR, mOsm, Na, K, glucose, and albumin Non-significant: highest: active smokers, limbs oedema III, pulmonary oedema I. Lowest: body weight, CO2, creatinine, urine Na—young men, with massive oedema and substance abuse involvement, low AKI and WRF occurrence, and highest one-year mortality |
| Parameter | Cluster 0 | Cluster 1 | Cluster 2 | Global | p |
|---|---|---|---|---|---|
| WRF, n | 24 (15%) | 26 (24%) | 1 (2%) | 51 (16%) | 0.004 |
| AKI, n | 12 (8%) | 17 (15%) | 0 (0%) | 29 (9%) | 0.007 |
| Time of hospitalization (days) | 6 (5–9) | 7 (5–9) | 8 (6–14) | 7 (5–9.5) | 0.006 |
| In hospital deterioration of HF, n | 9 (6%) | 7 (6%) | 3 (7%) | 19 (6%) | 0.856 |
| One year mortality, n | 35 (22%) | 24 (22%) | 15 (34%) | 74 (24%) | 0.200 |
Publisher’s Note: MDPI stays neutral with regard to jurisdictional claims in published maps and institutional affiliations. |
© 2022 by the authors. Licensee MDPI, Basel, Switzerland. This article is an open access article distributed under the terms and conditions of the Creative Commons Attribution (CC BY) license (https://creativecommons.org/licenses/by/4.0/).
Share and Cite
Urban, S.; Błaziak, M.; Jura, M.; Iwanek, G.; Ponikowska, B.; Horudko, J.; Siennicka, A.; Berka, P.; Biegus, J.; Ponikowski, P.; et al. Machine Learning Approach to Understand Worsening Renal Function in Acute Heart Failure. Biomolecules 2022, 12, 1616. https://doi.org/10.3390/biom12111616
Urban S, Błaziak M, Jura M, Iwanek G, Ponikowska B, Horudko J, Siennicka A, Berka P, Biegus J, Ponikowski P, et al. Machine Learning Approach to Understand Worsening Renal Function in Acute Heart Failure. Biomolecules. 2022; 12(11):1616. https://doi.org/10.3390/biom12111616
Chicago/Turabian StyleUrban, Szymon, Mikołaj Błaziak, Maksym Jura, Gracjan Iwanek, Barbara Ponikowska, Jolanta Horudko, Agnieszka Siennicka, Petr Berka, Jan Biegus, Piotr Ponikowski, and et al. 2022. "Machine Learning Approach to Understand Worsening Renal Function in Acute Heart Failure" Biomolecules 12, no. 11: 1616. https://doi.org/10.3390/biom12111616