Article

Computational Insights into the Structural Dynamics of MDA5 Variants Associated with Aicardi–Goutières Syndrome and Singleton–Merten Syndrome

1
Department of Animal Biotechnology, Jeonbuk National University, Jeonju 54896, Korea
2
Department of Biotechnology, National Institute of Technology, Warangal 506004, Telangana, India
3
Department of Agricultural Convergence Technology, Jeonbuk National University, Jeonju 54896, Korea
*
Authors to whom correspondence should be addressed.
Biomolecules 2021, 11(8), 1251; https://doi.org/10.3390/biom11081251
Submission received: 14 July 2021 / Revised: 15 August 2021 / Accepted: 16 August 2021 / Published: 21 August 2021

Abstract

:
Melanoma differentiation-associated protein 5 (MDA5) is a crucial RIG-I-like receptor RNA helicase enzyme encoded by IFIH1 in humans. Single nucleotide polymorphisms in the IFIH1 results in fatal genetic disorders such as Aicardi–Goutières syndrome and Singleton–Merten syndrome, and in increased risk of type I diabetes in humans. In this study, we chose four different amino acid substitutions of the MDA5 protein responsible for genetic disorders: MDA5L372F, MDA5A452T, MDA5R779H, and MDA5R822Q and analyzed their structural and functional relationships using molecular dynamic simulations. Our results suggest that the mutated complexes are relatively more stable than the wild-type MDA5. The radius of gyration, interaction energies, and intra-hydrogen bond analysis indicated the stability of mutated complexes over the wild type, especially MDA5L372F and MDA5R822Q. The dominant motions exhibited by the wild-type and mutant complexes varied significantly. Moreover, the betweenness centrality of the wild-type and mutant complexes showed shared residues for intra-signal propagation. The observed results indicate that the mutations lead to a gain of function, as reported in previous studies, due to increased interaction energies and stability between RNA and MDA5 in mutated complexes. These findings are expected to deepen our understanding of MDA5 variants and may assist in the development of relevant therapeutics against the disorders.

1. Introduction

Pattern recognition receptors (PRR) are essential for the initiation of innate immune responses, which initially discriminate self- and non-self-components within the organism, thereby regulating responses [1,2]. An example is the retinoic acid-inducible gene 1 (RIG-1)-like receptor, which plays a crucial role in viral infection by sensing viral RNA and initiating/regulating antiviral immune responses [3]. RIG-1-like receptor family comprises of three members: RIG-I, melanoma differentiation-associated protein 5 (MDA5), and laboratory of genetics and physiology 2 [4]. Among these, RIG-1 and MDA5 exhibit similar domain organization and transduce downstream signaling through a common adaptor called mitochondrial antiviral signaling protein. Upon binding to viral RNA, further signaling cascades occur, leading to the production of IFN1 through several signaling intermediates, such as IκB kinase epsilon (IKKε) and TANK Binding Kinase 1 (TBK1) [5,6,7].
RIG-I and MDA5 share similar structural homology, including two repeats of the N-terminal caspase activation recruitment domains, a central DEAD-like or DEAH-like (DExD/H) helicase domain (where x can be any amino acid), and a cysteine-rich C-terminal domain (CTD) [6,8]. The caspase activation recruitment domain interacts with mitochondrial antiviral signaling protein and RNA via the helicase domain. These receptors differ from other pattern recognition receptors, such as Toll-like receptors, which are composed of repeated leucine-rich repeats, required to recognize viral components in a particular pattern. In contrast to Toll-like receptors, RIG-1-like receptors detect viral RNA with a central conserved DExD/H helicase domain. Although CTD plays a role in the autoinhibition of RIG-1 and MDA5, the CTD crystal structure suggests that it plays a crucial role in the high binding affinity and selectivity of double-stranded RNA (dsRNA) [9,10]. However, MDA5 CTD exhibits less binding affinity for dsRNA compared with full-length MDA5 [11].
Despite the homology between MDA5 and RIG-1, they differ with regard to sensing viral infections [12]. RIG-1 detects orthomyxovirus infection, whereas MDA5 senses picarnovirus infection. In particular, MDA5 detects RNA length and secondary structure, in contrast to what RIG-1 detects. Moreover, despite the protective antiviral activity of MDA5, this receptor is involved in several autoimmune and autoinflammatory diseases [12]. Recent studies have reported that MDA5 is activated during certain cancer treatments [13,14], which indicates the importance of understanding the MDA5 activation mechanism at the molecular level. Single nucleotide polymorphisms in the genes encoding pattern recognition receptors are reportedly associated with several diseases [15,16]. These polymorphisms in IFIH1 encoding MDA5 have been linked to several diseases, such as psoriasis, systemic lupus erythematosus, and type 1 diabetes [17,18,19,20]. It is unclear how these mutations are associated with these diseases; however, reports suggest that a single mutation may induce conformational changes required to influence the function of MDA5 irrespective of RNA binding [21]. In addition, IFIH1 mutations cause rare disorders such as Singleton–Merten syndrome and Aicardi–Goutières syndrome (AGS) [22,23,24]. AGS is a severe neurological disorder that often results in death during childhood. IFIH1 mutations located in the central helicase domain suggest alterations in the interaction pattern between dsRNA and MDA5, thereby leading to AGS [23,24]. In particular, L372F, A452T, and R779H are involved in the gain of function and association with AGS. In addition, R822Q has been linked to Singleton–Merten syndrome. Several crystal structures have been solved for MDA5-dsRNA bound complexes [8,25,26]. However, research on mutation-induced conformational changes that may influence the functional mechanism of MDA5 is currently lacking.
In this study, we investigated and compared the conformational changes in wild type and mutant MDA5 upon dsRNA binding. It was previously reported that mutations L372F, A452T, R779H and R822Q results in gain of function [22,23,24]. The dsRNA-bound MDA5 (MDA5WT) and mutants (MDA5L372F, MDA5A452T, MDA5R779H, and MDA5R822Q) were prepared and subjected to molecular dynamics simulations to understand their structural dynamics. Further, trajectory analysis, principal component analysis (PCA), and residue network analysis were performed to examine the global motions and intramolecular signaling flow of the wild type and mutant MDA5 complexes during simulations. The summary of the work is listed below:
I.
Analysis of MDA5 sequence conservation, and stability of mutated sequences (MDA5L372F, MDA5A452T, MDA5R779H, and MDA5R822Q);
II.
Preparation and MD simulation of MDA5WT, MDA5L372F, MDA5A452T, MDA5R779H, and MDA5R822Q;
III.
Trajectory analysis of MDA5 wild-type and mutant complexes: RMSD, RMSF, SASA, Rg, inter H-bonds, intra-H-bonds, interaction energies, PCA and residue network analysis.

2. Materials and Methods

2.1. Conservation and Mutant Stability Analyses

First, we extracted the crystal structure of MDA5 bound to dsRNA and ADPNP from the protein databank (ID:4GL2). The description of the structure is as follows, organism: homo sapiens, chain: A, sequence length: 699 residues, domains: “Hel1 (starting residue 298)”, “Hel2i (549)”, “Hel2 (698)”, “Pincer (838)”, “C-terminal domain (900)”, Major molecules: MDA5, dsRNA, ADPNP, Zn ion and missing residues: 392–395, 423–430, 474–477, 544–548, 639–668, 695–698, 746–750, 781–783, 890–899, 943–957, 975–978. The domains are given with the starting residue based on the report [8]. The ConSurf server [27,28] was used to identify the evolutionarily conserved amino acids in MDA5 using either protein structure or sequence with default parameters (https://consurf.tau.ac.il/, accessed on 18 March 2021). First, this server searches for homologous sequences using the HMMER algorithm with an E-value cutoff of 0.0001 in the UNIREF-90 protein database. Multiple sequence alignment is then performed using the MAFFT-L-INS-i method. Finally, the server calculates the phylogeny of homologous sequences and provides the conservation score for each amino acid using the Bayesian method, which classifies the scoring scheme as variable (1–4), intermediate (5–6), and conserved (7–9). Here, the protein sequence of MDA5 was analyzed and the conserved residue was mapped on to the structure (4GL2).
To determine the stability of the protein after single amino acid mutations, I-Mutant 2.0 [29] was used (https://folding.biofold.org/i-mutant//pages/dbMut.html, accessed on 1 June 2021). I-Mutant 2.0 is based on the support vector machine algorithm and can predict the stability of a protein correctly in 80% of cases [29]. The server provides free energy change (DDG) values as a regression estimator and signs of stability change wherein mutated structures with DDG values > 0 are considered to have increased stability and structures with DDG <0 have decreased stability. The functional impact of a mutation was analyzed using the Protein Variation Effect Analyzer, which predicts the impact of a mutation on the biological function of a protein [30]. The server filters sequence variants to identify non-synonymous variants that are functionally important. According to the server, the default threshold score is fixed at −2.5 and variants with scores equal to or below the threshold value are considered deleterious. Likewise, variants with scores above −2.5 are considered neutral.

2.2. Preparation of dsRNA-Bound MDA5 Wild Type and Mutant Complexes

MDA5-dsRNA complex structures have been previously solved through crystallography [8]. However, the crystal structures exist with several missing residues, particularly in the loop regions. Hence, to build the missing residues and prepare the MDA5-dsRNA bound complex, we used a dsRNA-bound MDA5 crystal structure (4GL2). The missing residues were built using a Swiss modeler (https://swissmodel.expasy.org/, accessed on 28 April 2020), and then the loops were further refined (only built loops) using mod loop refinement [31,32]. The length of the MDA5 structure considered was 707 residues ranging from 307-1013. As our objective was to assess the structural stability and binding capability of dsRNA upon mutation, we removed the ADPNP molecule from the structure and considered the complex as wild-type MDA5 (MDA5WT). To construct mutants, we replaced leucine at position 372 with phenylalanine (MDA5L372F), alanine at position 452 with threonine (MDA5A452T), arginine at position 779 with histidine (MDA5R779H), and arginine at position 822 with glutamine (MDA5R822Q) using PyMOL with probable rotamers [33]. Finally, stereochemical properties were checked using the ProQ webserver (https://proq.bioinfo.se/ProQ/ProQ.html, accessed on 14 May 2020) [34], and structural geometries were cleaned for any steric clashes using the Discovery Studio visualizer (Dassault Systems, BIOVIA, San Diego, CA, USA) [35].

2.3. Molecular Dynamic Simulations

To assess the structural dynamics of all the five systems (MDA5WT, MDA5L372F, MDA5A452T, MDA5R779H, and MDA5R822Q), we employed all-atom molecular dynamic simulations using Gromacs 5.1.4 [36,37], as reported in our previous study [38]. The wild-type and mutated complexes were first placed in a dodecahedron box with water molecules, and the distance between the protein surface and box wall was set at 1.2 nm. The Amber-ff99SB-ILDN force field was used for both the protein and dsRNA. Energy minimization was performed using the steepest gradient method with a maximum tolerance of 1000 kJ/mol. Subsequently, equilibration with the NVT and NPT ensemble was performed for 100 ps and 500 ps, respectively, with restraints. Temperature (modified Brendenson thermostat) and pressure (Parrinello–Rahman barostat) couplings were used at 300 K and 1.0 bar for the equilibrations. Finally, production simulations were performed for 200 ns without restraints. Electrostatic interactions such as short- and long-range interactions were applied with 1.0 nm. The Particle Mesh Ewald algorithm was used to maintain the long-range interactions and grid spacing of 0.16 nm for FFT with fourth-order cubic interpolation. A 2 fs time step was used for the simulations, and the 2 ps data were saved for the entire trajectory. Finally, trajectory analysis was performed using the GROMACS analysis tools, and plots were generated using Excel.

2.4. PCA and Free Energy Landscape (FEL) Analyses

The concerted motions of structures are essential for their biological functions, and to study the motions of the structures in this study, PCA was conducted for backbone atoms using 50 ps coordinates from the last 100 ns of each complex trajectory. Rotational and translational motions were removed accordingly, and the covariance matrix was computed. From the covariance matrix, the eigenvalues and eigenvectors were analyzed using the gmx anaeig tool. The principal components (PC) with the largest motions were then selected and plotted for comparison. The comparison using the PCs provides the main information about the spread of the datapoints in the phase space, which indicates the global motion of the protein during simulation. To study FEL, the gmx sham tool was used to combine the data points of the reaction coordinates of the PCs with the largest motions. FEL plots were drawn using Mathematica (version 12).

2.5. Residue Network Analysis

The impact of mutations on the structure of a protein can be understood in detail by using residue interaction networks. Residue networks were constructed using the NAPS webserver (http://bioinf.iiit.ac.in/NAPS/, accessed on 15 March 2021) [39] for the representative structures of both the wild-type and mutant MDA5 complexes with a non-weighted edge and a Cα-Cα pair maximum threshold of 7 Å. From this analysis, the betweenness centrality (CB) values, which may be functionally important for signal transduction within the protein, were determined. CB values play a vital role in suggesting residues that are crucial for protein function. The value indicates the centrality of the node in a residue network. It is calculated by the number of shortest paths from between vertices that pass through a node. Basically, it quantifies the number of times a node can act as a bridge along the paths of any two other nodes. Hence, the high CB value of a particular node (residue) may have an impact on the structural–functional relationship. This allows us to understand the importance of residues involved in long range communications in a protein.

3. Results

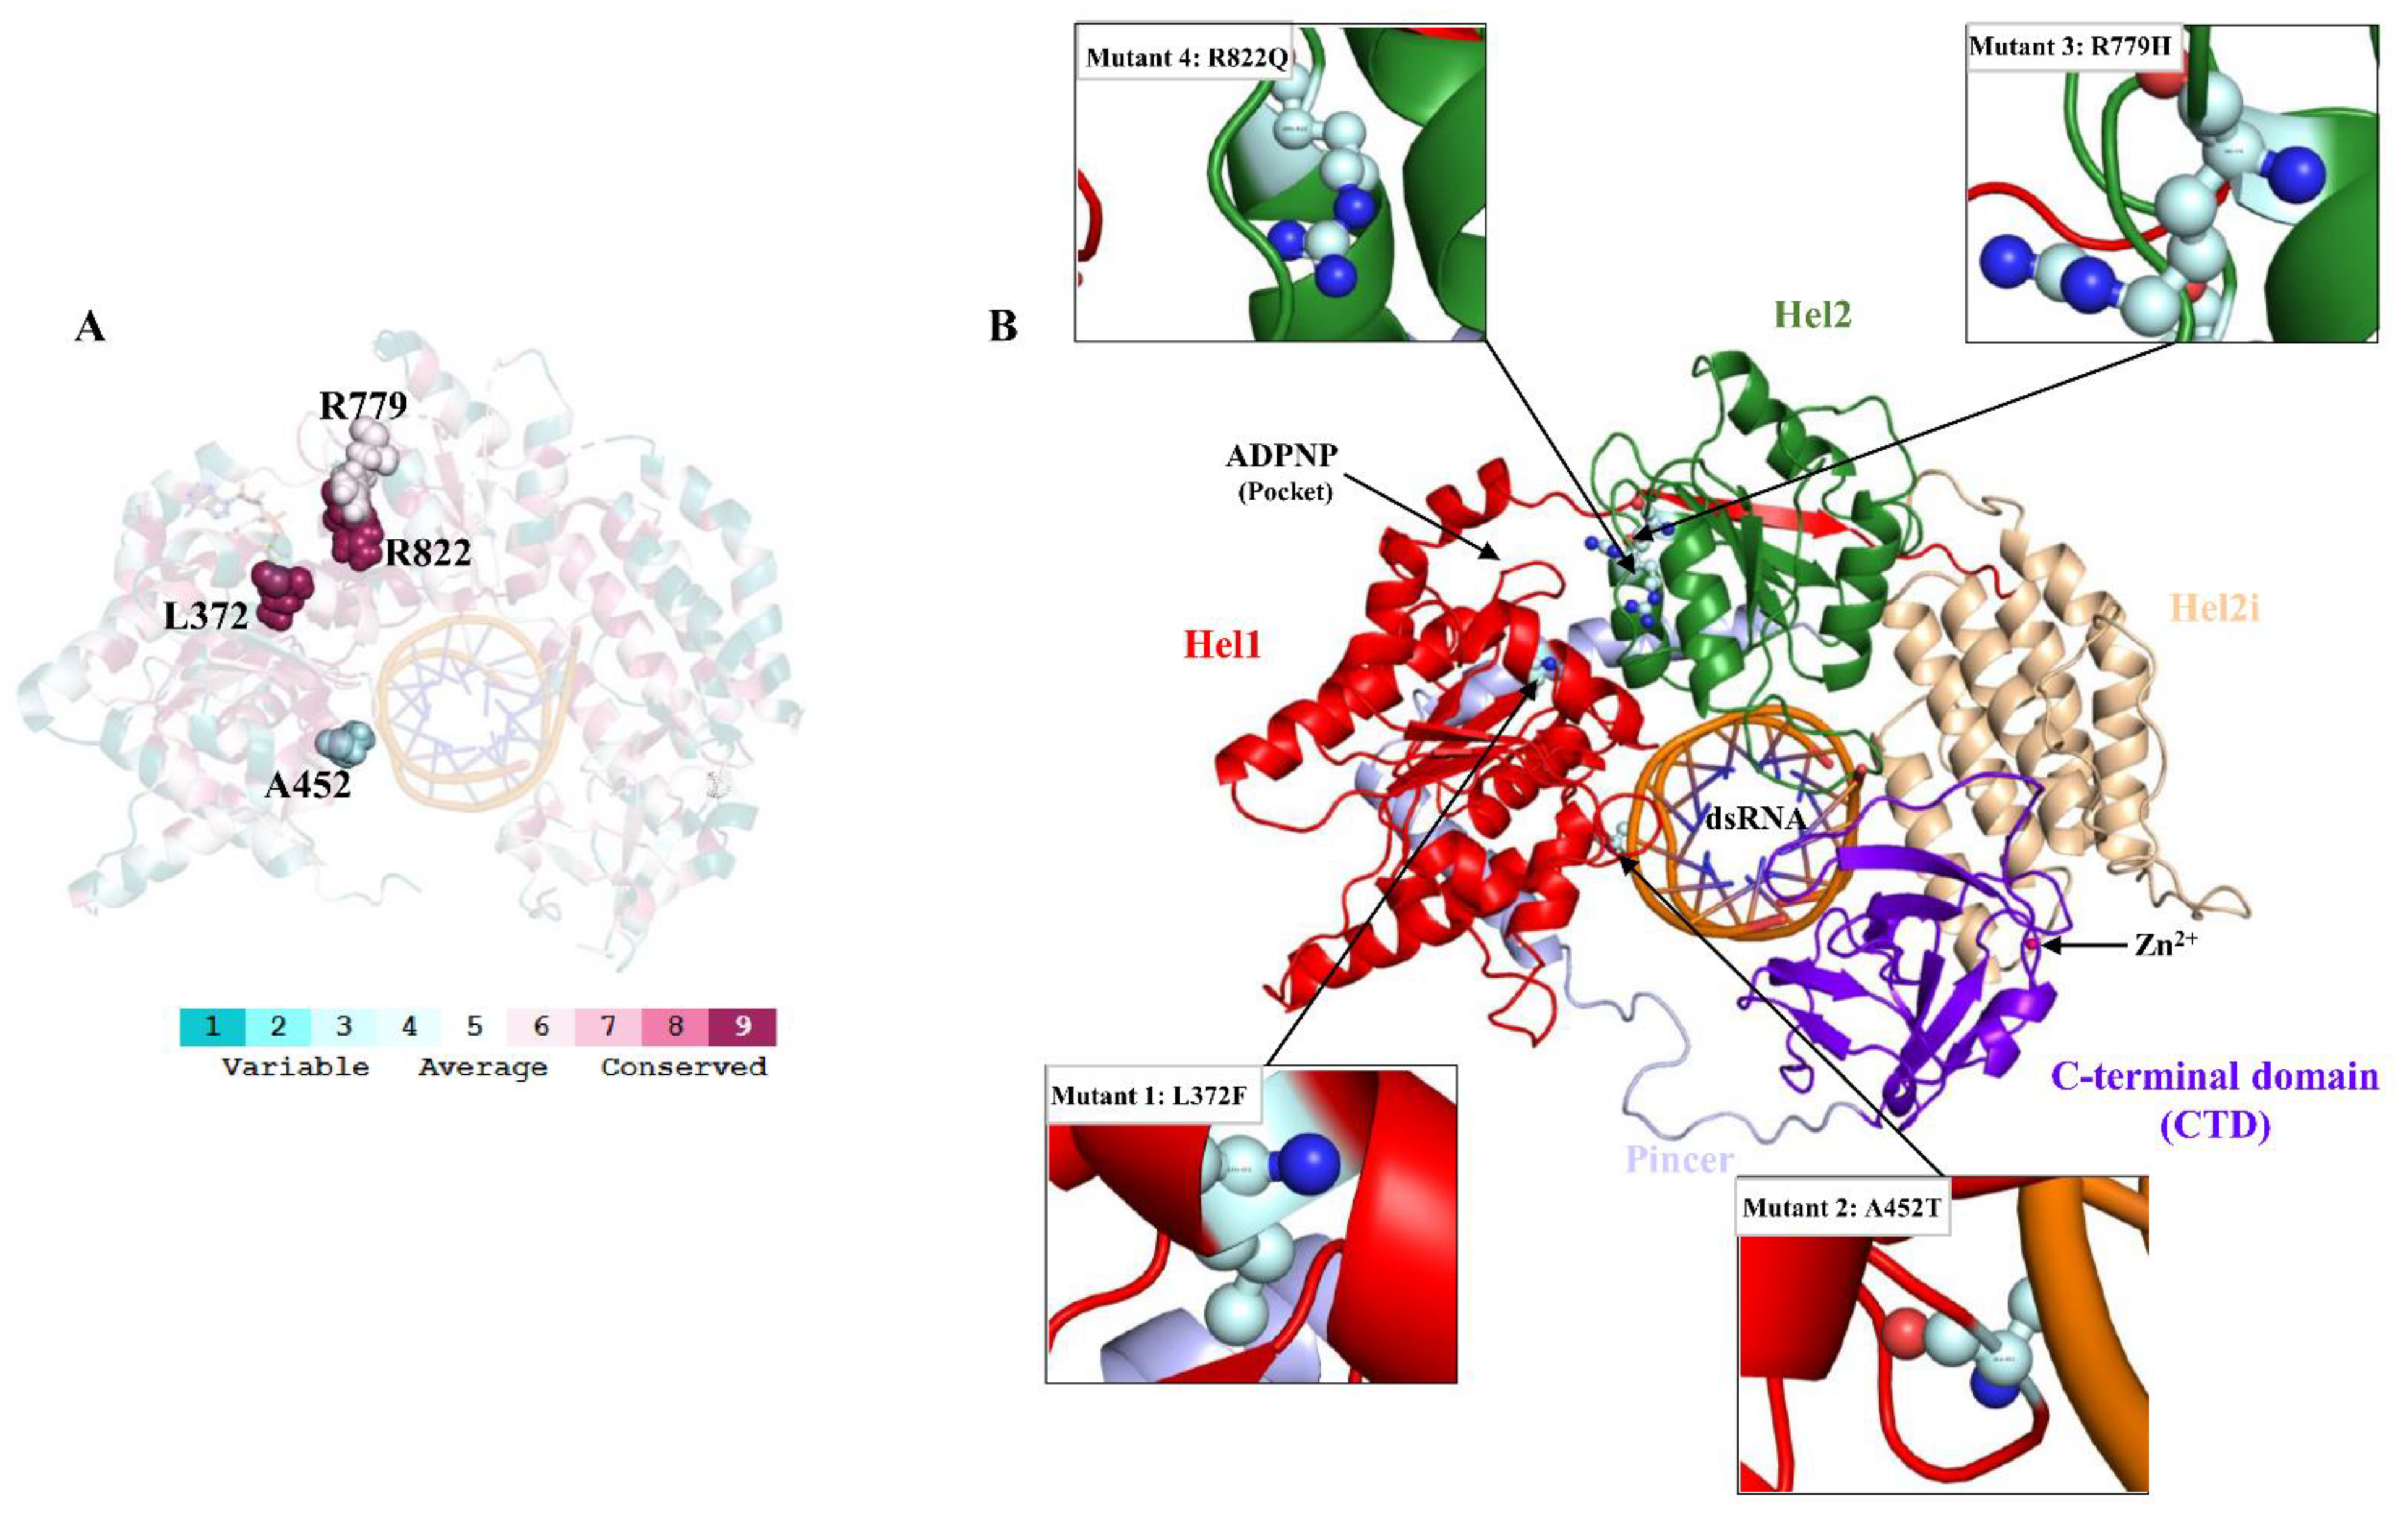
3.1. Conservation, Mutant Stability and Functional Analyses

The Consurf server analysis suggested that L372 and R822 are largely conserved with a scale of 9, R779 is moderately conserved with a scale of 6, and A452 is variably conserved with a scale of 3 (Figure 1A). These results indicate that L372, R779, and R822 may influence MDA5 function when substituted. Hence, the substitution of L372, A452, R779, and R822 with F, T, H, and Q are associated with AGS and Singleton–Merten syndrome [22,23,24]. We further explored the mutant stability and functional analyses using the I-Mutant 2.0 server. The modelled structures of MDA5L372F, MDA5A452T, MDA5R779H, and MDA5R822Q were submitted to the server and analyzed for DDG values; the values for these variants were −1.13, −0.83, −0.71, and −1.76, respectively. Structures with DDG values < 0 are predicted to be less stable when compared to the wild type, while structures with DDG values > 0 are predicted to be stable. All the structures had decreased stability when compared to the wild type; however, MDA5A452T and MDA5R779H were relatively stable when compared to the other two mutant complexes. Protein Variation Effect analysis of the mutated sequences yielded interesting results, where MDA5L372F, MDA5A452T, MDA5R779H, and MDA5R822Q scored 0.62, −0.825, −2.591 and −3.785, respectively. According to the server, values less than −2.5 are considered deleterious, whereas values greater than or equal to −2.5 are considered non-deleterious. Based on the data, both MDA5L372F and MDA5A452T mutants were considered functionally neutral, while mutant complexes MDA5R779H and MDA5R822Q were predicted to be deleterious.

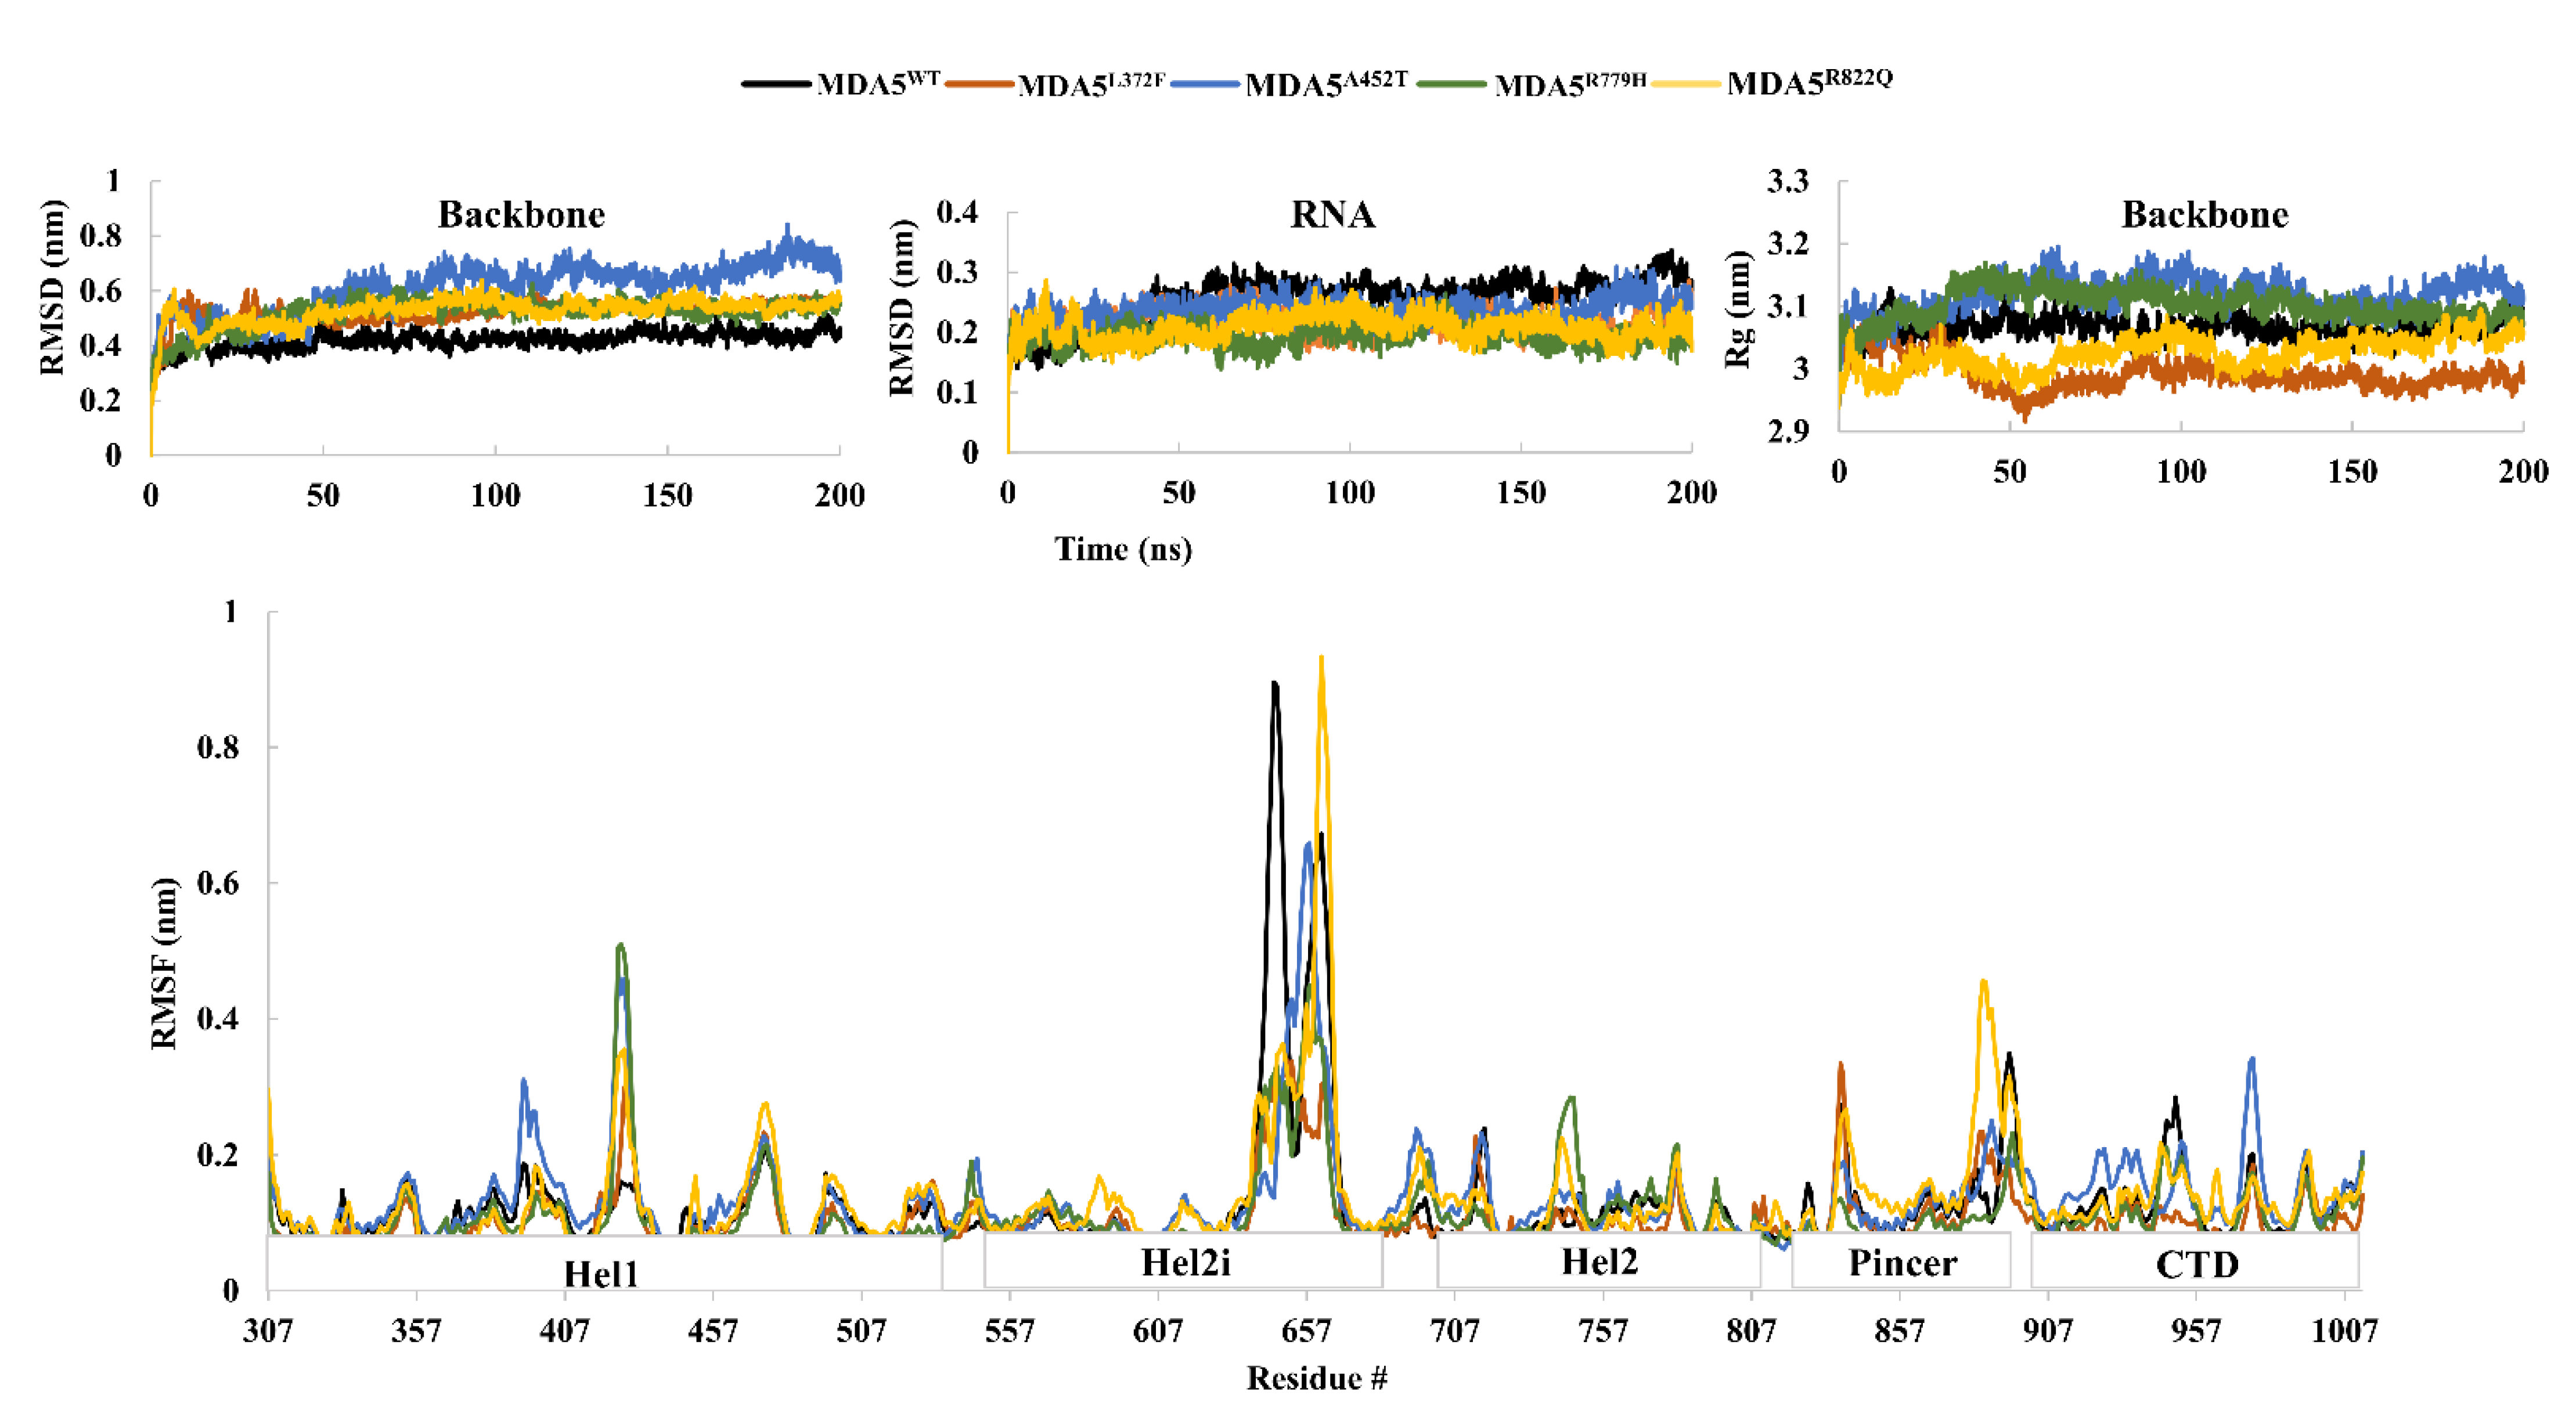
3.2. Structural Dynamics of Wild-Type and Mutant MDA5-dsRNA Bound Complexes

At first, we prepared the MDA5 wild-type and mutant complexes (Figure 1B) and subsequently subjected to MD simulations. From the MD trajectory of all the complexes, the root mean square deviation (RMSD) of the protein backbone suggested that the wild-type complex (MDA5WT) was stable after 50 ns simulations, in contrast to the mutant complexes. In particular, the RMSD of mutant MDA5A452T ranged from 0.5 to 0.8 nm throughout the simulation period, while other complexes showed less variation (Figure 2). The average RMSD values of MDA5WT, MDA5L372F, MDA5A452T, MDA5R779H, and MDA5R822Q were 0.4206 nm, 0.5222 nm, 0.6089 nm, 0.5186 nm, and 0.5255 nm, respectively. Moreover, we assessed the RMSD of dsRNA and found it to be highly stable during the simulation. The average RMSD values of the dsRNA complexed with MDA5WT, MDA5L372F, MDA5A452T, MDA5R779H, and MDA5R822Q were 0.2527 nm, 0.216 nm, 0.2357 nm, 0.1938 nm, and 0.2078 nm, respectively. The RMSD results indicated that both native and mutant complexes were stable during the simulations (Figure 2).
Further, we assessed the radius of gyration (Rg) for compactness in the folding of the complexes. The complexes MDA5WT, MDA5L372F, MDA5A452T, MDA5R779H, and MDA5R822Q had average Rg values of 3.0658 nm, 2.9921 nm, 3.1180 nm, 3.1015 nm, and 3.0246 nm, respectively (Figure 2). Mutant complexes MDA5A452T and MDA5R779H had higher Rg values than that of the wild type, and the remaining two mutant complexes had relatively less compacted folding. These results are consistent with the predictions by I-Mutant 2.0, where MDA5A452T and MDA5R779H were predicted to be stable. Previous reports have suggested that point mutations induce structural alterations that eventually affect the functional properties of a protein [40,41]. To further study the fluctuations with respect to residues in the MDA5 protein, we assessed the root mean square fluctuations (RMSF) for all complexes during the simulations. The largest fluctuations were observed at the C-terminal region of Hel2i in all the complexes. Apart from Hel2i, the region between the wild type and mutants in the central region of Hel1 also exhibited large variations. The other regions, such as the Pincer and C-terminal domains, were stable throughout the simulation. The solvent-accessible surface area (SASA) of the wild-type and mutated complexes was calculated using the gmx sasa GROMACS tool to determine whether there was any reduction in solvent accessibility to different domains (Figure S1). The SASA values for MDA5WT, MDA5L372F, MDA5A452T, MDA5R779H, and MDA5R822Q were 385 nm2, 377 nm2, 384 nm2, 383 nm2, and 383 nm2, respectively. Although other complexes had similar SASA values, MDA5L372F showed both reduced SASA and Rg values. This might be due to the substitution of leucine with phenylalanine, a bulkier group, thereby leading to either a pi-alkyl bond between F372 and L368 or a pi-pi interaction between F372 and F377. In addition, L372 is located adjacent to the ATP binding pocket of MDA5, and substitution at this position might inhibit the hydrolysis of ATP. The analyses also further indicated that there were structural variations among the mutant complexes, in contrast to the wild type.

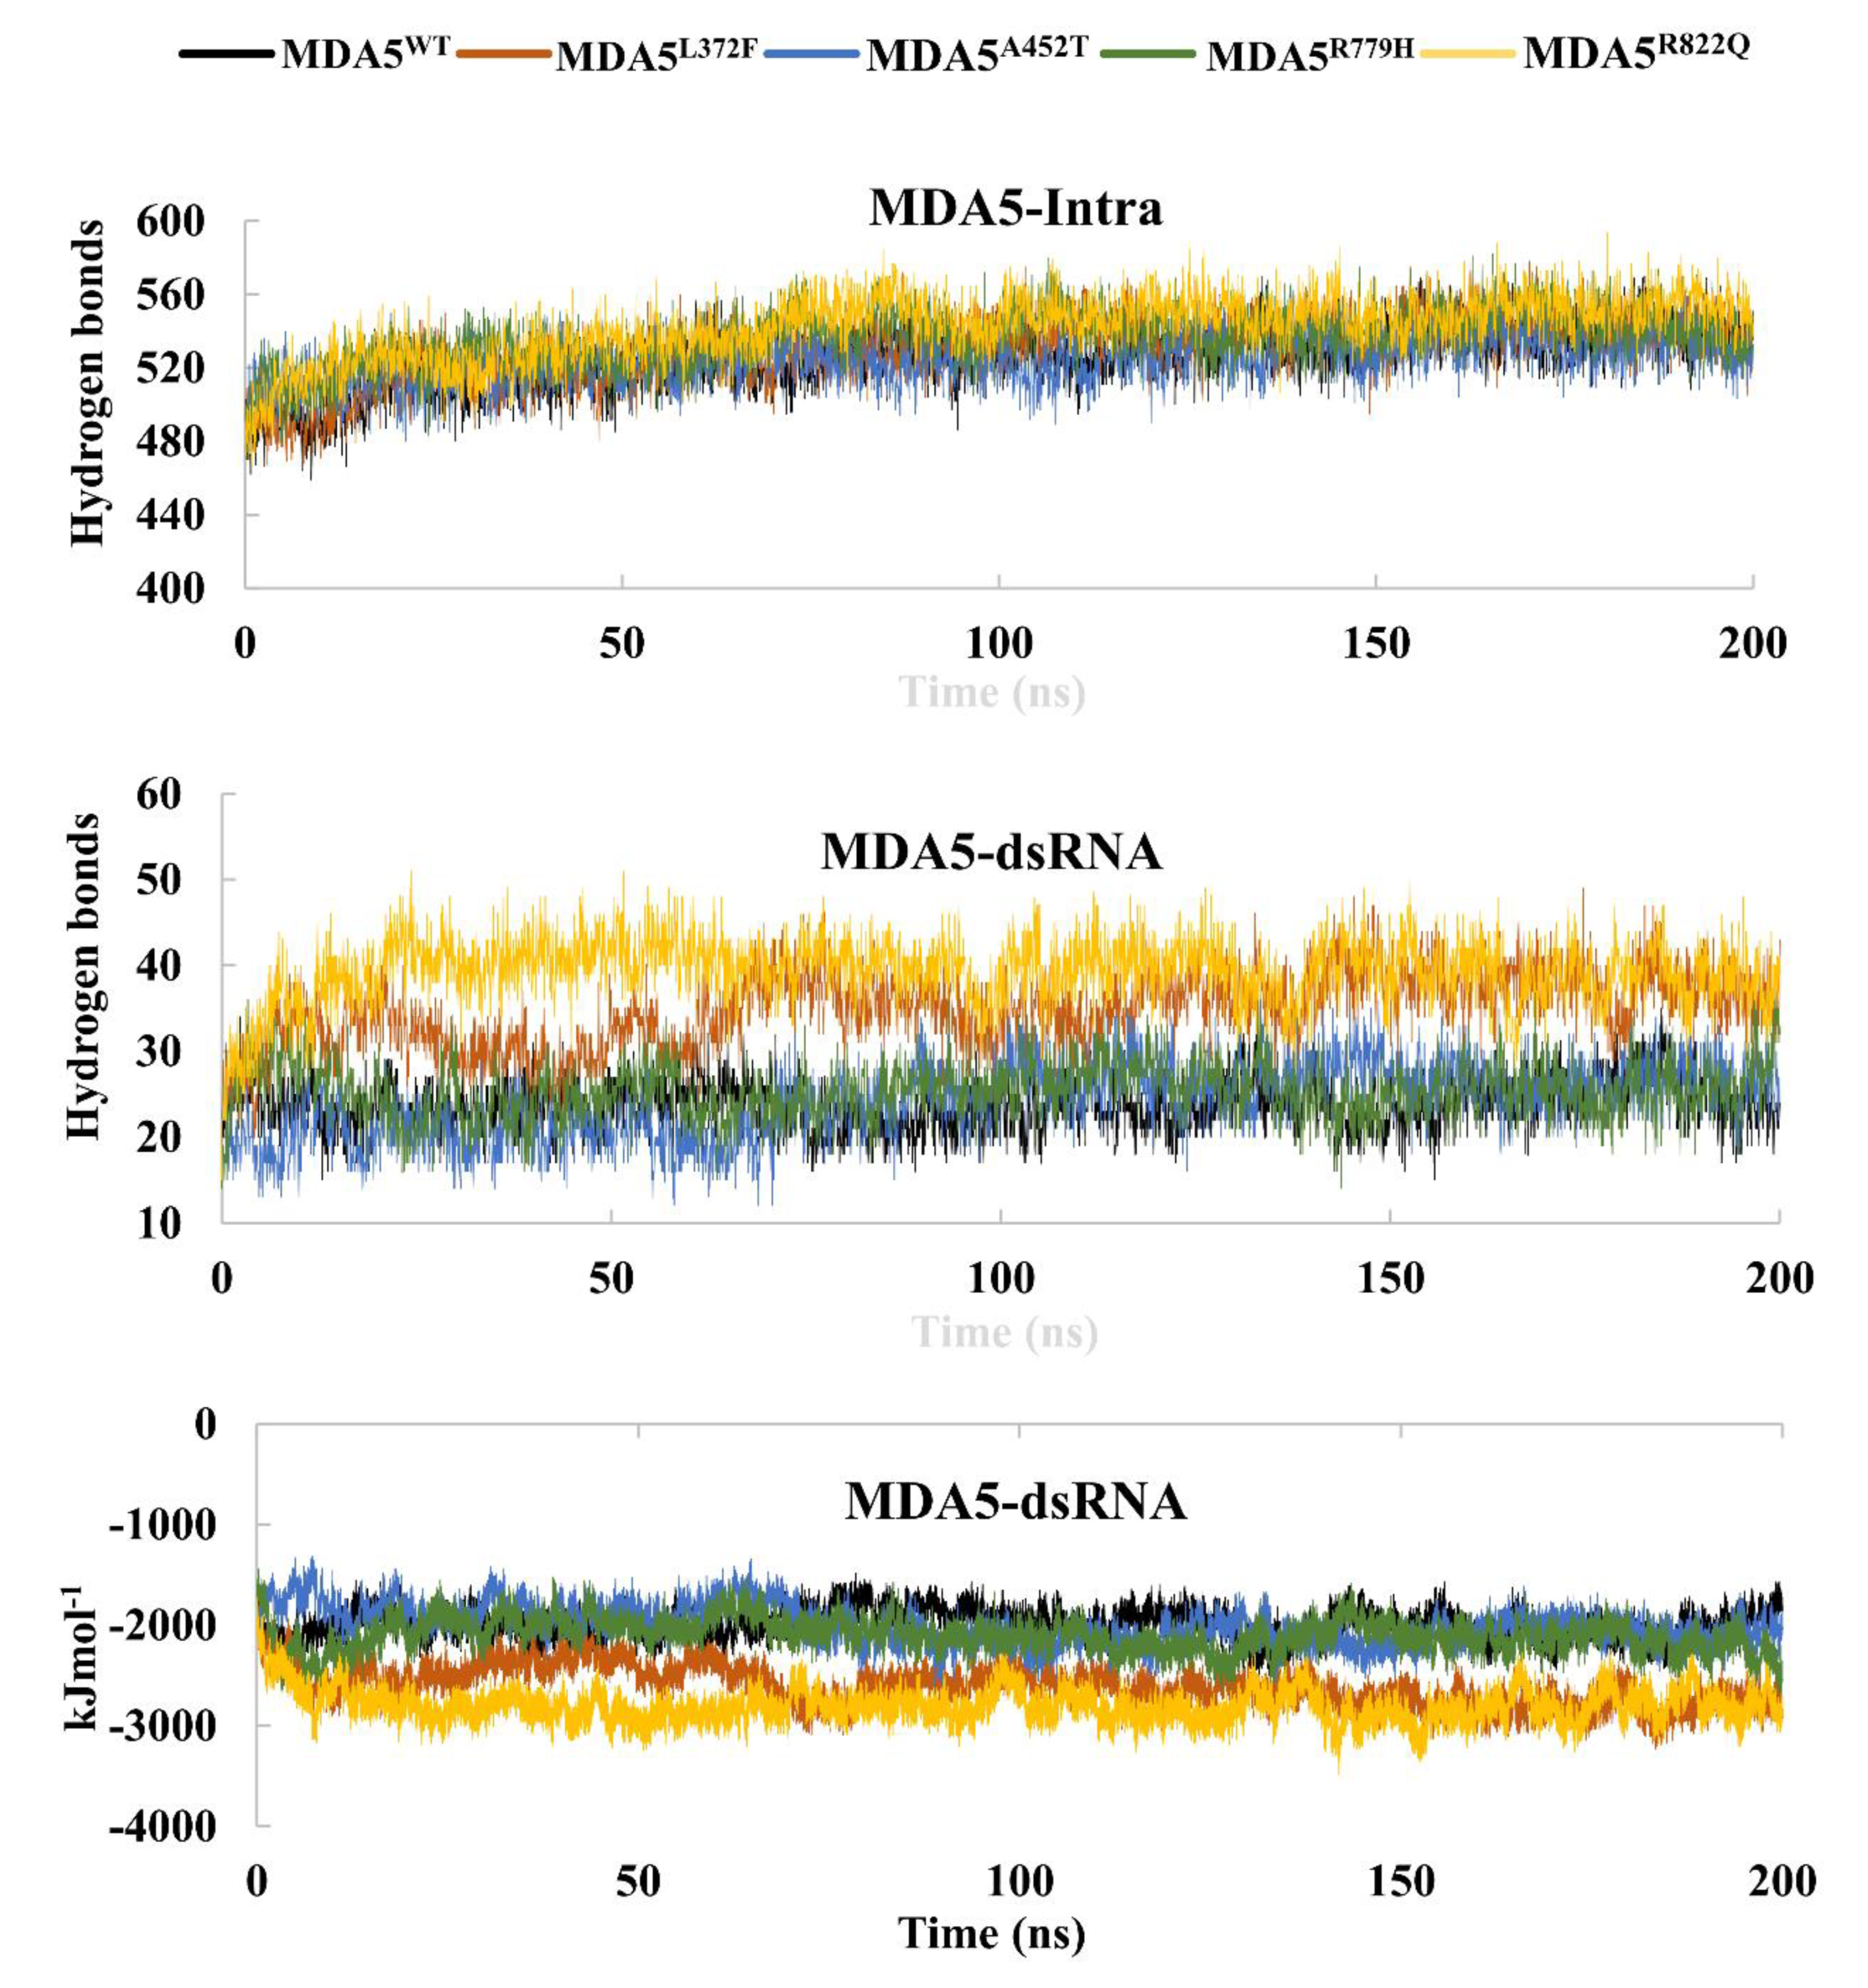
3.3. Hydrogen Bonds and Interaction Energies

Hydrogen bonds play a crucial role in understanding the binding affinity of RNA towards MDA5. Hence, we used the gmx hbond GROMACS tool to assess the hydrogen bond interactions between dsRNA and MDA5 for all complexes during the simulations. We observed an average of 25 hydrogen bonds in the wild-type complex, whereas in mutant complexes, hydrogen bonds slightly increased during the simulations. In particular, MDA5L372F and MDA5R822Q showed an average of 35 hydrogen bonds between dsRNA and protein (Figure 3). Intra-hydrogen bonds for the proteins were also evaluated to determine whether there were any structural interferences in terms of hydrogen bonds. The wild type had 525 intra H-bonds, whereas the mutated complexes MDA5L372F, MDA5A452T, MDA5R779H, and MDA5R822Q had 529, 524, 536, and 541 hydrogen bonds, respectively. MDA5R779H and MDA5R822Q had more intra-hydrogen bonds than the other mutated complexes. This might be the reason for their stable RMSD, Rg, and SASA values, where the increased intra-hydrogen bonds stabilized the mutated complexes. Further, we performed interaction energy analysis using the re-run option in Gromacs and determined that the wild type exhibited less interaction energy than that exhibited by the mutants (Figure 3). The analyses indicated higher binding affinities between dsRNA and MDA5 variants than that between dsRNA and MDA5 wild-type. Interaction energy was calculated as the sum of the Coloumb-SR and Lennard Jones-SR. For the MDA5 complexes, interaction energies were −1997 kJ/mol, −2612 kJ/mol, −2003 kJ/mol, −2102 kJ/mol, and −2803 kJ/mol for MDA5WT, MDA5L372F, MDA5A452T, MDA5R779H, and MDA5R822Q, respectively. The overall summary of the trajectories analysis of MDA5WT, MDA5L372F, MDA5A452T, MDA5R779H, and MDA5R822Q is given in Table 1. These results suggest that MDA5 variants may induce structural alterations, thereby leading to a gain of function as reported previously.

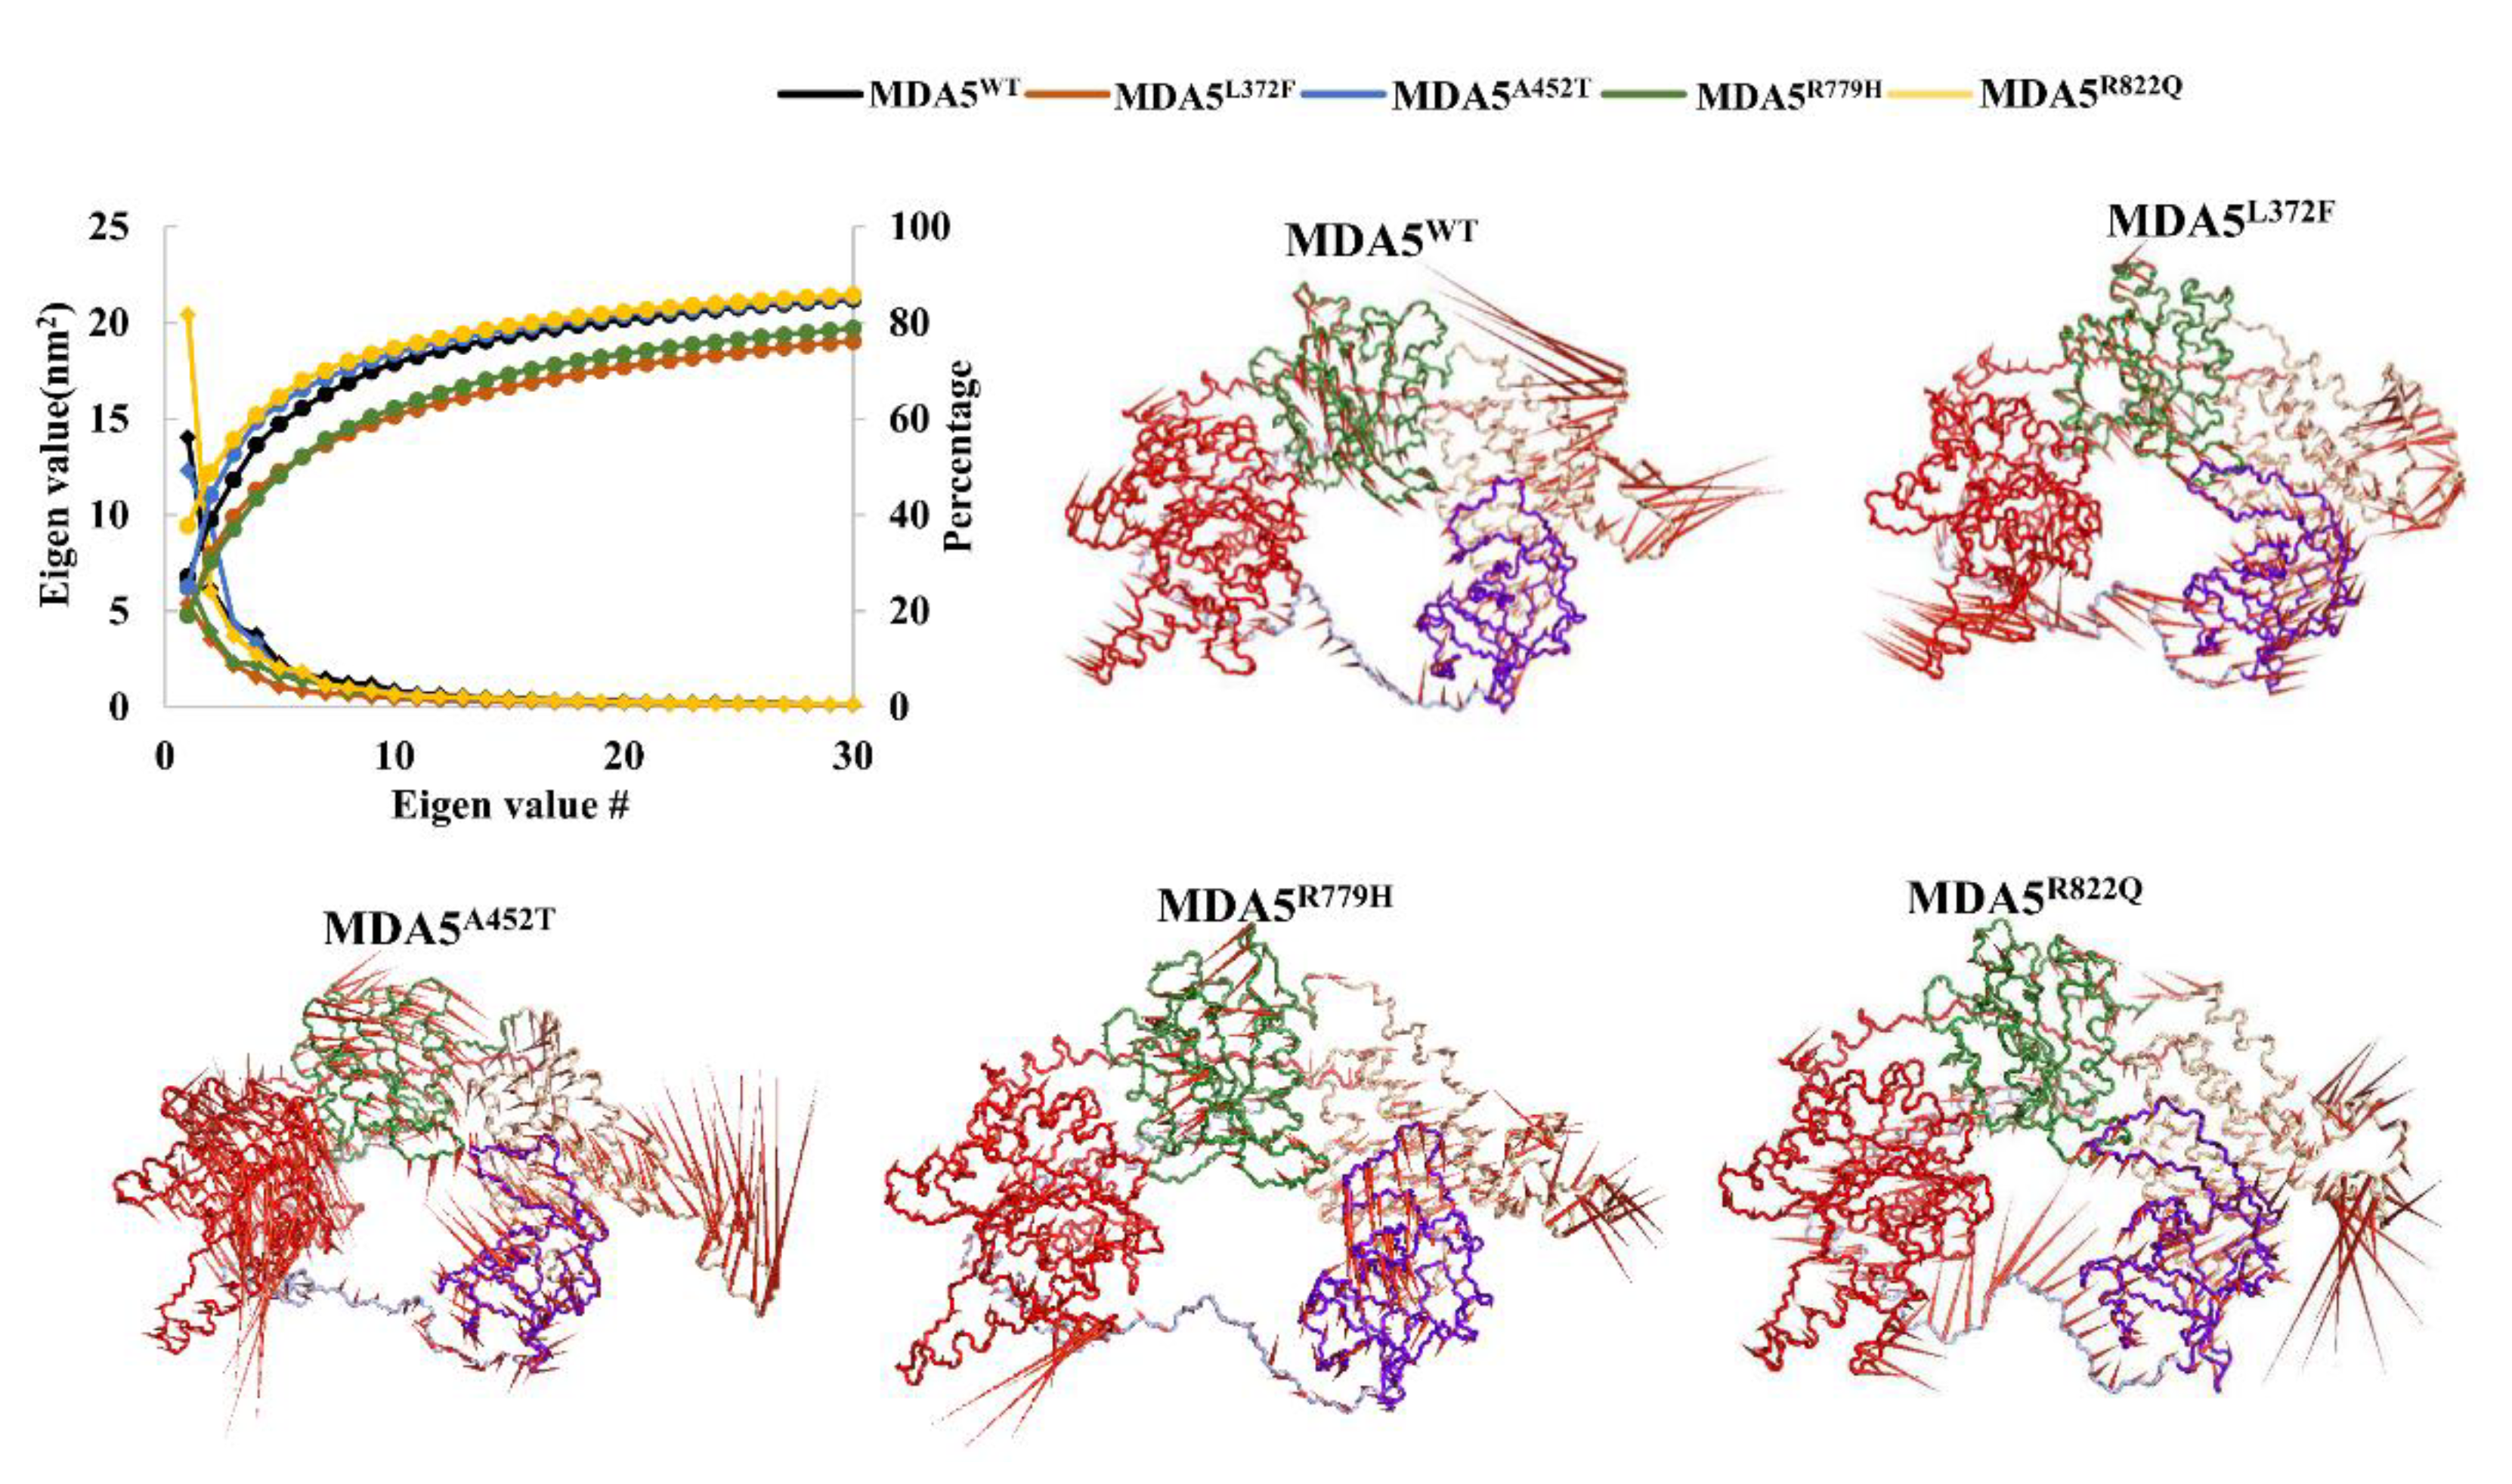
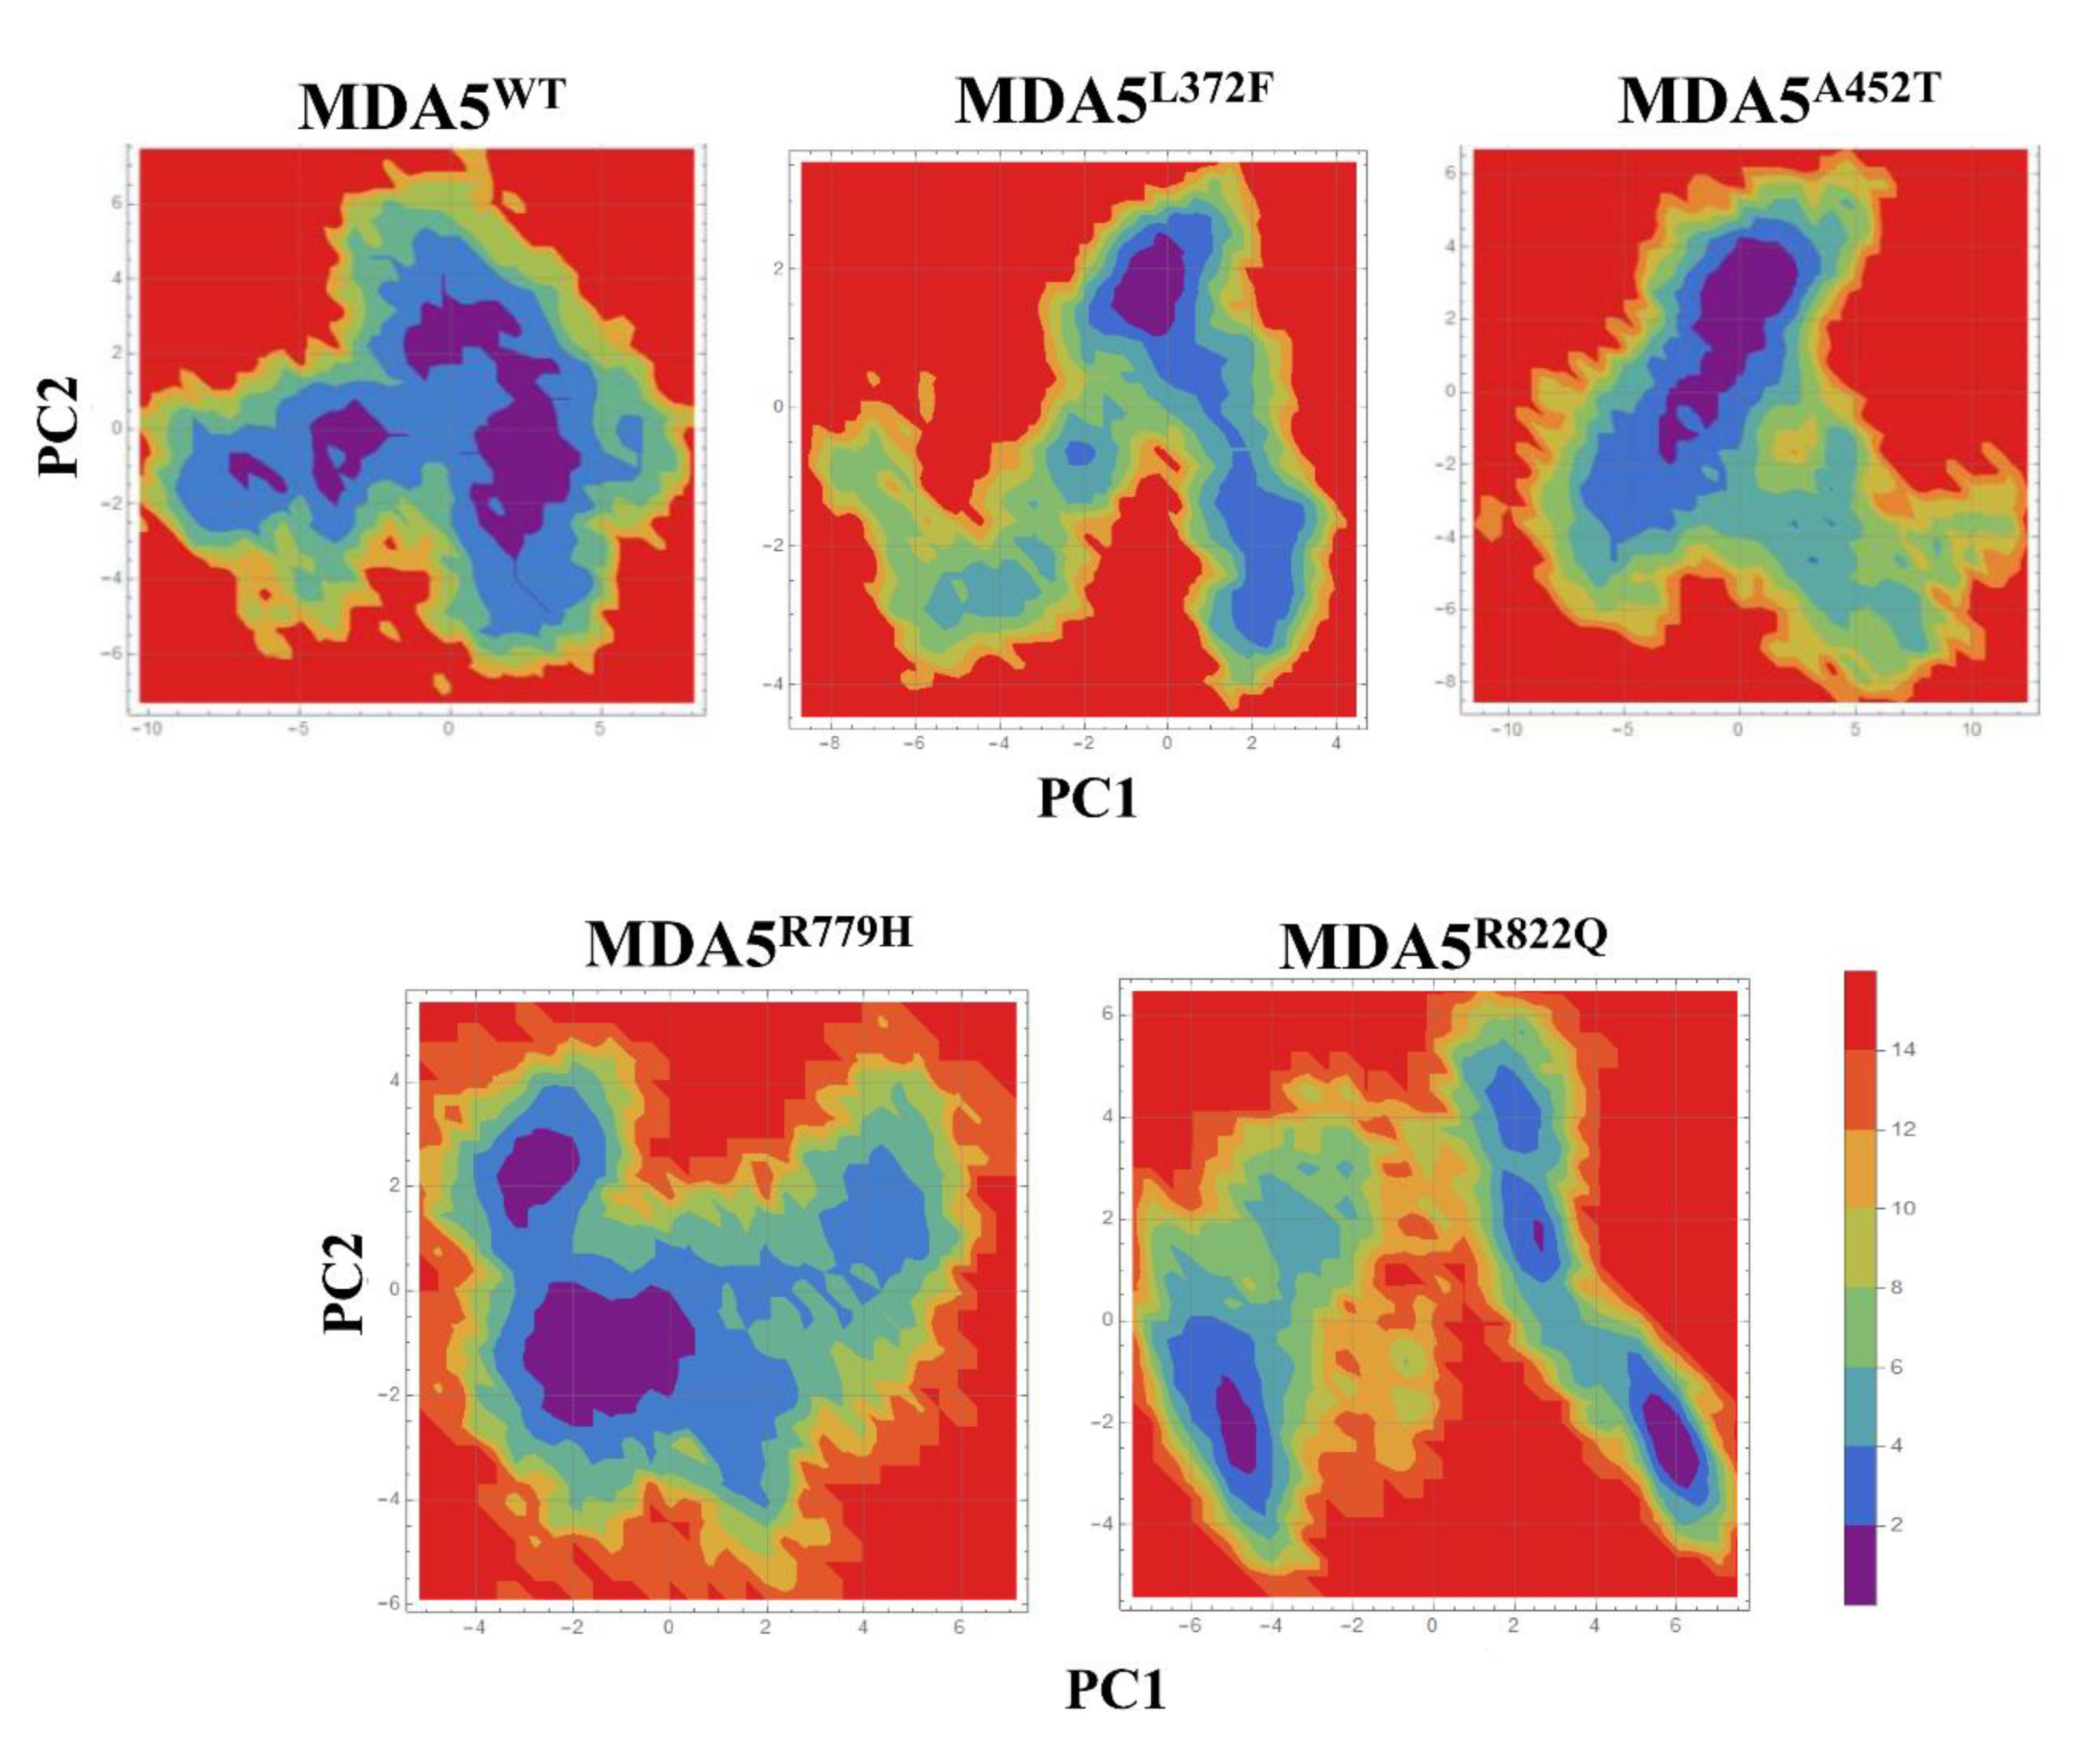
3.4. Principal Component Analysis

To understand the global motions during simulations and the intrinsic dynamics of the complex, we performed PCA on the MDA5 wild type and mutants. The simulation trajectories suggested that the first 30 PCs greatly contributed to the collective motions of the proteins. Moreover, the largest motions were observed in the first three PCs, with cumulative percentages of 60%, 50%, 65%, 45%, and 65% for MDA5WT, MDA5L372F, MDA5A452T, MDA5R779H, and MDA5R822Q, respectively (Figure 4). The projections for PC1 and PC2, PC2 and PC3, and PC1 and PC3 are shown in Figure S2. The projections for PC1 and PC2 showed that all the complexes were largely spread in the phase with small energy barriers, except for MDA5R822Q and MDA5A452T. However, for the PC2 and PC3 projections, a similar spread in the phase space was observed, which strongly indicated less global motion. Again, the projections for PC1 and PC3 revealed a similar spread with a small energy barrier (Figure S2). To understand the local motion in the complexes, we constructed porcupine plots for PC1 using a filter option for all trajectories with 50 frames. We observed that the variations were restricted mainly to the Hel1, Hel2i, and Pincer regions of the mutants, in contrast to the wild type (Figure 4). Furthermore, FEL analysis with PC1 against PC2 strongly suggested the presence of a transition occurring during the simulations with small energy barriers. In particular, MDA5WT showed three clusters in a basin, whereas the mutants did not exhibit large transitions, except for MDA5R779H and MDA5R822Q (Figure 5). These two mutants (MDA5R779H and MDA5R822Q) exhibited large transitions, thereby indicating the possibility of large structural alterations in these complexes. These findings suggest that global motions were compromised upon the substitution of the conserved residues.

3.5. RNA Interactions with MDA5

We extracted representative structures based on the FEL for each complex. The hydrogen bond interactions between the RNA and protein were analyzed, and we found that the dsRNA interacts with the protein through its phosphate or base group (Table 2). However, the number of contacts was higher between the dsRNA and mutant complexes than between the dsRNA and wild-type MDA5. This strongly suggested the possibility of a higher binding affinity in mutant complexes than in wild-type MDA5.

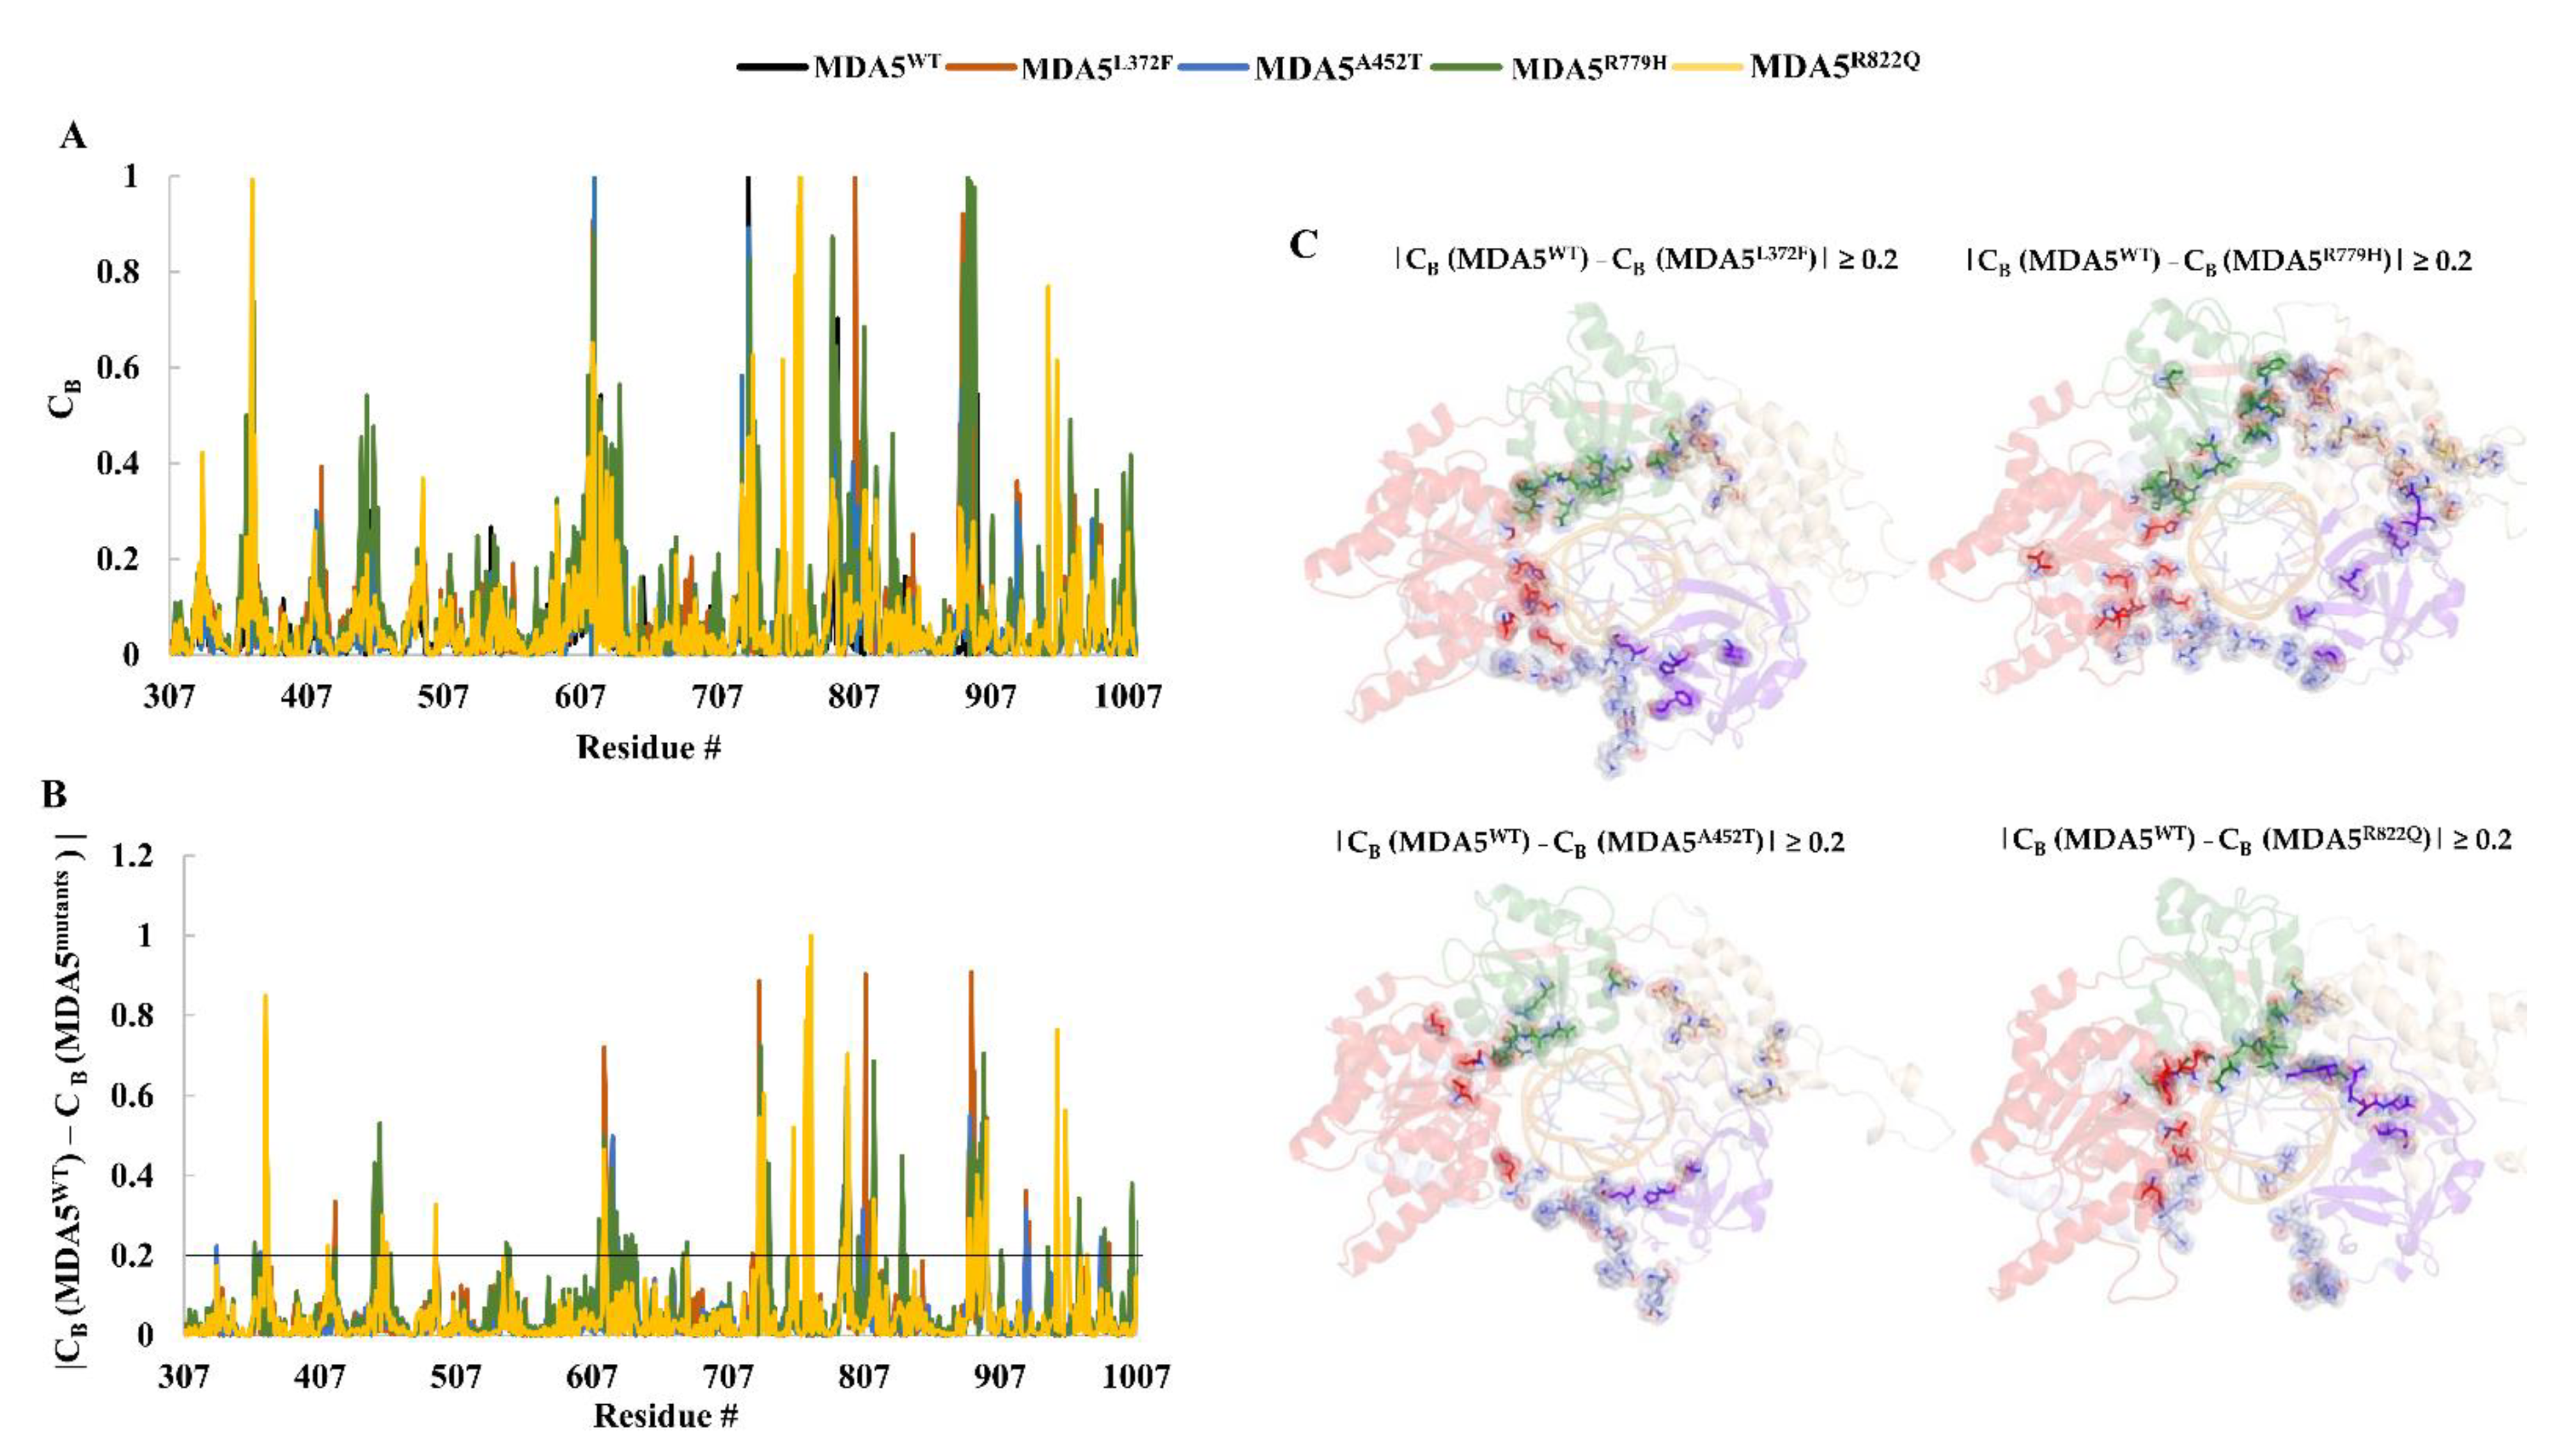
3.6. Residue Network Analysis

We performed residue network analysis, and the results showed crucial structural rearrangements in mutants in contrast to the wild-type protein. We used the NAPS webserver and constructed a residue-to-residue network with a cut-off distance of 0.7 nm. The CB (betweenness centrality) was also computed, as it is important to understand intramolecular signaling flow. The study used these conditions, which showed the variation between the wild type and mutant, thereby presenting insights into the variations in mutants. A high CB value node is typically associated with the function of the complex. Considering this, we calculated the CB for all the complexes (Figure 6), further, we analyzed the CB difference (CBd) between MDA5 wild-type and mutants, using the condition |CB (MDA5WT) − CB (MDA5mutants)| ≥ 0.2 and mapped the respective residues on the structure to understand the difference between the wild type and mutated complexes. We observed the similar distribution of crucial residues among the mutant complexes and they shared approximately 50% of the residues. This result suggests that the intra residue signaling varies in the MDA5 mutant complexes compared to the MDA5 wild-type, thereby influencing the functional mechanism. (Figure 6 and Table 3). Notably, the residues around the central region of the MDA5 accommodating the dsRNA may play a crucial role in conformational changes in the mutants. However, these residues require further investigation. The variations in CB indicate how point mutations can induce allosteric changes in the protein.

4. Discussion

AGS and Singleton–Merten syndrome are two genetic disorders characterized by several physical defects. These disorders are caused by a single nucleotide polymorphism in the IFIH1 , which codes for MDA5. MDA5 is a crucial PRR that is involved in innate immunity by recognizing viral RNA. The variants of MDA5 are associated with several diseases in human. In particular, L372F, A452T, R779H and R822Q have been associated with AGS and Singleton–Merten syndrome and recent studies have suggested that these variants result in gain of function, thereby leading to the disease [22,23,24]. A recent report on cryo-EM structures solved for MDA5 filaments showed that mutations of the filament-forming residues can alter the function [25]. In addition, the chicken MDA5 dimer structure (2MDA5 and one dsRNA) suggested Head-Head configuration upon binding to short/long dsRNA, thereby forming a filament [26]. Several computational studies have previously reported the use of molecular dynamics’ simulations to understand the dynamic nature as well as the structure–function relationship of the proteins and ligand bound complexes [38,40,41,42,43,44]. Hence, in order to understand the reason behind the gain of function associated with MDA5 variants, we performed long-range simulations to identify the structural changes that may influence the functional properties of MDA5 in this study. Five different systems were selected for the study: MDA5WT, MDA5L372F, MDA5A452T, MDA5R779H, and MDA5R822Q.
We mainly used traditional analyses such as RMSD, Rg, RMSF, and hydrogen bond analysis, which altogether suggest that structural variations occur upon mutation in MDA5. From stability and functional analyses using web servers, it was predicted that MDA5L372F, MDA5A452T, MDA5R779H, and MDA5R822Q were relatively less stable than the wild type, and MDA5R779H and MDA5R822Q were predicted to be deleterious. Although the RMSD values of the backbone of the complexes were higher than that of the wild type, the RMSDs of dsRNA chains were stable throughout the simulation. Rg analysis showed the structural compactness of the complexes, especially MDA5L372F. The MDA5L372F SASA values were also reduced, corroborating the Rg analysis, which might be due to the pi-alkyl or pi-pi interaction of the substituted phenylalanine residue. In addition, MDA5R822Q displayed increased stability in terms of RMSD, Rg, SASA, and intra-hydrogen bonds compared to the other complexes. Therefore, we hypothesize that residue substitution might provide adequate stability for the MDA5 protein to gain function. The MDA5A452T complex had the highest relative instability with respect to the RMSD of the backbone, increased Rg, and increased SASA values. Interestingly, when the interaction energies were analyzed, the mutated complexes had higher interaction energies than that of MDA5WT in the following order: MDA5R822Q > MDA5L372F > MDA5R779H > MDA5A452T. These results corroborated another trajectory analysis showing that the MDA5 mutated complexes were more stable than the wild type. Further, the variation in the dominant motions of MDA5 wild-type and mutant complexes suggest that large structural modifications occur to alter the intrinsic dynamics within the complexes (Figure 4) In addition, the betweenness centrality (CB) indicates the distribution of crucial residues in the complexes; in particular, CB differences between MDA5 wild-type and mutants suggest the similar distribution of functionally important residues within the complexes (Figure 6 and Table 3). Observed shared residues (~50%) among the mutant complexes in crucial domains of MDA5 indicate that these domains may undergo conformational changes, and also suggest the impact on the stability between dsRNA and MDA5. As a result, these mutations may lead to the syndromes through gain of function. MDA5 forms a long filament complex upon binding to dsRNA and subsequently undergoes RNA-dependent ATP hydrolyzation; hence, it is necessary to perform microsecond simulations along with the ATP-bound state. Although our study is limited to 200 ns simulations, our findings may help deepen the understanding of the mechanistic properties of wild-type and mutant MDA5 upon binding to dsRNA, as well as provide information for basic research on the impact of MDA5 variants that are involved in several diseases This study also provides insights into the general thought that point mutations induce conformational changes that might regulate the function of a protein.

5. Conclusions

MDA5 is an important PRR coded by IFIH1, and the variants of MDA5 studied in this work has been previously reported to result in gain of function. The gain of function from the MDA5 variants leads to diseases such as Singleton–Merten syndrome and Aicardi–Goutières syndrome in humans. Therapeutics for these syndromes may be defined and designed if the molecular properties and dynamic nature of dsRNA-bound MDA5 mutant complexes are well understood. Therefore, to decipher the conformational changes that occur upon mutations of MDA5, we simulated and analyzed the trajectories of wild-type and four mutated dsRNA-bound MDA5 complexes. The all-atom MD simulation of MDA5 wild-type and mutated complexes (MDA5L372F, MDA5A452T, MDA5R779H, and MDA5R822Q) revealed increased stability of the mutated complexes when compared to MDA5 wild-type. The hydrogen bond interactions between MDA5 and the dsRNA were also higher in the mutant complexes than the MDA5WT. The varied global motions in wild-type and mutant complexes suggest that point mutations induced certain conformational changes. In addition, the betweenness centrality of the residue networks suggested the crucial residues that might be responsible for the functional variation in the MDA5 mutant complexes compared to wild-type. From these results, we assume that MDA5 variants induce specific structural changes in order to increase the dsRNA-MDA5 binding affinity, which may lead to further signaling and associated diseases.

Supplementary Materials

The following are available online at https://www.mdpi.com/article/10.3390/biom11081251/s1, Figure S1: Solvent accessible surface area, Figure S2: Projection of principal components on to the phase space.

Author Contributions

Conceptualization, V.G.; formal analysis, V.G.; investigation, V.G. and S.S.; supervision, H.-K.L. and D.S.; Writing—original draft, V.G. and S.S.; Writing—review and editing, V.G., P.S., H.-K.L. and D.S. All authors have read and agreed to the published version of the manuscript.

Funding

This research was funded by the National Research Foundation of Korea, grant numbers NRF-2018R1C1B6008141 and NRF-2017R1C1B3007144.

Institutional Review Board Statement

Not Applicable.

Informed Consent Statement

Not Applicable.

Data Availability Statement

The raw data supporting the conclusions of this study are available on request from the corresponding author. The data are not publicly available due to larger in size.

Acknowledgments

The authors would like to thank the two anonymous reviewers for their constructive comments and suggestions of the manuscript.

Conflicts of Interest

The authors declare no conflict of interest.

References

  1. Brubaker, S.W.; Bonham, K.S.; Zanoni, I.; Kagan, J.C. Innate immune pattern recognition: A cell biological perspective. Annu. Rev. Immunol. 2015, 33, 257–290. [Google Scholar] [CrossRef] [PubMed] [Green Version]
  2. Takeuchi, O.; Akira, S. Pattern recognition receptors and inflammation. Cell 2010, 140, 805–820. [Google Scholar] [CrossRef] [Green Version]
  3. Loo, Y.M.; Gale, M., Jr. Immune signaling by RIG-I-like receptors. Immunity 2011, 34, 680–692. [Google Scholar] [CrossRef] [Green Version]
  4. Rehwinkel, J.; Gack, M.U. RIG-I-like receptors: Their regulation and roles in RNA sensing. Nat. Rev. Immunol. 2020, 20, 537–551. [Google Scholar] [CrossRef]
  5. Kawai, T.; Akira, S. Innate immune recognition of viral infection. Nat. Immunol. 2006, 7, 131–137. [Google Scholar] [CrossRef] [PubMed]
  6. Singh, M.; Brahma, B.; Maharana, J.; Patra, M.C.; Kumar, S.; Mishra, P.; Saini, M.; De, B.C.; Mahanty, S.; Datta, T.K.; et al. Insight into buffalo (Bubalus bubalis) RIG1 and MDA5 receptors: A comparative study on dsRNA recognition and in-vitro antiviral response. PLoS ONE 2014, 9, e89788. [Google Scholar] [CrossRef] [Green Version]
  7. Brisse, M.; Ly, H. Comparative Structure and Function Analysis of the RIG-I-Like Receptors: RIG-I and MDA5. Front. Immunol. 2019, 10, 1586. [Google Scholar] [CrossRef] [PubMed]
  8. Wu, B.; Peisley, A.; Richards, C.; Yao, H.; Zeng, X.; Lin, C.; Chu, F.; Walz, T.; Hur, S. Structural basis for dsRNA recognition, filament formation, and antiviral signal activation by MDA5. Cell 2013, 152, 276–289. [Google Scholar] [CrossRef] [Green Version]
  9. Takahasi, K.; Kumeta, H.; Tsuduki, N.; Narita, R.; Shigemoto, T.; Hirai, R.; Yoneyama, M.; Horiuchi, M.; Ogura, K.; Fujita, T.; et al. Solution structures of cytosolic RNA sensor MDA5 and LGP2 C-terminal domains: Identification of the RNA recognition loop in RIG-I-like receptors. J. Biol. Chem. 2009, 284, 17465–17474. [Google Scholar] [CrossRef] [PubMed] [Green Version]
  10. Cui, S.; Eisenächer, K.; Kirchhofer, A.; Brzózka, K.; Lammens, A.; Lammens, K.; Fujita, T.; Conzelmann, K.K.; Krug, A.; Hopfner, K.P. The C-terminal regulatory domain is the RNA 5’-triphosphate sensor of RIG-I. Mol. Cell 2008, 29, 169–179. [Google Scholar] [CrossRef] [PubMed] [Green Version]
  11. Peisley, A.; Lin, C.; Wu, B.; Orme-Johnson, M.; Liu, M.; Walz, T.; Hur, S. Cooperative assembly and dynamic disassembly of MDA5 filaments for viral dsRNA recognition. Proc. Natl. Acad. Sci. USA 2011, 108, 21010–21015. [Google Scholar] [CrossRef] [PubMed] [Green Version]
  12. Dias Junior, A.G.; Sampaio, N.G.; Rehwinkel, J. A Balancing Act: MDA5 in Antiviral Immunity and Autoinflammation. Trends Microbiol. 2019, 27, 75–85. [Google Scholar] [CrossRef] [PubMed] [Green Version]
  13. Roulois, D.; Loo Yau, H.; Singhania, R.; Wang, Y.; Danesh, A.; Shen, S.Y.; Han, H.; Liang, G.; Jones, P.A.; Pugh, T.J.; et al. DNA-Demethylating Agents Target Colorectal Cancer Cells by Inducing Viral Mimicry by Endogenous Transcripts. Cell 2015, 162, 961–973. [Google Scholar] [CrossRef] [Green Version]
  14. Chiappinelli, K.B.; Strissel, P.L.; Desrichard, A.; Li, H.; Henke, C.; Akman, B.; Hein, A.; Rote, N.S.; Cope, L.M.; Snyder, A.; et al. Inhibiting DNA Methylation Causes an Interferon Response in Cancer via dsRNA Including Endogenous Retroviruses. Cell 2015, 162, 974–986. [Google Scholar] [CrossRef] [Green Version]
  15. Lin, Y.-T.; Verma, A.; Hodgkinson, C.P. Toll-like receptors and human disease: Lessons from single nucleotide polymorphisms. Curr. Genom. 2012, 13, 633–645. [Google Scholar] [CrossRef] [Green Version]
  16. Han, M.X.; Ding, C.; Kyung, H.M. Genetic polymorphisms in pattern recognition receptors and risk of periodontitis: Evidence based on 12,793 subjects. Hum. Immunol. 2015, 76, 496–504. [Google Scholar] [CrossRef]
  17. Smyth, D.J.; Cooper, J.D.; Bailey, R.; Field, S.; Burren, O.; Smink, L.J.; Guja, C.; Ionescu-Tirgoviste, C.; Widmer, B.; Dunger, D.B.; et al. A genome-wide association study of nonsynonymous SNPs identifies a type 1 diabetes locus in the interferon-induced helicase (IFIH1) region. Nat. Genet. 2006, 38, 617–619. [Google Scholar] [CrossRef]
  18. Jin, Y.; Birlea, S.A.; Fain, P.R.; Ferrara, T.M.; Ben, S.; Riccardi, S.L.; Cole, J.B.; Gowan, K.; Holland, P.J.; Bennett, D.C.; et al. Genome-wide association analyses identify 13 new susceptibility loci for generalized vitiligo. Nat. Genet. 2012, 44, 676–680. [Google Scholar] [CrossRef]
  19. Cunninghame Graham, D.S.; Morris, D.L.; Bhangale, T.R.; Criswell, L.A.; Syvanen, A.C.; Ronnblom, L.; Behrens, T.W.; Graham, R.R.; Vyse, T.J. Association of NCF2, IKZF1, IRF8, IFIH1, and TYK2 with systemic lupus erythematosus. PLoS Genet. 2011, 7, e1002341. [Google Scholar] [CrossRef] [PubMed]
  20. Sheng, Y.; Jin, X.; Xu, J.; Gao, J.; Du, X.; Duan, D.; Li, B.; Zhao, J.; Zhan, W.; Tang, H.; et al. Sequencing-based approach identified three new susceptibility loci for psoriasis. Nat. Commun. 2014, 5, 4331. [Google Scholar] [CrossRef] [Green Version]
  21. Funabiki, M.; Kato, H.; Miyachi, Y.; Toki, H.; Motegi, H.; Inoue, M.; Minowa, O.; Yoshida, A.; Deguchi, K.; Sato, H.; et al. Autoimmune disorders associated with gain of function of the intracellular sensor MDA5. Immunity 2014, 40, 199–212. [Google Scholar] [CrossRef] [Green Version]
  22. Rutsch, F.; MacDougall, M.; Lu, C.; Buers, I.; Mamaeva, O.; Nitschke, Y.; Rice, G.I.; Erlandsen, H.; Kehl, H.G.; Thiele, H.; et al. A specific IFIH1 gain-of-function mutation causes Singleton-Merten syndrome. Am. J. Hum. Genet. 2015, 96, 275–282. [Google Scholar] [CrossRef] [Green Version]
  23. Rice, G.I.; Del Toro Duany, Y.; Jenkinson, E.M.; Forte, G.M.; Anderson, B.H.; Ariaudo, G.; Bader-Meunier, B.; Baildam, E.M.; Battini, R.; Beresford, M.W.; et al. Gain-of-function mutations in IFIH1 cause a spectrum of human disease phenotypes associated with upregulated type I interferon signaling. Nat. Genet. 2014, 46, 503–509. [Google Scholar] [CrossRef]
  24. Oda, H.; Nakagawa, K.; Abe, J.; Awaya, T.; Funabiki, M.; Hijikata, A.; Nishikomori, R.; Funatsuka, M.; Ohshima, Y.; Sugawara, Y.; et al. Aicardi-Goutières syndrome is caused by IFIH1 mutations. Am. J. Hum. Genet. 2014, 95, 121–125. [Google Scholar] [CrossRef] [PubMed] [Green Version]
  25. Yu, Q.; Qu, K.; Modis, Y. Cryo-EM Structures of MDA5-dsRNA Filaments at Different Stages of ATP Hydrolysis. Mol. Cell 2018, 72, 999–1012.e1016. [Google Scholar] [CrossRef] [PubMed] [Green Version]
  26. Uchikawa, E.; Lethier, M.; Malet, H.; Brunel, J.; Gerlier, D.; Cusack, S. Structural Analysis of dsRNA Binding to Anti-viral Pattern Recognition Receptors LGP2 and MDA5. Mol. Cell 2016, 62, 586–602. [Google Scholar] [CrossRef] [PubMed] [Green Version]
  27. Landau, M.; Mayrose, I.; Rosenberg, Y.; Glaser, F.; Martz, E.; Pupko, T.; Ben-Tal, N. ConSurf 2005: The projection of evolutionary conservation scores of residues on protein structures. Nucleic Acids Res. 2005, 33, W299–W302. [Google Scholar] [CrossRef]
  28. Glaser, F.; Pupko, T.; Paz, I.; Bell, R.E.; Bechor-Shental, D.; Martz, E.; Ben-Tal, N. ConSurf: Identification of functional regions in proteins by surface-mapping of phylogenetic information. Bioinformatics 2003, 19, 163–164. [Google Scholar] [CrossRef] [Green Version]
  29. Capriotti, E.; Fariselli, P.; Casadio, R. I-Mutant2.0: Predicting stability changes upon mutation from the protein sequence or structure. Nucleic Acids Res. 2005, 33, W306–W310. [Google Scholar] [CrossRef] [Green Version]
  30. Choi, Y.; Sims, G.E.; Murphy, S.; Miller, J.R.; Chan, A.P. Predicting the functional effect of amino acid substitutions and indels. PLoS ONE 2012, 7, e46688. [Google Scholar] [CrossRef] [PubMed] [Green Version]
  31. Fiser, A.; Sali, A. ModLoop: Automated modeling of loops in protein structures. Bioinformatics 2003, 19, 2500–2501. [Google Scholar] [CrossRef]
  32. Fiser, A.; Do, R.K.; Sali, A. Modeling of loops in protein structures. Protein Sci. 2000, 9, 1753–1773. [Google Scholar] [CrossRef] [PubMed] [Green Version]
  33. The PyMOL Molecular Graphics System, Version 2.0 Schrödinger. Available online: https://pymol.org/2/support.html (accessed on 15 August 2021).
  34. Wallner, B.; Elofsson, A. Can correct protein models be identified? Protein Sci. 2003, 12, 1073–1086. [Google Scholar] [CrossRef] [PubMed] [Green Version]
  35. Dassault Systèmes BIOVIA. Available online: https://www.3ds.com/products-services/biovia/(accessed on 15 August 2021).
  36. Pronk, S.; Pall, S.; Schulz, R.; Larsson, P.; Bjelkmar, P.; Apostolov, R.; Shirts, M.R.; Smith, J.C.; Kasson, P.M.; van der Spoel, D.; et al. GROMACS 4.5: A high-throughput and highly parallel open source molecular simulation toolkit. Bioinformatics 2013, 29, 845–854. [Google Scholar] [CrossRef] [PubMed]
  37. Van Der Spoel, D.; Lindahl, E.; Hess, B.; Groenhof, G.; Mark, A.E.; Berendsen, H.J. GROMACS: Fast, flexible, and free. J. Comput. Chem. 2005, 26, 1701–1718. [Google Scholar] [CrossRef]
  38. Gosu, V.; Son, S.; Shin, D.; Song, K.-D. Insights into the dynamic nature of the dsRNA-bound TLR3 complex. Sci. Rep. 2019, 9, 3652. [Google Scholar] [CrossRef] [PubMed]
  39. Chakrabarty, B.; Parekh, N. NAPS: Network Analysis of Protein Structures. Nucleic Acids Res. 2016, 44, W375–W382. [Google Scholar] [CrossRef] [Green Version]
  40. Mahita, J.; Sowdhamini, R. Probing subtle conformational changes induced by phosphorylation and point mutations in the TIR domains of TLR2 and TLR3. Proteins 2018, 86, 524–535. [Google Scholar] [CrossRef]
  41. Gosu, V.; Shin, D.; Song, K.D.; Heo, J.; Oh, J.D. Molecular modeling and dynamic simulation of chicken Mx protein with the S631N polymorphism. J. Biomol. Struct. Dyn. 2020, 1–10. [Google Scholar] [CrossRef]
  42. Gosu, V.; Won, K.; Oh, J.D.; Shin, D. Conformational Changes Induced by S34Y and R98C Variants in the Death Domain of Myd88. Front. Mol. Biosci. 2020, 7, 27. [Google Scholar] [CrossRef]
  43. Anwar, M.A.; Choi, S. Structure-Activity Relationship in TLR4 Mutations: Atomistic Molecular Dynamics Simulations and Residue Interaction Network Analysis. Sci. Rep. 2017, 7, 43807. [Google Scholar] [CrossRef] [PubMed] [Green Version]
  44. Dehury, B.; Raina, V.; Misra, N.; Suar, M. Effect of mutation on structure, function and dynamics of receptor binding domain of human SARS-CoV-2 with host cell receptor ACE2: A molecular dynamics simulations study. J. Biomol. Struct. Dyn. 2020, 1–15. [Google Scholar] [CrossRef] [PubMed]
Figure 1. The structure of MDA5. (A) The MDA5 structure is shown with evolutionarily conserved residues. The MDA5 sequence/structure was used for conservation analysis. Residues are shown with sphere models according to the scale bar. (B) The structure of MDA5 with modelled missing residues. Domains of MDA5 are represented with different colors and labelled. Mutant locations are shown using ball and stick models (cyan color). Zn ion is shown using a sphere model.
Biomolecules 11 01251 g001
Figure 2. Molecular dynamics trajectory analysis. Protein backbone root mean square deviation (top left). Root mean square deviation of dsRNA (top middle). Radius of gyration of the backbone atoms of MDA5 (top right). Root mean square fluctuations of the backbone atoms of MDA5 (bottom).
Biomolecules 11 01251 g002
Figure 3. Hydrogen bonds and interaction energies of the molecular dynamics trajectories.
Biomolecules 11 01251 g003
Figure 4. Cumulative percentages and porcupine plots from the principal component analysis. The cumulative percentages of the first 30 principal components are shown (top left corner). Porcupine plots were made using PyMOL for PC1 with 50 frames of the whole trajectory using the filter option. The domains are color coded as per the colors represented in Figure 1B.
Biomolecules 11 01251 g004
Figure 5. Free energy landscape analysis using PC1 and PC2 coordinates of the molecular dynamics trajectories of all complexes.
Biomolecules 11 01251 g005
Figure 6. Betweenness centrality (CB) analysis. CB values were calculated for each complex using the representative structures. (A) The plot represents the CB of each complex. (B) The plot represents the difference in CB of MDA5 wild type and mutants based on the condition |CB MDA5WT − CB MDA5mutants| ≥ 0.2 (absolute values). (C) The selected residues are mapped on the MDA5 and its variant structures. The residues are color coded as per the colors represented in Figure 1B.
Biomolecules 11 01251 g006
Table 1. Summary of trajectory analysis results of MDA5WT, MDA5L372F, MDA5A452T, MDA5R779H, and MDA5R822Q simulations. Standard deviations are given in the brackets.
Trajectory AnalysisMDA5WTMDA5L372FMDA5A452TMDA5R779HMDA5R822Q
RMSD (nm)0.4206 (0.03)0.5222 (0.04)0.6089 (0.09)0.5186 (0.05)0.5255 (0.04)
RMSD(dsRNA) (nm)0.2527 (0.03)0.216 (0.02)0.2357 (0.02)0.1938 (0.02)0.2078 (0.02)
Rg (nm)3.0658 (0.01)2.9921 (0.02)3.1180 (0.02)3.1015 (0.02)3.0246 (0.02)
SASA (nm2)385 (7) 377 (10)384 (9)383 (7)383 (7)
Intra H-bonds525 (16) 529 (17)524 (13)536 (14)541 (27)
Interaction energies (kJ/mol)−1997 (143) −2612 (194)−2003 (186)−2102 (165)−2803 (162)
Table 2. Hydrogen bond interactions between dsRNA and MDA5.
DomainsMDA5WTMDA5L372FMDA5A452TMDA5R779HMDA5R822Q
Hel1K365K365K365K365N364
K397V366H447T394V366
Q415G392N449Q395G392
K450T394 H447T413
A452Q395 N449Q415
T413
Q415
H447
N449
Hel2iQ576Q576Q576Q580Q576
Q580E579Q580Q584Q580
Q584Q580Q584 K587
K587K587K587
R605
Hel2K726K726K726K726K726
R728R728R728R728R728
G756A757G756G756A757
A757H759A757A757S761
Q771S760Q768V791K764
V791S760Q771 Q768
Q771I814 Q771
PincerK889K889K885K889K885
R890R890K889N891T888
A893 K894R890
C-terminal
domain
M926E924K949D953E924
H927L947R985Y954M926
N944D953K1001K975K949
K949K975 K983D953
K983 K1001I956
R985 K1002V973
K1001 K975
K1002 K983
R985
K1001
K1002
Table 3. The table represents the residue numbers from MDA5 mutants for which the CBd between MDA5 wild-type and mutants is 0.2 or more. Bold type distinguishes the residues common for two or more mutants.
|CB (MDA5WT) − CB (MDA5L372F)| ≥ 0.2
418, 447, 449, 451, 453, 492, 616, 617, 618, 621, 622, 625, 725, 730, 733, 790, 791, 792, 793, 794, 795, 808, 810, 812, 814, 884, 886, 887, 888, 890, 894, 896, 897, 926, 928, 987, 1010
|CB (MDA5WT) − CB (MDA5A452T)| ≥ 0.2
331, 363, 368, 451, 615, 621, 622, 625, 626, 634, 636, 733, 791, 792, 793, 794, 795, 806, 812, 885, 887, 888, 889, 891, 892, 894, 896, 897, 926, 928, 981
|CB (MDA5WT) − CB (MDA5R779H)| ≥ 0.2
359, 418, 447, 449, 451, 455, 459, 492, 544, 546, 612, 616, 618, 621, 625, 628, 632, 636, 639, 674, 677, 730, 731, 733, 734, 735, 737, 790, 791, 792, 794, 795, 796, 803, 812, 814, 815, 835, 836, 885, 887, 888, 889, 890, 892, 893, 895, 897, 908, 942, 965, 984, 1004, 1009
|CB (MDA5WT) − CB (MDA5R822Q)| ≥ 0.2
367, 368, 369, 413, 453, 456, 492, 615, 616, 617, 730, 731, 733, 755, 764, 766, 768, 791,
793, 795, 814, 815, 884, 885, 890, 892, 894, 895, 896, 897, 949, 955, 956, 957, 971
Publisher’s Note: MDPI stays neutral with regard to jurisdictional claims in published maps and institutional affiliations.

