Article

Effect of Surface Roughness on Aggregation of Polypeptide Chains: A Monte Carlo Study

1
Institute of Physics, Polish Academy of Sciences, Al. Lotnikow 32/46, 02-668 Warsaw, Poland
2
Institute for Computational Science and Technology, SBI Building, Quang Trung Software City, Tan Chanh Hiep Ward, District 12, Ho Chi Minh City 700000, Vietnam
*
Author to whom correspondence should be addressed.
Biomolecules 2021, 11(4), 596; https://doi.org/10.3390/biom11040596
Submission received: 3 March 2021 / Revised: 14 April 2021 / Accepted: 15 April 2021 / Published: 18 April 2021

Abstract

:
The self-assembly of amyloidogenic peptides and proteins into fibrillar structures has been intensively studied for several decades, because it seems to be associated with a number of neurodegenerative diseases, such as Alzheimer’s and Parkinson’s disease. Therefore, understanding the molecular mechanisms of this phenomenon is important for identifying an effective therapy for the corresponding diseases. Protein aggregation in living organisms very often takes place on surfaces like membranes and the impact of a surface on this process depends not only on the surface chemistry but also on its topology. Our goal was to develop a simple lattice model for studying the role of surface roughness in the aggregation kinetics of polypeptide chains and the morphology of aggregates. We showed that, consistent with the experiment, an increase in roughness slows down the fibril formation, and this process becomes inhibited at a very highly level of roughness. We predicted a subtle catalytic effect that a slightly rough surface promotes the self-assembly of polypeptide chains but does not delay it. This effect occurs when the interaction between the surface and polypeptide chains is moderate and can be explained by taking into account the competition between energy and entropy factors.

1. Introduction

The self-assembly of proteins into aggregates of various morphologies is probably one of the main causes of chronic neurodegenerative diseases such as Alzheimer’s, Parkinson’s and Huntington’s disease [1,2,3]. Therefore, understanding the mechanisms of protein aggregation plays an important role in discovering effective therapies to treat these diseases. Protein aggregation can occur in solution as well as in complex environments, including various surrounding objects such as cell membranes, DNA, sugars, other biological compounds and industrial artificial surfaces which require the careful study of the effect of different surfaces on the process [4,5,6,7,8]. In general, the impact of foreign surfaces on the protein aggregation process displays complicated behaviors which depend on the type of surfaces, proteins and experiment conditions [9,10,11,12]. Lipid membranes were reported to play the role of a template to accelerate the aggregation of different amyloidogenic peptides [13,14,15,16]. Mica and glass facilitated the fibril formation of the fragment Aβ18-22 [17] and α-synuclein [18] on their surfaces, respectively. However, the surfaces of polymeric nanoparticles slow the self-assembly of IAPP [19], while the protein-coated surfaces of graphene oxide showed a strong inhibition effect for the fibrillogenesis of peptide Aβ42 [20]. Carbon nanotubes [21,22] and nanoparticles [23,24] can either accelerate or slow down aggregation depending on the experimental conditions and aggregation agents. Furthermore, the fibril structure of amyloid peptide GAV-9 favors a “stand up” motif on the hydrophilic mica surface, but greatly prefers the “lie down” position on a hydrophobic HOPG (highly oriented pyrolytic graphite) plain [25,26]. Surfaces can also control the peptide aggregation kinetics as well as their morphologies through surface topologies [27,28] or surface roughness [29,30]. Furthermore, many computational investigations have been conducted to explore the role of smooth surfaces and membrane on protein aggregation using coarse-grained [31,32] and all-atom models [33].
Combining a two-state peptide model [34] and experiment on the self-assembly of Aβ42 and α-synuclein in the presence of different types of surfaces, Vacha et al. [35] have shown that weakly absorbing surfaces retard proteins aggregation, while strongly absorbing surfaces enhance the process. This implies that the aggregation is modulated by interactions between polypeptide chains and foreign surfaces. When proteins are absorbed on the surface, their movement becomes more limited compared to the three-dimensional case, and this can lead to an increase or decrease in the fibril formation rate depending on the experimental conditions [36]. A weakly absorbing surface reduces the concentration of proteins in the bulk, which reduces the probability of the formation of critical nuclei there [35]. On the other hand, the interactions between surface and polypeptide chains are not strong enough to maintain a sufficient number of chains on the surface to accelerate the aggregation process. Competition between these factors leads to a decrease in the overall rate of protein aggregation on weakly absorbing surfaces [37]. For highly absorbent surfaces, a large amount of proteins is absorbed on the surface, catalyzing the formation of critical nuclei, which accelerates the fibril formation [17]. However, very strong absorption will impede the process due to the hindrance of diffusion and sampling of peptides on the plain [36].
Combining polymer coating, argon plasma treatment and thermal annealing techniques, Shezad et al. [29] were successful in the production of polystyrene surfaces with roughness of varying degrees. They showed that the aggregation rate of Aβ42 (beta amyloid peptide of 42 residues) decreases with increasing surface roughness, and very rough surfaces even block fibril growth. Using various experimental methods, it was shown that a the rough surface restricts the two-dimensional diffusion of peptides, which slows down the surface-mediated formation of fibrillar species [29].
To our best knowledge, theoretical studies of the impact of surface roughness on protein aggregation have not been conducted. In this paper, we develop simple lattice models in which rough surfaces were created by randomly distributed balls on smooth planes and performed Monte Carlo simulations to explain the experimentally observed phenomena. More importantly, we predicted that for moderate particle–surface interactions, slightly rough surfaces can accelerate the fibril formation rather than slow it down.

2. Materials and Methods

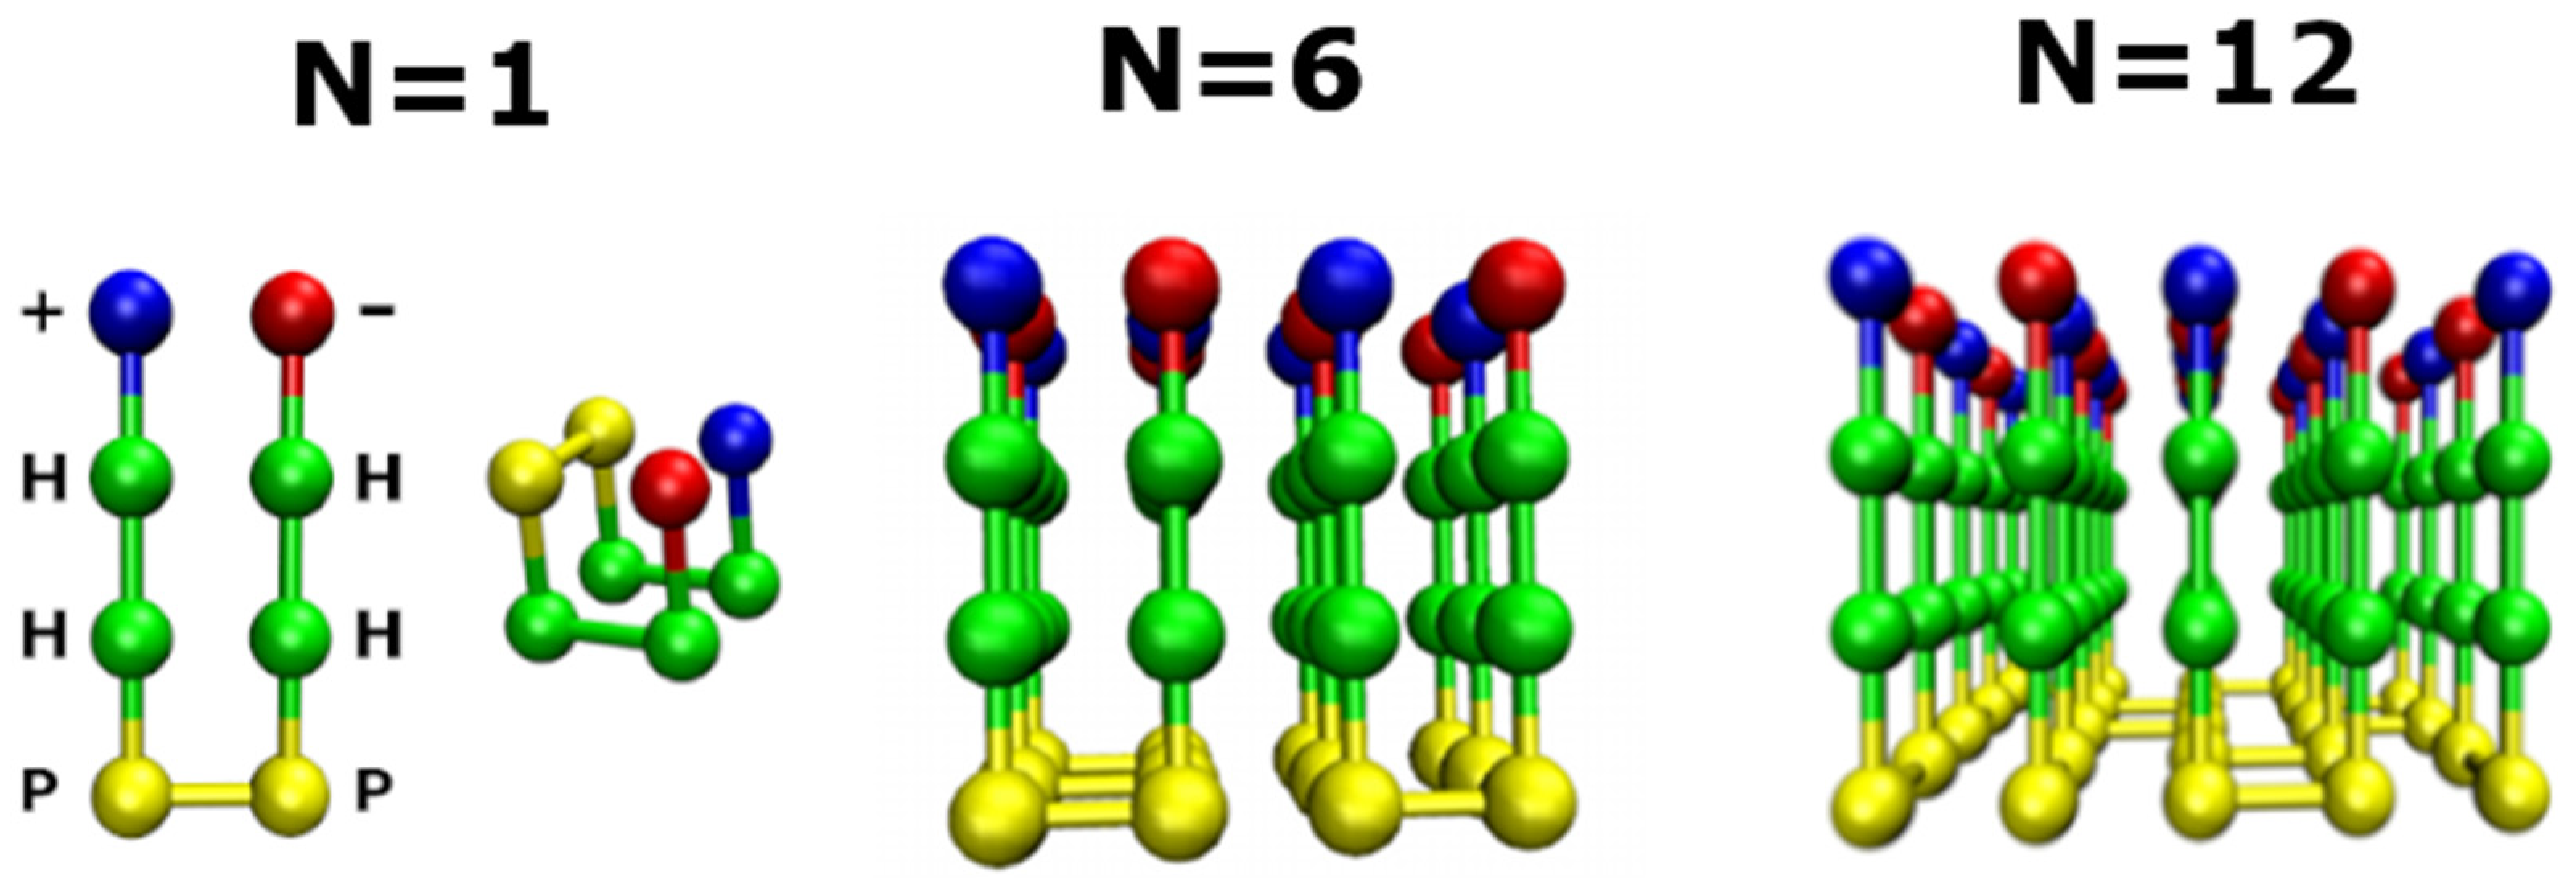
2.1. Lattice Models in Bulk

Since the fibril formation time of proteins varies from hours to months, its assessment using all-atom or even off-lattice coarse-grained models is not possible within the existing computational capabilities. The problem becomes harder in the presence of rough surfaces that slow down this process. Therefore, we developed simple lattice models that allowed us to estimate the fibril formation rate with a reasonable amount of computational time (our models are simpler than other coarse-grained models [38,39,40,41]). These models are an extension of lattice models that were successfully used by our group to simulate the kinetics of fibril formation of polypeptide chains in the absence of surfaces [42]. Despite their simplicity the lattice models correctly captured the dependence of fibril formation time on the hydrophobicity, charge and population of the so called fibril prone state N* in monomeric state [19]. They were also useful in studying the mechanism of heat-induced amyloid fibril degradation [43], the role of crowders in fibrillation [6] and assessing the size of critical nuclei [44].
In our model, polypeptide chains, which are confined to a discrete cubic lattice, consist of M = 8 beads, designated as + HHPPHH−, respectively (Figure 1, left), where +, − represent positively and negatively charged residues, and H and P stand for hydrophobic and polar residues, respectively. Interactions include interactions of beads in the same chain (intra-contact) and interactions of beads from different chains (inter-contact). The intra-chain interaction between two beads is counted if they are not successive in sequence and the distance between them is equal to the lattice spacing a. We take into account only the nearest neighbor inter-chain interaction, which occurs when the distance between two interacting beads is equal to a. Then, the total energy of the system consisting of N polypeptide chains, E, is determined by the first two terms of the following expression:
E = l = 1 N i < j M e s l ( i ) s l ( j ) δ ( r i j a ) + m < l N i , j M e s l ( i ) s m ( j ) δ ( r i j a ) + m = N i = 1 M k = 1 N s e v s k , s m ( i ) δ ( r i k a ) .
where rij is the distance between amino acids i and j, in simulations a is assigned Equal (1), sm (i) denotes the amino acid ith in the mth peptide chain. The delta-function δ(x) is 1 at x = 0 and 0 otherwise. The first and second terms in Equation (1) describe the intra- and inter-chain interactions, respectively. The pair interactions between beads (or “force field”) eij are given in Table 1. The third term describes the interaction between polypeptide chains and surface (see below). In our models, 20 amino acids were divided into hydrophobic, hydrophilic, negatively charged and positively charged groups. As in our previous works [42,45], their interaction energies shown in Table 1 and Table 2 were basically selected based on the statistical potentials that were obtained by Betancourt and Thirumalai [46].
By Monte Carlo simulations [19,42] (see also below) we obtained the fibril structures for the systems with N = 6 and 12 peptides (Figure 1).

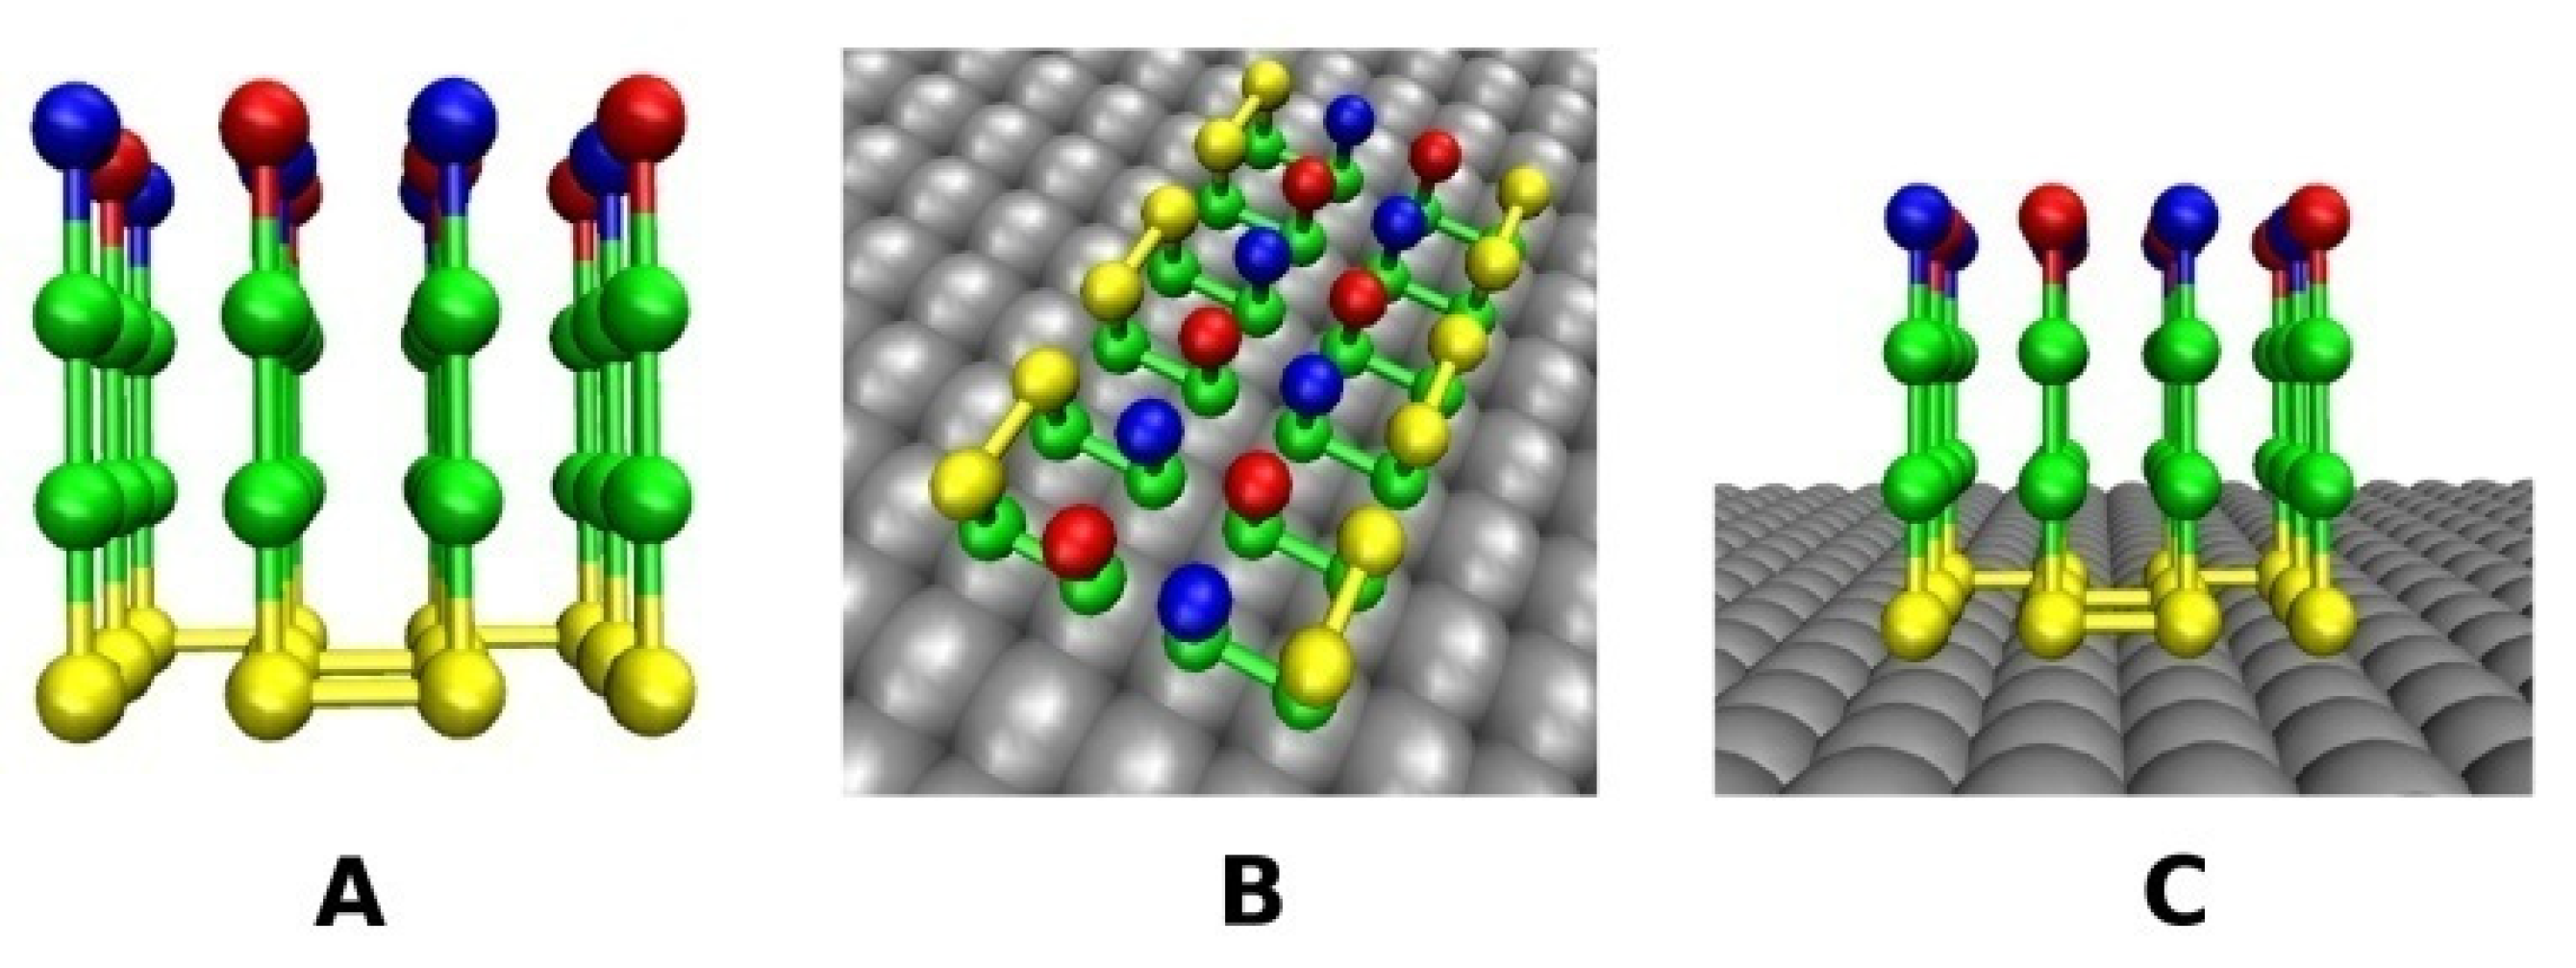
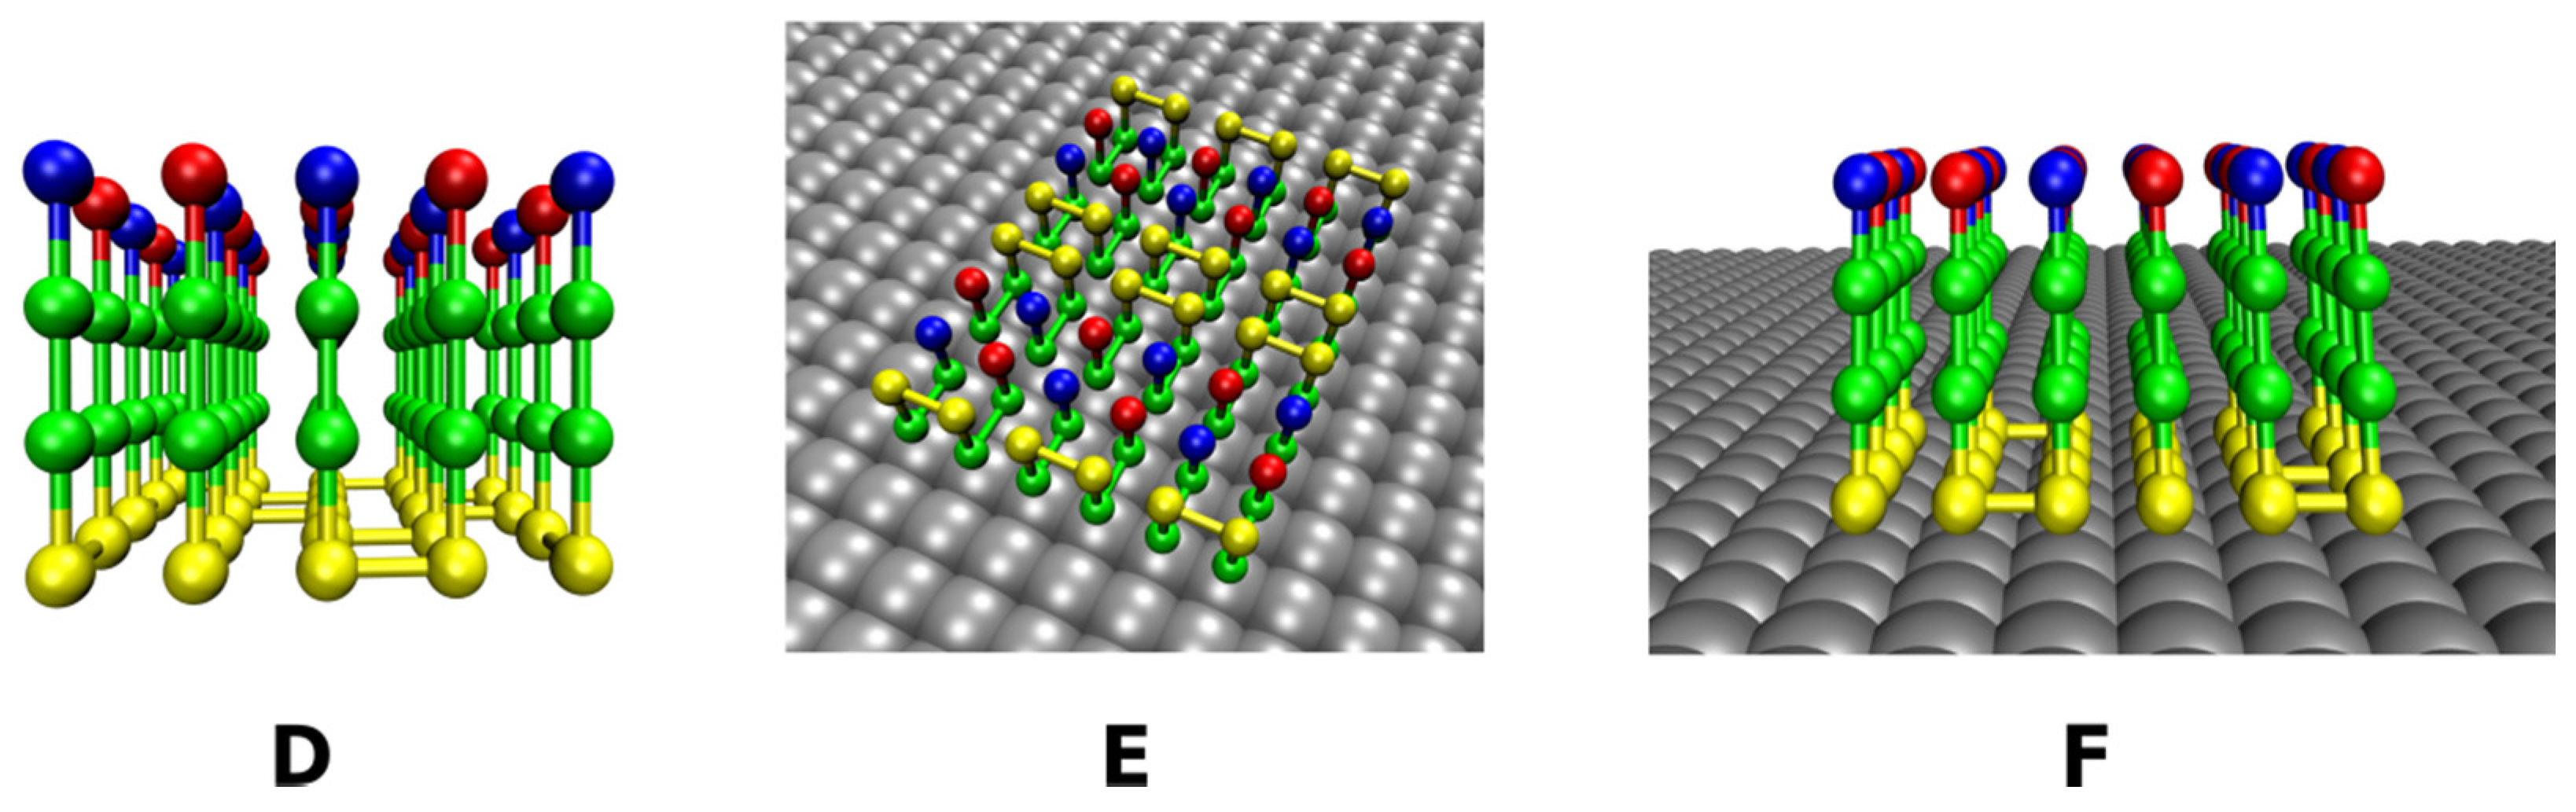
2.2. Lattice Models with Surfaces

2.2.1. Smooth Surface

We modeled a smooth surface as a systems of beads regularly located at points of a two-dimensional square lattice. The lattice spacing of the surface is the same as in bulk. The surface beads are kept fixed during the simulation, and the interaction between them is not taken into account. The chemical properties of surfaces are characterized by their interaction with polypeptide chains. We examined two types of surfaces: hydrophilic and hydrophobic surfaces, which consist of hydrophobic and hydrophilic beads, respectively. Surface beads are designated as Ps and Hs for the hydrophilic and hydrophobic surfaces, respectively.
Denoting the interaction energy between the bead i of a polypeptide chain and the surface bead j as eνsi,j (ν can be p for hydrophilic surface and h for hydrophobic surface), the interaction energy between the polypeptide chains and the surface is given by the third term in Equation (1). Here, Ns is the total number of sites of the surface area. The eνsi,j values are shown in Table 2. Here, we chose the interaction between surface beads and polypeptide beads to be the same as the interaction between the beads of polypeptide chains. However, in order to explore the dependence of fibril formation kinetics on the strength of interaction with surfaces, we varied the interaction between the hydrophobic beads of the polypeptide chains and the surface εhs and the interaction between hydrophilic beads of polypeptide chains and surface εps.
Depending on the surface, fibrils may have different morphologies. In our model, for N = 6 and 12 chains, the fibril structure on the hydrophilic surface has the same shape (Figure 2C,F) as in bulk (Figure 2A,D), but on the hydrophobic surface all the chains adopt the monomer native structure (Figure 1) in the fibril state due to strong hydrophobic interactions between the chains and the surface and the short peptides in our model (Figure 2B,E). In other words, the fibril-prone conformation N* coincides with the compact native conformation. Thus, even in the simple model, we showed that the surface can change the morphology of fibrils.

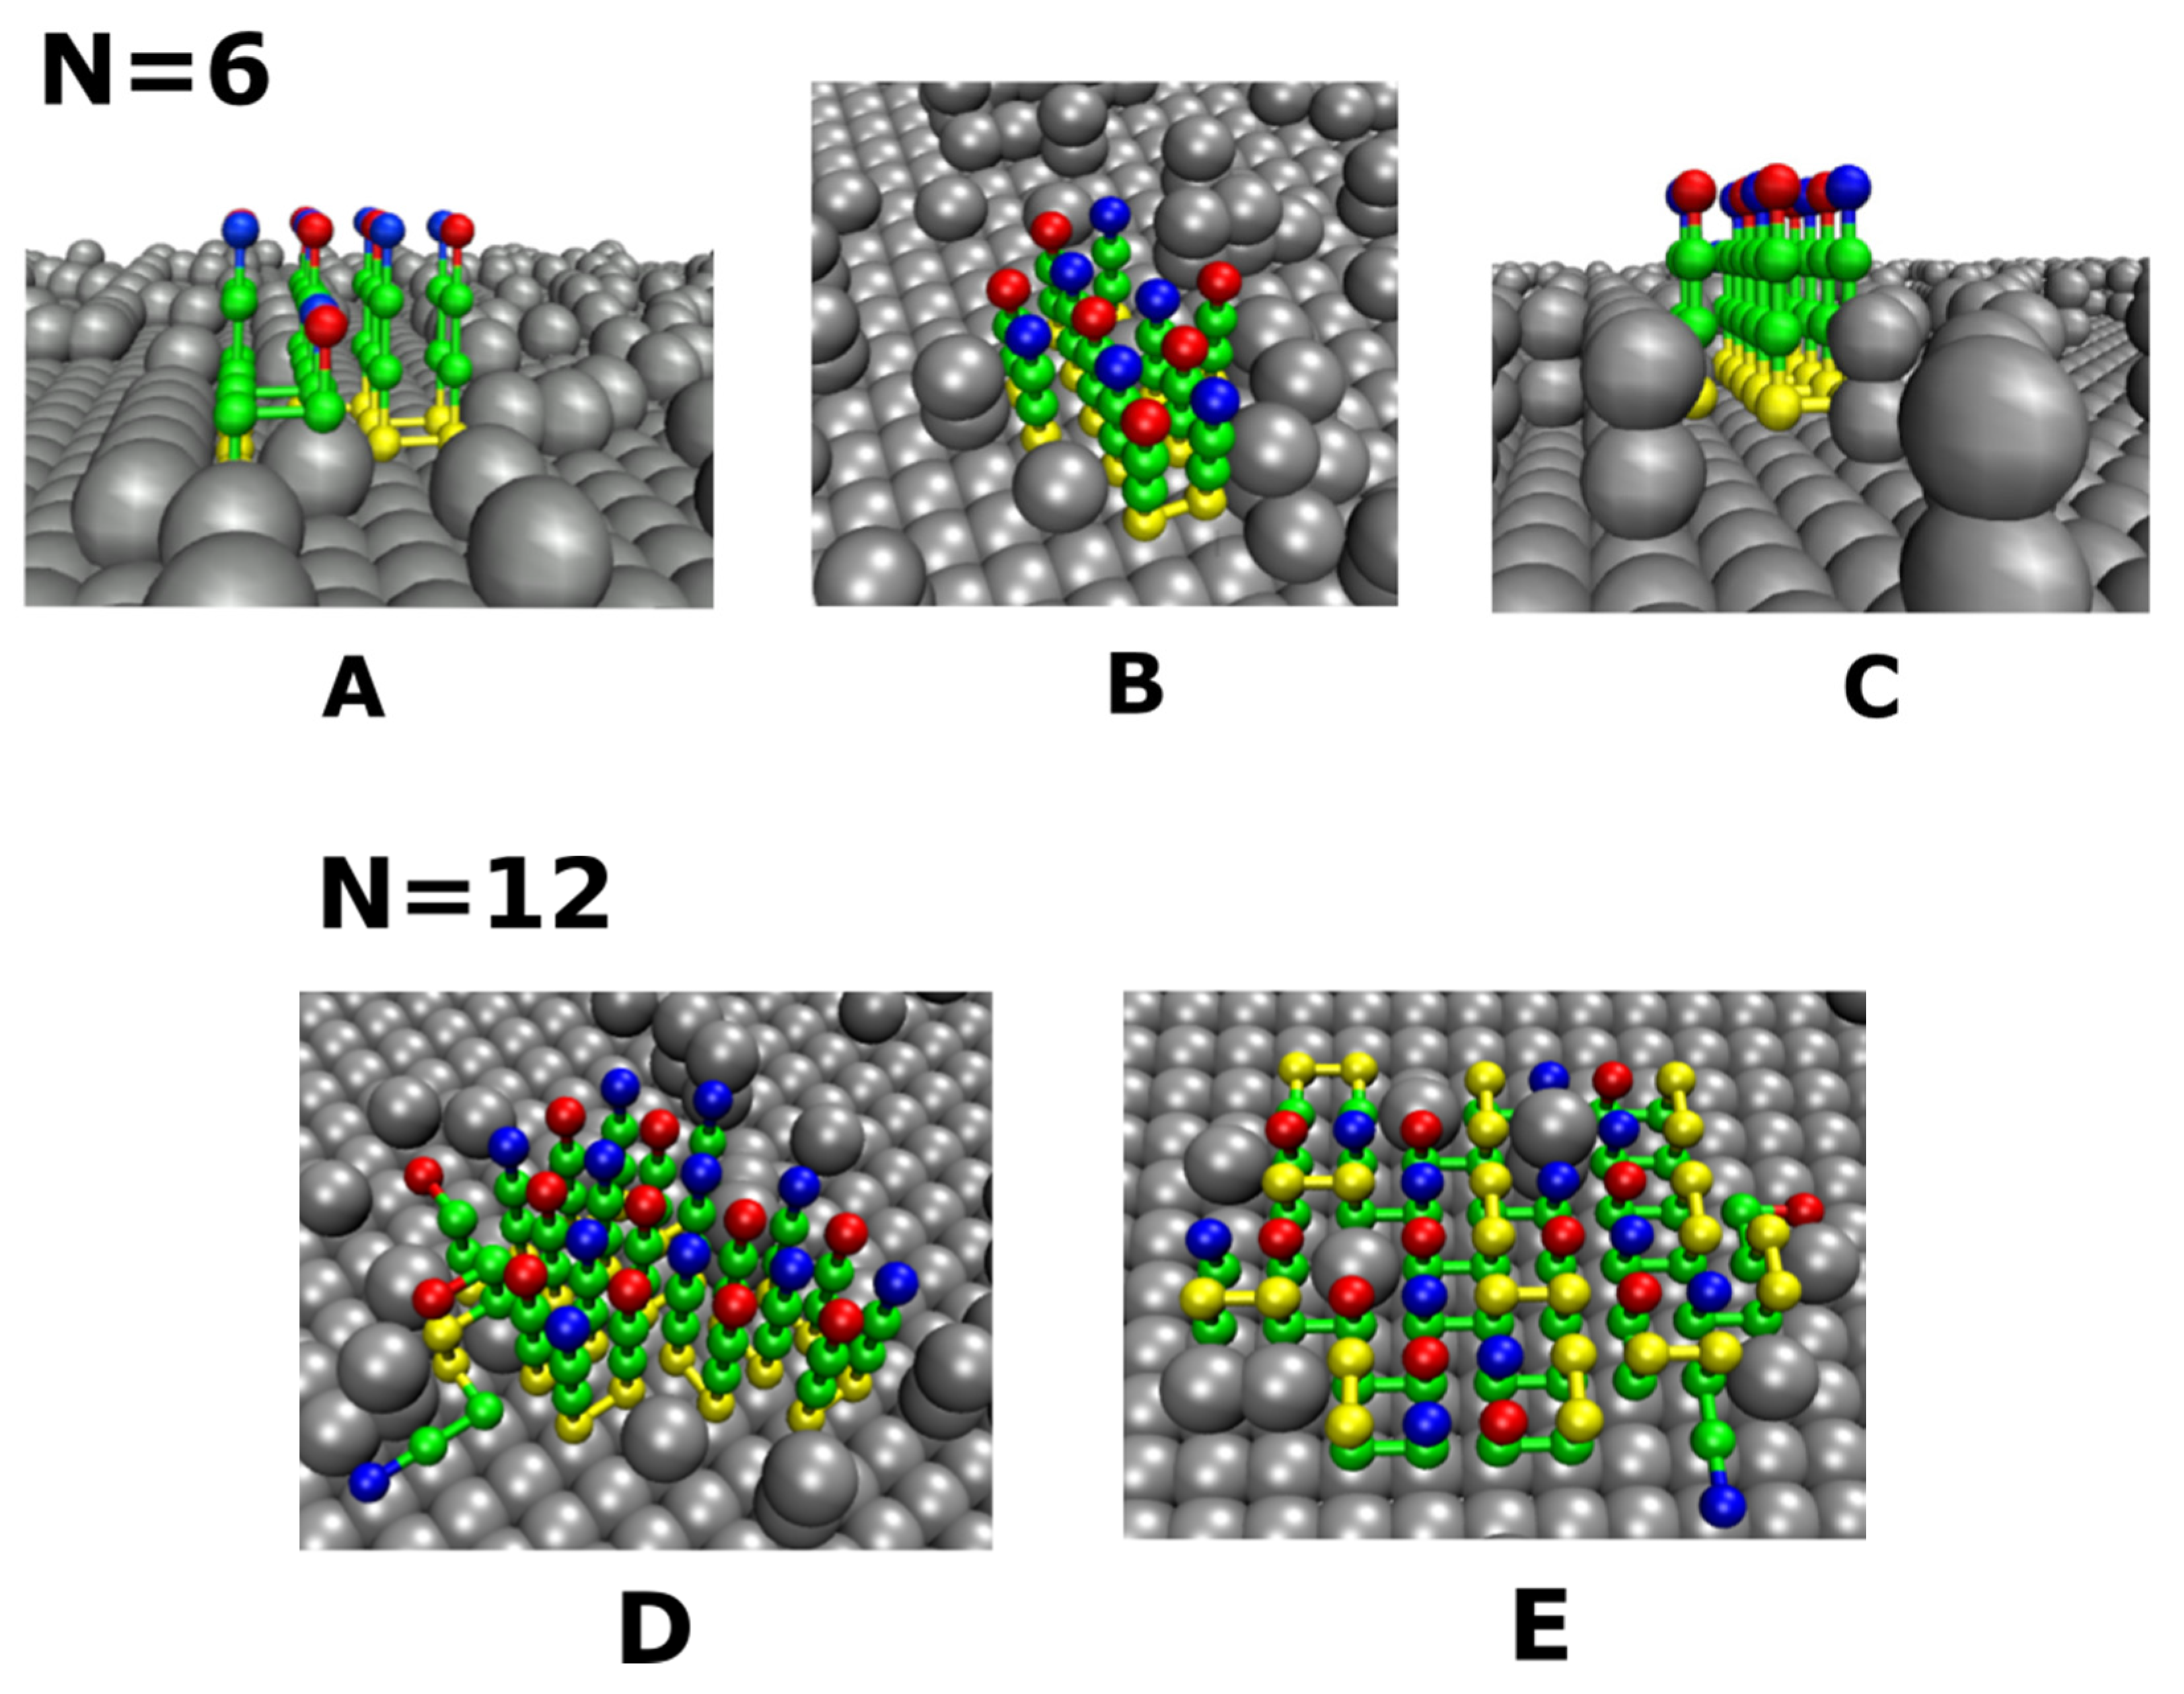
2.2.2. Rough Surfaces

To build a rough surface, we randomly placed identical balls on a smooth surface. These balls should be hydrophobic and hydrophilic for rough hydrophobic and hydrophilic surfaces, respectively. Each ball has the same size and occupies one lattice site similar as the chain’s beads; however, in order to facilitate the visualization, we exhibited them in larger size (Figure 2 and Figure 3). The roughness depends not only on the concentration of randomly distributed balls, but also on how they are arranged. In this paper, we considered 3 types of arrangement: single balls (S-point), double balls (D-point) and the equal mix of S-point and D-point called DS-point (Figure 3); therefore, we have S-surface, D-surface and DS-surface. In the first case, at each position, only one ball was positioned at a distance of the grid pitch a from the surface (Figure 3A). In the case of a D-surface, two rigidly connected balls were placed perpendicular to the surface and the distance between the higher ball and the surface is equal to 2a (Figure 3C). Finally, the DS-surface comprises an equal number of S-ball and D-ball randomly distributed on a smooth surface (Figure 3B).

2.3. Definition of Surface Roughness

We define the distance (or height) from the ball i to the surface as hi. Then, hi takes the values 1, 2 and both values for the S-, D- and DS-surface, respectively. For surface point j, without ball, hj = 0. The average distance between the surface and randomly distributed balls, h ¯ , is determined by the following formula:
h ¯ = i = 1 N s h i N s ,
where Ns is the number of points of the surface. Then, the degree of surface roughness (or roughness) is the standard deviation of h and is defined as follows:
Θ = 1 N s i = 1 N s ( h i h ¯ ) 2 .
Defining Ω as the percentage of points at which single and double balls are placed to create surface roughness, we have:
Ω = N b N s
where Nb is the number of points with balls.

2.4. Monte Carlo Simulation

The concentration of chains that were enclosed in a cubic simulation box was brought to about 6 μM (about 10 times higher than the experimental concentration) for all simulated systems. Although the lattice model is simple, calculating the aggregation time of many polypeptide chains requires an enormous amount of computational resources, especially in the presence of rough surfaces. Therefore, we used a high concentration of peptides to accelerate the aggregation process. We applied the periodic boundary conditions to minimize finite size effects. The Monte Carlo (MC) algorithm was utilized to determine the dynamics of peptide chains. MC moves involved local and global moves. The local move may be tail rotation, corner flip, or crankshaft. The global move is either the rotation of a peptide at a 90-degree angle around a randomly selected coordinate axis, or the translation of a peptide on a in a random direction [19,42]. The probability ratio between global and local moves was chosen as 1:9. The combination of the local move and global move is the Monte Carlo step (MCS), which is a time unit in the lattice model. Although the equivalence between real time and MCS remains controversial, lattice models have been helpful in understanding the mechanisms of protein aggregation in the bulk [19,43,45] and crowded environment [6]. Note that the fibril structures with the lowest energy obtained using MC simulations are shown in Figure 1, Figure 2 and Figure 3.
It should be noted that we used our homemade programs written to study the self-assembly of polypeptide chains in lattice models. They have been used and developed for different problems since 2008 [42]. We use Fortran 90 and Monte Carlo dynamics. Our code is not parallel and it took about 48 h of CPU on an Intel Xeon E5-2680v3 2.50 GHz, for example, to simulate a trajectory of 12 chains that aggregate on a surface with a roughness of Θ = 0.1. For each data point, we have to average over 150 MC trajectories, which takes a lot of computational time. Therefore, we have to run on the supercomputer TASK located in Gdansk, Poland.

2.5. Aggregation Time τagg and Fibril Formation Time τfib

The fibril formation time τfib is the number of MCS required to reach the fibril structure from random initial configurations of the peptide chains. In a simulation with many MC trajectories, τfib is defined as the average value of the first passage times. In the case of smooth surfaces, where the fibril formation is relatively fast, we can estimate τfib from many MC trajectories. However, for rough surfaces, the fibril formation is so slow that even in simple lattice models, it is not feasible to obtain τfib within a reasonable amount of time. Therefore, instead of τfib, we introduced the aggregation τagg, which is the first passage time for acquiring a structure that has 80% fibril contacts. For each roughness degree, we generated 10–15 random surface profiles and conducted 15–20 MC runs per profile. Thus, for a given roughness, τagg was obtained by averaging over 150 (10 × 15) trajectories.

3. Results and Discussion

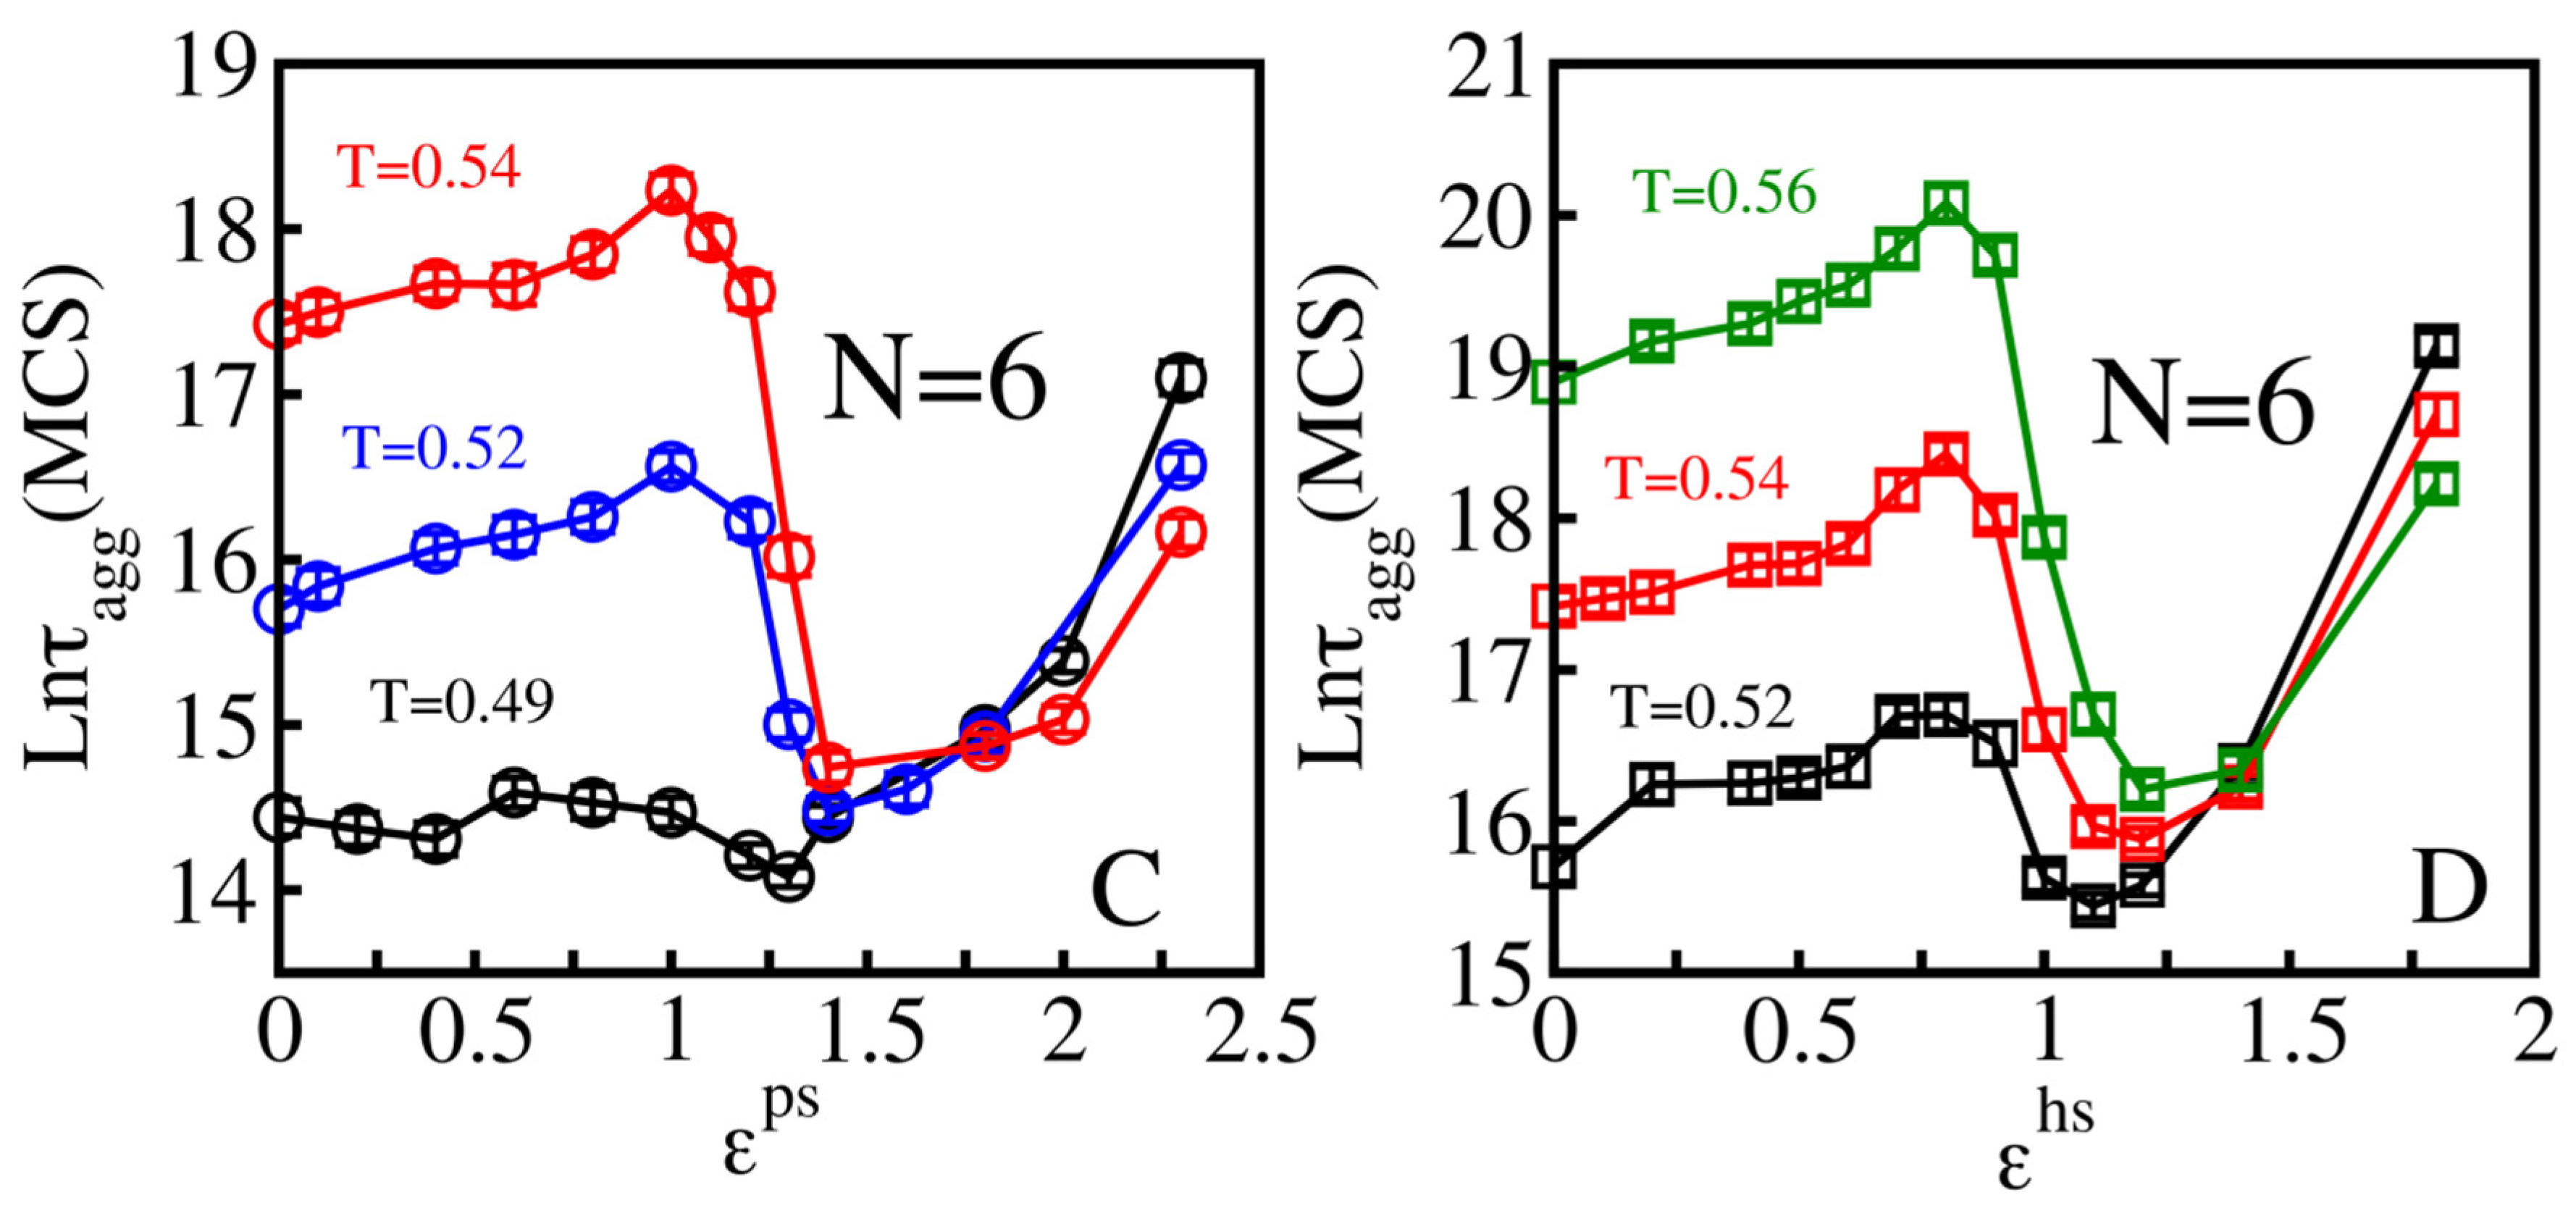
3.1. Effect of Smooth Surface on Aggregation Time τagg

3.1.1. Hydrophilic Surfaces

We first examined the effect of smooth surfaces on the aggregation process of system N = 6 polypeptide chains at various temperatures. To estimate τagg, MC simulations were conducted for systems of N = 6, initially random peptides in the cubic box. The number of MC steps to achieve a structure that has 80% fibril contacts was defined as the first passage time. For each parameter set, 100 MC runs were performed and τagg was the average value of the 100 first passage times.
For a hydrophilic smooth surface of simulation, we varied the interaction between hydrophilic beads of peptides and the surface εps in the range (0–2.4). The dependence of τagg on εps is not monotonic (Figure 4A). At T = 0.54, in the weak peptide–surface interaction regime with εps varying from 0.1 to 1.0, aggregation is slowed by the surface. This is due to the fact that a weakly adsorbing surface cannot serve as a good template for the initiation of aggregation, and interplay between the formation of an aggregate in the bulk and on the surface slows down self-assembly. As the peptide–surface interaction increases (1.0 < εps ≤ 1.4), the surface becomes a good catalytic center for nucleation, which accelerates aggregation (Figure 4A). Our results are consistent with Vacha et al. [35] who reported that weakly absorbing surfaces increase the aggregation time, while strongly absorbing surfaces catalyze the process.
A further increase in the peptide–surface interaction (εps > 1.4) again slows down aggregation again (lnτagg increases from 14.74 to 16.16), but the process remains faster than in the bulk. This increase was not studied by other groups previously and this can be explained by the fact that a strong binding to the interface reduces conformational entropy, which complicates the fibril formation. In other words, strong absorption significantly restricts the mobility monomers on the surface leading to retarded aggregation. As evident from Figure 4A, smooth hydrophilic surfaces have obstacle aggregation for εps ≥ 1.4. However, with a very strong peptide–surface interaction, aggregation occurs more slowly than in bulk, as we can see in Figure 4C for T = 0.49 and T = 0.52.
Higher temperatures enhance the flexibility of peptides, leading to a slower self-assembly in the bulk and on the surface (Figure 4C). On the other hand, they can prevent trapping of polypeptide chains on a strongly absorbing surface, which explains why at εps≥ 1.8 aggregation is accelerated at higher temperatures (Figure 4C). A similar effect was seen for hydrophobic surfaces with εhs ≥ 1.4 (Figure 4D).

3.1.2. Hydrophobic Surfaces

For T = 0.54, a similar dependence of the aggregation time on the interaction of polypeptide chains with a smooth hydrophobic interface was obtained for εhs, which varies in (0; 1.4) interval (Figure 4B). On a weakly absorbing hydrophobic surface (0.1 < εhs < 0.8), peptide self-assembly was attenuated with lnτagg increasing from 17.42 to 18.43. For εhs in the [0.8;1.2] range, aggregation became enhanced with an increase in the peptide–surface interaction and lnτagg decreased from 18.43 to 15.88. Finally, lnτagg leveled from 15.88 to 16.22 as εhs changed from 1.2 to 1.4.
As in the case of hydrophilic surfaces, the dependence of the aggregation rate on εhs can be rationalized by the interplay between the peptide–surface interaction and the entropy loss due to the reduction in spatial dimensionality from 3 in bulk to 2 on surface. For a weakly absorbing surface, aggregation takes place mainly in bulk, whereas in the opposite case, self-assembly predominately occurs on the surface. Extended calculations for different temperatures and a wider range of εhs have been shown in Figure 4D. Higher temperatures can support the aggregation process on very strongly absorbing surfaces (εhs > 1.4) by promoting peptides’ mobility (Figure 4D). Overall, the three modes of dependence of lnτagg on εhs remain unchanged for other temperatures including T = 0.52 and T = 0.56.
Aggregation in the presence of weakly absorbing surfaces happen dominantly in bulk, therefore the variation of lnτagg in the simulation time was revealed to be rather similar for both hydrophilic (lnτagg change from 17.49 to 18.23) and hydrophobic cases (lnτagg varies in range of [18.47 to 18.42]). For stronger attractive surfaces, the catalyzing (εhs > 0.8) and retardation effects (εhs > 1.2) of hydrophobic surfaces happened earlier compared with hydrophilic surfaces (εps > 1 and εhs > 1.4 for catalyzing and retardation effects, respectively). It is not clear whether this observation is always true or sequence dependent. One of the possible reasons for the difference is that the studied sequence has four hydrophobic residues, while the number of polar residues is two.

3.1.3. Three Classes of Surfaces

Based on the aggregation time and the peptide–surface interaction characterized by either the parameter εps or εhs, we divided the surfaces into three classes: weakly, medium and strongly absorbing surfaces. The weakly absorbing surface should have εps < εps1 or εhs < εhs1, where εps1and εhs1 are the values below which the aggregation time increases with the increasing peptide–surface interaction (Figure 4A,B). For medium absorbing interfaces, εps1 < εps< ε ps2 for hydrophilic surfaces and εhs1 < εhs < εhs2 for hydrophobic surfaces, where εps2 and εhs2 correspond to the minimum in Figure 4A,B. If the interaction exceeds the minimum values, εps2 and εhs2, the corresponding surfaces are classified as strongly absorbing surfaces. In the weakly absorbing surface case, the peptide–surface interaction is weak and the aggregation kinetics is, therefore, driven by entropy. In the opposite case of strongly absorbing surfaces, the self-assembly is an energy-driven process.
The values of εps1,2 and εhs1,2 that divide the surfaces into three classes depend not only the on chemical properties of surfaces, but also on sequences and the number of polypeptide chains. For N = 6, εps1 = 0.8 and εps2 = 1.4 for the hydrophilic surfaces and εhs1 = 0.8 and εhs2 = 1.2 for the hydrophobic surfaces (Figure 4).
In our model, the interaction between absorbing particles and the surface is controlled by the parameters εps and εhs for hydrophilic and hydrophobic surfaces, respectively. In general, by varying these parameters, we can qualitatively capture aggregation on different surfaces including membrane surfaces with different lipid compositions and carbon nanotubes (see also Introduction). Namely, depending on εps and εhs, aggregation can be either accelerated or slowed down as has been observed experimentally for various systems. For example, Cabaleiro-Lago et al. reported that hydrophobic single-walled carbon nanotubes slow down the fibril formation of Aβ40 peptide [23], which is consistent with all-atom simulations for the truncated variant Aβ16-22 [47]. This experimental observation also agrees with our results obtained for εhs < εhs1 and εhs > εhs2, where the interaction with the surface retards the aggregation.

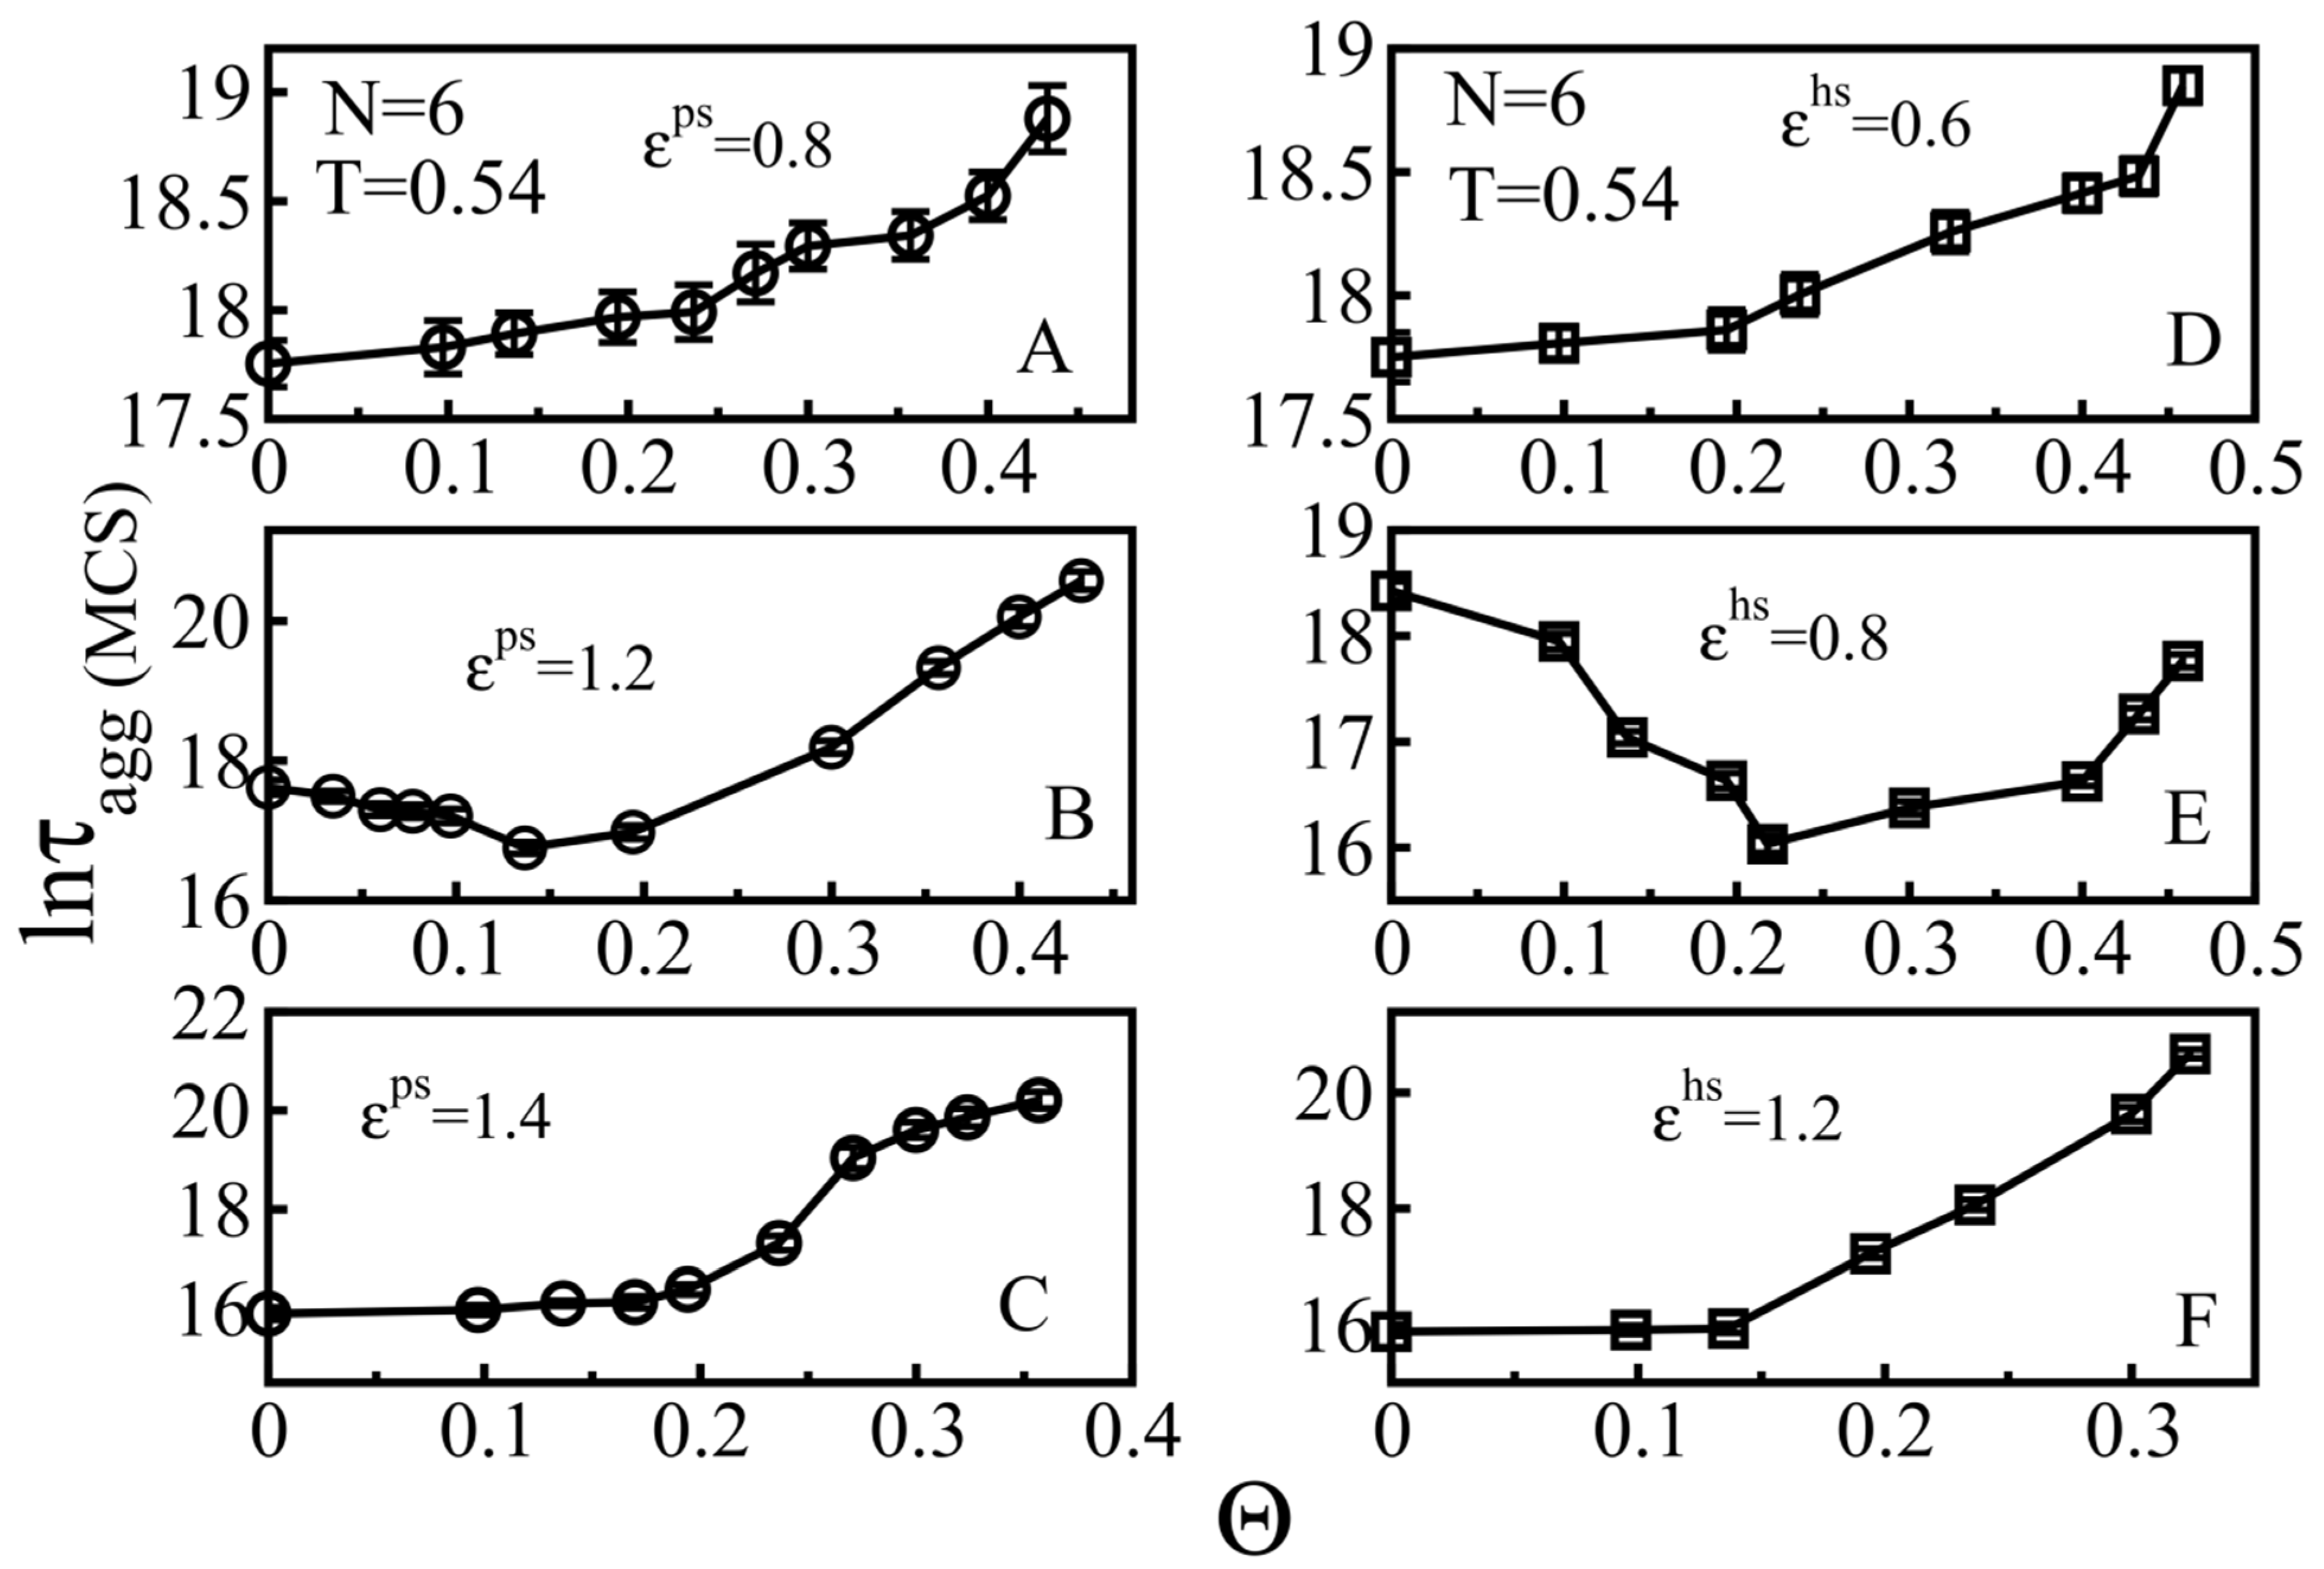
3.2. Effect of Surface Roughness on Fibril Formation: S-Surface

As mentioned above, the chemical properties of surfaces control the fibrillar growth of polypeptide chains in various scenarios. Therefore, in order to understand the role of surface roughness in protein self-assembly, we must systematically study this process in the presence of foreign surfaces not only of varying degrees of roughness but also of different peptide–surface interactions.

3.2.1. Weakly Absorbing Surfaces: Monotonic Dependence of the Aggregation Time on the Surface Roughness

After generating random particles with a given chemical property on a smooth surface, we obtained tunable rough surfaces corresponding to the chosen chemical properties. For weakly attractive surfaces, we chose εps = 0.8 and εhs = 0.6 (Figure 5A,D). Clearly, the higher the degree of roughness, the slower the peptide aggregation process. As can be seen from Figure 5A, where the value of εps was set to 0.8 which corresponds to weakly attractive smooth hydrophilic surfaces, as the roughness degrees ΘS changes from 0 to 0.432, lnτagg increases from 17.75 to 18.87.
A similar result was obtained for a hydrophobic surface (Figure 5D), where εhs = 0.6, an increase in ΘS from 0 to 0.458 led to an increase in lnτagg from 17.80 to 18.84.
In the corresponding peptide–surface interaction ranges, the kinetics of aggregation on the rough hydrophilic surfaces is similar to the kinetics on the hydrophobic surfaces (Figure 4 and Figure 5), hinting that there are some emphasized physical principles that govern these phenomena. For weakly attractive surfaces, there is interplay between the peptide assembly in the bulk and on the surface; an increase in roughness improves the ability of the peptides to adhere to the surface, increasing the phase space of the peptides in the bulk, which leads to a decreased aggregation rate (Figure 5A,D). We can call this regime entropy driven. We found that the monotonic increase in τagg with roughness was observed for εps < ε U shape ps 1 = 0.9 and εhs < ε U shape hs 1 = 0.7 (blue dashed lines in Figure 4A,B)

3.2.2. Medium Absorbing Surfaces: U-Shape Behavior

In order to study the medium absorbing surfaces, we set εps = 1.2 and εhs = 0.8 and observed a U-shape dependence, namely, that a slightly rough surface accelerates the fibril formation, while a higher roughness degree slows down the peptide self-association (Figure 5B,E). With a sufficiently low roughness, the roughness increases the probability of monomers aggregating on the surface and the attractive force still allows the proteins to diffuse and associate on the surface, forming fibrillar species, which correspond to the acceleration phase in the U-shape effect. However, as the surface roughness exceeds a threshold point at which the combination of the roughness and absorption restricts the mobility of polypeptide chains, a retardation phase of self-assembly occurs. Thus, the U-shape comes from the competition between energy and entropy. We found that this behavior occurred for ε U shape ps 1 < εps < ε U shape ps 2 = 1.25 and ε U shape hs 1 < εhs < ε U shape hs 2 = 0.95 (blue dashed lines in Figure 4A,B), for the hydrophilic and hydrophobic surfaces, respectively.

3.2.3. Strongly Absorbing Surfaces: Monotonic Dependence of the Aggregation Time on the Surface Roughness

To investigate this case, we calculated the dependence of the aggregation on the roughness for the parameters εps = 1.4 and εhs = 1.2, which can characterize strongly absorbing hydrophilic and hydrophobic surfaces (Figure 4). In this case, the surface tends to confine the movement of polypeptide chains in two-dimensional space, reducing their mobility. As a result, on very attractive surfaces, there was no acceleration phase at low roughness and the aggregation time rapidly increased with the increasing roughness (Figure 5C,F). The fibril formation becomes practically inhibited for roughness ΘS > 0.356 and 0.323 for hydrophilic (Figure 5C) and hydrophobic (Figure 5F) surfaces, respectively. This result is in qualitative agreement with the experimental result of Shezal et al. [29] for a highly attractive rough surface, as their experiment was conducted at a protein concentration lower than CMC in order to prevent protein aggregation only in bulk.
We can show that the monotonic increase in Figure 5C,F is possible for εps > ε U shape ps 2 = 1.25 and εhs > ε U shape hs 2 = 0.95 (blue dashed lines in Figure 4A,B), for the hydrophilic and hydrophobic surfaces, respectively. This behavior appears in the energy-driven regime due to the strong peptide–surface interaction.

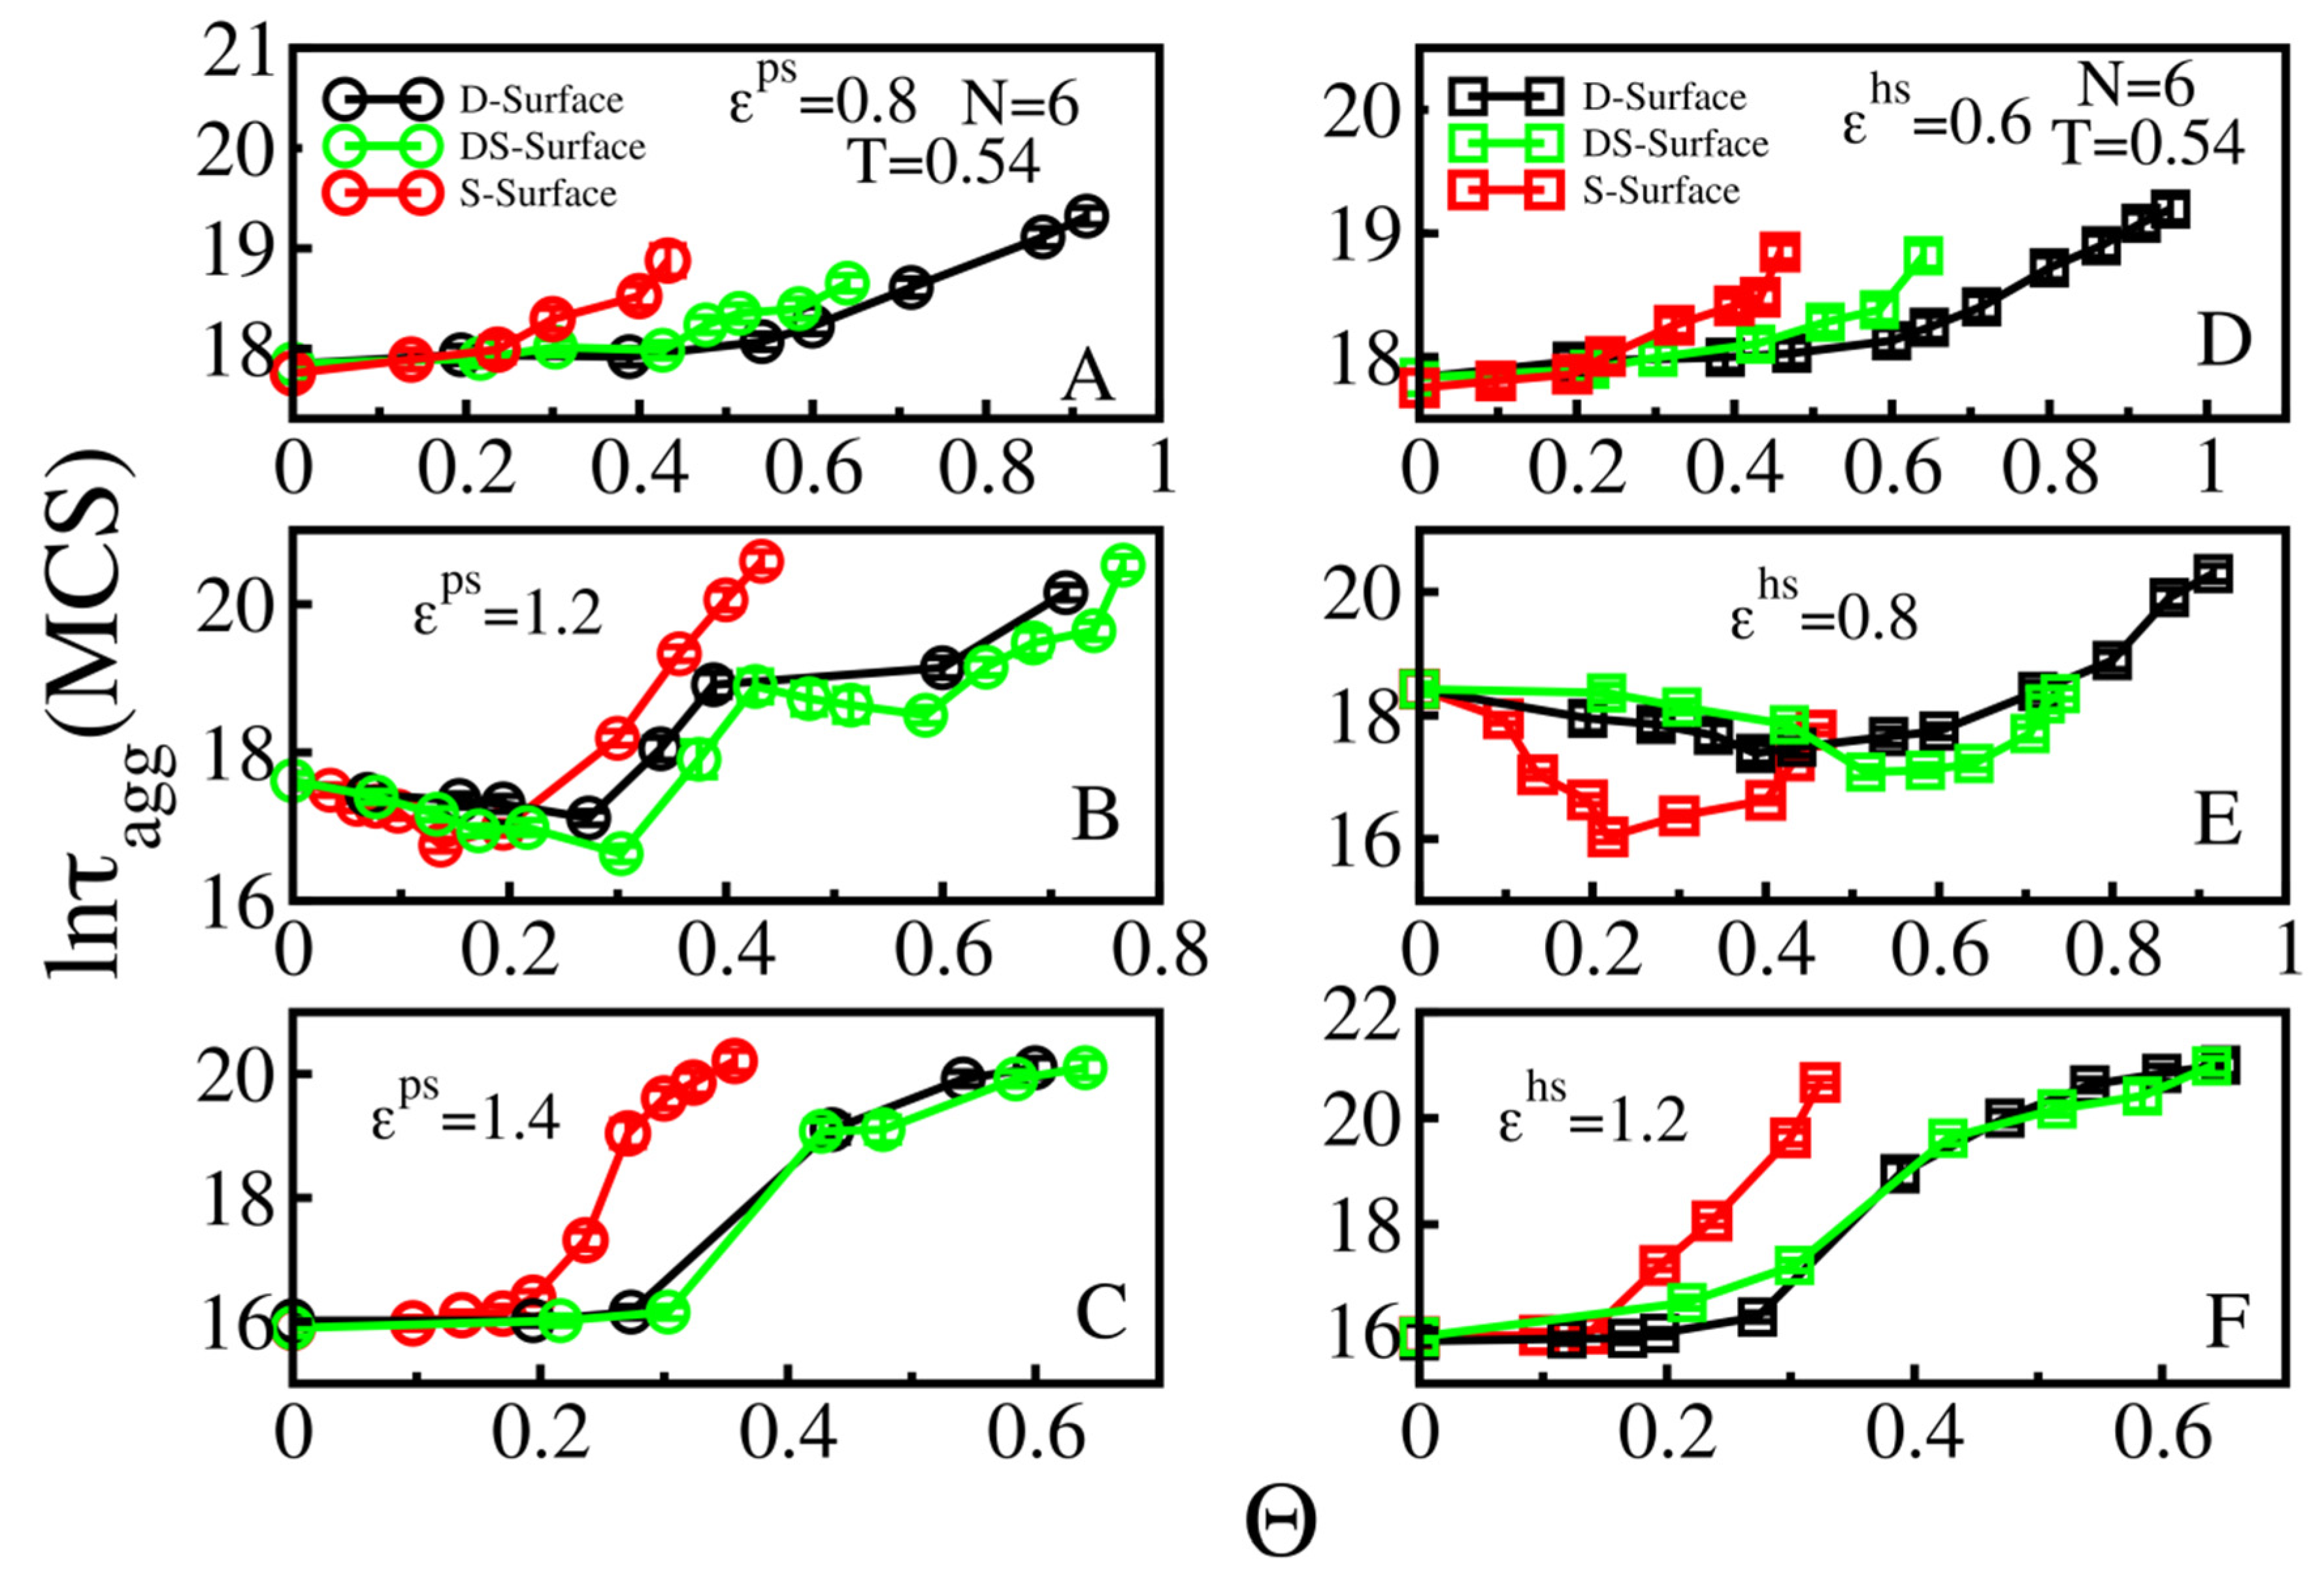
3.3. Effect of Surface Roughness on Fibril Formation: D-Surface and DS-Surface Do Not Qualitatively Change the Results Obtained for S-Surfaces
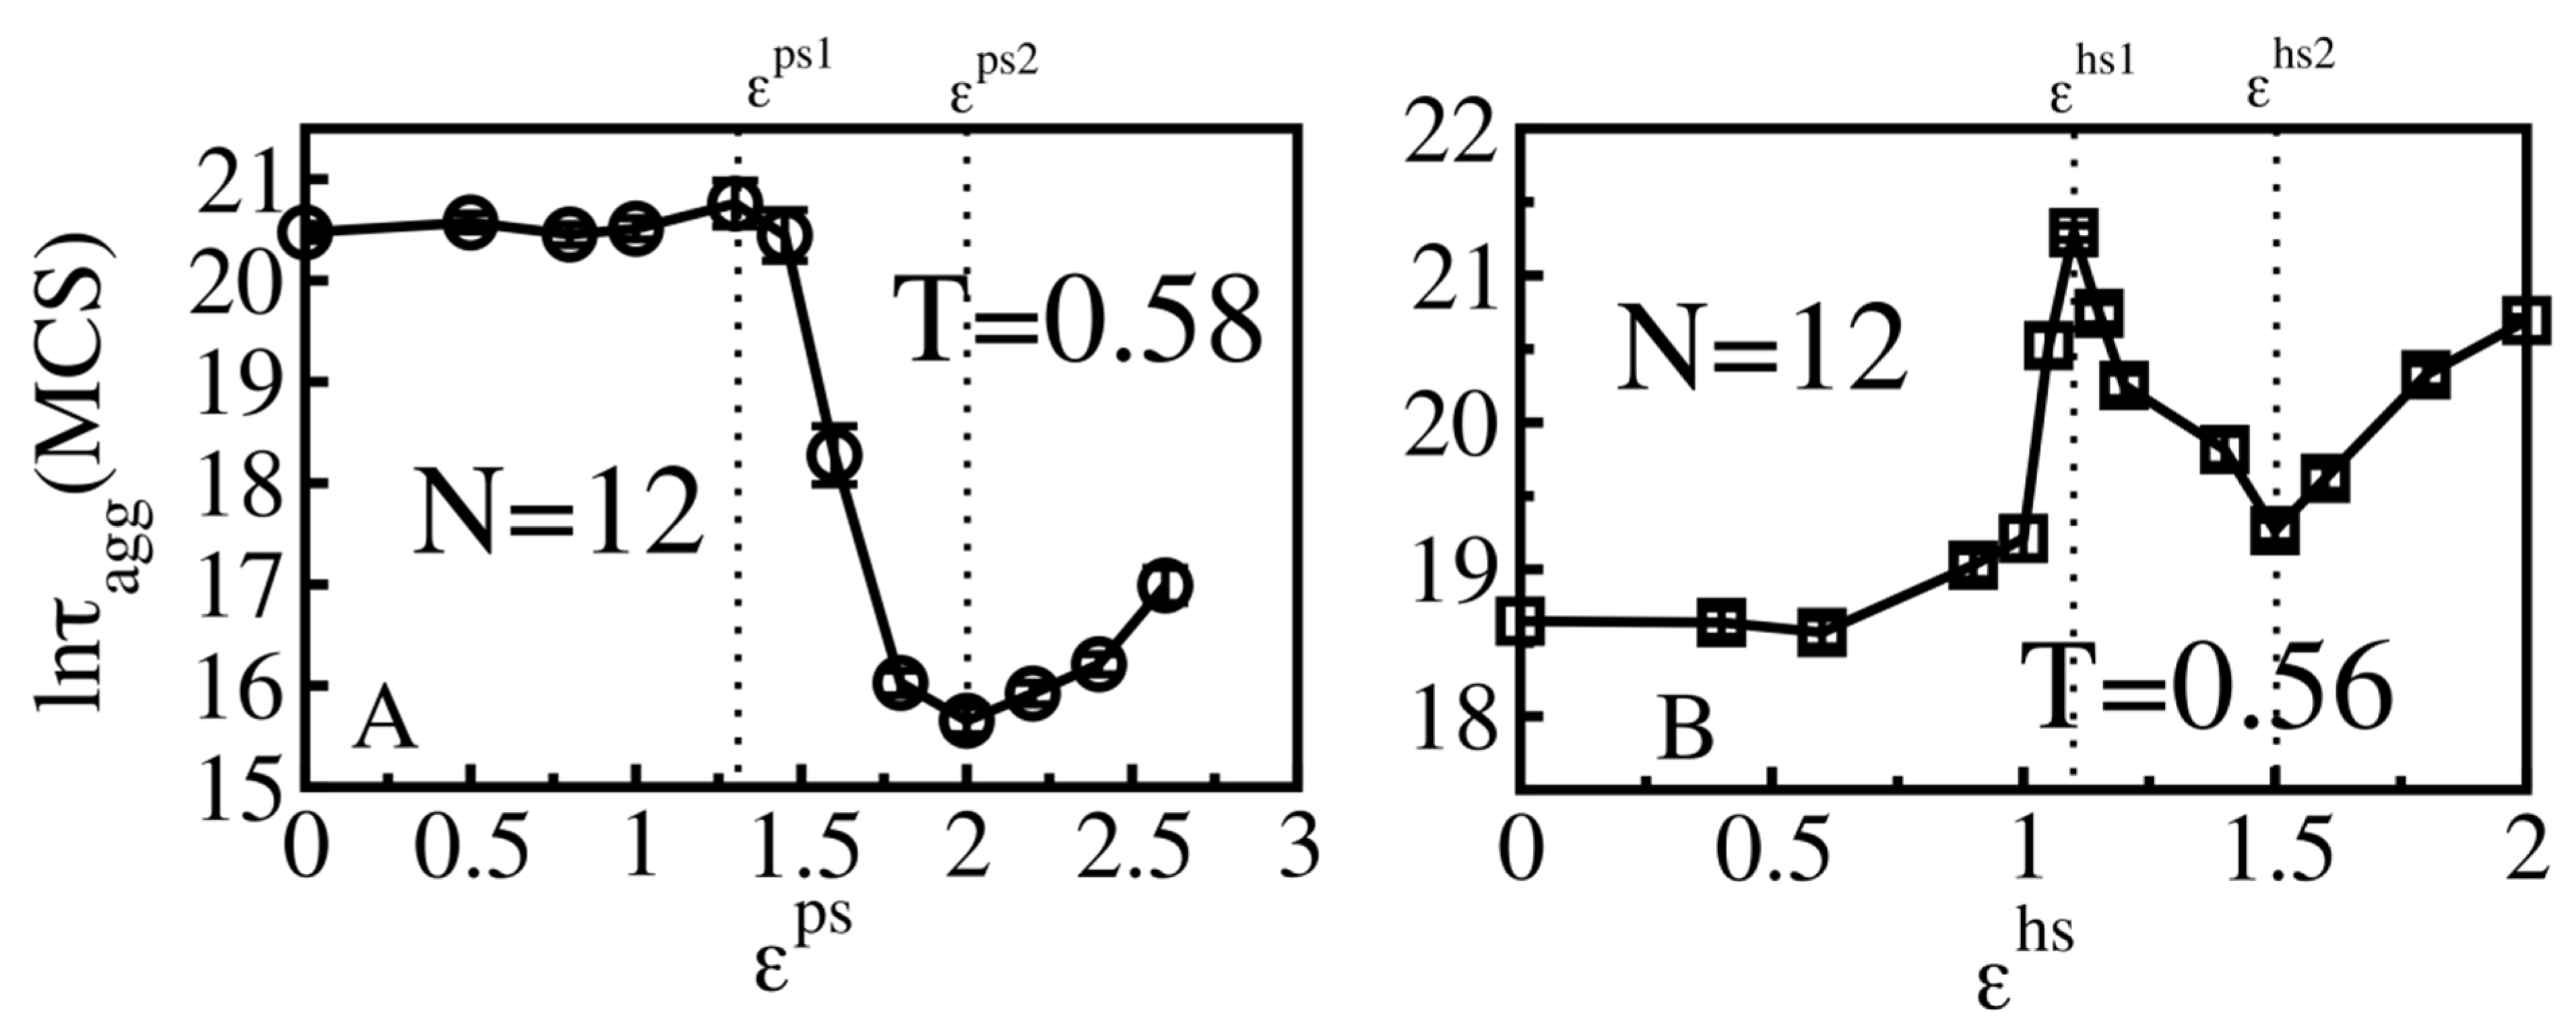
Thus far, we considered S-surfaces with a single ball roughness (Figure 3A). In this section, we explore two other cases: a D-surface, where a rough surface is created by randomly placed double balls on a smooth surface (Figure 3C); and a DS-surface, which consists of randomly distributed S-balls and D-balls (Figure 3B). For simplicity, it is assumed that the numbers of S and D balls on the DS-surface are the same.
As we can see in Figure 6, the dependence of lnτagg on roughness Θ for weakly, moderately, strongly absorbing hydrophilic and hydrophobic of S-surfaces remain the same for DS- and D-surfaces. This result implied that despite the difference in roughness nature, the dependence of the aggregation time on the roughness is driven a general principle, which depends on the interplay between energetic and entropic factors. For weakly (entropy driven, Figure 6A,D) and strongly (energy driven, Figure 6C,F) absorbing surfaces, the dependence of τagg on Θ is monotonic, while for the medium case (Figure 6B,E) the U-shape dependence occurs due to the competition between these two factors. Overall, our results agree with the experiment [29], which showed that at a high enough roughness, a surface can block the self-assemble process.

3.4. Size Effects

3.4.1. Smooth Surfaces

To examine the size effect, we extended simulations to a system of N = 12 peptides (Figure 7). For smooth surfaces, the dependence of the aggregation rate on the protein–surface interaction is similar to the N = 6 case (Figure 4). At T = 0.58 (Figure 7A), for attractive hydrophilic surfaces, no clear effect was seen for εps < εps1 = 1.3, however, the moderately absorbing surface (1.3 < εps < 2.0) remarkably accelerates the aggregation process, as lnτagg decreases from 20.5 to 15.65. The retardation by strongly attractive hydrophilic surfaces appears at εps > 2.0. The same scenarios occur for hydrophobic smooth surfaces (Figure 7B), however, at T = 0.56, weakly attractive hydrophobic smooth surfaces (εhs < εhs1 = 1.1) noticeably decreased the peptide self-assembly while the catalyzing effect of a medium absorbing smooth surface happened for 1.1 ≤ εhs ≤ 1.5. The strongly attractive surfaces with εhs > εhs2 = 1.5 restricted the formation of fibril-like structure of peptides.

3.4.2. Rough Surfaces

As in the smooth surface case, for N = 12 peptides, we also systematically investigated the effect of roughness on the aggregation time in the weak, medium and strong peptide–surface interaction regimes for both hydrophilic and hydrophobic surfaces. Qualitatively, the results are similar to the N = 6 case (compare Figure 6 and Figure 8). However, for εps = 1 (Figure 8A) the Θ dependence is rather weak and this is probably because the aggregation mainly occurs in the bulk due to the weak interaction between polypeptide chains and the hydrophilic surface. The surface effect is more pronounced in the case of hydrophobic surface with εhs = 0.8, as the aggregation time increases with increasing Θ (Figure 8D). The U-shape appears in the medium regime (Figure 8B,E), and this effect is stronger in the presence of D- and DS- surfaces. The highly attractive rough surfaces significantly increased the aggregation time and can even inhibit the process at Θ > 0.42 (Figure 8C) and Θ > 0.38 (Figure 8F) for the hydrophilic and hydrophobic cases, respectively.
Thus, the similar behavior of the N = 6 and N = 12 systems with smooth and rough surfaces of various types indicates that our results should be valid for larger systems.

4. Conclusions

Since protein aggregation, which is associated with neurodegenerative diseases, occurs in vivo, understanding the influence of various surfaces on this process plays a crucial role in developing new effective therapies. Furthermore, knowledge of the self-assembly mechanism on surfaces is also useful for developing novel materials of fibrillar structure. We constructed a simple lattice model that enabled us to theoretically access the effect of surface roughness on the aggregation kinetics of polypeptide chains. Our model is reliable as it can capture the experimental results of Robert Vacha et al. [35] obtained for both hydrophobic and hydrophilic smooth surfaces that the dependence of the aggregation time on the protein–surface interaction is nontrivial. In addition, our model can explain the experiment of Shezal et al. [29], showing that a rough surface retards the fibril formation and even block it at a high roughness level [48].
By a systematic investigation of the dependence of fibril formation time on the roughness of different surfaces, for the first time, we predicted the U-shape behavior, claiming that a rough surface can not only slow down the aggregation process, but can also accelerate it at a suitable degree of roughness. This can occur in a regime where the entropic factor competes with the energetic factor. Our results were obtained using simple models, but they should be applied to more complex systems, because their validity is guaranteed by general principles, but not by some details. This conclusion is partially supported by the fact that our modeling captures the slowing down or acceleration of aggregation on different surfaces such as lipid membranes [13,14,15,16], mica and glass [17,18], carbon nanotubes [21,22], nanoparticles [23,24], HOPG plane [25,26], etc. From this point of view, more advanced off-lattice models should not qualitatively change these results.
Our study also pointed out that the dependence of aggregation time on surface characteristics is complicated, not only by roughness, but also by the geometry of objects that make the surface non-smooth. It would be interesting to experimentally verify our prediction of the U-shaped dependence of aggregation time on roughness.
For the same sequence, the polypeptide chains form different fibrillary structures on the hydrophobic and hydrophilic surfaces (Figure 2). In particular, on a hydrophobic surface, the fibril-prone structure N* has the same structure as the native monomeric structure, which suggests that the hydrophobic surface alters the morphology of fibrils to a greater extent than the hydrophilic surface. This conclusion could be verified by other more advanced theoretical models and experiments.

Author Contributions

Conceptualization, N.T.C. and M.S.L.; methodology, N.T.C. and M.S.L.; simulation, N.T.C.; data analysis, N.T.C. and M.S.L.; writing—review and editing, N.T.C. and M.S.L.; supervision, M.S.L. All authors have read and agreed to the published version of the manuscript.

Funding

This research was funded by the National Science Centre, Poland, grant number 2015/19/P/ST3/03541, the Department of Science and Technology, Ho Chi Minh city, grant number 02/2018/Đ2/HĐ-KHCNTT and Ministry of Education and Training, project B2019.SPD.03, Vietnam.

Institutional Review Board Statement

Not applicable.

Informed Consent Statement

Not applicable.

Data Availability Statement

Our homemade code for MC simulations and the data that support the findings of this study are available from the corresponding author upon reasonable request.

Acknowledgments

We highly appreciate the supercomputer centre TASK in Gdansk, and PLGrid infrastructure, Poland for providing us with computational resources.

Conflicts of Interest

The authors declare no conflict of interest.

References

  1. Chiti, F.; Dobson, C.M. Protein Misfolding, Functional Amyloid, and Human Disease. Annu. Rev. Biochem. 2006, 75, 333–366. [Google Scholar] [CrossRef] [Green Version]
  2. Nasica-Labouze, J.; Nguyen, P.H.; Sterpone, F.; Berthoumieu, O.; Buchete, N.-V.; Coté, S.; De Simone, A.; Doig, A.J.; Faller, P.; Garcia, A.; et al. Amyloid β Protein and Alzheimer’s Disease: When Computer Simulations Complement Experimental Studies. Chem. Rev. 2015, 115, 3518–3563. [Google Scholar] [CrossRef]
  3. Nguyen, P.H.; Ramamoorthy, A.; Sahoo, B.R.; Zheng, J.; Faller, P.; Straub, J.E.; Dominguez, L.; Shea, J.-E.; Dokholyan, N.V.; De Simone, A.; et al. Amyloid Oligomers: A Joint Experimental/Computational Perspective on Alzheimer’s Disease, Parkinson’s Disease, Type II Diabetes, and Amyotrophic Lateral Sclerosis. Chem. Rev. 2021, 121, 2545–2647. [Google Scholar] [CrossRef] [PubMed]
  4. Ellis, R. Macromolecular crowding: Obvious but underappreciated. Trends Biochem. Sci. 2001, 26, 597–604. [Google Scholar] [CrossRef]
  5. O’Brien, E.P.; Straub, J.E.; Brooks, B.R.; Thirumalai, D. Influence of Nanoparticle Size and Shape on Oligomer Formation of an Amyloidogenic Peptide. J. Phys. Chem. Lett. 2011, 2, 1171–1177. [Google Scholar] [CrossRef] [Green Version]
  6. Co, N.T.; Hu, C.-K.; Li, M.S. Dual effect of crowders on fibrillation kinetics of polypeptide chains revealed by lattice models. J. Chem. Phys. 2013, 138, 185101. [Google Scholar] [CrossRef] [Green Version]
  7. Musiani, F.; Giorgetti, A. Chapter Two—Protein Aggregation and Molecular Crowding: Perspectives From Multiscale Simulations. In International Review of Cell and Molecular Biology; Sandal, M., Ed.; Academic Press: Cambridge, MA, USA, 2017; Volume 329, pp. 49–77. [Google Scholar]
  8. Li, C.; Mezzenga, R. The interplay between carbon nanomaterials and amyloid fibrils in bio-nanotechnology. Nanoscale 2013, 5, 6207–6218. [Google Scholar] [CrossRef]
  9. Yang, B.; Adams, D.J.; Marlow, M.; Zelzer, M. Surface-Mediated Supramolecular Self-Assembly of Protein, Peptide, and Nucleoside Derivatives: From Surface Design to the Underlying Mechanism and Tailored Functions. Langmuir 2018, 34, 15109–15125. [Google Scholar] [CrossRef] [Green Version]
  10. Pan, Y.; Banerjee, S.; Zagorski, K.; Shlyakhtenko, L.S.; Kolomeisky, A.B.; Lyubchenko, Y.L. Molecular Model for the Surface-Catalyzed Protein Self-Assembly. J. Phys. Chem. B 2020, 124, 366–372. [Google Scholar] [CrossRef]
  11. Cholko, T.; Barnum, J.; Chang, C.A. Amyloid-Beta (Abeta42) Peptide Aggregation Rate and Mechanism on Surfaces with Widely Varied Properties: Insights from Brownian Dynamics Simulations. J. Phys. Chem. B 2020, 123, 5549–5558. [Google Scholar] [CrossRef]
  12. Keller, A.; Grundmeier, G. Amyloid aggregation at solid-liquid interfaces: Perspectives of studies using model surfaces. Appl. Surf. Sci. 2020, 506, 144991. [Google Scholar] [CrossRef]
  13. Galvagnion, C.; Buell, A.K.; Meisl, G.; Michaels, T.C.; Vendruscolo, M.; Knowles, T.P.; Dobson, C.M. Lipid vesicles trigger α-synuclein aggregation by stimulating primary nucleation. Nat. Chem. Biol. 2015, 11, 229–234. [Google Scholar] [CrossRef] [PubMed] [Green Version]
  14. Lindberg, D.J.; Wesén, E.; Björkeroth, J.; Rocha, S.; Esbjörner, E.K. Lipid membranes catalyse the fibril formation of the amyloid-β (1–42) peptide through lipid-fibril interactions that reinforce secondary pathways. Biochim. Biophys. Acta (BBA) Biomembr. 2017, 1859, 1921–1929. [Google Scholar] [CrossRef] [PubMed]
  15. Morriss-Andrews, A.; Brown, F.L.H.; Shea, J.-E. A Coarse-Grained Model for Peptide Aggregation on a Membrane Surface. J. Phys. Chem. B 2014, 118, 8420–8432. [Google Scholar] [CrossRef] [PubMed]
  16. Butterfield, S.M.; Lashuel, H.A. Amyloidogenic Protein-Membrane Interactions: Mechanistic Insight from Model Systems. Angew. Chem. Int. Ed. 2010, 49, 5628–5654. [Google Scholar] [CrossRef] [PubMed]
  17. Lin, Y.-C.; Li, C.; Fakhraai, Z. Kinetics of Surface-Mediated Fibrillization of Amyloid-β (12–28) Peptides. Langmuir 2018, 34, 4665–4672. [Google Scholar] [CrossRef]
  18. Rabe, M.; Soragni, A.; Reynolds, N.P.; Verdes, D.; Liverani, E.; Riek, R.; Seeger, S. On-Surface Aggregation of α-Synuclein at Nanomolar Concentrations Results in Two Distinct Growth Mechanisms. ACS Chem. Neurosci. 2013, 4, 408–417. [Google Scholar] [CrossRef] [Green Version]
  19. Cabaleiro-Lago, C.; Lynch, I.; Dawson, K.A.; Linse, S. Inhibition of IAPP and IAPP(20−29)Fibrillation by Polymeric Nanoparticles. Langmuir 2010, 26, 3453–3461. [Google Scholar] [CrossRef] [PubMed]
  20. Mahmoudi, M.; Akhavan, O.; Ghavami, M.; Rezaee, F.; Ghiasi, S.M.A. Graphene oxide strongly inhibits amyloid beta fibrillation. Nanoscale 2012, 4, 7322–7325. [Google Scholar] [CrossRef] [PubMed]
  21. Ghule, A.V.; Kathir, K.M.; Suresh Kumar, T.K.; Tzing, S.-H.; Chang, J.-Y.; Yu, C.; Ling, Y.-C. Carbon nanotubes prevent 2,2,2 trifluoroethanol induced aggregation of protein. Carbon 2007, 45, 1586–1589. [Google Scholar] [CrossRef]
  22. Linse, S.; Cabaleiro-Lago, C.; Xue, W.-F.; Lynch, I.; Lindman, S.; Thulin, E.; Radford, S.E.; Dawson, K.A. Nucleation of protein fibrillation by nanoparticles. Proc. Natl. Acad. Sci. USA 2007, 104, 8691–8696. [Google Scholar] [CrossRef] [PubMed] [Green Version]
  23. Cabaleiro-Lago, C.; Quinlan-Pluck, F.; Lynch, I.; Lindman, S.; Minogue, A.M.; Thulin, E.; Walsh, D.M.; Dawson, K.A.; Linse, S. Inhibition of Amyloid β Protein Fibrillation by Polymeric Nanoparticles. J. Am. Chem. Soc. 2008, 130, 15437–15443. [Google Scholar] [CrossRef]
  24. Saraiva, A.M.; Cardoso, I.; Pereira, M.C.; Coelho, M.A.N.; Saraiva, M.J.; Möhwald, H.; Brezesinski, G. Controlling Amyloid-β Peptide(1-42) Oligomerization and Toxicity by Fluorinated Nanoparticles. ChemBioChem 2010, 11, 1905–1913. [Google Scholar] [CrossRef] [PubMed]
  25. Kang, S.-G.; Huynh, T.; Xia, Z.; Zhang, Y.; Fang, H.; Wei, G.; Zhou, R. Hydrophobic Interaction Drives Surface-Assisted Epitaxial Assembly of Amyloid-like Peptides. J. Am. Chem. Soc. 2013, 135, 3150–3157. [Google Scholar] [CrossRef] [PubMed]
  26. Zhang, F.; Du, H.-N.; Zhang, Z.-X.; Ji, L.-N.; Li, H.-T.; Tang, L.; Wang, H.-B.; Fan, C.-H.; Xu, H.-J.; Zhang, Y.; et al. Epitaxial Growth of Peptide Nanofilaments on Inorganic Surfaces: Effects of Interfacial Hydrophobicity/Hydrophilicity. Angew. Chem. Int. Ed. 2006, 45, 3611–3613. [Google Scholar] [CrossRef]
  27. Huang, R.; Su, R.; Qi, W.; Zhao, J.; He, Z. Hierarchical, interface-induced self-assembly of diphenylalanine: Formation of peptide nanofibers and microvesicles. Nanotechnology 2011, 22, 245609. [Google Scholar] [CrossRef]
  28. Morriss-Andrews, A.; Shea, J.-E. Kinetic pathways to peptide aggregation on surfaces: The effects of ?-sheet propensity and surface attraction. J. Chem. Phys. 2012, 136, 65103. [Google Scholar] [CrossRef]
  29. Shezad, K.; Zhang, K.; Hussain, M.; Dong, H.; He, C.; Gong, X.; Xie, X.; Zhu, J.; Shen, L. Surface Roughness Modulates Diffusion and Fibrillation of Amyloid-β Peptide. Langmuir 2016, 32, 8238–8244. [Google Scholar] [CrossRef]
  30. Nayak, A.; Dutta, A.K.; Belfort, G. Surface-enhanced nucleation of insulin amyloid fibrillation. Biochem. Biophys. Res. Commun. 2008, 369, 303–307. [Google Scholar] [CrossRef]
  31. Morriss-Andrews, A.; Bellesia, G.; Shea, J.-E. Effects of surface interactions on peptide aggregate morphology. J. Chem. Phys. 2011, 135, 85102. [Google Scholar] [CrossRef]
  32. Friedman, R.; Pellarin, R.; Caflisch, A. Amyloid Aggregation on Lipid Bilayers and Its Impact on Membrane Permeability. J. Mol. Biol. 2009, 387, 407–415. [Google Scholar] [CrossRef] [PubMed]
  33. Press-Sandler, O.; Miller, Y. Molecular mechanisms of membrane-associated amyloid aggregation: Computational perspective and challenges. Biochim. Biophys. Acta (BBA) Biomembr. 2018, 1860, 1889–1905. [Google Scholar] [CrossRef] [PubMed]
  34. Vácha, R.; Frenkel, D. Relation between Molecular Shape and the Morphology of Self-Assembling Aggregates: A Simulation Study. Biophys. J. 2011, 101, 1432–1439. [Google Scholar] [CrossRef] [PubMed] [Green Version]
  35. Vácha, R.; Linse, S.; Lund, M. Surface Effects on Aggregation Kinetics of Amyloidogenic Peptides. J. Am. Chem. Soc. 2014, 136, 11776–11782. [Google Scholar] [CrossRef] [PubMed]
  36. Cabaleiro-Lago, C.; Szczepankiewicz, O.; Linse, S. The Effect of Nanoparticles on Amyloid Aggregation Depends on the Protein Stability and Intrinsic Aggregation Rate. Langmuir 2012, 28, 1852–1857. [Google Scholar] [CrossRef] [PubMed]
  37. Cabaleiro-Lago, C.; Quinlan-Pluck, F.; Lynch, I.; Dawson, K.A.; Linse, S. Dual Effect of Amino Modified Polystyrene Nanoparticles on Amyloid β Protein Fibrillation. ACS Chem. Neurosci. 2010, 1, 279–287. [Google Scholar] [CrossRef]
  38. Abeln, S.; Vendruscolo, M.; Dobson, C.M.; Frenkel, D. A Simple Lattice Model That Captures Protein Folding, Aggregation and Amyloid Formation. PLoS ONE 2014, 9, e85185. [Google Scholar] [CrossRef] [PubMed]
  39. Gupta, P.; Hall, C.K.; Voegler, A.C. Effect of denaturant and protein concentrations upon protein refolding and aggregation: A simple lattice model. Protein Sci. 1998, 7, 2642–2652. [Google Scholar] [CrossRef] [Green Version]
  40. Tran, T.T.; Nguyen, P.H.; Derreumaux, P. Lattice model for amyloid peptides: OPEP force field parametrization and applications to the nucleus size of Alzheimer’s peptides. J. Chem. Phys. 2016, 144, 205103. [Google Scholar] [CrossRef]
  41. Sterpone, F.; Doutreligne, S.; Tran, T.T.; Melchionna, S.; Baaden, M.; Nguyen, P.H.; Derreumaux, P. Multi-scale simulations of biological systems using the OPEP coarse-grained model. Biochem. Biophys. Res. Commun. 2018, 498, 296–304. [Google Scholar] [CrossRef]
  42. Li, M.S.; Klimov, D.K.; Straub, J.E.; Thirumalai, D. Probing the mechanisms of fibril formation using lattice models. J. Chem. Phys. 2008, 129, 175101. [Google Scholar] [CrossRef] [Green Version]
  43. Co, N.T.; Lan, P.D.; Quoc Huy, P.D.; Li, M.S. Heat-induced degradation of fibrils: Exponential vs logistic kinetics. J. Chem. Phys. 2020, 152, 115101. [Google Scholar] [CrossRef] [PubMed]
  44. Co, N.T.; Li, M.S. New method for determining size of critical nucleus of fibril formation of polypeptide chains. J. Chem. Phys. 2012, 137, 095101. [Google Scholar] [CrossRef] [PubMed]
  45. Li, M.S.; Co, N.T.; Reddy, G.; Hu, C.-K.; Straub, J.E.; Thirumalai, D. Factors Governing Fibrillogenesis of Polypeptide Chains Revealed by Lattice Models. Phys. Rev. Lett. 2010, 105, 218101. [Google Scholar] [CrossRef] [PubMed]
  46. Betancourt, M.R.; Thirumalai, D. Pair potentials for protein folding: Choice of reference states and sensitivity of predicted native states to variations in the interaction schemes. Protein Sci. 2008, 8, 361–369. [Google Scholar] [CrossRef] [PubMed] [Green Version]
  47. Li, H.; Luo, Y.; Derreumaux, P.; Wei, G. Carbon Nanotube Inhibits the Formation of β-Sheet-Rich Oligomers of the Alzheimer’s Amyloid-β(16-22) Peptide. Biophys. J. 2011, 101, 2267–2276. [Google Scholar] [CrossRef] [Green Version]
  48. Shen, L.; Adachi, T.; Vanden Bout, D.; Zhu, X.-Y. A Mobile Precursor Determines Amyloid-β Peptide Fibril Formation at Interfaces. J. Am. Chem. Soc. 2012, 134, 14172–14178. [Google Scholar] [CrossRef]
Figure 1. (Left) Single peptide of 8 beads that are +HHPPHH- in N* conformation. Red, green, yellow and blue refer to amino acids −, H, P, +, respectively. Native structure of 1 peptide chain is showed next to N*. Fibril structure of the systems of N = 6 and N = 12 chains in the lattice model.
Biomolecules 11 00596 g001
Figure 2. Fibril structure of six polypeptide chains in bulk (A), on hydrophobic surface (B) and hydrophilic surface (C). Fibril structure of 12 polypeptide chains in bulk (D), on hydrophobic surface (E) and hydrophilic surface (F).
Biomolecules 11 00596 g002aBiomolecules 11 00596 g002b
Figure 3. Typical fibril-like structures for the system of N = 6 chains on rough hydrophilic surfaces with single balls (S-surface) (A), the combination of single and double balls (DS-surface) (B), and double balls (D-surface) (C). The fibril-like configuration of 12 chains on the hydrophilic DS- surface (D), and hydrophobic DS-surface (E).
Biomolecules 11 00596 g003
Figure 4. Dependence of lnτagg on the interaction of the systems consisting of N = 6 polypeptide chains for hydrophilic (A,C) and hydrophobic (B,D) smooth surfaces. The upper row exhibits the simulation at T = 0.54, the values εps1 = 1.0, εps2 = 1.4, εhs1 = 0.8 and εhs2 = 1.2 (black dashed lines) separate the three interaction regions corresponding to the three types of surfaces. Between ε U shape ps 1 = 0.9 and ε U shape ps 2 = 1.25 (blue dashed lines), we observed the U-shape dependence of lnτagg on the roughness degrees Θ for an S-point hydrophilic surface. A similar behavior occurs for a hydrophobic surface between ε U shape hs 1 = 0.7 and ε U shape hs 2 = 0.95 (blue dashed lines). The notations “ps” and “hs” refers to a hydrophilic and hydrophobic surface, respectively. The bottom row also shows correlation of lnτagg and interaction parameters εps of hydrophilic (C) and εhs hydrophobic (D) smooth surfaces for various temperatures and wider ranges of the interaction values. The bottom row shows the dependence of lnτagg on the interaction parameter εps of hydrophilic (C) and εhs of hydrophobic (D) smooth surfaces for various temperatures. Error bars are lower than data symbols.
Biomolecules 11 00596 g004aBiomolecules 11 00596 g004b
Figure 5. Impact of S-surface roughness on the aggregation of N = 6 peptides at temperature T = 0.54. All graphs on the left column (circular data points) display the dependence of the aggregation time lnτagg on the rough degree of different hydrophilic surfaces at various values of εps = 0.8 (A), εps = 1.2 (C) and εps = 1.4 (E). Similarly, the dependence ofτagg on ΘS for various hydrophobic surfaces is shown on the right graphs (square data points), εhs = 0.6 (B), εhs = 0.8 (D), and εhs = 1.2 (F).
Biomolecules 11 00596 g005
Figure 6. Dependence of lnτagg on Θ for N = 6 chains at T = 0.54. Red, green and black circles refer to the S-, DS-, D-surfaces, respectively. Results are shown for the weakly εps = 0.8 (A), medium εps = 1.2 (B), strongly εps = 1.4 (C) absorbing hydrophilic surfaces, as well as for weak εhs = 0.6 (D), medium εhs = 0.8 (E) and strong εhs = 1.2. (F) regimes of attractive hydrophobic surfaces. Error bars are lower than data symbols.
Biomolecules 11 00596 g006
Figure 7. Effect of various surfaces on the aggregation time of N = 12 polypeptide chains at T = 0.58 for smooth hydrophilic surfaces (A) and at T = 0.56 for hydrophobic surfaces (B). The dash lines at values εps1 = 1.3, εps2 = 2.0, εhs1 = 1.1 and εhs2 = 1.5 separate the different interaction ranges corresponding to different types of classified surfaces.
Biomolecules 11 00596 g007
Figure 8. Dependence of lnτagg on Θ of N = 12 peptides at T = 0.58 and 0.56 for hydrophilic (left column) and hydrophobic surfaces (right column). For hydrophilic surfaces, we considered εps = 1.0 (weak regime, A), 1.45 (medium, B), and 2.0 (strong, C). For hydrophobic surfaces the corresponding values εhs = 0.8 (D), 1.2 (E), and 1.5 (F).
Biomolecules 11 00596 g008
Table 1. Interaction energies between two beads of polypeptide chains eij in the lattice model. The energy is measured in εH, where εH is the hydrogen bond energy.
BeadsHP+
H−1.00.20.20.2
P0.2−0.2−0.2−0.2
+0.2−0.20.35−0.7
0.2−0.2−0.70.35
Table 2. Interaction energies between the polypeptide chain (H, P, +, and −) and beads of hydrophilic (Ps) and hydrophobic (Hs) surfaces. εps and εhs can be tuned in simulation.
Beads/BallsHP+
Ps0.2−εps−0.2−0.2
Hs−εhs0.20.20.2
Publisher’s Note: MDPI stays neutral with regard to jurisdictional claims in published maps and institutional affiliations.

