Article

Study of Synthesis Pathways of the Essential Polyunsaturated Fatty Acid 20:5n-3 in the Diatom Chaetoceros Muelleri Using 13C-Isotope Labeling

1
Univ Brest, CNRS, IRD, Ifremer, UMR 6539 LEMAR, F-29280 Plouzané, France
2
Department of Earth and Ocean Sciences, Center for Marine Science, University of North Carolina Wilmington, 5600 Marvin K. Moss Ln, Wilmington, NC 28403, USA
3
Institut Français de Recherche pour l’Exploitation de la Mer (IFREMER), Laboratoire des Sciences de l’Environnement Marin (LEMAR), UMR 6539 UBO/CNRS/IRD/IFREMER, CS 10070, 1625 Route de Sainte-Anne, 29280 Plouzane, France
4
Department of Biology, Elon University, 50 Campus Drive, Elon, NC 27244, USA
*
Authors to whom correspondence should be addressed.
Biomolecules 2020, 10(5), 797; https://doi.org/10.3390/biom10050797
Submission received: 30 March 2020 / Revised: 15 May 2020 / Accepted: 19 May 2020 / Published: 21 May 2020
(This article belongs to the Special Issue Lipids of Marine Algae)

Abstract

:
The present study sought to characterize the synthesis pathways producing the essential polyunsaturated fatty acid (PUFA) 20:5n-3 (EPA). For this, the incorporation of 13C was experimentally monitored into 10 fatty acids (FA) during the growth of the diatom Chaetoceros muelleri for 24 h. Chaetoceros muelleri preferentially and quickly incorporated 13C into C18 PUFAs such as 18:2n-6 and 18:3n-6 as well as 16:0 and 16:1n-7, which were thus highly 13C-enriched. During the experiment, 20:5n-3 and 16:3n-4 were among the least-enriched fatty acids. The calculation of the enrichment percentage ratio of a fatty acid B over its suspected precursor A allowed us to suggest that the diatom produced 20:5n-3 (EPA) by a combination between the n-3 (via 18:4n-3) and n-6 (via 18:3n-6 and 20:4n-6) synthesis pathways as well as the alternative ω-3 desaturase pathway (via 20:4n-6). In addition, as FA from polar lipids were generally more enriched in 13C than FA from neutral lipids, particularly for 18:1n-9, 18:2n-6 and 18:3n-6, the existence of acyl-editing mechanisms and connectivity between polar and neutral lipid fatty acid pools were also hypothesized. Because 16:3n-4 and 20:5n-3 presented the same concentration and enrichment dynamics, a structural and metabolic link was proposed between these two PUFAs in C. muelleri.

1. Introduction

Interest and consumption of marine products have steadily increased in recent years partly due to the health benefits provided by their high content in n-3 polyunsaturated fatty acids (PUFA) such as 20:5n-3 (eicosapentaenoic acid, EPA) and 22:6n-3 (docosahexaenoic acid, DHA) [1,2,3]. n-3 PUFAs are essential to all organisms including humans, but due to a lack of or insufficient de novo synthesis capabilities in most metazoans, n-3 PUFAs have to be obtained from the diet [4]. In the marine environment, primary producers (phototroph and heterotroph protists) are recognized for being the main suppliers of PUFAs to trophic webs [5,6,7], while on-going climate change may affect PUFAs availability and transfer across marine food webs [8,9,10,11,12,13]. Moreover, due to the high demand for human nutrition and aquaculture of carnivore species, n-3 PUFAs may become scarce because of overfishing and marine fish stock reduction [4]. Understanding how these protists synthetize EPA and DHA appears to be of a central interest prior to evaluating the influence of global changes in their availability and transfer to higher trophic levels up to human diets. Despite the economical and ecological significance of n-3 PUFAs, biological and biochemical processes responsible for the synthesis of these compounds by phytoplankton and microzooplankton are still to be fully understood.
Production of PUFAs by marine unicellular eukaryotes occurs via different metabolic pathways [14,15,16,17,18]. The most known conventional pathway is O2-dependent and starts with the fatty acid synthase pathway (FAS pathway), allowing fatty acid synthesis from acetyl-CoA and malonyl-CoA. It is followed by elongation and desaturation processes of the n-3 and n-6 pathways to give long-chain polyunsaturated fatty acids. These two pathways can be connected by the alternative ω-3 desaturase pathway [19]. Another route using Δ8 desaturase and bypassing the Δ6 desaturation of the n-3 and n-6 pathways has also been identified in Haptophytes microalgae such as Isochrysis galbana [20], Pavlova salina [21] or the coccolithophore Emiliania huxleyi [22] (Figure 1). The polyketide synthase pathway (PKS pathway) is an O2-independent pathway that can be found in heterotroph protists such as thraustochytrids [23,24] producing 20:5n-3 and 22:6n-3 [18,25,26].
Even if some microalgae species share all or part of these synthesis pathways, the PUFA composition of primary producers varies greatly according to species. For example, diatoms contain more 20:5n-3 than 22:6n-3, while dinophytes are richer in 22:6n-3 than 20:5n-3. As a comparison, in cyanobacteria or some chlorophytes phylum, EPA and DHA are absent or present in very low proportions (< 1% of total fatty acid (FA)) [5,6,27,28,29,30].
In higher plants as in diatoms, after synthesis by FAS pathway in the chloroplast, saturated fatty acids acyl groups have two possible destinations. The prokaryotic pathway, they can be retained in the chloroplast to form plastid glycerolipids (GL) from glycerol-3-phosphate (G3P) and serve for cell membrane structuration [31,32,33]. In the eukaryotic pathway, saturated fatty acids are transferred to the endoplasmic reticulum (ER) and acylated onto a glycerophosphate backbone to form glycerolipids and to take part in synthesis of other cell membrane lipids (such as phospholipids) or energy reserves (triacylglycerols (TAG)) [32]. According to these pathways (prokaryotic vs. eukaryotic), fatty acid composition of glycerolipids differs: GL synthesized in the chloroplast present a C16 acyl group at the position sn-2, while those produced in the ER present C18 or longer acyl group (C20, C22) at the sn-2 position [17]. In diatoms, TAG synthesis occurs in the ER from DAG [17,32]. TAG are synthesized in diatoms by the Kennedy pathway, which is acyl-CoA dependent and consists in stepwise acylations of G3P to give first lysophosphatidic acid, then phosphatidic acid, which is transformed in DAG and then in TAG by the action of acyl-CoA diacylglycerol acyltransferase (DGAT) [17,32]. Another acyl-CoA-independent pathway has been hypothesized in diatoms following the identification of enzymes and genes coding for the enzymes involved in this pathway in plants [17,34,35,36]. It would rely on the use of the phospholipid diacylglycerol acyltransferase (PDAT) to synthesize DAG from phosphatidylcholine (PC), which plays the role of an acyl donor. In plants, this pathway is supported by the PC acyl-editing machinery of the Lands cycle [32,33,37,38].
Recent studies dedicated to PUFA production have focused on studying gene expression for metabolic engineering to enhance DHA and EPA synthesis and production in microalgae or other producers initially unable to synthesize these compounds [35,39,40]. Other studies have centered on finding new genes or new enzymes implied in these FA synthesis pathways. Mülhroth et al. [35] showed that 106 genes encoding enzymes might be involved in fatty acids synthesis in Phaeodactylum tricornutum. However, our understanding is still incomplete especially regarding the routes followed and the production of these fatty acids of interest. Then, to improve our knowledge of PUFA production by microalgae, it is essential to better characterize quantitatively their synthesis pathways. For this purpose, 13C-labeling Flux Analysis offers an interesting approach that has been applied to Escherichia coli, yeast or microalgae [41,42,43]. The principle of stable isotope labeling relies on the monitoring of an isotopically labeled substrate incorporated into targeted organic macromolecules. Different metabolic intermediates or end products like fatty acids can be identified, and their level of labeling can be quantified, giving insights into biosynthesis pathways. Recently and thanks to instruments like Gas Chromatography coupled to Mass Spectrometry (GC–MS) or Gas Chromatography coupled to Isotopic Ratio Mass Spectrometry (GC–c-IRMS) allowing compound-specific isotope analysis (CSIA), substantial advances have been made, and it is now possible to resolve with high precision the isotopic composition of organic macromolecules including fatty acids [44,45,46,47].
In this study, a stable isotope (13C) labeling experiment was conducted with a monospecific culture of the diatom Chaetoceros muelleri in order to study the synthesis pathways of n-3 PUFA. This species has been chosen as the experimental model because diatoms are responsible for around 40% of the global primary production [48] and are characterized by a high 20:5n-3 content. The incorporation of the isotopic label (13C enriched CO2) was monitored in 10 FA, including 20:5n-3 and its potential precursors during 24 h and at a high temporal resolution (each 0.5 to 2 h). Progressive incorporation of the 13C into FA (from precursors to PUFA) and quantification of main fatty acid production allowed us to constrain FAS, C16 PUFAs pathways and n-3 and/or n-6 elongase/desaturase pathways and their involvement in EPA production by C. muelleri. To monitor its growth and physiological status, several cellular parameters (morphology, viability, esterase activity and lipid content) were also concomitantly measured by flow cytometry analysis (FCM).

2. Materials and Methods

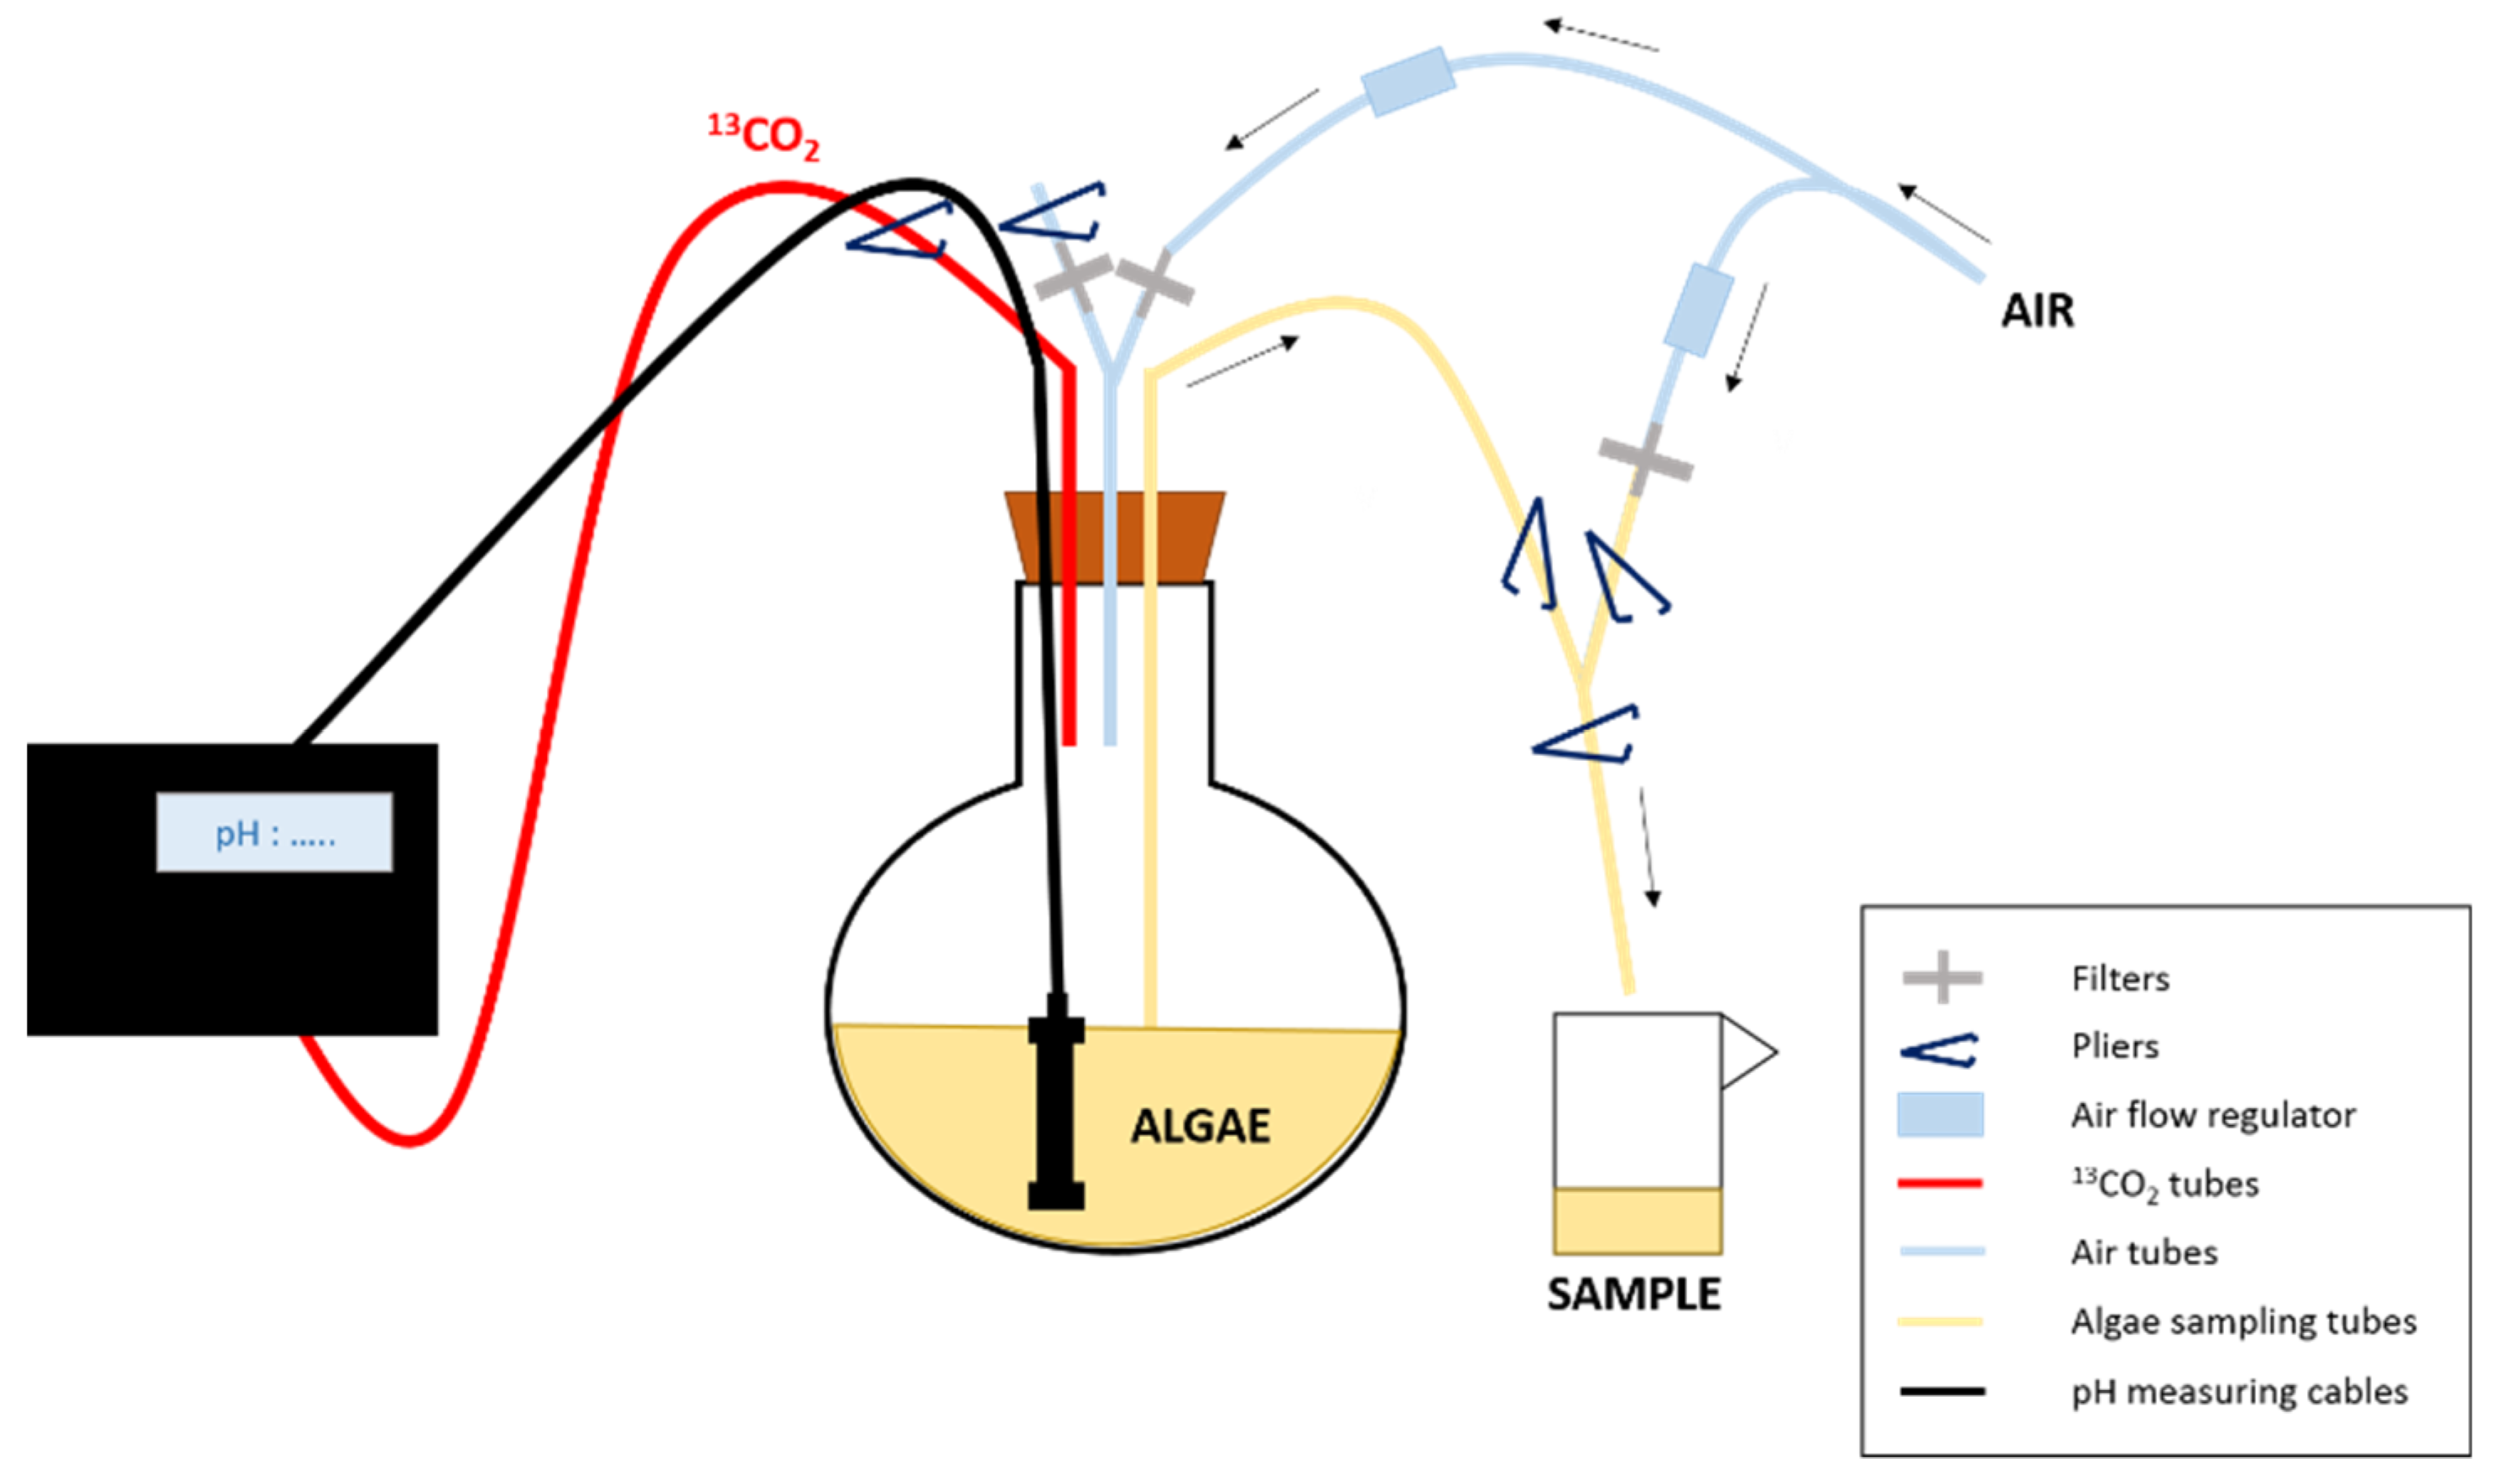
2.1. Algal Culture and Isotopic Labeling

Monospecific cultures were performed with the marine diatom C. muelleri (strain Culture Collection of Algae and Protozoa (CCAP) 1010-3 obtained from the CCAP culture collection of the Scottish Marine Institute, Oban, Scotland, UK, formerly listed as Chaetoceros neogracile VanLandingham 1968) in batch (total culture volume of 2 L) and under continuous light. Cultures were prepared with 1750 mL of sterile filtered seawater, 250 mL of algal inoculum and 2 mL of nutrients medium (Conway medium) and kept sterile during the whole experiment. Three culture balloons were prepared: two replicates for 13C labeling (balloon 1, Cm1 and balloon 2, Cm2) and one as a control (CmT) without 13C enrichment and fed with petrochemical CO2 (whose isotopic composition is equal to −37‰).
The three culture balloons (two labeled and one control) were subjected to a pre-culturing phase of 4 days before the start of the monitoring in order to sample the alga during the exponential growth phase and to promote label assimilation into FA. The isotopic labeling was performed using pure 13C-CO2 gas (Sigma-Aldrich, < 3%atom 18O, 99.0%atom 13C). The control balloon was continuously bubbled with unlabelled CO2 (i.e., petrochemical CO2). For each of the three replicates, the CO2 introduction in the culture was started just before the first sampling time (t0) and maintained during 24 h (t24). The growth of the two labeled replicates was controlled by 13CO2 addition using a pH-stat system, which fed the culture when pH was higher than 7.50 ± 0.05 (Figure 2). The whole experimental system was designed in order to keep the cells in a good physiological state (controlled by flow cytometry analyses) during the experiment.

2.2. Samples Collection

Sampling was performed during 24 h at 30 min, 1 h, 2 h, 3 h, 4 h and then every 2 h. A total of 16 samples were thus collected during the 24 h monitoring. The sampling system (Figure 2) was designed to collect the culture without opening the balloon and to avoid bacterial contamination and the introduction of atmospheric CO2. At each sampling time, a total volume of 52 mL per balloon was collected: (i) 2 mL for flow cytometry (FCM) analysis of cellular parameters, (ii) 25 mL for isotopic analysis of Particulate Organic Carbon (13C-POC) and Dissolved Inorganic Carbon (13C-DIC) by Elemental-Analyzer Isotope Ratio Mass Spectrometry (EA-IRMS), (iii) 25 mL for fatty acid analysis in neutral lipids (NL) and polar lipids (PL) by Gas-Chromatography Flame Ionisation Detection (GC-FID) and (iv) compound-specific isotope analysis (CSIA) of FA (13C-FA) as described in the following paragraphs.

2.3. Flow Cytometry Analysis

Algae growth cellular variables were measured using an Easy-Cyte Plus 6HT flow cytometer (Guava Merck Millipore®, Darmstadt, Germany) equipped with a 488 nm blue laser, detectors of forward (FSC) and side (SSC) light scatter, and three fluorescence detectors: green (525/30 nm), yellow (583/26 nm) and red (680/30 nm). Cell variables i.e., forward scatter (forward scatter, FSC), side scatter (side scatter, SSC) and red fluorescence (FL3, red emission filter long pass, 670 nm) were used to identify and select the C. muelleri cell population. FSC and SSC give, respectively, information on the relative size and complexity of cells [49,50,51]. The flow cytometry measurements were performed on fresh (living) samples.
Three fluorescent probes were used to assess viability, esterase activity, and lipid content according to Seoane et al. [52]. Briefly, the SYTOX (Molecular Probes, Invitrogen, Eugene OR, USA, final concentration of 0.05 µM), a probe that binds to the DNA of a permeable or permeabilized cell, was used to estimate the percentage of dead cells in culture sample [53]. The fluorescein diacetate (FDA, Molecular Probes, Invitrogen, Eugene OR, USA #F1303 at a final concentration of 6 µM, emission wavelength 525 nm), a substrate for intracellular esterases, was used to provide a proxy of primary metabolism. As cell membrane integrity is essential for the retention of FDA product (fluorescein) by the cell, it is also used to estimate the percentage of metabolically active cells [52]. Cells with a high level of green fluorescence (FL1) correspond to high esterase activity, while cells with a low FL1 fluorescence are considered cells with reduced esterase activity (reduced metabolism) or dead/dying cells. The BODIPY probe (BODIPY 505/515 FL; Molecular Probes, Invitrogen, Eugene OR, USA, final concentration of 10 mM), which stains lipid droplets within microalgae cells, was used as a proxy of lipid reserves [52]. The green fluorescence emitted is proportional to the quantity of lipid reserve present in the cells.
The concentration of bacteria was also monitored during the experiment according to Seoane et al. [52] by using SYBR®Green (Molecular Probes, Invitrogen, Eugene OR, USA, #S7563), a DNA staining fluorescence probe which allows detection of DNA stained bacteria on FL1 detector (green fluorescence). Results are given as concentration of bacteria cells per mL.

2.4. POC Concentration and Bulk Carbon Isotopic Composition

Samples (25 mL) for POC concentration and stable isotopic composition were filtered through pre-combusted 0.7 μm nominal pore-size glass fiber filters (Whatman GF/F, Maidstone, UK). The filter was then dried at T = 55 °C, fumed with hydrochloric acid to remove particulate inorganic carbon, subsampled with a 13 mm punch and encapsulated into tin caps for further analysis ([54,55] and references therein).
POC concentrations of all samples were measured using a CE Elantech NC2100 (Thermo Scientific, Lakewood, NJ, USA) according to the protocol of the United States Environmental Protection Agency [56] (with acetanilide (99.9% purity, C8H19NO CASRN 103-84-4) as a standard. Briefly, the encapsulated samples were combusted at 980 °C in the elemental analyzer. The combustion products were passed over a copper tube with chromium oxide/cobaltous acetate oxide as catalysts to aid the conversion of carbon into carbon dioxide. The mixture was released to thermal conductivity detectors to measure the levels of carbon in a sample ([55] and references therein). The measured values are corrected with those of known standards. POC concentration is given in mmol·L−1.
Bulk carbon isotopic composition (13C POC) was analyzed by continuous flow on an Elemental Analyzer (EA, Flash 2000; Thermo Scientific, Bremen, Germany) coupled to a Delta V+ isotope ratio mass spectrometer (Thermo Scientific, Bremen, Germany). Calibration was performed with certified international standards and in-house standards described in Table 1.

2.5. DIC Concentrations and Bulk Carbon Isotopic Composition

Samples for Dissolved Inorganic Carbon concentration and stable isotope composition were collected from the filtrate of POC samples (25 mL). Twelve milliliters was put into Labco Exetainer (Labco, Wales, UK) tubes, poisoned with 20 µL of mercury chloride (HgCl2) and stored at 4 °C until Gas-Bench Isotope Ratio Mass Spectrometer (GB–IRMS) analysis. The sample preparation for DIC concentration and 13C-DIC measurements was made according to Assayag et al. [57]. Briefly, 1 mL subsample was added to the mixed tube, then 23 droplets of phosphoric acid (H3PO4) were introduced into a closed Exetainer tube (Labco, Wales, UK) that is flushed with ultra-pure helium gas to eliminate the residual air and avoid contamination. The H3PO4 addition converted all DIC species into CO2 [57], and after 15 h, equilibration at room temperature CO2 was measured in the headspace of a Gas Bench coupled to a Delta Plus mass spectrometer from Thermo Scientific, Bremen, Germany (GB–IRMS).

2.6. Isotopic Data Processing

Because we consider here 13C-enriched samples, we used the atomic abundance of 13C in percentage (%atom of 13C) to express the results. Conversion between delta notation and %atom13C notation can be done as follows [58]:
% atom C 13 = 100 × ( δ C 13 1000 + 1 ) × ( C 13 C 12 ) V P D B 1 + ( δ C 13 1000 + 1 ) × ( C 13 C 12 ) V P D B
With (13C/12C)PDB = 0.0112372, the ratio of 13C to 12C in the international reference Vienna-Pee Dee Belemnite (V-PDB) standard.
Atomic enrichment (AE) is then calculated from %atom13C POC-corrected by POCcontrol values (1.08% close of the natural values observed in the marine environment) and atom %13C DIC-corrected by control abundance values (DICcontrol = 1.12%) according to the following equations:
A E P O C = % a t o m C 13 P O C c o n t r o l
A E D I C = % a t o m C 13 D I C c o n t r o l

2.7. Fatty Acids Analysis

2.7.1. Lipid Extraction

After filtration on pre-combusted 47 mm GF/F filters (porosity 0.7 µm) of 25 mL of culture, lipases were deactivated by addition of boiling water, and lipids were extracted by diving the filter into 6 mL solvent mixture (chloroform:methanol, 2/1, v/v). Lipid extracts were flushed with nitrogen and stored at −20 °C until analysis.

2.7.2. Separation of Neutral and Polar Lipids

Total lipid extracts were separated into neutral and polar fractions following the method of Le Grand et al. [59]. In brief, 1 mL of extract was evaporated to dryness under nitrogen, recovered with 3 washes of 0.5 mL of chloroform:methanol (98:2 v:v; final volume 1.5 mL) and spotted at the top of a silica gel column (40 mm × 4 mm, silica gel 60A 63–200 µm rehydrated with 6% H2O, 70–230 mesh, Sigma-Aldrich, Darmstadt, Germany). Neutral lipids fraction (NL) was eluted using chloroform:methanol (98:2 v:v; 10 mL) and polar lipid fraction (PL) with methanol (20 mL). Both were collected in glass vials containing an internal standard (C23:0, 2.3 µg). Lipid fractions were then stored at −20 °C until further analysis.

2.7.3. Transesterification of FAME

Fatty acids methyl esters (FAME) transesterification was conducted according to the protocol described by Mathieu-Resuge et al. [60]. In brief, after evaporation to dryness of the neutral and polar lipid fractions, transesterification was made by adding 0.8 mL of H2SO4/methanol mixture (3.4%, v:v) to the lipid extract and heated at 100 °C for 10 min. Hexane (0.8 mL) and distilled water saturated with hexane (1.5 mL) were added. The lower MeOH–water phase is discarded after homogenization and centrifugation. Hexane fraction containing FAME was washed two more times with another 1.5 mL of distilled water.

2.7.4. Fatty Acid Analysis by Gas Chromatography Flame Ionisation Detector (GC-FID)

Analysis of FAME was performed on a Varian CP8400 gas chromatograph (Agilent, Santa Clara CA, USA) using simultaneously two parallel columns: a polar (DB-WAX: 30 mm × 0.25 mm ID × 0.25 µm, Agilent, Santa Clara CA, USA and apolar column (DB-5: 30 m × 0.25 mm ID × 0.25 µm, Agilent, Santa Clara CA, USA). The temperature program used by the gas chromatograph was the following: first, an initial heating to 0 from 150 °C at 50 °C·min−1, then to 170 °C at 3.5 °C·min−1, to 185 °C at 1.5 °C·min−1, to 225 at 2.4 °C·min−1 and finally to 250 °C at 5.5 °C·min−1 and maintained for 15 min. The FAME were identified by comparison of their retention time with commercial and in-house standards mixtures as shown by the two columns used in Supplementary Data.
Fatty acid concentrations are expressed in µmolC·L−1. Fatty acids are grouped according to their hypothesized synthesis pathways as described in Table 2.

2.7.5. Fatty Acids Compound-Specific Isotope Analysis

Compound-specific isotope analyses (CSIA) of FAME were performed following the protocol described by Mathieu-Resuge et al. [60]. CSIA analyses were made on a Thermo Scientific (Bremen, Germany) GC ISOLINK TRACE ULTRA using the same apolar column as for FAME analysis by GC–FID (DB-5: 30 m × 0.25 mm ID × 0.25 µm, Agilent, Santa Clara CA, USA). Only the fatty acids with the highest concentrations and involved in the previously described pathways as measured by GC–FID analyses were considered for CSIA (concentrations superior to 250 µg·L−1). The minor FA presenting a too low signal amplitude (< 800 mV) on the GC-c-IRMS (generally below 100 µg·L−1) did not allow precise isotope ratio analysis and were not considered. Although 18:1n-9 and 18:3n-3 co-eluted on the apolar column of GC-c-IRMS, most of the isotopic signature is attributed to 18:1n-9. The amount of 18:1n-9 is about 55 times higher than the 18:3n-3 in neutral lipids (NL) and about 30 times higher in polar lipids (PL) in C. muelleri (49.7 ± 5.8 versus 0.9 ± 0.4 µmolC·L−1 for NL, respectively, for 18:1n-9 and 18:3n-3 and 24.7 ± 5.1 versus 0.9 ± 0.3 µmol·L−1 for PL, respectively, for 18:1n-9 and 18:3n-3).
The GC–c-IRMS measured values were calibrated using the F8-3 standard mixture of eight fatty acid ethyl and methyl esters (14:0, 16:0, 18:0 and 20:0 with values ranging from −26.98 ± 0.02‰ to −30.38 ± 0.02‰) supplied by Indiana University Stable Isotope Reference Materials (Schimmelman, Indiana University IN, USA) as described in Mathieu-Resuge et al. [60].

2.7.6. Compound-Specific Isotope Data Processing

FA atomic enrichment (AEFA) is calculated with the same method as for AEPOC and AEDIC, with %atom13C for each FA given by GC-c-IRMS analysis (AEFAcontrol = AEFAnat = 1.08%). AEFA is then used for estimating the specific uptake rate in FA (µFA in h−1) with the following equation:
µ F A = A E F A A E D I C t 24 t 6
µFA is calculated between t6 (once the DIC 13C enrichment started) and t24 (end of the enrichment experiment). AEFA corresponds to cell enrichment at t24 (AEFA at t6 is considered as negligible). The AEDIC is calculated using the time-weighted average of AEDIC over the same time period.
Finally, to evidence FA synthesis conversion from fatty acid A and fatty acid B in C. muelleri, we calculated the AEFA ratio (R) of product B over supposed precursor A. If the calculated ratio is close to 1 with a confidence interval at α = 0.1, the fatty acids A and B are supposed at equilibrium and synthesized simultaneously or very closely. If the ratio is below 1, the transformation of A into B is possible but slower. On the contrary, if the ratio is above 1, A is not considered as a precursor of B. R is defined as follows.
R   = AE FA ( B ) AE FA ( A )
with A as the fatty acid that is supposed to be a precursor of fatty acid B and AEFA(A) and AEFA(B) their respective atomic enrichments at each sampling time.

2.8. Statistical Analysis

To assess the potential effect of time and difference between balloons during algae development and 13CO2 incorporation, PERMANOVA analysis was used on the FA mass percentage separately in NL and PL. Principal component analysis (PCA) coupled with similarity percentage analysis (SIMPER) allowed us to distinguish fatty acids that are the main ones responsible for the overall observed variability (80%). A Spearman test was also conducted on fatty acids abundance in both PL and NL to explore the relationship between fatty acids. All statistical analyses were conducted using R software.

3. Results

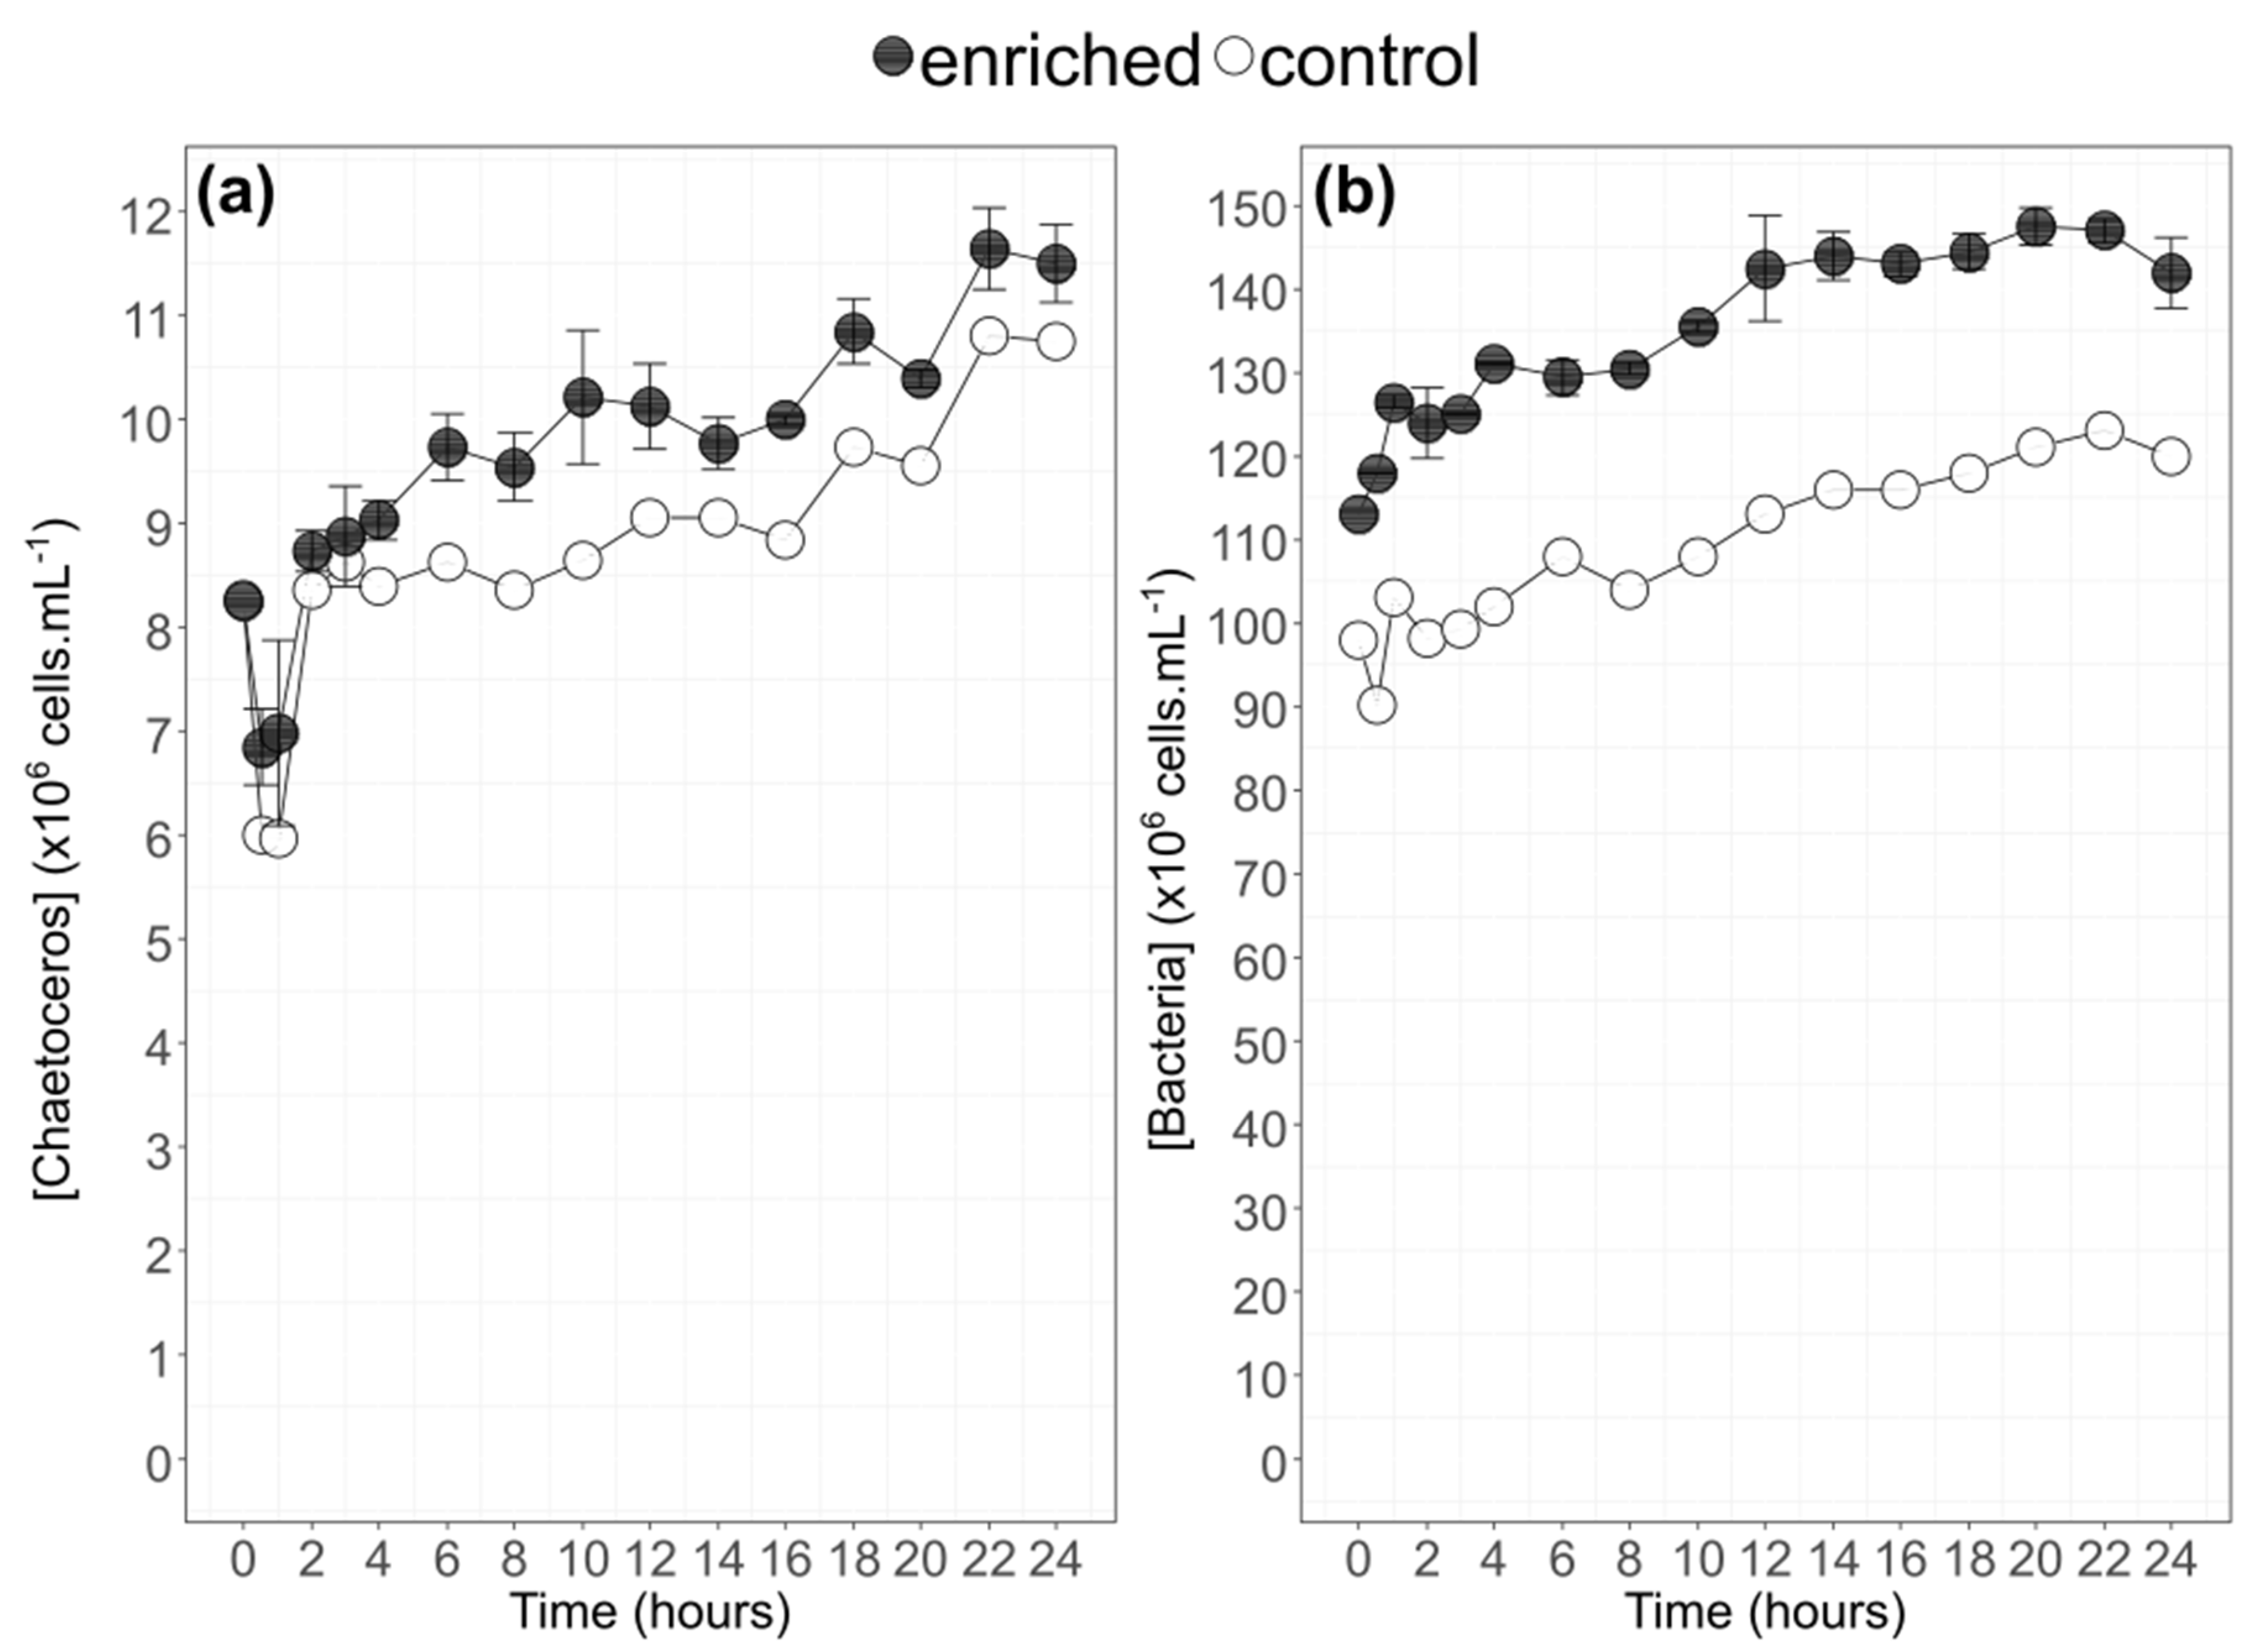
3.1. Algae Physiology During Growth

During the 24 h of the experiment, the replicability between balloons (enriched (Cm1 and Cm2) vs. control (CmT)) was satisfying with similar increasing trends despite slightly lower concentrations of the control ballon. C. muelleri grew on average from 8.3 × 10⁶ cells·mL−1 at t0 to 11.3 × 10⁶ cells·mL−1 at t24, corresponding to an increase factor of 1.4 (Figure 3). By considering the time point 0.5 (average of 6.6 × 10⁶ cells·mL−1), this growth was closer to a doubling of cell density (factor 1.7). After t16, a sharper increase was observed for the three balloons with a change in general slope (9.2 × 10⁵ cells·mL−1·h−1 to 19.1 × 10⁵ cells·mL−1·h−1). Bacteria concentrations increased from 1.1 × 10⁸ cells·mL−1 (t0) on average to 1.4 × 10⁸ cells·mL−1 t24. The strongest increase in bacteria concentrations was observed between t0 and t14. After t14, the bacteria content concentration reached a plateau at 1.4 × 10⁸ cells·mL−1 for enriched balloons and 1.2 × 10⁸ cells·mL−1 for the control balloon, being slightly lower than enriched balloons (factor 1.2) (Figure 3).
During the experiment, cell size (FSC), cell complexity (SSC) remained relatively constant and similar between control and enriched balloon (respectively 153.3 ± 1.7 a.u (Student test, p-value < 0.001 and ANOVA p.value = 0.3) and 52.8 ± 2.5 a.u (Student test, p-value < 0.001 and ANOVA p-value = 0.07), on average for the three balloons) (Table 3). Chlorophyll content (FL3) decreased slightly between t0.5 and t24 from 274 a.u to 257 a.u. Percentage of dead cells as measured by SYTOX DNA staining (Green fluorescence, FL1) remained below 4% and averaged around 2%, while the percentage of metabolically active cells averaged at 90% with the lowest value at 86%. It revealed that C. muelleri cells were in good health for the whole experiment. The neutral lipid content as estimated by BODIPY staining, (green fluorescence, FL1) was more variable. It averaged at 225.3 a.u, but time points t0, t6, t10, t12, and t18 were lower (166.0 ± 16.0 a.u), with the lowest value at t0 (154.1 a.u) and the highest at t20 (308.5 a.u) (Table 3).

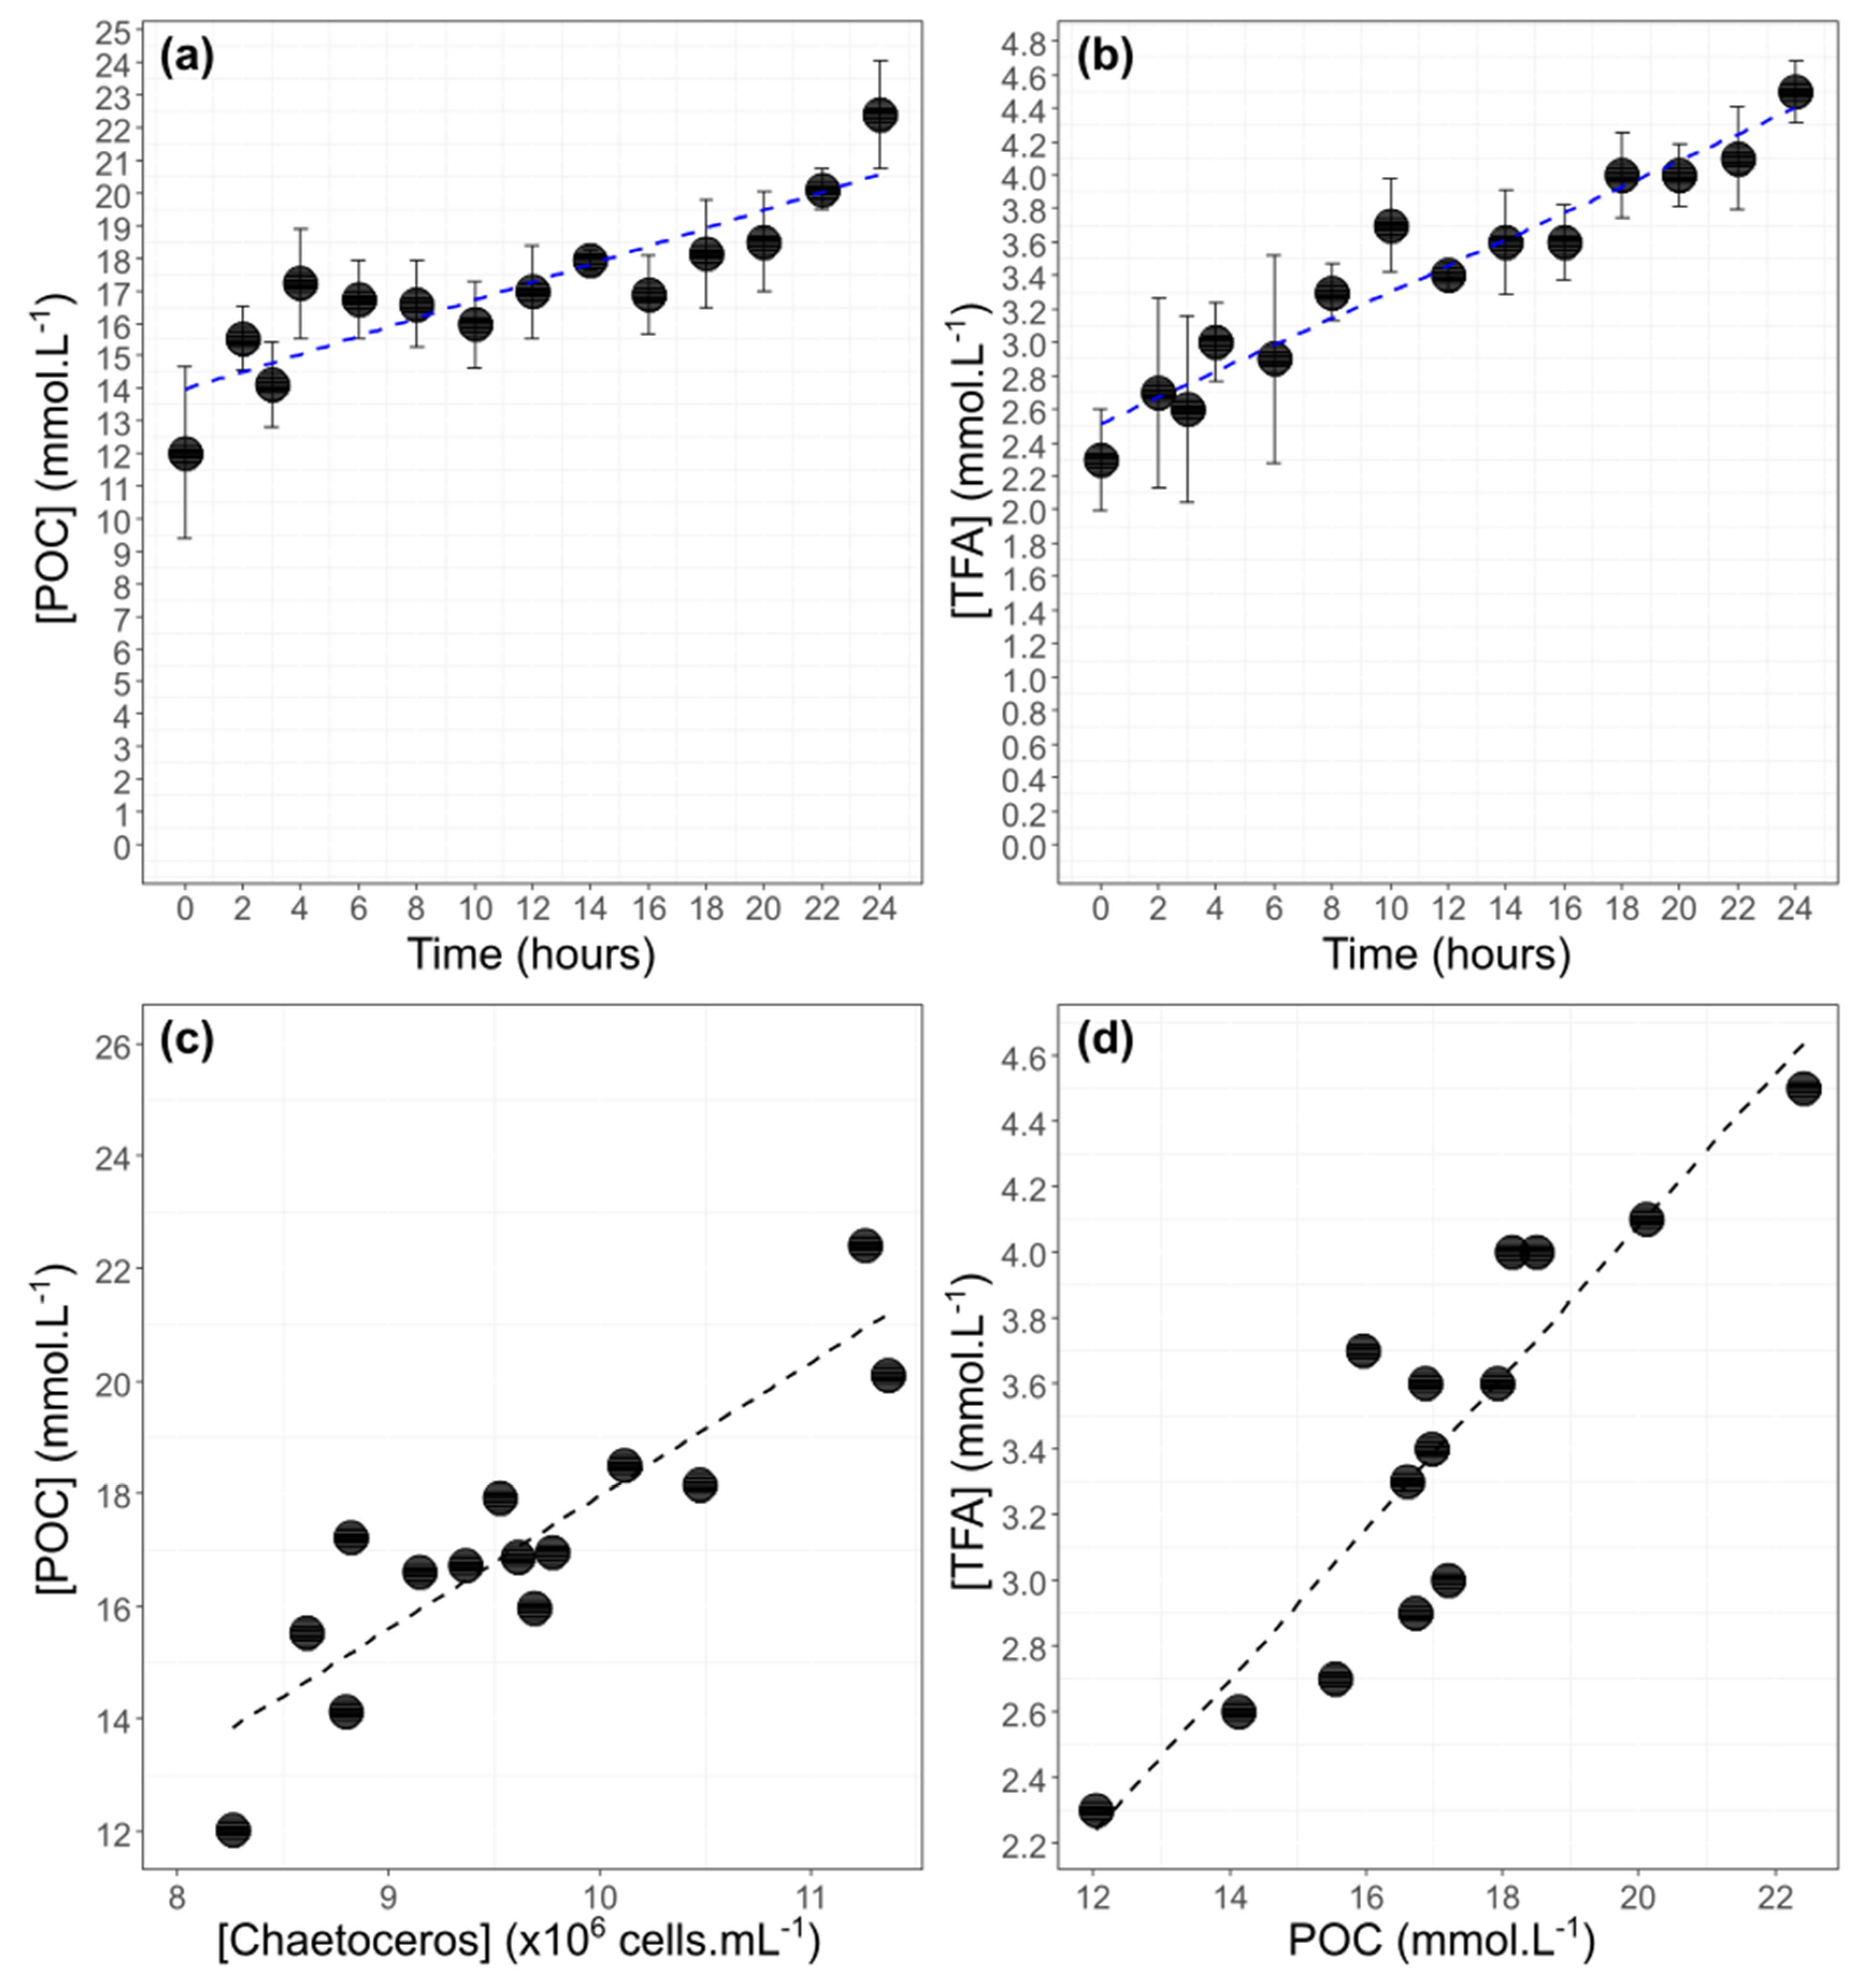
3.2. Correlation between POC Concentration, TFA Concentration, and Cell Abundance

Particulate Organic Carbon concentration increased slowly between t0 and t24 for the three replicates from 12.3 ± 2.6 mmol·L−1 to 22.4 ± 1.6 mmol·L−1 (Figure 4). Total Fatty Acids (TFA) concentration increased progressively with time between 2.3 ± 0.3 mmol·L−1 to 4.5 ± 0.2 mmol·L−1 (Figure 4). POC concentration was linearly correlated to cell abundance (y = 2.4x − 5.7, R2 = 79%, p-value < 0.001) and to TFA concentration (y = 0.23x − 0.5, R2 = 80%, p-value < 0.001) (Figure 4). The slope of the first regression is 2.4 × 10⁻³ nmol.cells−1 which is a proxy of carbon content per cell (Figure 4). The slope of the regression between TFA and POC concentration gives an estimation of the proportion of fatty acids in the particulate organic pool during exponential growth. On average, TFA is estimated to represent 23% of POC for the three balloons (Figure 4).

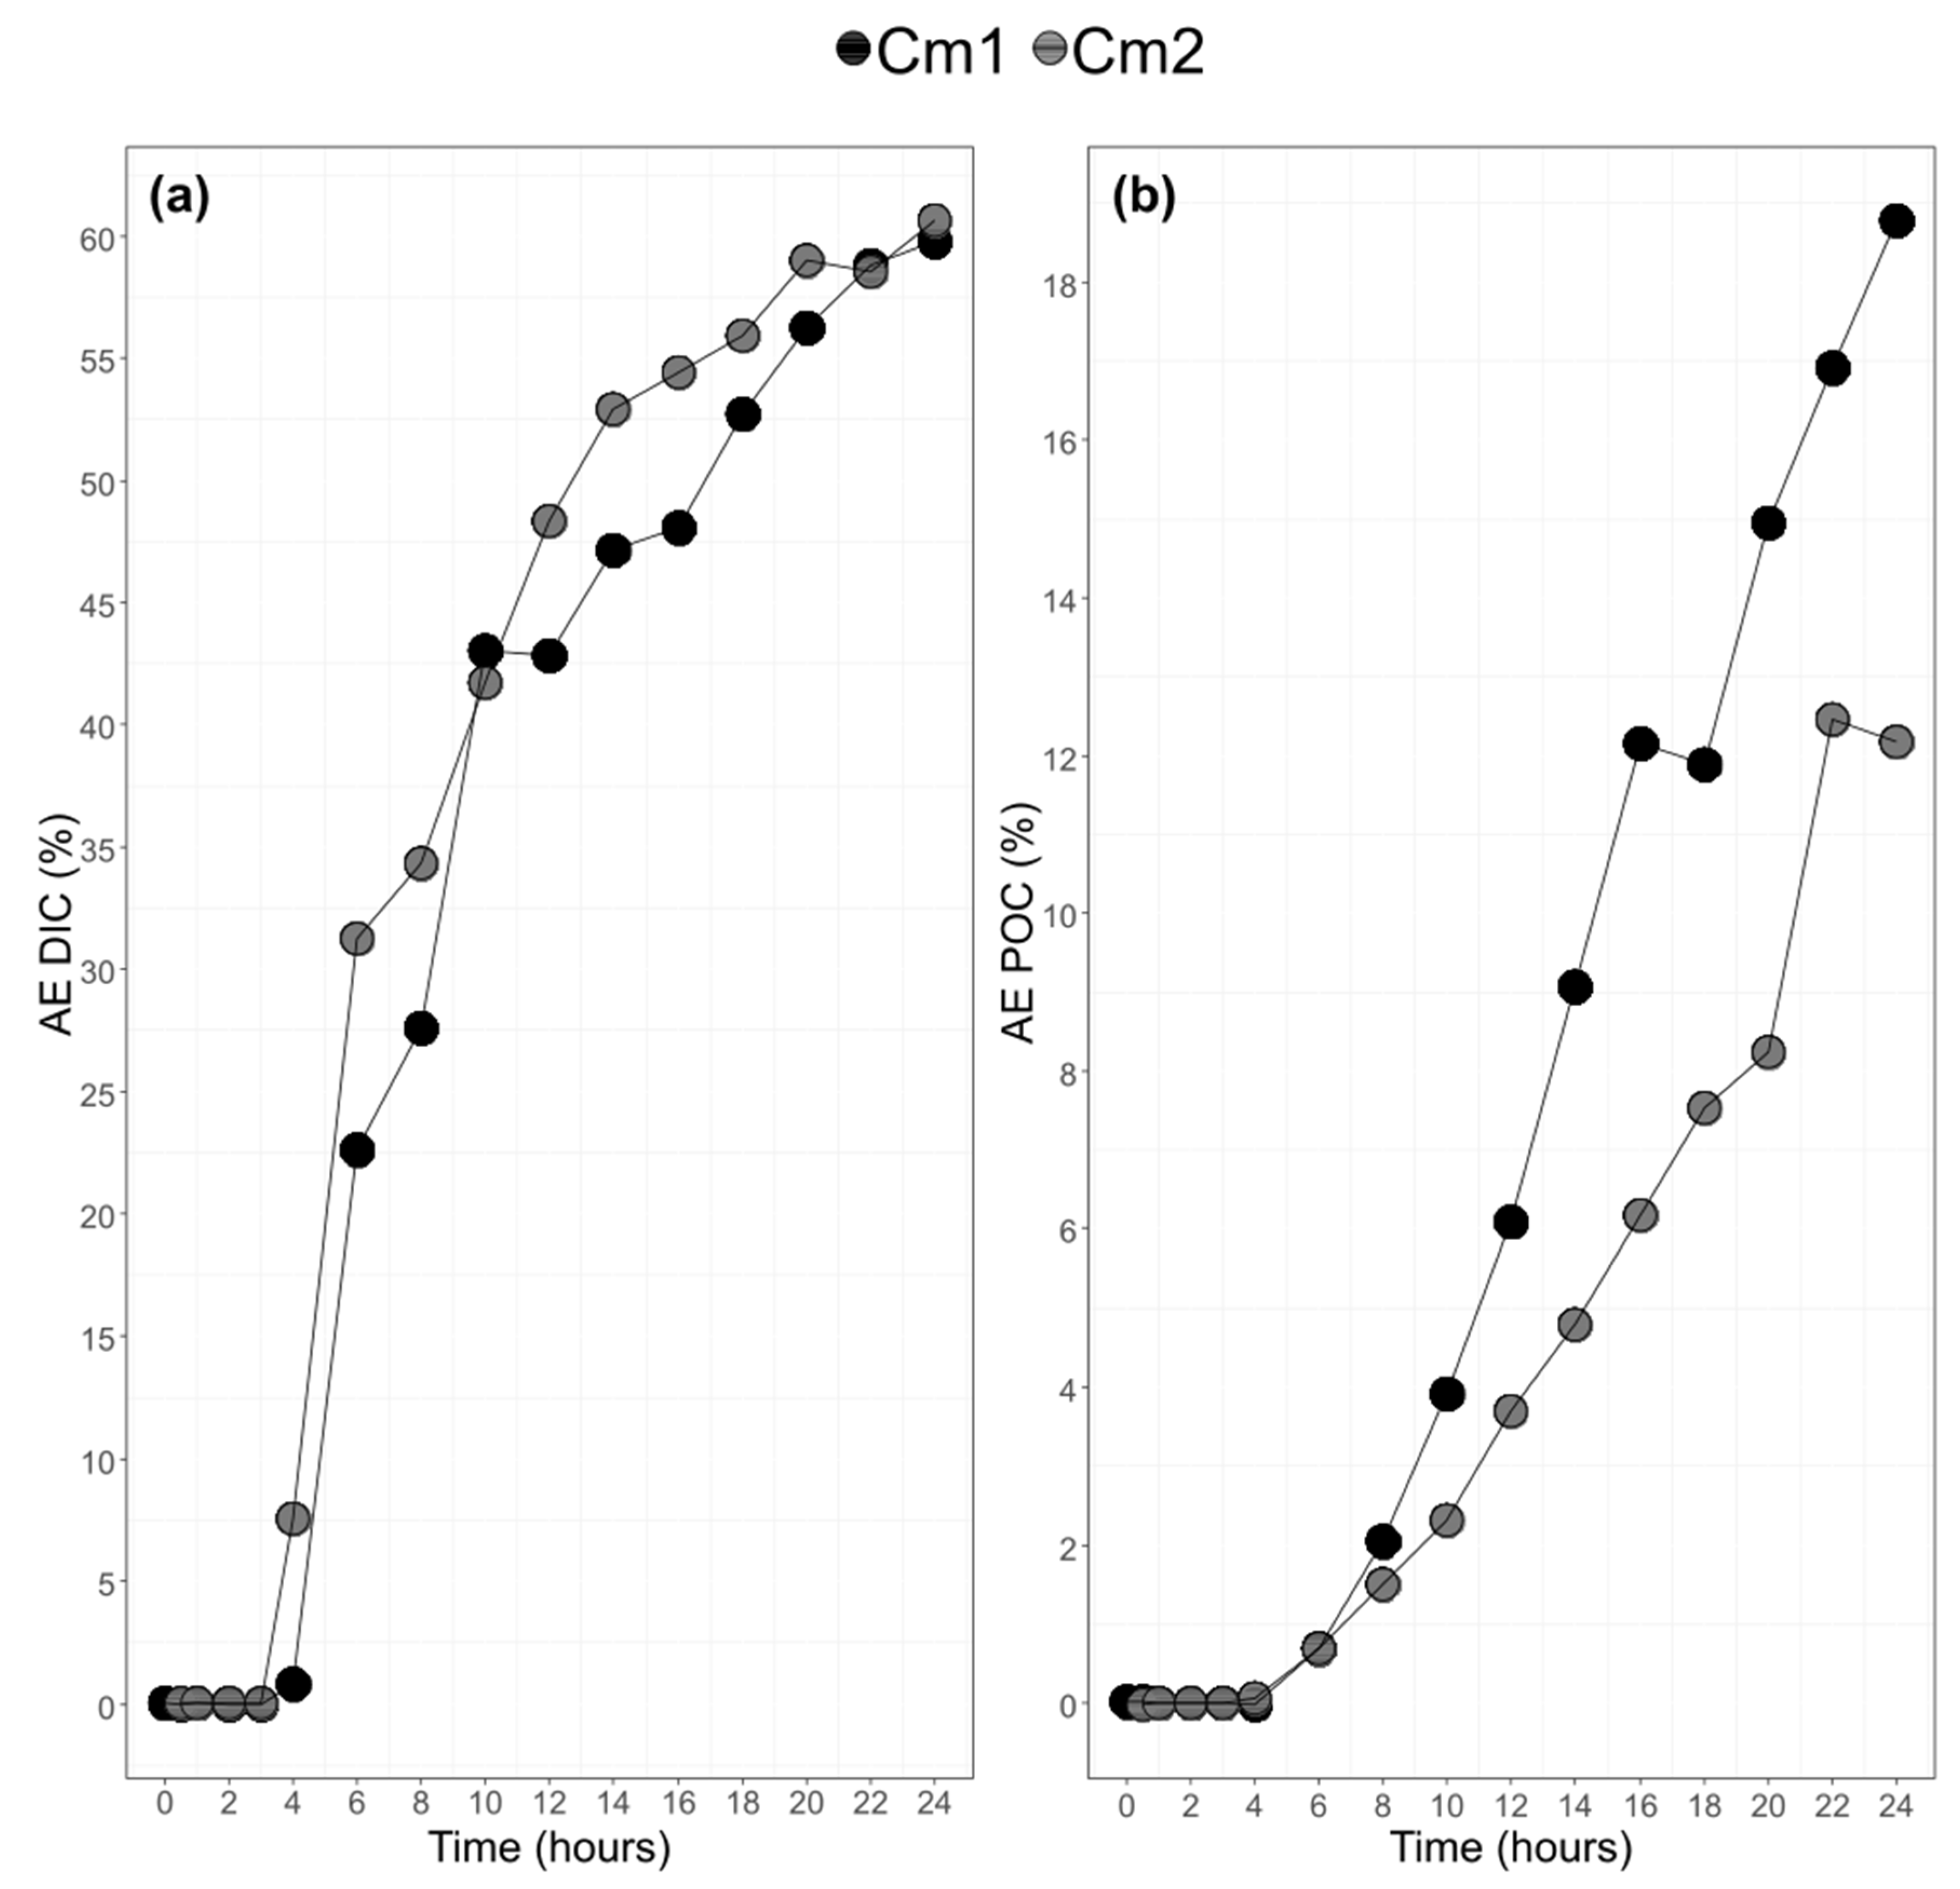
3.3. Bulk POC and DIC and their 13C-Labeling

Upon addition of 13C-CO2 to the culture at t0, the atomic enrichment of the DIC stayed close to 0 till t4. After t4 and until t24, AEDIC increased up to 60%, with a plateau after t20 (Figure 5). The DIC 13C level was similar between balloons (Figure 5). As for DIC, AE of POC remained close to zero until t4 and then sharply increased in both balloons (Figure 5). As both AEPOC and AEDIC increased at t4–t6, the 13C enrichment appeared thus to be almost simultaneous between DIC and POC pools. The level of enrichment of POC was higher in Cm1 than in Cm2 but remained parallel during the course of the experiment.

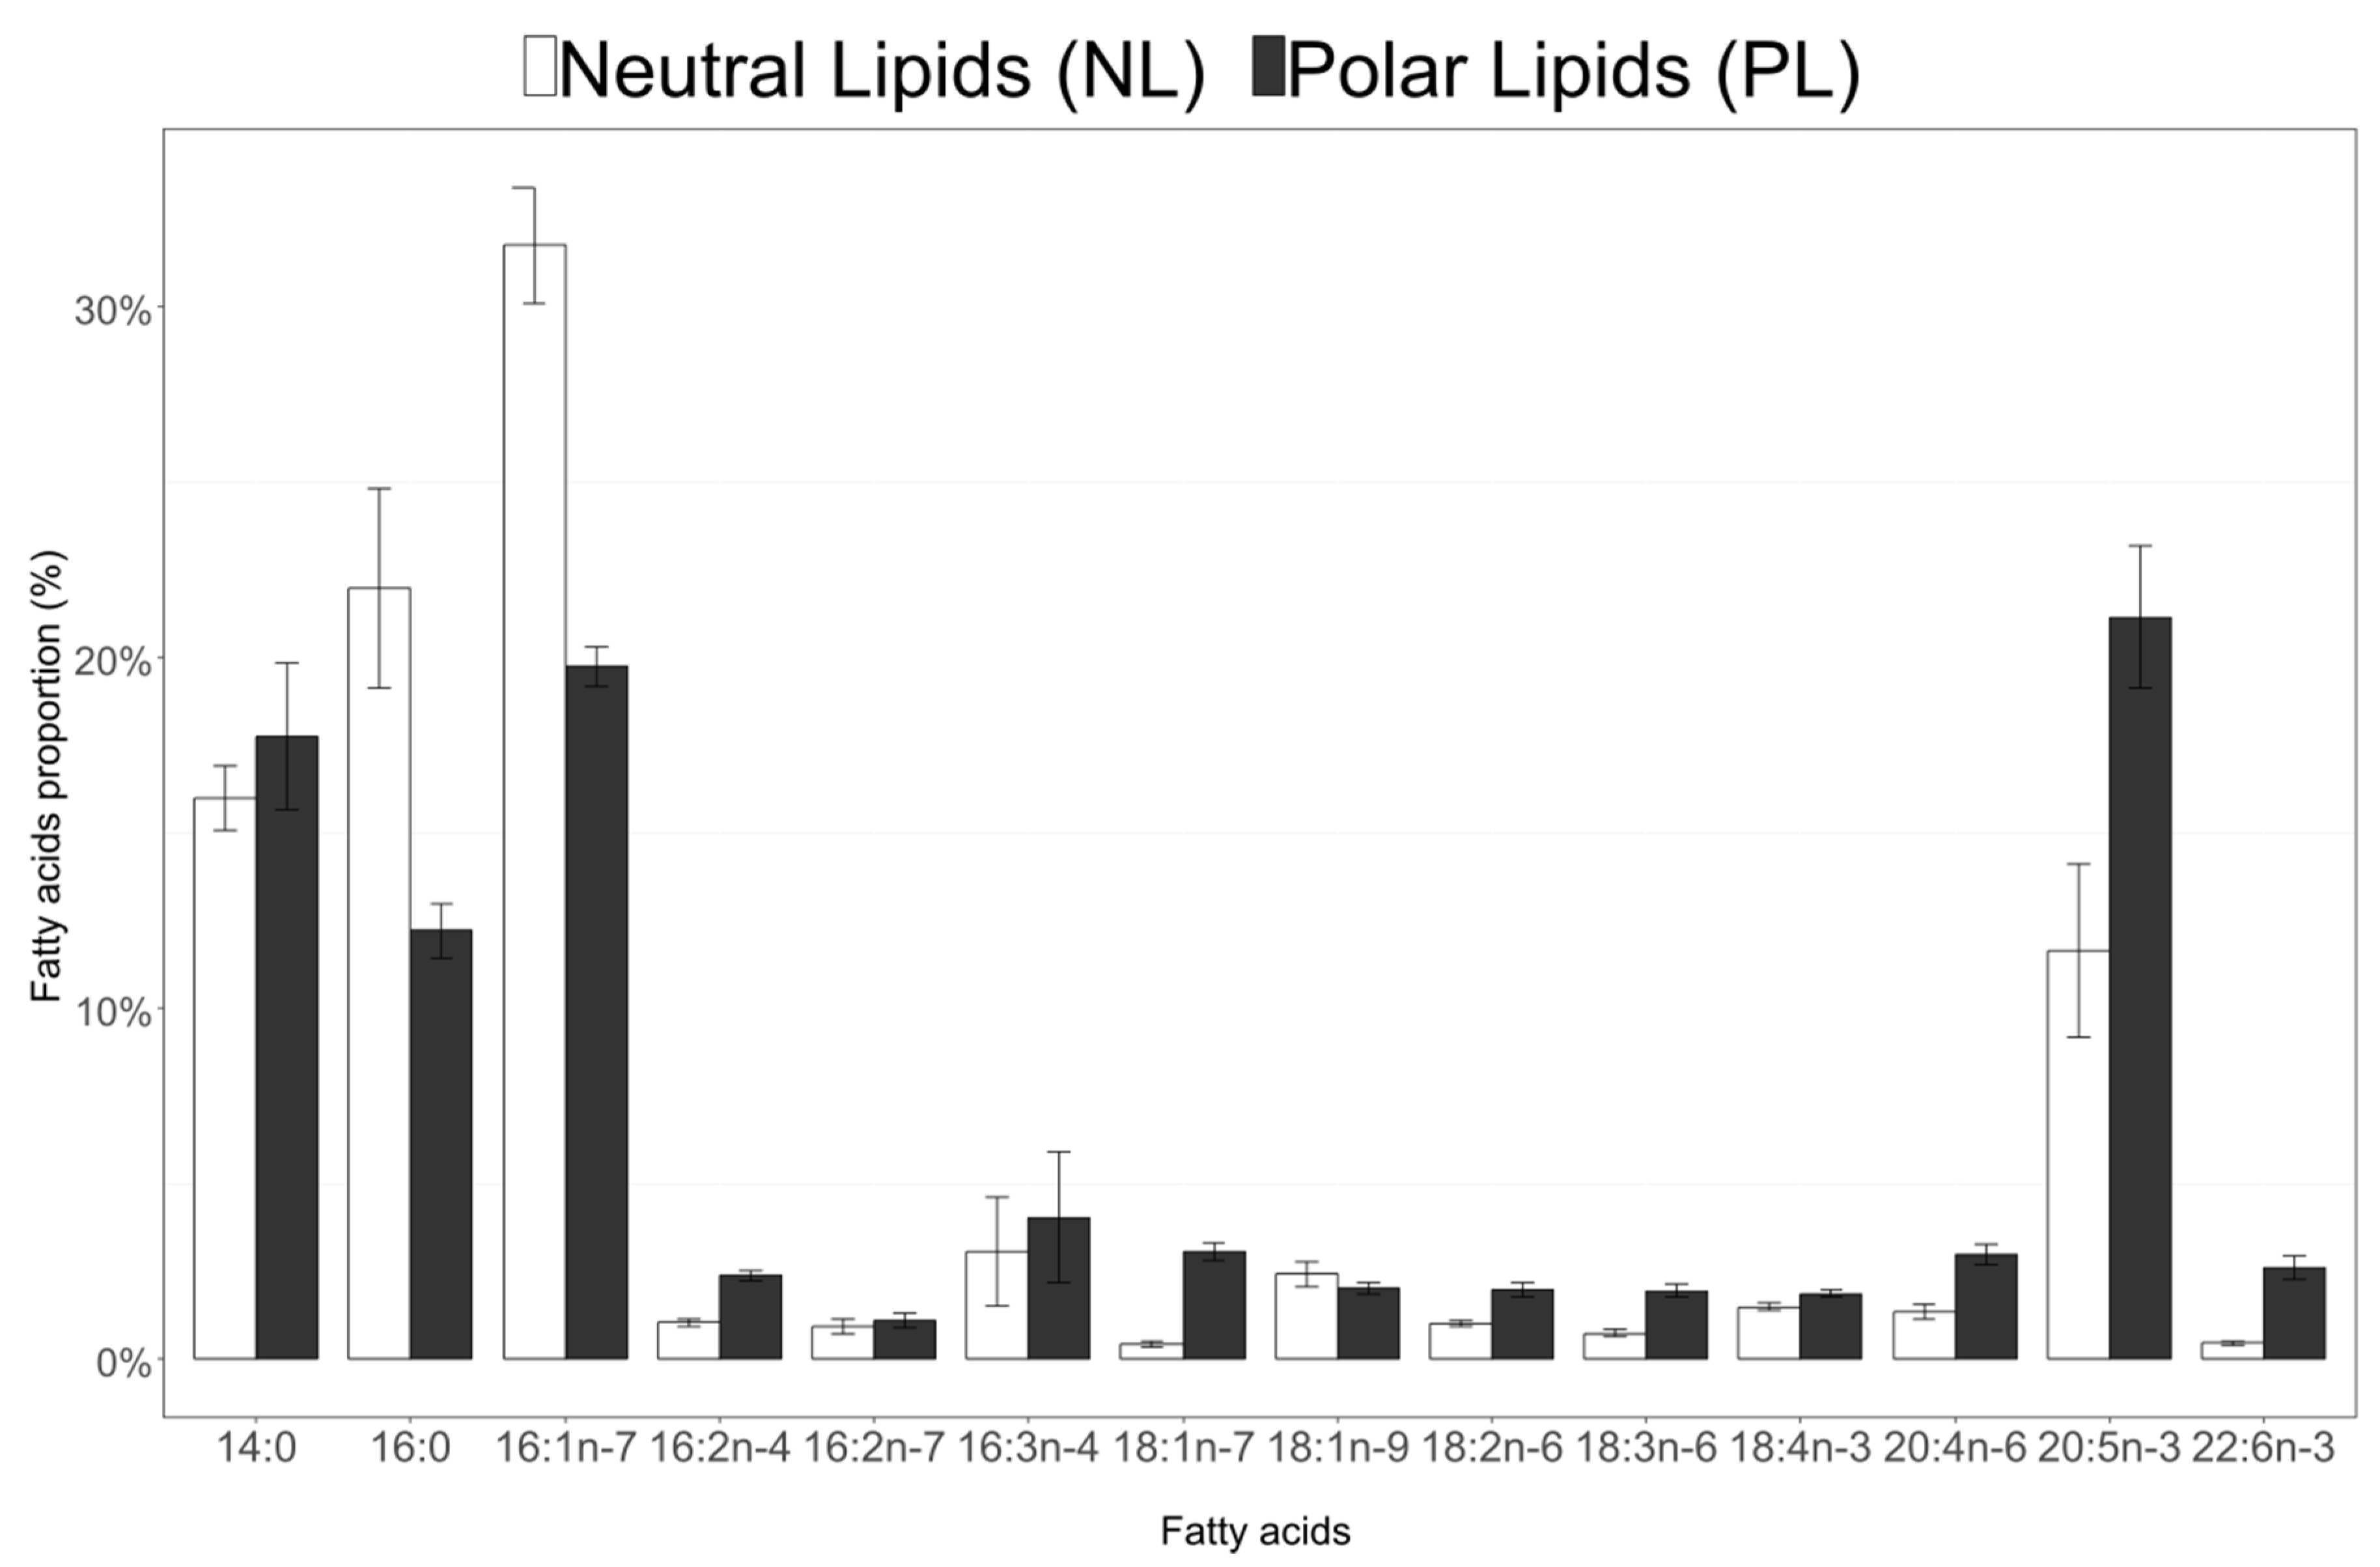
3.4. Fatty Acid Composition of Neutral and Polar Lipids in C. Muelleri

Saturated fatty acids (SFA) and monounsaturated fatty acids (MUFA) accounted for, respectively, 41% and 36% of neutral lipid fatty acids (on average for the three balloons), while PUFA represented 22% (Figure 6). Polyunsaturated fatty acids (PUFA) were more abundant in polar lipids (40% of total polar lipid fatty acids on average), while SFA and MUFA were at 33% and 26% of total polar lipid fatty acids, respectively. For both polar and neutral lipids, the main FA were 14:0, 16:0, 16:1n-7 and 20:5n-3 (Figure 6).
Fatty acids involved in the C16 PUFAs pathway (16:2n-7, 16:2n-4, 16:3n-4, 16:4n-1) and n-6 pathway (18:2n-6, 18:3n-6, 20:2n-6, 20:3n-6, 20:4n-6, 22:4n-6, 22:5n-6) represented, respectively, 8% and 7% of FA in the polar lipids (PL) versus 5% and 3% in the neutral lipids (NL). The proportions of FA involved in the n-3 pathway (18:3n-3, 18:4n-3, 20:4n-3, 20:5n-3, 22:5n-3 and 22:6n-3) represented 25% of FA in PL and 13% in NL. Table S1 of the Supplementary Data gives the concentration in µg·L−1 and µmolC·L−1 for all fatty acids identified in this study.

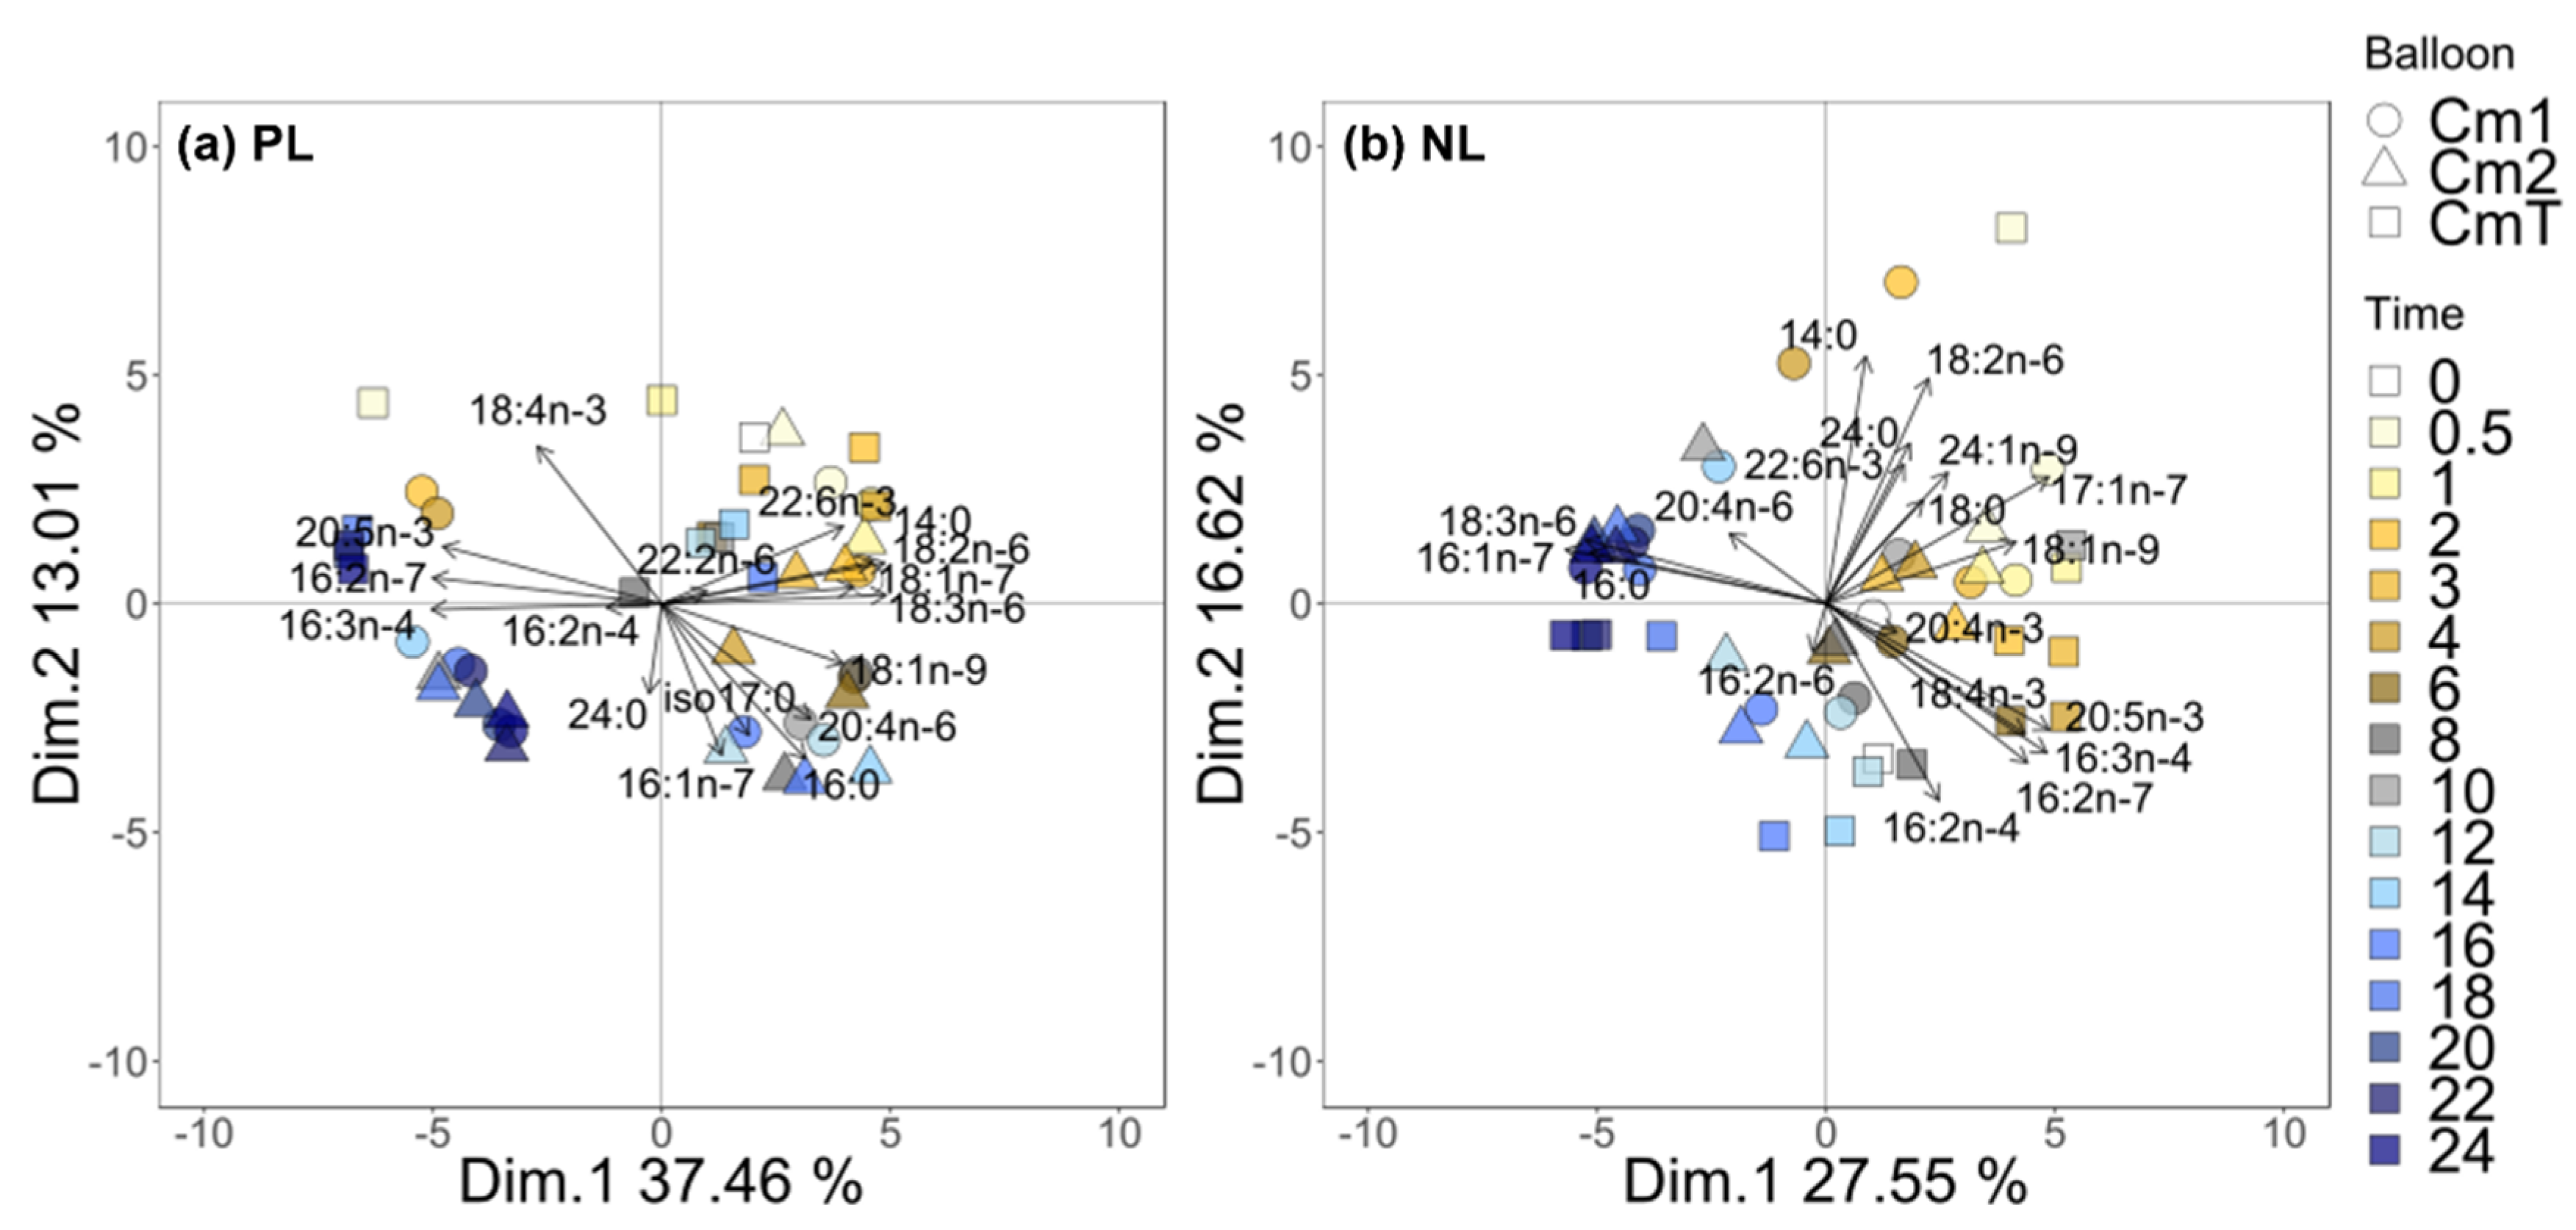
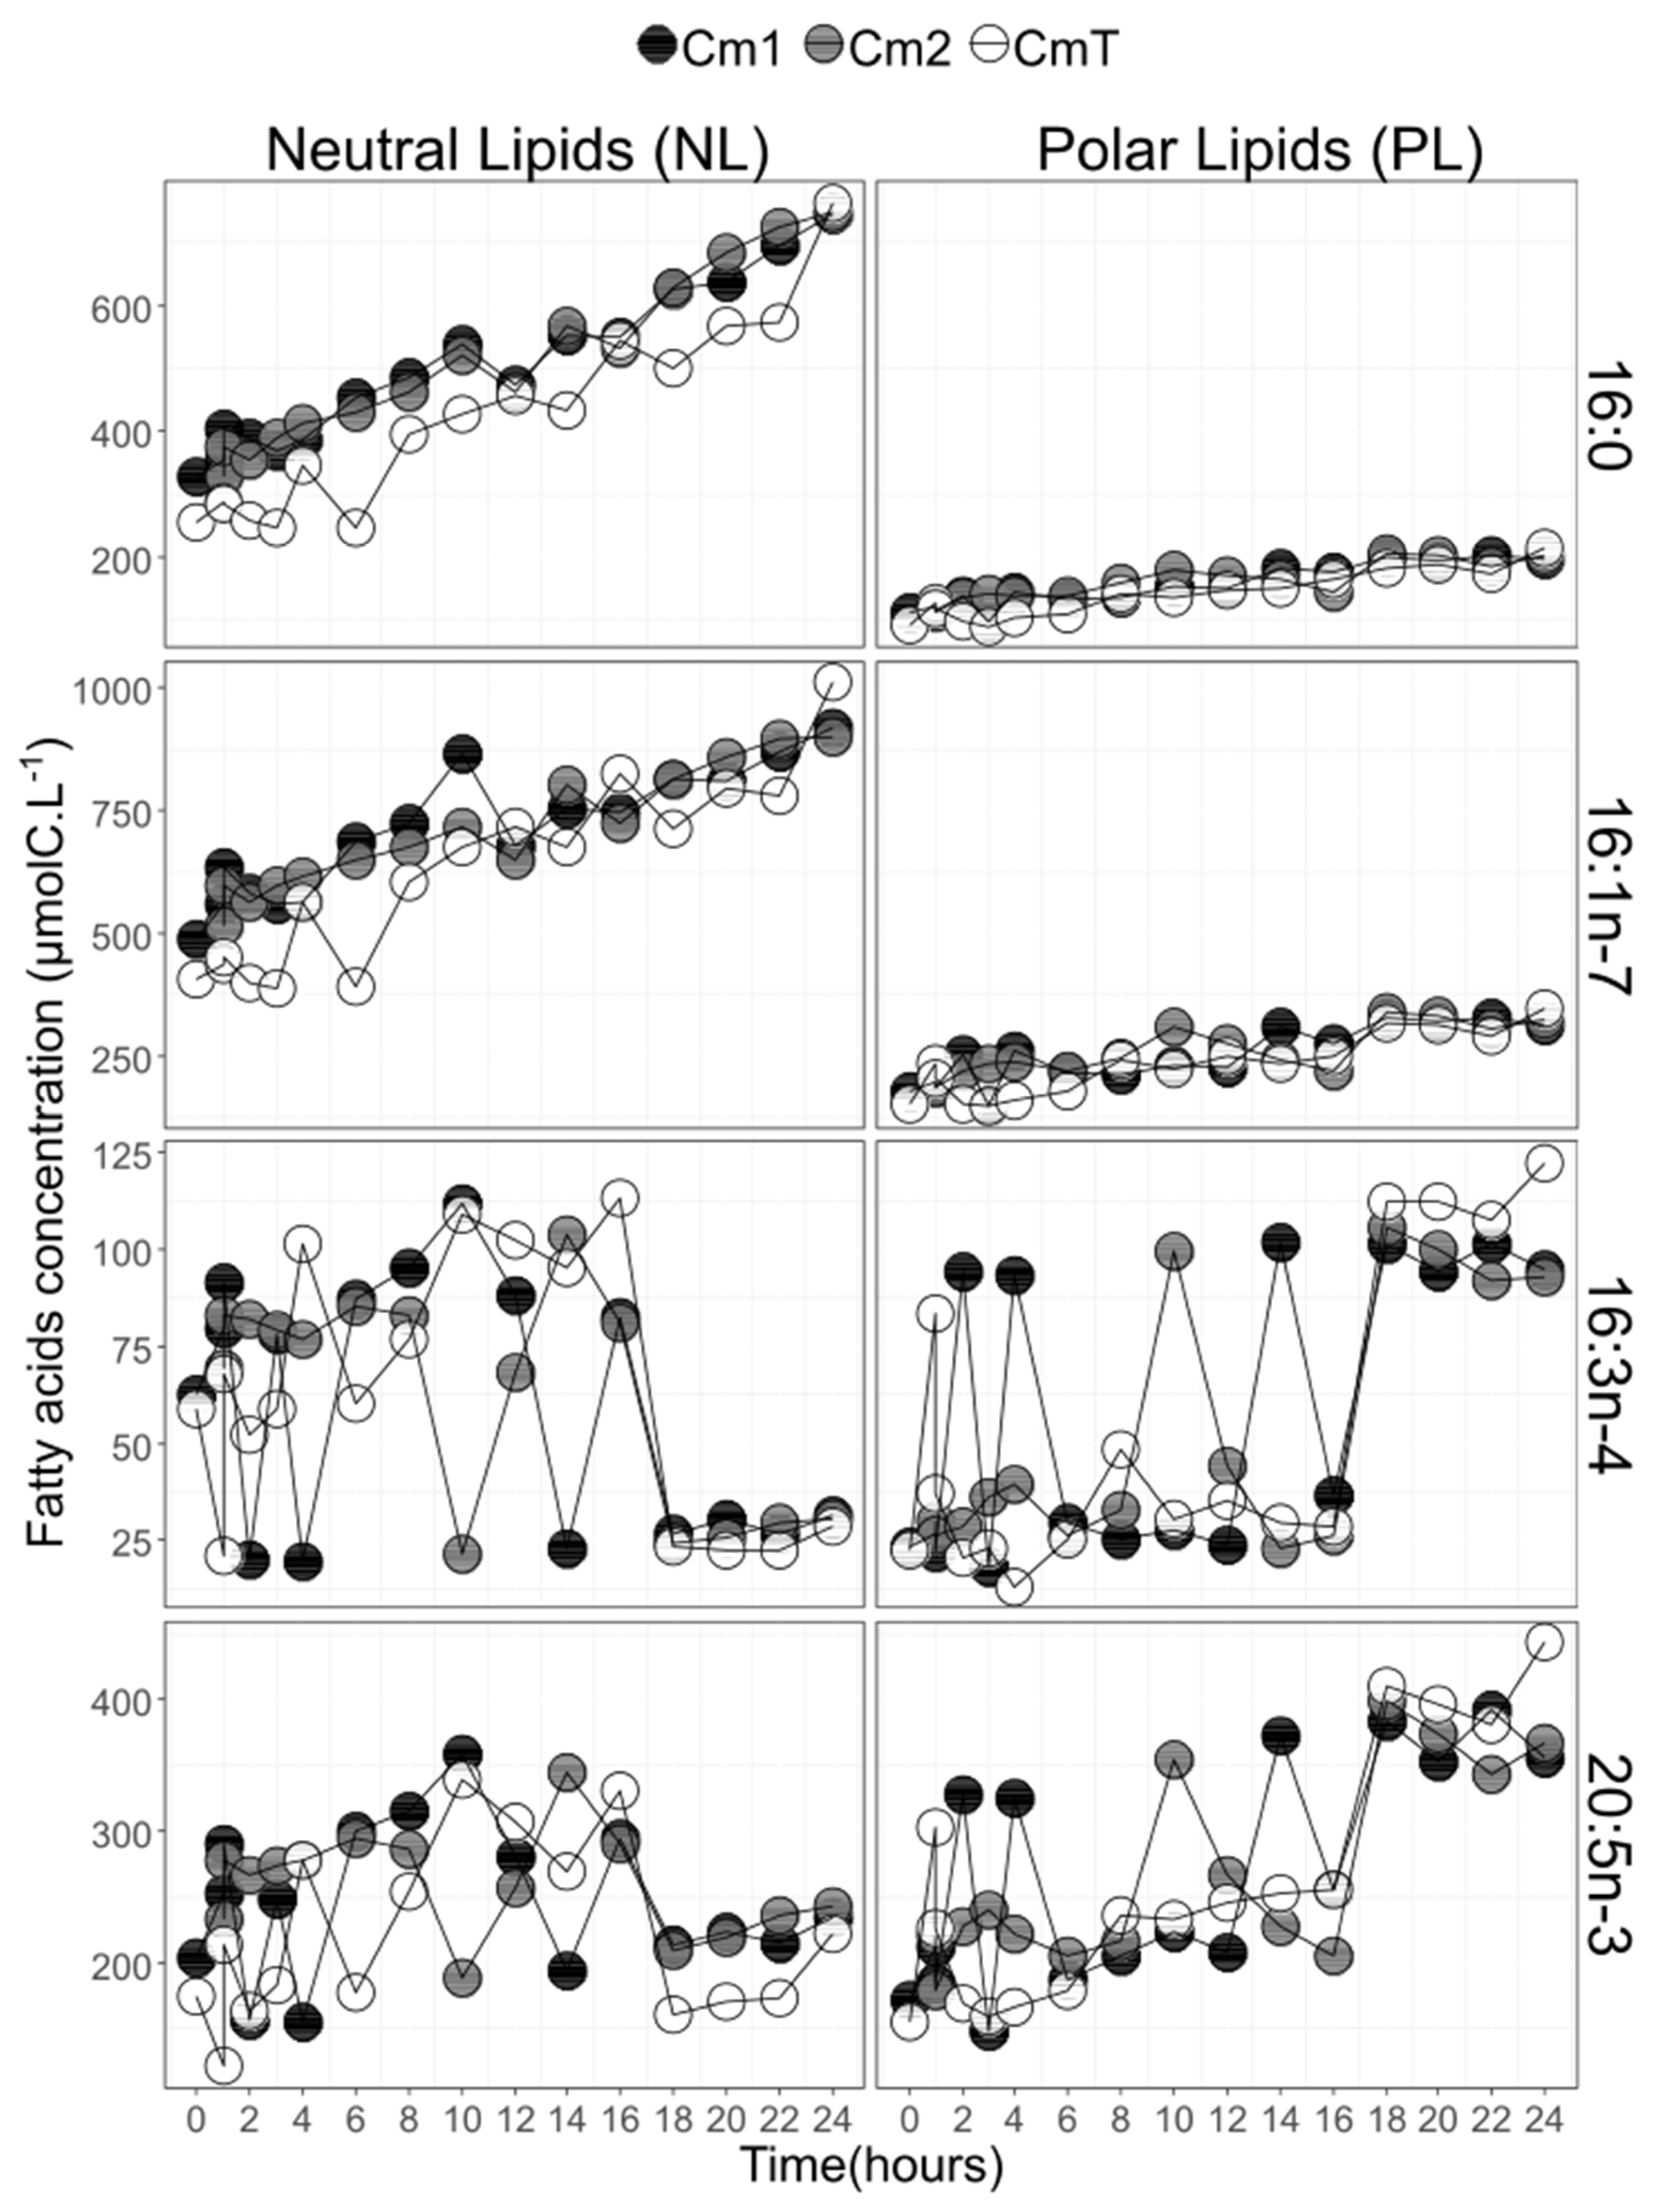
3.5. Variability of Fatty Acid Proportions during the Experiment

The PERMANOVA analysis on NL and PL fatty acids revealed a significant difference between sampling times for fatty acid mass percentage (p < 0.001) but no significant difference between the three balloons (p > 0.05).
The PCA of neutral and fatty acids was coupled with SIMPER and revealed a clear time-dependent division for both NL and PL (Figure 7). The first sampling points were on the positive side, and the last sampling points were located on the negative side of the axis 1. In PL, axis 1 was driven by fatty acids 20:5n-3, 16:2n-7 and 16:3n-4 and in NL by 18:3n-6, 16:0, 16:1n-7 and 15:0. Following these multivariate analysis, 16:0 and 16:1n-7 were found to be correlated (Spearman test: α = 0.65 p-value < 0.05 in PL, α = 0.90 p-value < 0.05 in NL), as were 16:3n-4 and 20:5n-3 (Spearman test: α = 0.86 p-value < 0.05 in PL, α = 0.88 p-value < 0.05 in NL), 18:4n-3 and 20:5n-3 (Spearman test: α = 0.72 p-value < 0.05 in PL, α = 0.70 p-value < 0.05 in NL) and 20:4n-6 and 18:3n-6 (Spearman test: α = 0.72 p-value < 0.05 in PL, α = 0.69 p-value < 0.05 in NL). 18:2n-6 and 18:3n-6 were significantly related in PL (Spearman test: α = 0.93 p-value < 0.05) but not in NL (Spearman test: α = −0.07 p-value > 0.05).
Concentration (µmolC·L−1) dynamics of 16:3n-4, 20:5n-3, 16:0 and 16:1n-7 are shown in Figure 8. Both 16:0 and 16:1n-7 presented steady increases of their concentrations in both NL and PL fractions. The concentration doubled for 16:0 with time, on average from 122 ± 5 µmolC·L−1 to 205 ± 9 µmolC·L−1 and 322 ± 34 µmolC·L−1 to 750 ± 10 µmolC·L−1, respectively, for PL and NL and almost doubled for 16:1n-7 from 209 ± 22 µmolC·L−1 to 327 ± 17 µmolC·L−1 and from 504 ± 62 µmolC·L−1 to 943 ± 60 µmolC·L−1, respectively, for PL and NL. On the contrary, 16:3n-4 and 20:5n-3 concentrations dynamics oscillated with time. Decreases in concentrations of 16:3n-4 and 20:5n-3 for the NL fraction were concomitant with their opposite increases in the PL fraction. Reverse observations were also true. This pattern was particularly observed at t2, t4, t10 and t14. These oscillations were to put in relation to the correlations observed for NL and PL for 16:3n-4 and 20:5n-3 (Figure 7). After t18, the concentrations of 16:3n-4 and 20:5n-3 became more time-stable and more abundant within the PL fraction: 26.7 ± 3.3 µmol·L−1 and 103.1 ± 9.3 µmol·L−1 for 16:3n-4, 209.9 ± 27.3 µmol·L−1 and 383.1 ± 27.7 µmol·L−1 for 20:5n-3, respectively, for NL and PL in average for the three replicates (Figure 8). To a lesser extent, the same dynamics were found for 16:2n-7, 16:2n-4 and 18:4n-3 in both NL and PL fractions (data not shown).

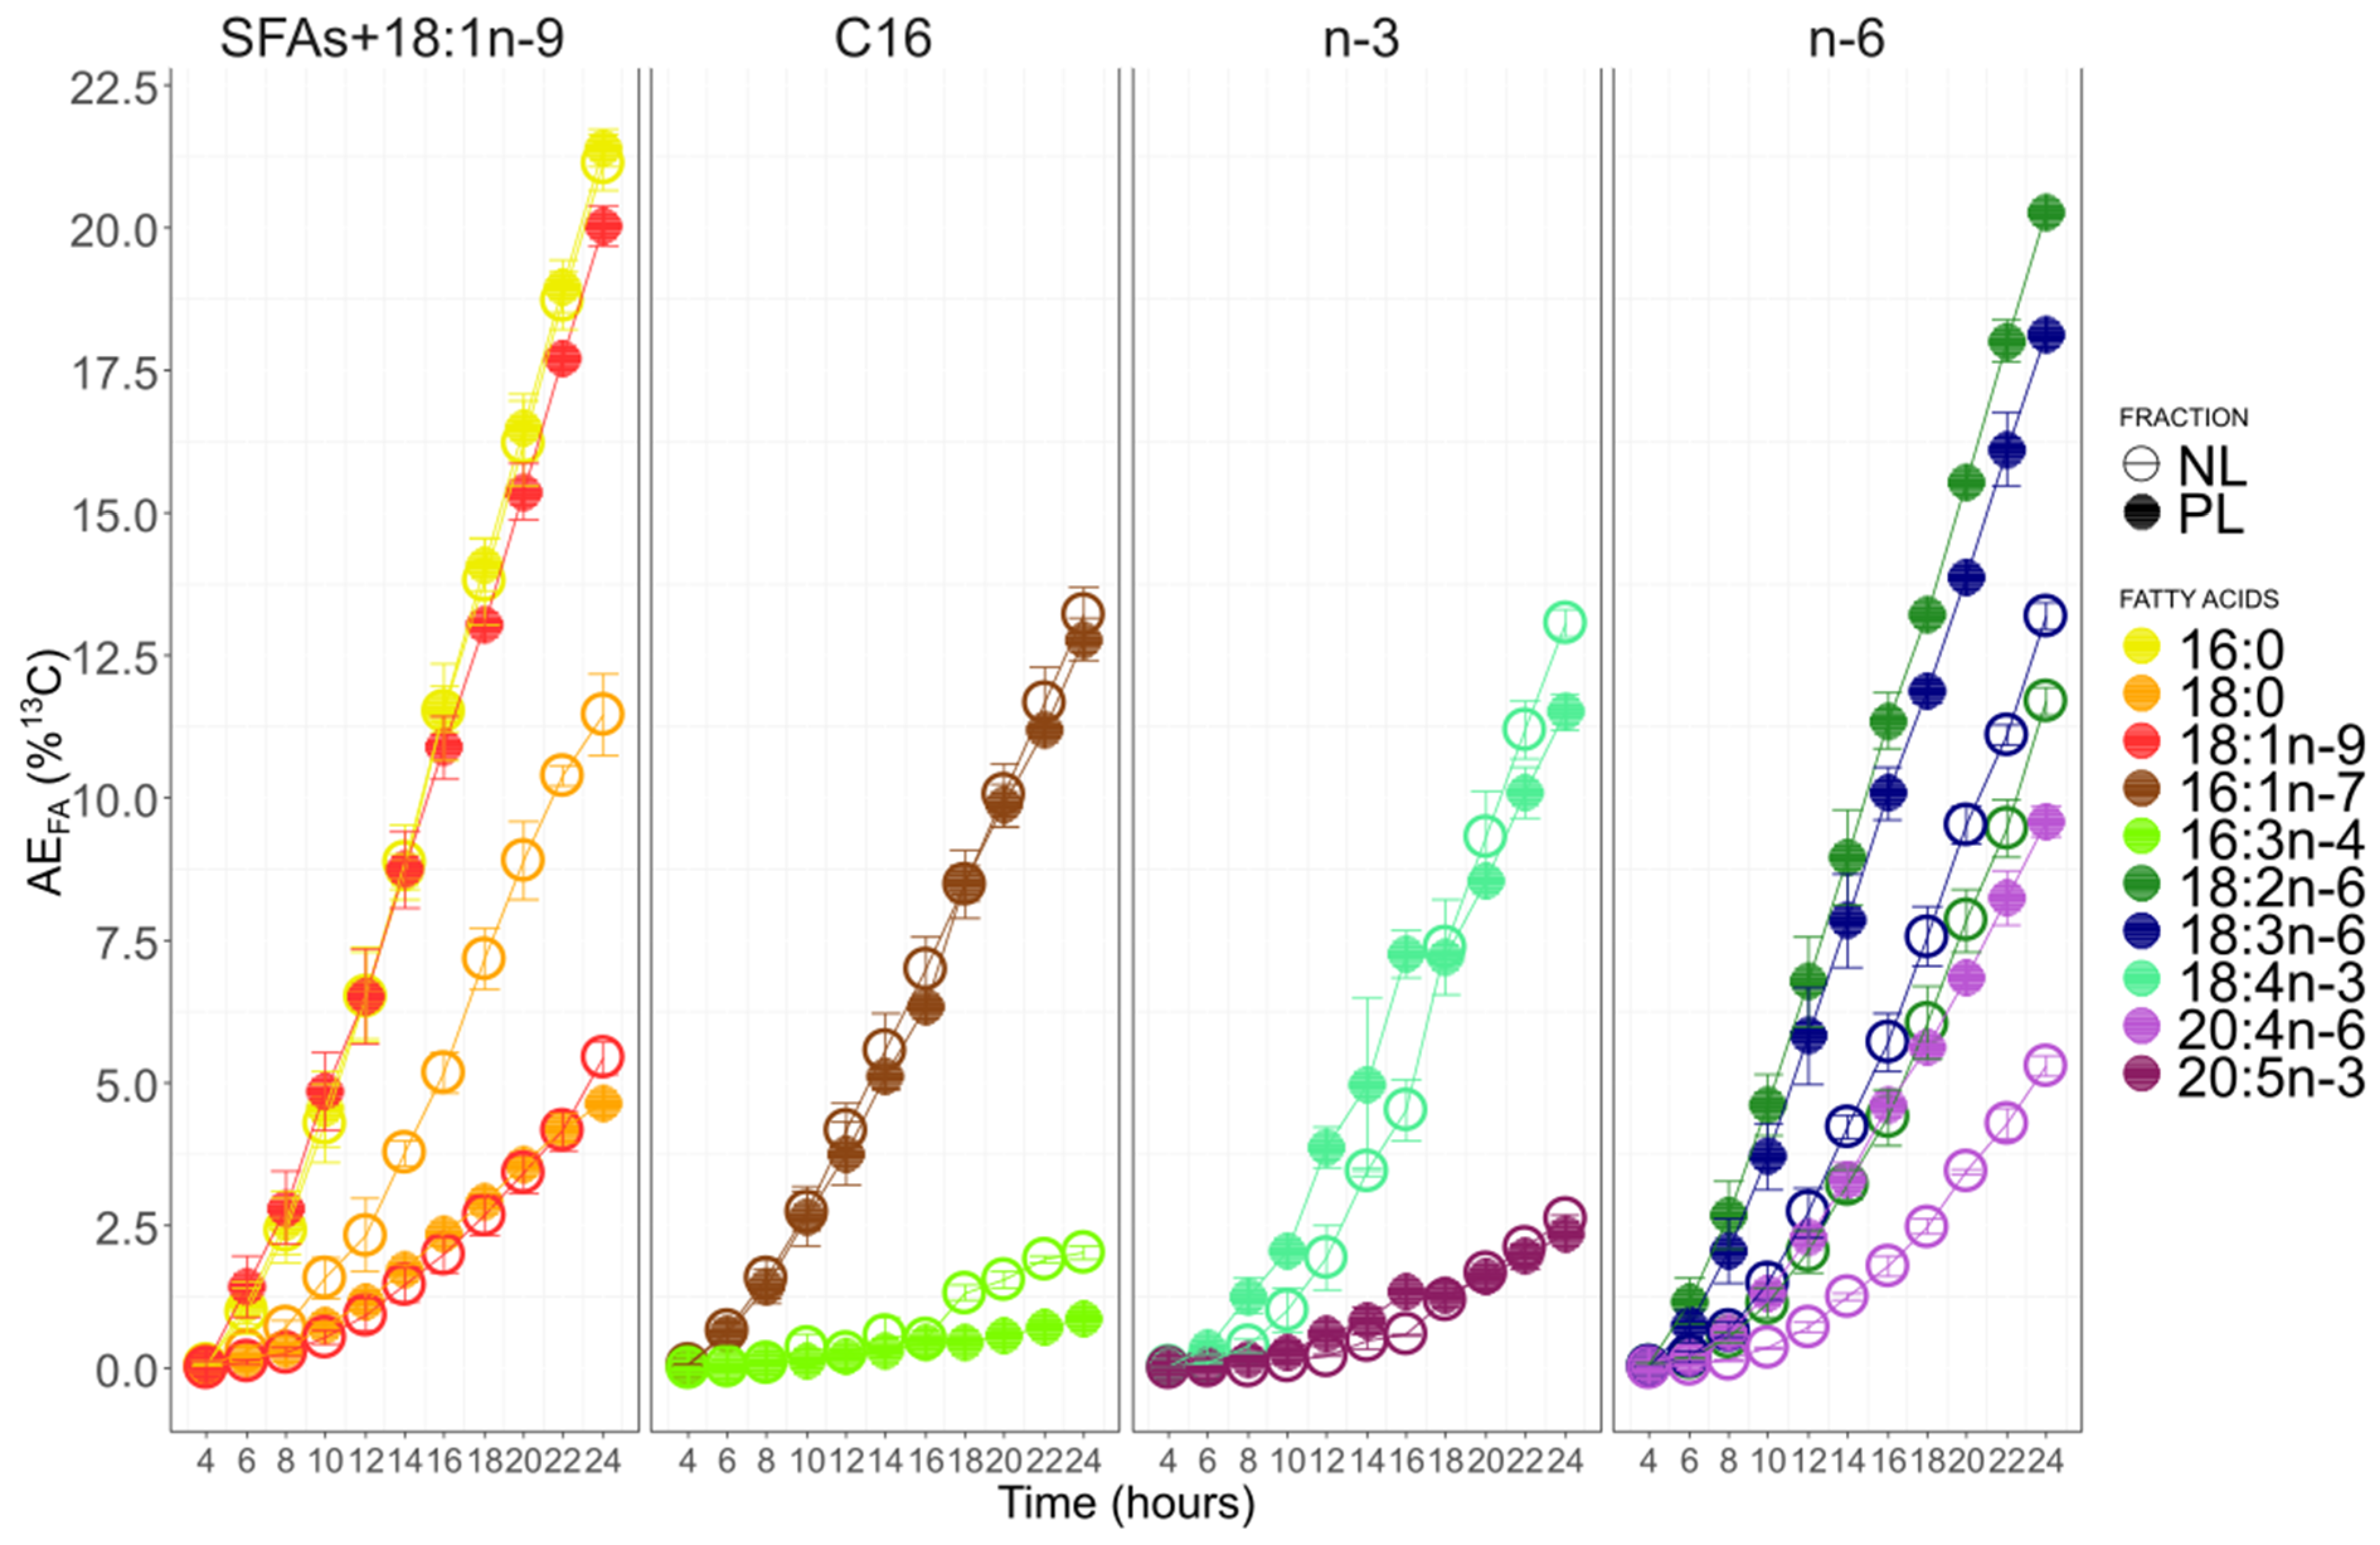
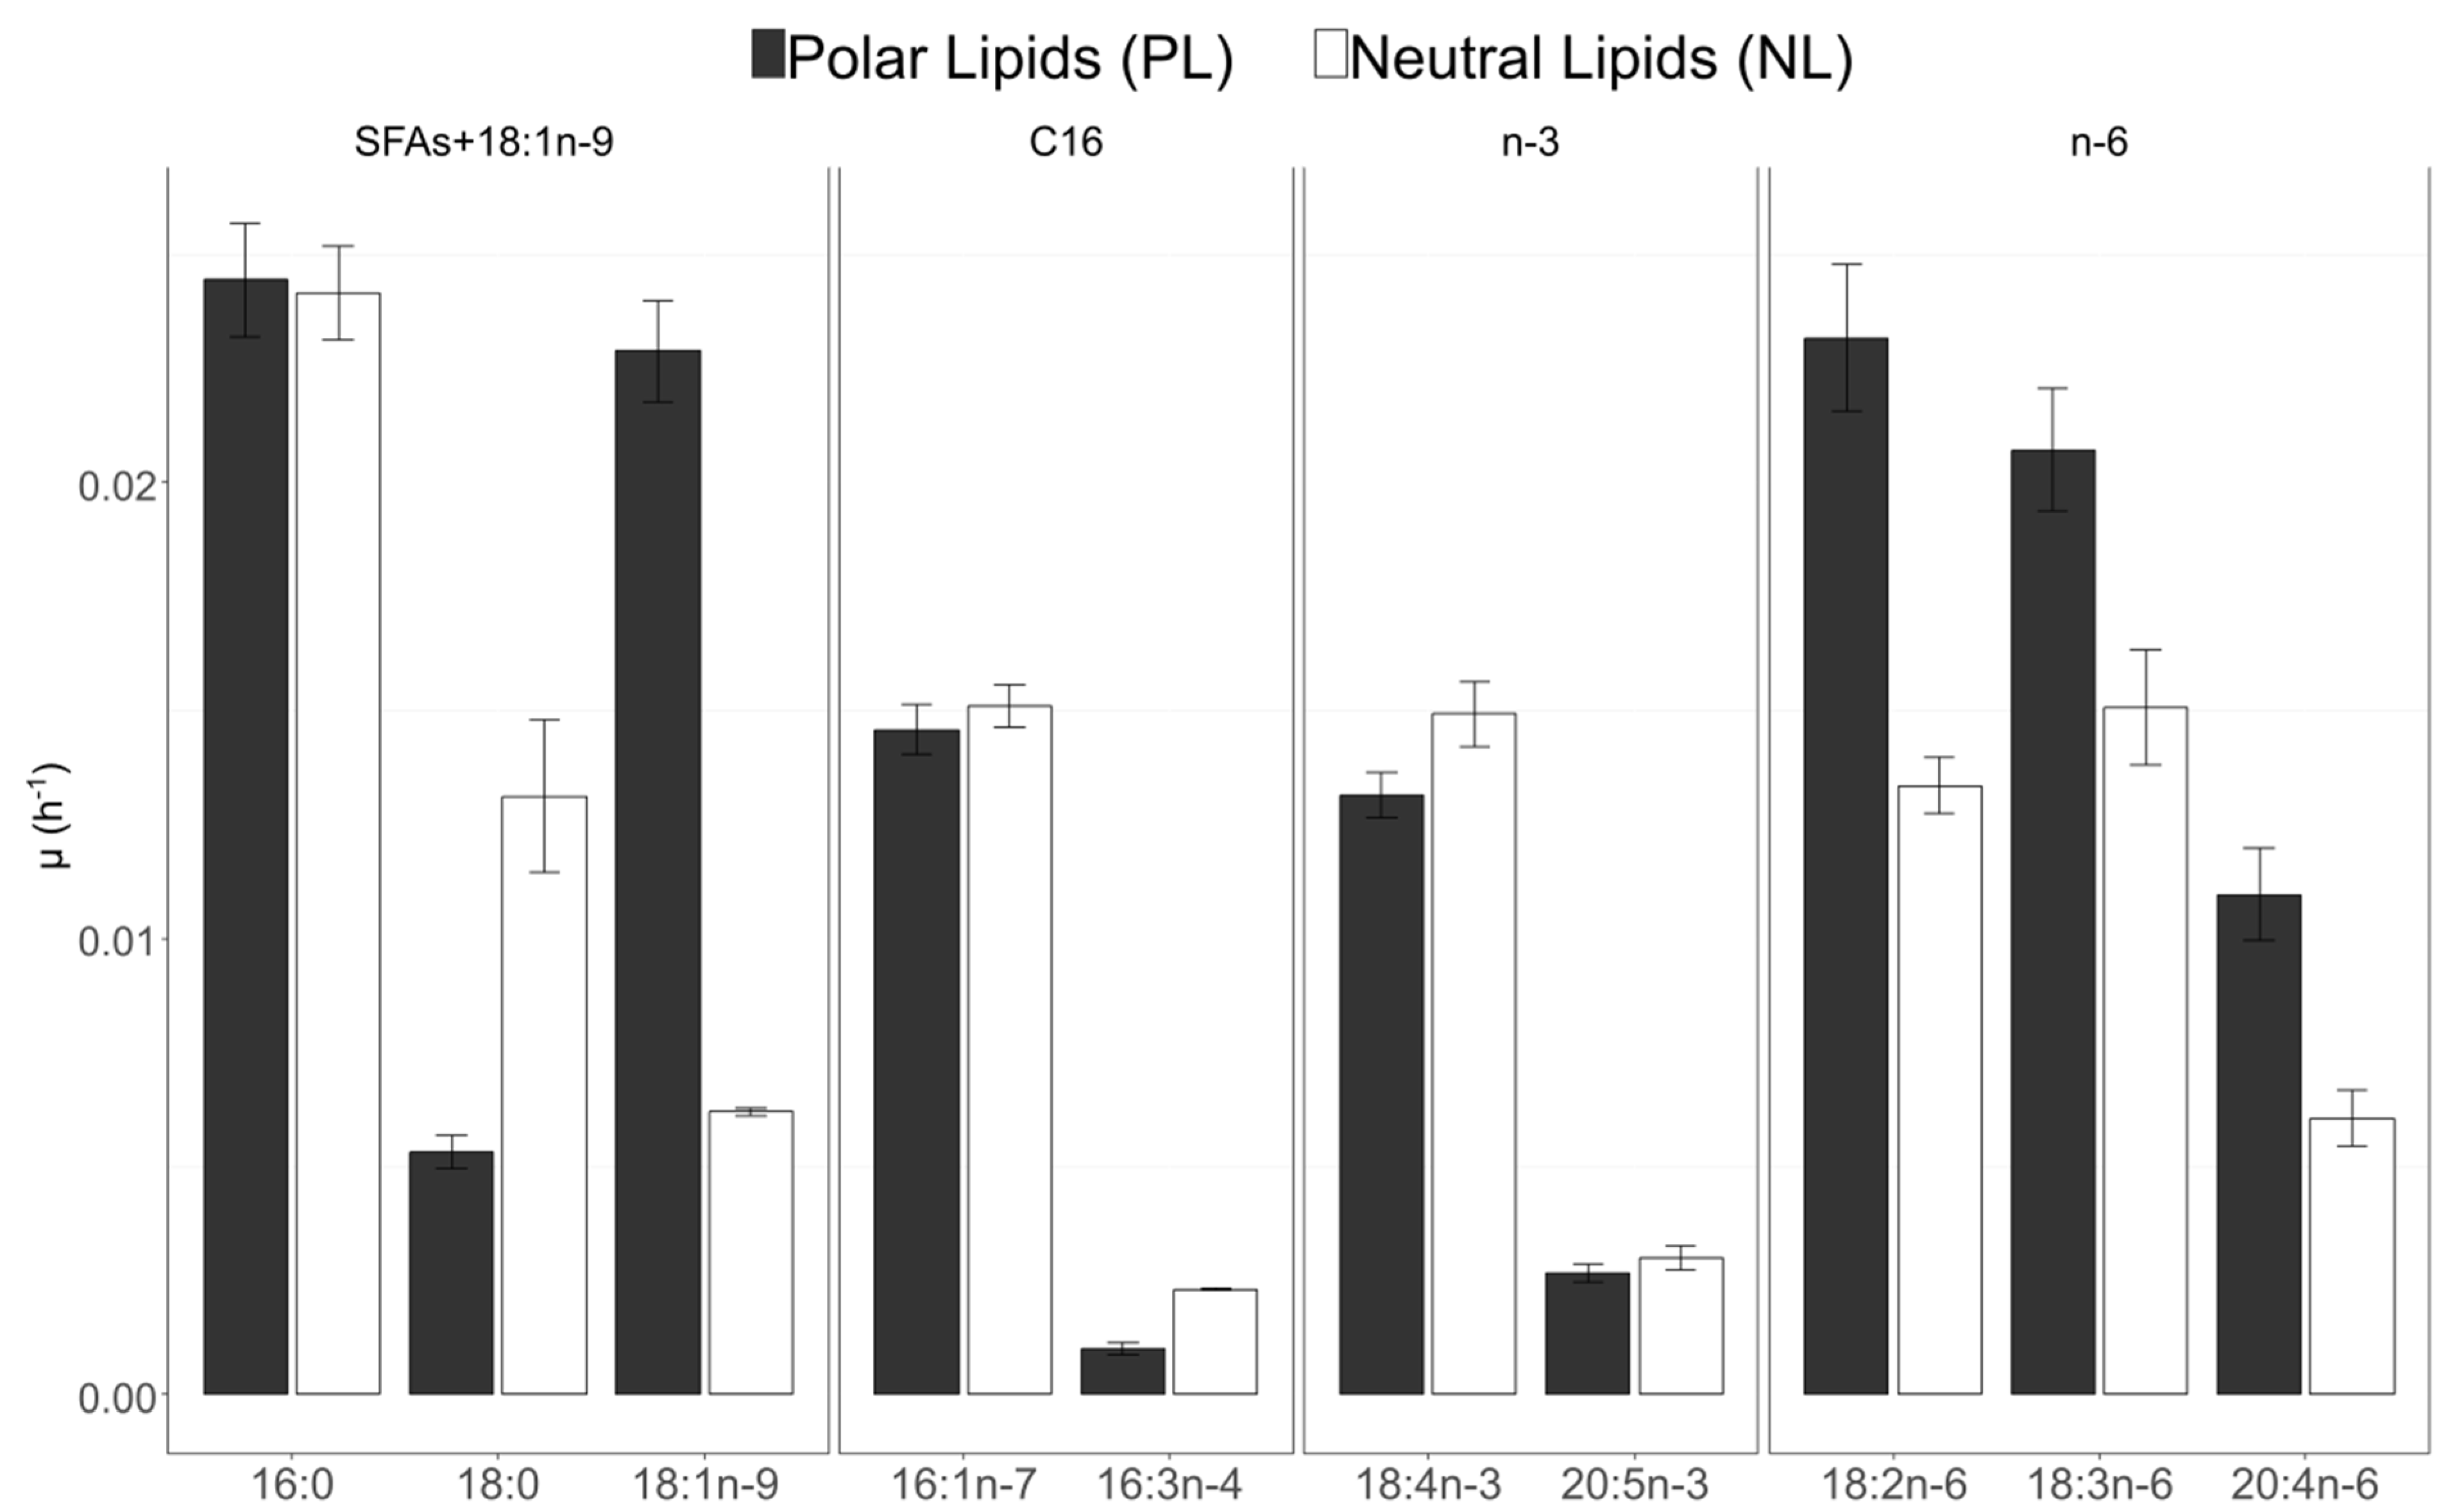
3.6. Fatty Acid 13C-Enrichment and Synthesis

The atomic enrichments (AE) of the 10 studied fatty acids were gathered according to hypothesized pathways (C16 PUFAs, n-3 PUFAs, and n-6 PUFAs pathways and post-FAS pathway) (Figure 9).
For the first group (SFA + 18:1n-9), 16:0 and 18:1n-9 were the most enriched FA in PL, followed by 18:0. In NL, 16:0 was the most enriched, followed by 18:0 and 18:1n-9, which had the lowest enrichment. For C16 fatty acids, 16:1n-7 incorporated more 13C than 16:3n-4 in both NL and PL. Enrichment in 13C for these two fatty acids was similar between fractions. 13C levels of enrichment of 16:0 and 16:1n-7 were similar in NL, while 16:0 incorporated more 13C than 16:1n-7 in PL.
For n-3 PUFAs, 18:4n-3 was always more enriched in 13C than 20:5n-3 in both NL and PL that presented, like for C16 fatty acids, a relatively similar labeling. For the n-6 PUFAs, the 13C incorporation seemed to follow the carbon chain size, first the C18 PUFAs (18:2n-6 and 18:3n-6) and then 20:4n-6. For this group, PL was always more enriched than NL. By comparing PUFAs of the n-3 and n-6 together, the levels of 13C in polar lipids followed the order: 18:2n-6, 18:3n-6, 18:4n-3, 20:4n-6, 20:5n-3. It was different for neutral lipids: 18:3n-6, 18:4n-3, 18:2n-6, 20:4n-6, 20:5n-3. By considering all C18 fatty acids, 18:1n-9 was more enriched in 13C in PL than 18:2n-6 and 18:3n-6, while less enriched in 13C in NL than C18 PUFAs.
In PL, 16:0 (0.024 h−1), 18:1n-9 and 18:2n-6 (0.023 h−1) had the highest specific uptake rates, followed by 18:3n-6 (0.021 h−1) (Figure 10). For NL, the specific uptake rate remained below 0.02 h−1 for all fatty acids except for 16:0. 18:4n-3 and 18:3n-6 presented higher rates (0.015 h−1). The specific uptake rate of 18:0 was higher in NL in comparison with PL (0.013 h−1 versus 0.005 h−1). The specific uptake rate of 18:4n-3 was similar in NL and PL fractions. In the n-6 PUFAs, 18:3n-6 and 18:2n-6 had a higher µFA in the polar fraction than in the neutral fraction. The specific uptake rate of 18:1n-9 was also higher in PL than in NL (Figure 10).
Mean ratio of atomic enrichment (AE) for pairs of FA were calculated for neutral lipids (NL) and polar lipids (PL) to explore the precursor–product relationship between FA (Figure 10).
For the C16 pathway and connections between n-3 and n-6 pathways, all the ratios are below 1 for NL and PL (Table 4). It was also the case for 20:5n-3/18:4n-3 in PL and NL in the n-3 pathway, 20:4n-6/18:3n-6 in PL and NL and 18:3n-6/18:2n-6 in PL for the n-6 pathway. However in NL, 18:3n-6/18:2n-6 and 18:2n-6/18:1n-9 are above 1 with respective mean values at 1.25 and 2.14. Finally 18:2n-6/18:1n-9 is close to 1 for PL. The 18:0 can allow the slow production of 18:1n-9 in NL (ratios below 1) but 18:1n-9/18:0 ratio is above 1 in PL (Table 4). Figure 11 summarised the interpretation of the results obtained with ratio calculations.

4. Discussion

4.1. Growth and 13C Incorporation

This study aimed at investigating the synthesis pathways of 20:5n-3 in C. muelleri using 13CO2 labeling. The addition of 13CO2 did not disturb the algae physiology: growth, cell size, cell complexity, chlorophyll content. Cell viability remained high throughout the experiment as revealed by constant proportions of alive (SYTOX) and active (FDA) cells. This supported the good physiological state of the algae, which was able to produce FA (around 23% of POC). Algae growth was associated with an increase of POC and TFA concentrations. The 13C enrichments into DIC and POC were significantly detected after t4. After a lag phase, both DIC and POC pools were rapidly enriched, with slightly different kinetics. DIC enrichment increased rapidly at first and then stabilized after 14–16 h, while POC enrichment increased steadily following a linear slope. The difference of POC enrichment in 13C between the two labeled balloons remained unclear, especially since the respective levels of 13C found in the studied FA for both replicates stayed close. The incorporation of the 13C into fatty acids was detectable after 4 h, but their levels of enrichment varied according to fatty acids. 13C incorporation in some FA (16:0, 18:1n-9) was even higher than in POC.

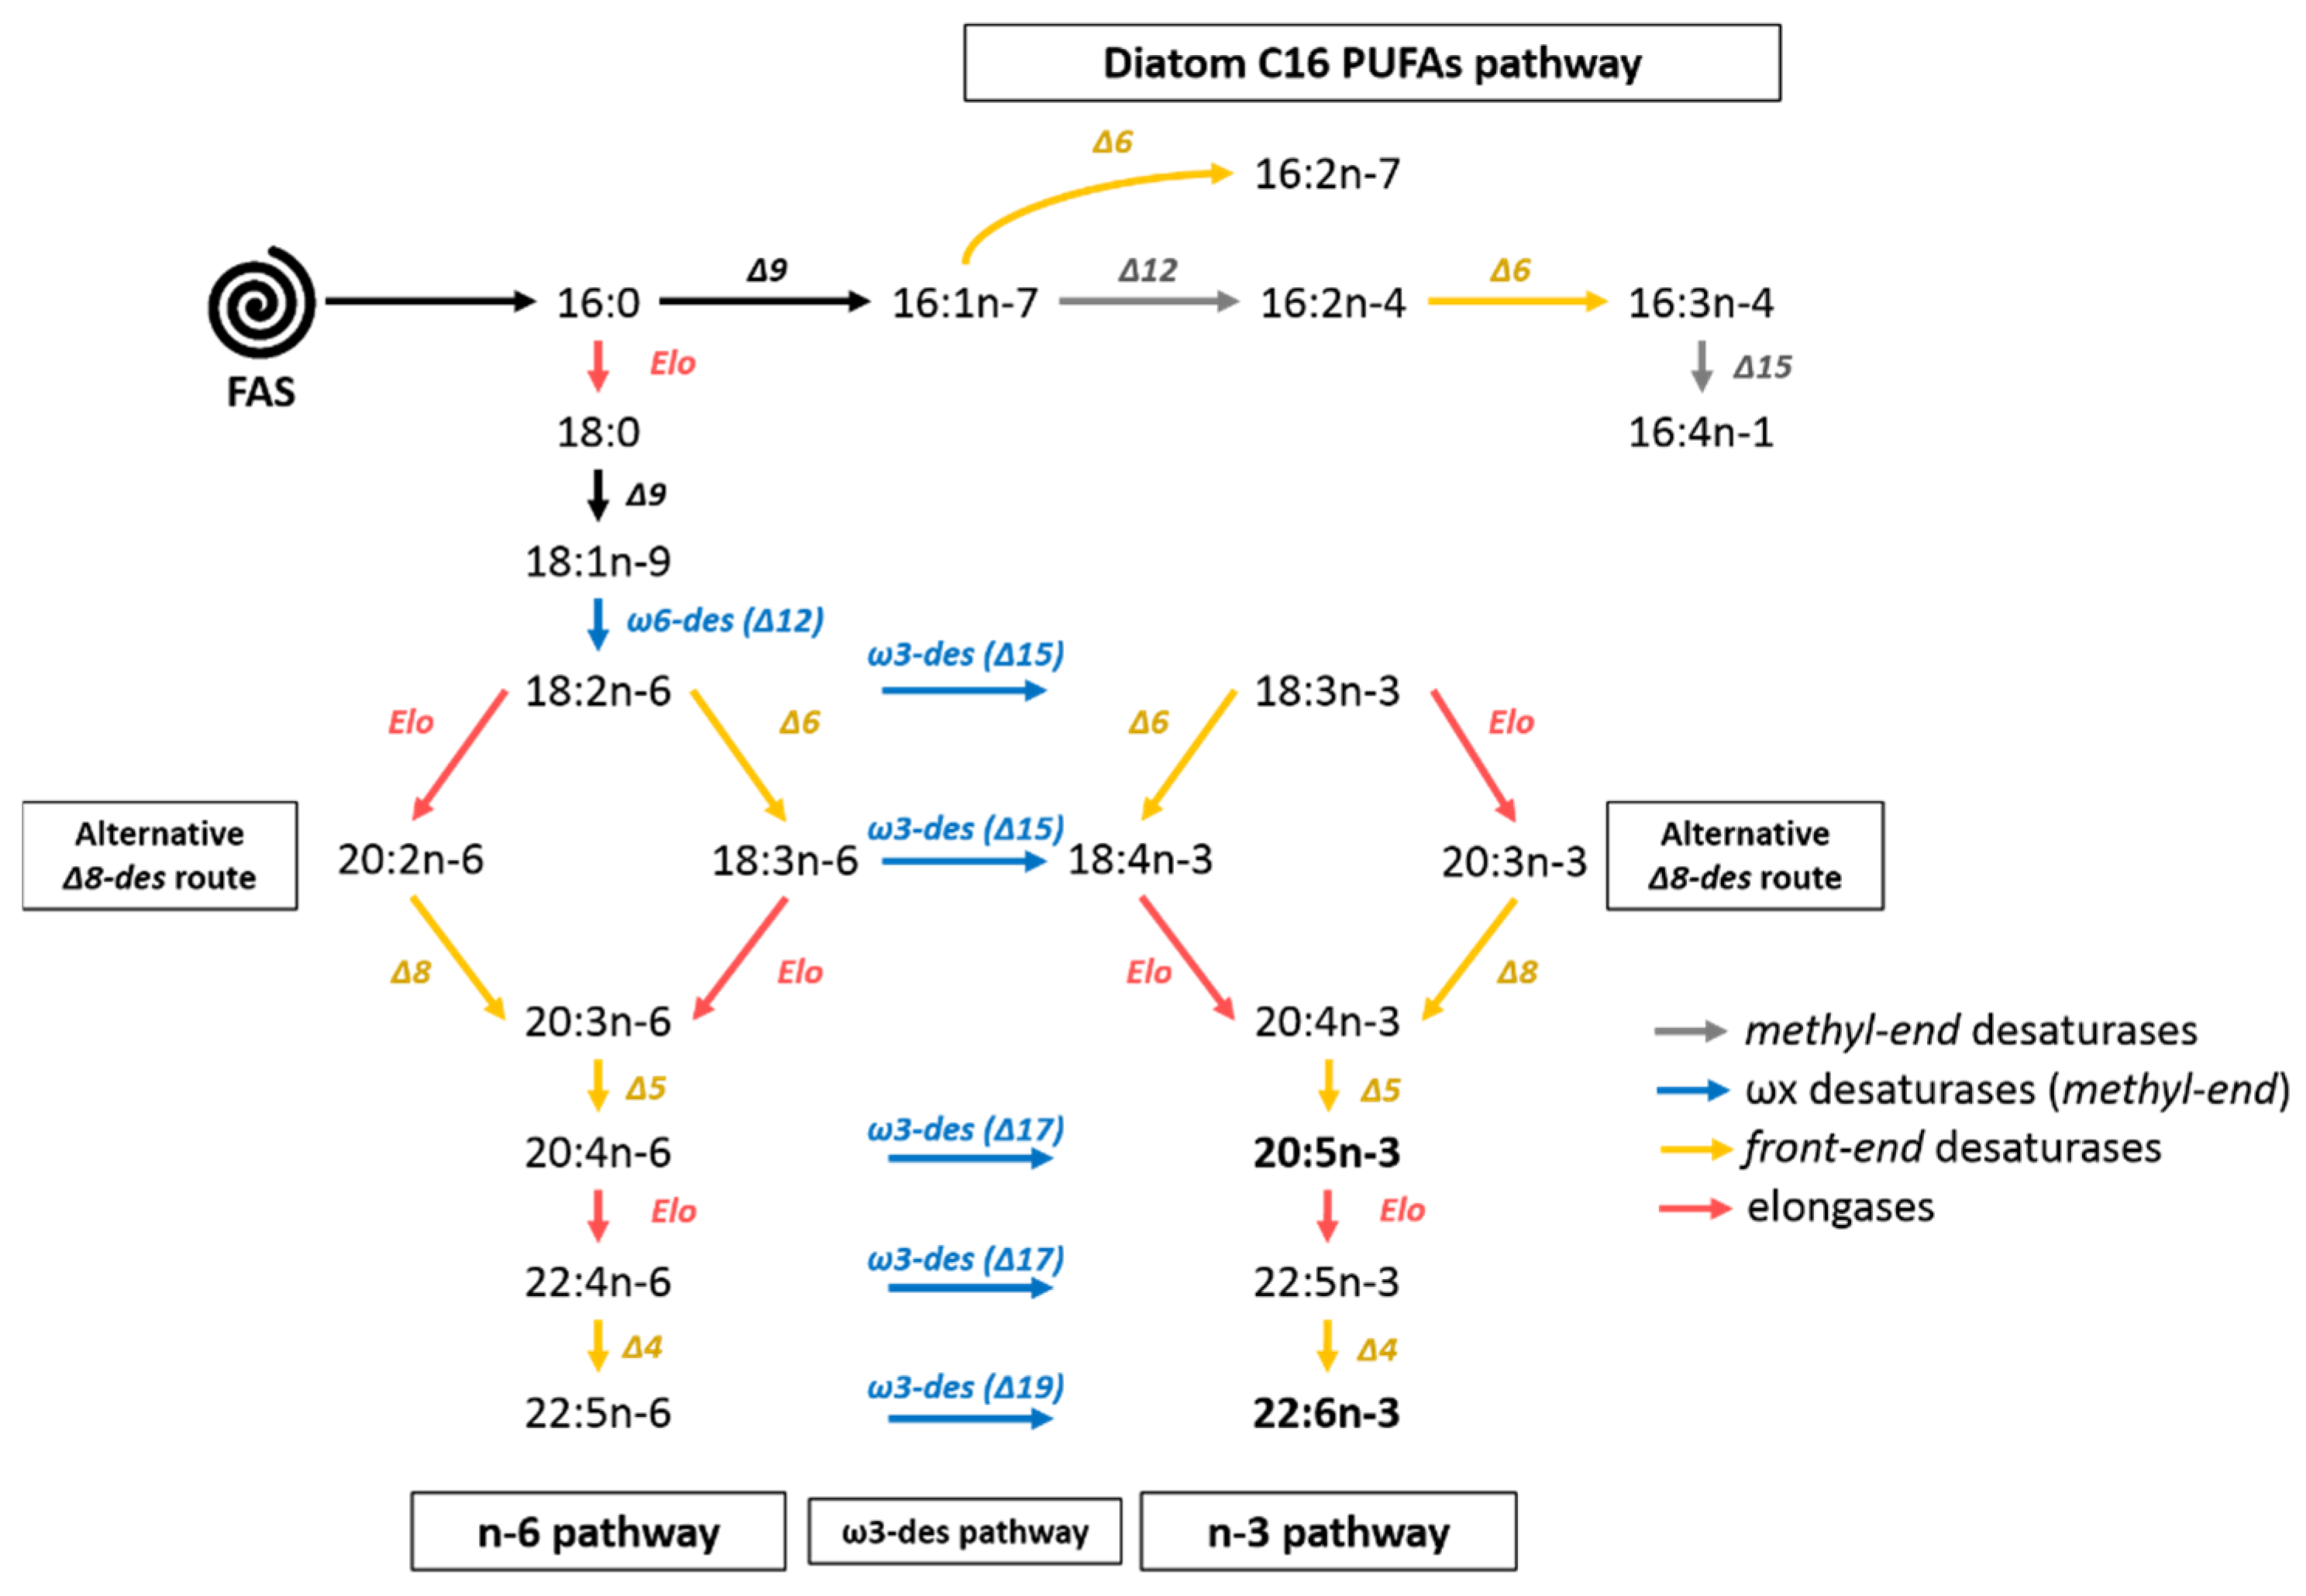
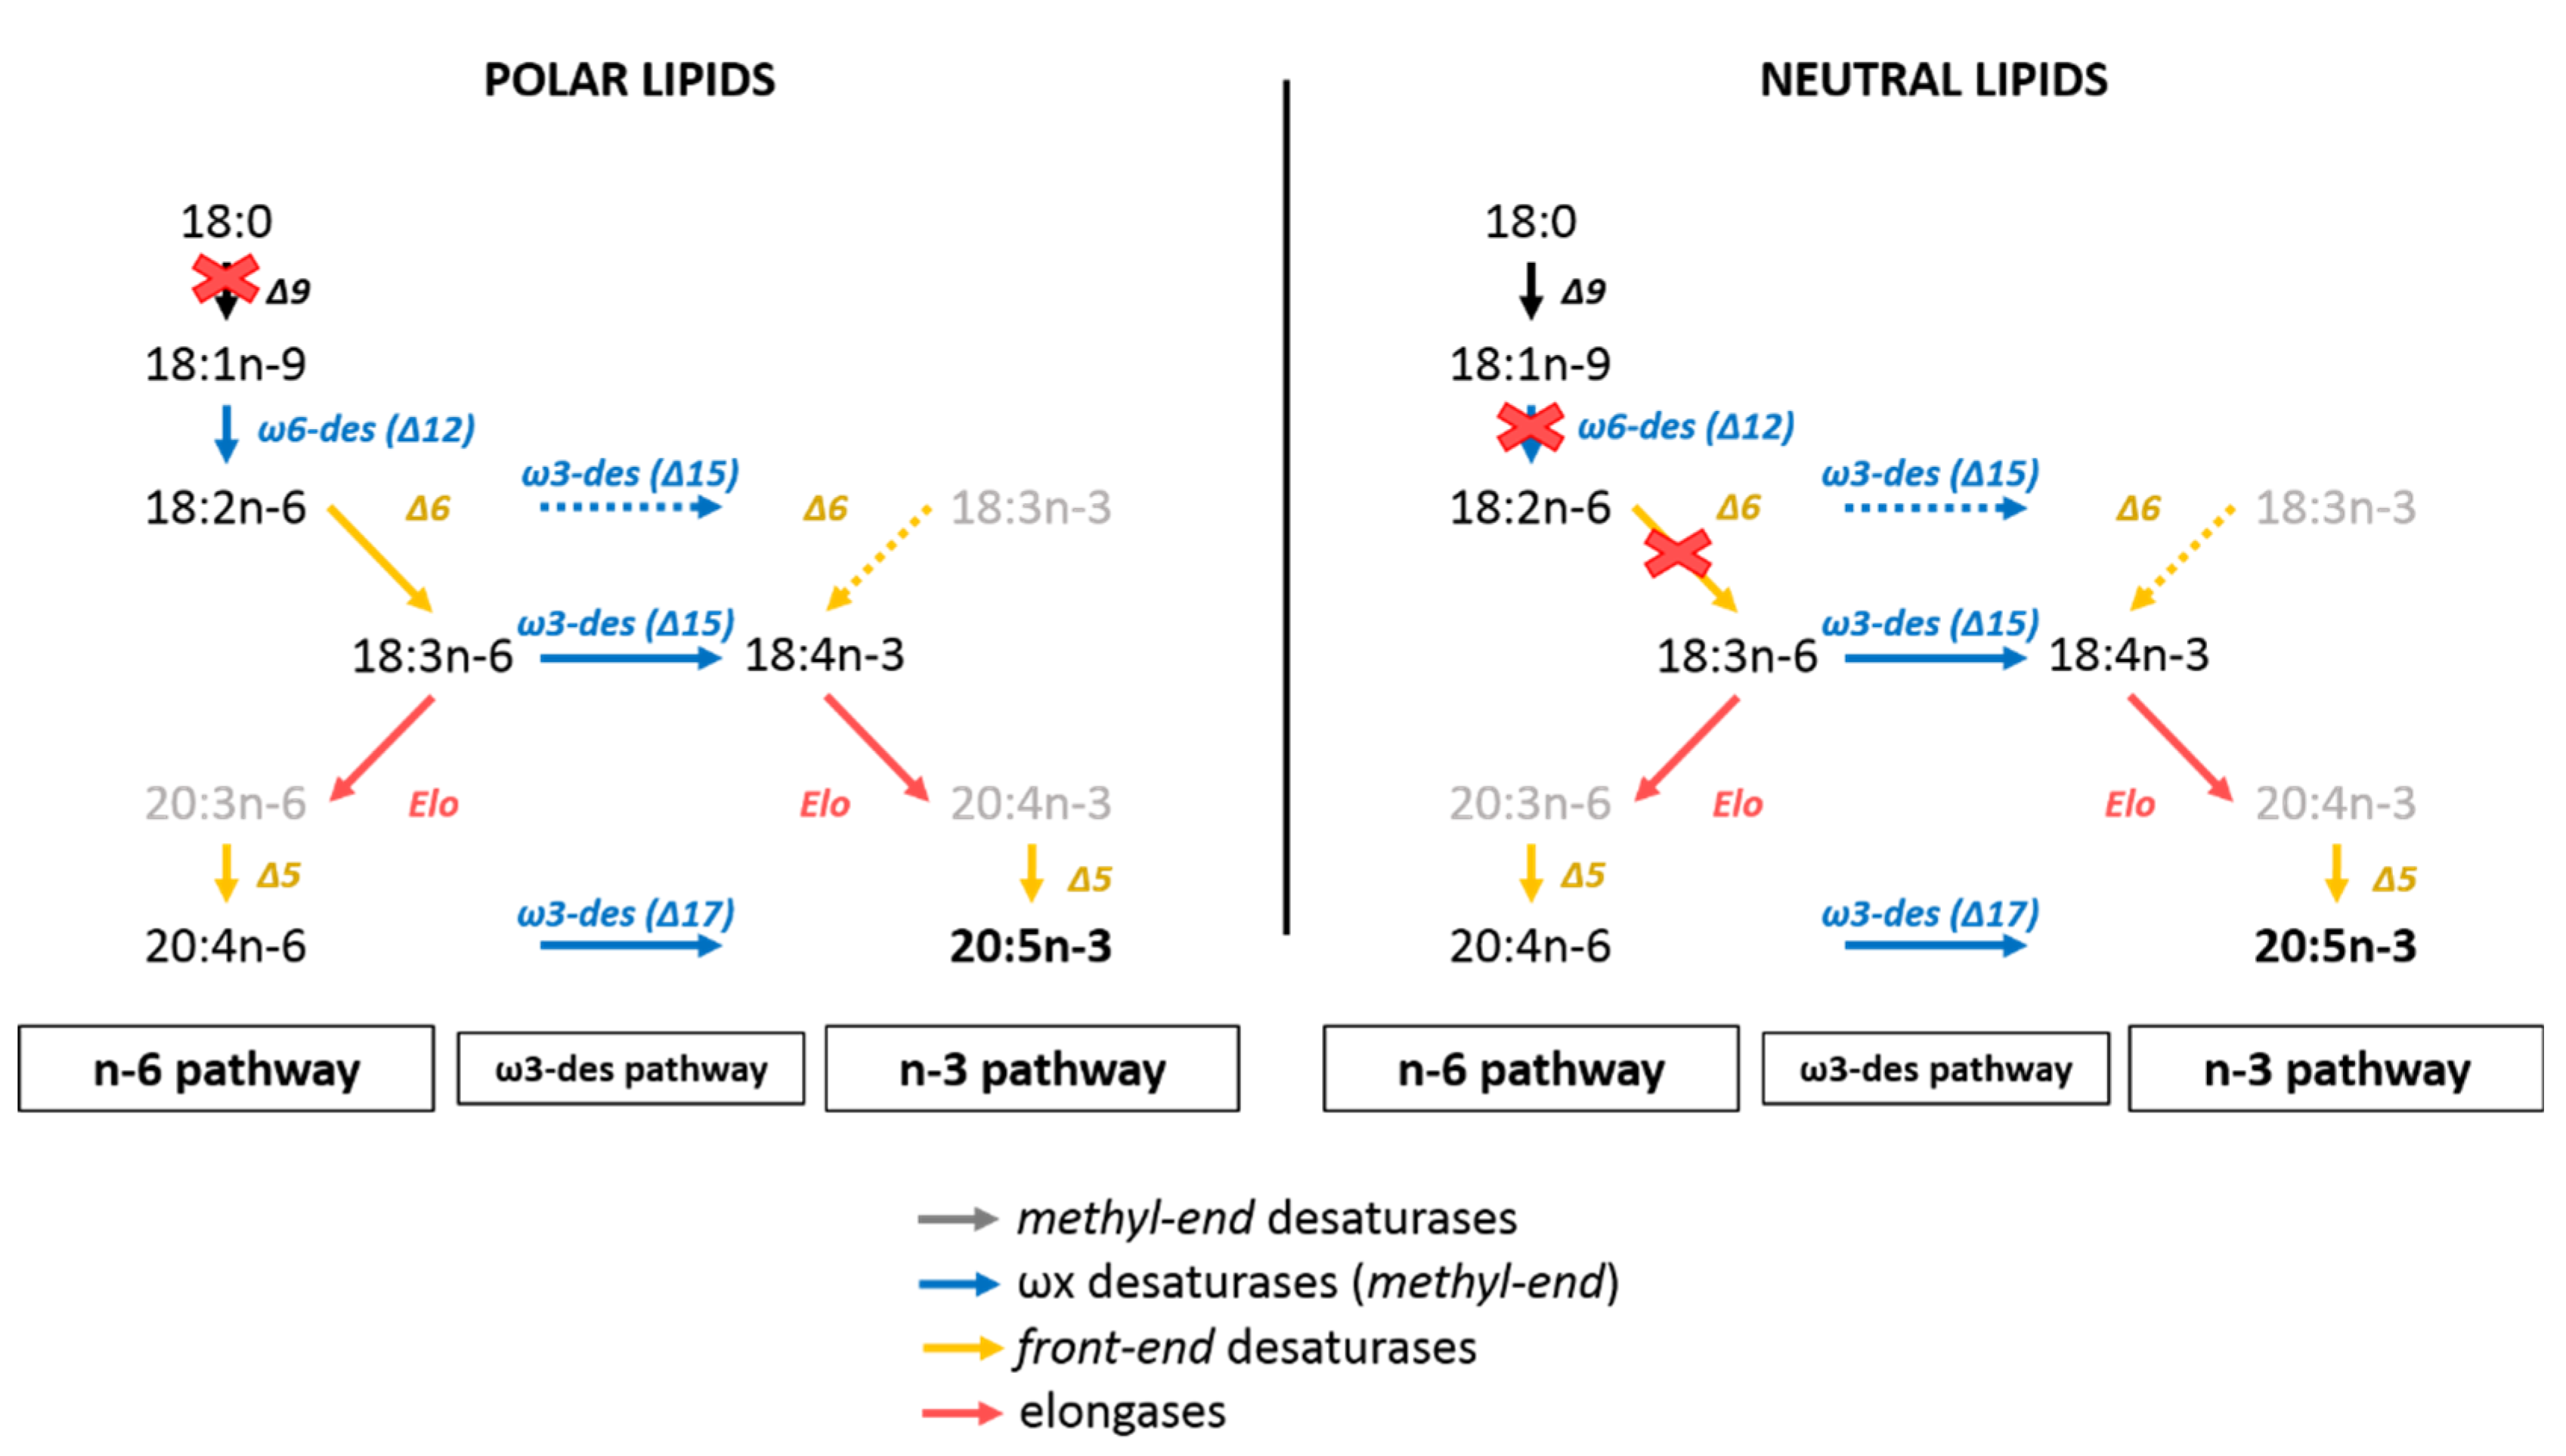
4.2. The C16 PUFAs Pathway in C. muelleri

C. muelleri showed similar fatty acids profile as other diatoms: 14:0, 16:0, 16:1n-7 and 20:5n-3 (EPA) were the major fatty acids for polar and neutral lipids with PUFA higher in polar lipids and SFA and MUFA predominant in neutral lipids [61,62,63,64,65]. The strong concentration of 16:1n-7 and its high enrichment supported its central role as a precursor of the C16 PUFAs pathway. The C16 PUFAs pathway is initiated by 16:1n-7 which is first desaturated in 16:2n-7 or 16:2n-4 [66,67]. Then, 16:2n-4 is desaturated again in 16:3n-4 and finally in 16:4n-1. In our experiment, 16:4n-1 was only present in trace amounts, 16:2n-7 and 16:2n-4 were in low concentrations, and 16:3n-4 was the most concentrated. We assumed that the C16 PUFAs synthesis pathway led to the accumulation of 16:3n-4 at the expense of its precursors. The 16:1n-7 being much more enriched than 16:3n-4 confirmed that 16:1n-7 can be its precursor. The low concentration of 16:2n-7 and 16:2n-4 suggested that these intermediates in the C16 PUFAs pathway were rapidly converted toward 16:3n-4. Furthermore, as 13C accumulation or incorporation could not be detected within these two synthesis intermediates, we can hypothesize that the desaturation of 16:1n-7 (16:1Δ9) to 16:2n-7 (16:2Δ6, 9) or to 16:2n-4 (16:2Δ9, 12) was the limiting step in the C16 PUFAs pathway toward 16:3n-4 (16:3Δ6, 9, 12). The fact that 16:1n-7 was among the most enriched FA in both NL and PL might reflect some storage process in “anticipation” of later C16 PUFAs synthesis, energy shortage or stress response.
Some studies have focused on the role played by 16:3n-4 in microalgae and plants. 16:3n-4, formed in the chloroplast, has been found in galactolipids and more precisely in monogalactodiacylglycerol (MGDG) of diatoms like Skeletonema costatum and Thalassiosira rotula [68,69,70]. With 16:4n-1, 16:3n-4 was speculated to help algae to cope with environmental stress [70]. Indeed, 16:3n-4 is involved in aldehyde synthesis: by oxidation, small aldehydes are formed from polyunsaturated fatty acids and contribute to repairing or controlling damages [68,69]. Desbois et al. [71] showed that 16:3n-4 and 16:1n-7 of the diatom Phaeodactylum tricornutum also presented antibacterial proprieties. 16:3n-4 is able to reduce or kill Gram + and Gram − bacteria.

4.3. EPA Synthesis Resulting from a Combination of n-3 and n-6 Pathways?

The sum of n-3 fatty acids was higher than those of n-6 fatty acids in C. muelleri. As mentioned before, 20:5n-3 and 18:4n-3 were the most concentrated n-3 fatty acids. Based on this, it could be assumed that the diatom synthetized 20:5n-3 mainly through the n-3 pathway rather than through the n-6 pathway. However, 18:3n-3 and 20:4n-3, the respective precursors of 18:4n-3 and 20:5n-3 [14], were only found in low quantities. Then, hypothesizing synthesis pathways based on fatty acid abundance could be biased if the end product is highly concentrated. Furthermore, the alternative Δ8-desaturase pathway converting 18:3n-3 into 20:3n-3 and next into 20:4n-3 [17,72] was probably limited in C. muelleri because these two FA were only found in trace amounts. It seems more likely that 18:4n-3 and 20:5n-3 were produced via ω3-desaturation of 18:3n-6 and 20:4n-6, respectively [66,73]. Among n-6 fatty acids, 18:3n-6 and 20:4n-6 were the two most important n-6 PUFAs. The existence of the connection between n-3 and n-6 pathways had been previously demonstrated. Indeed, for the diatom Phaeodactylum tricornutum, Arao and Yamada [14] showed, using 14C labeled substrate, that 20:5n-3 was synthesized through both n-3 and n-6 pathways. The 18:2n-6 and 18:3n-6 can respectively be used to form the 18:3n-3 and 18:4n-3 by a ω3-desaturase [19,66]. 18:3n-6 can also be produced from 18:2n-6 by a Δ6-desaturase [19,66] (Figure 1).
In our experiment, the specific uptake rates of n-6 PUFAs seemed to follow the known n-6 pathway fatty acids for polar lipids (18:1n-9 → 18:2n-6 → 18:3n-6 → 20:4n-6) and the ω3-desaturase pathway (18:3n-6 → 18:4n-3 and 20:4n-6 → 20:5n-3). Similar observations were made for the neutral lipid fraction. These statements were also supported by the atomic enrichment ratios linking fatty acid precursors and products. This means that synthesis of 18:3n-6 from 18:2n-6, 18:4n-3 from 18:3n-6, or 20:4n-6 from 18:3n-6, as well as 20:5n-3 from 18:4n-3 and 20:4n-6, were possible in C. muelleri. Concerning 20:5n-3 synthesis, it remains, however, difficult to precisely assess the respective contribution of 18:4n-3 and 20:4n-6 to its production. We can only assume that both were likely to occur in C. muelleri.

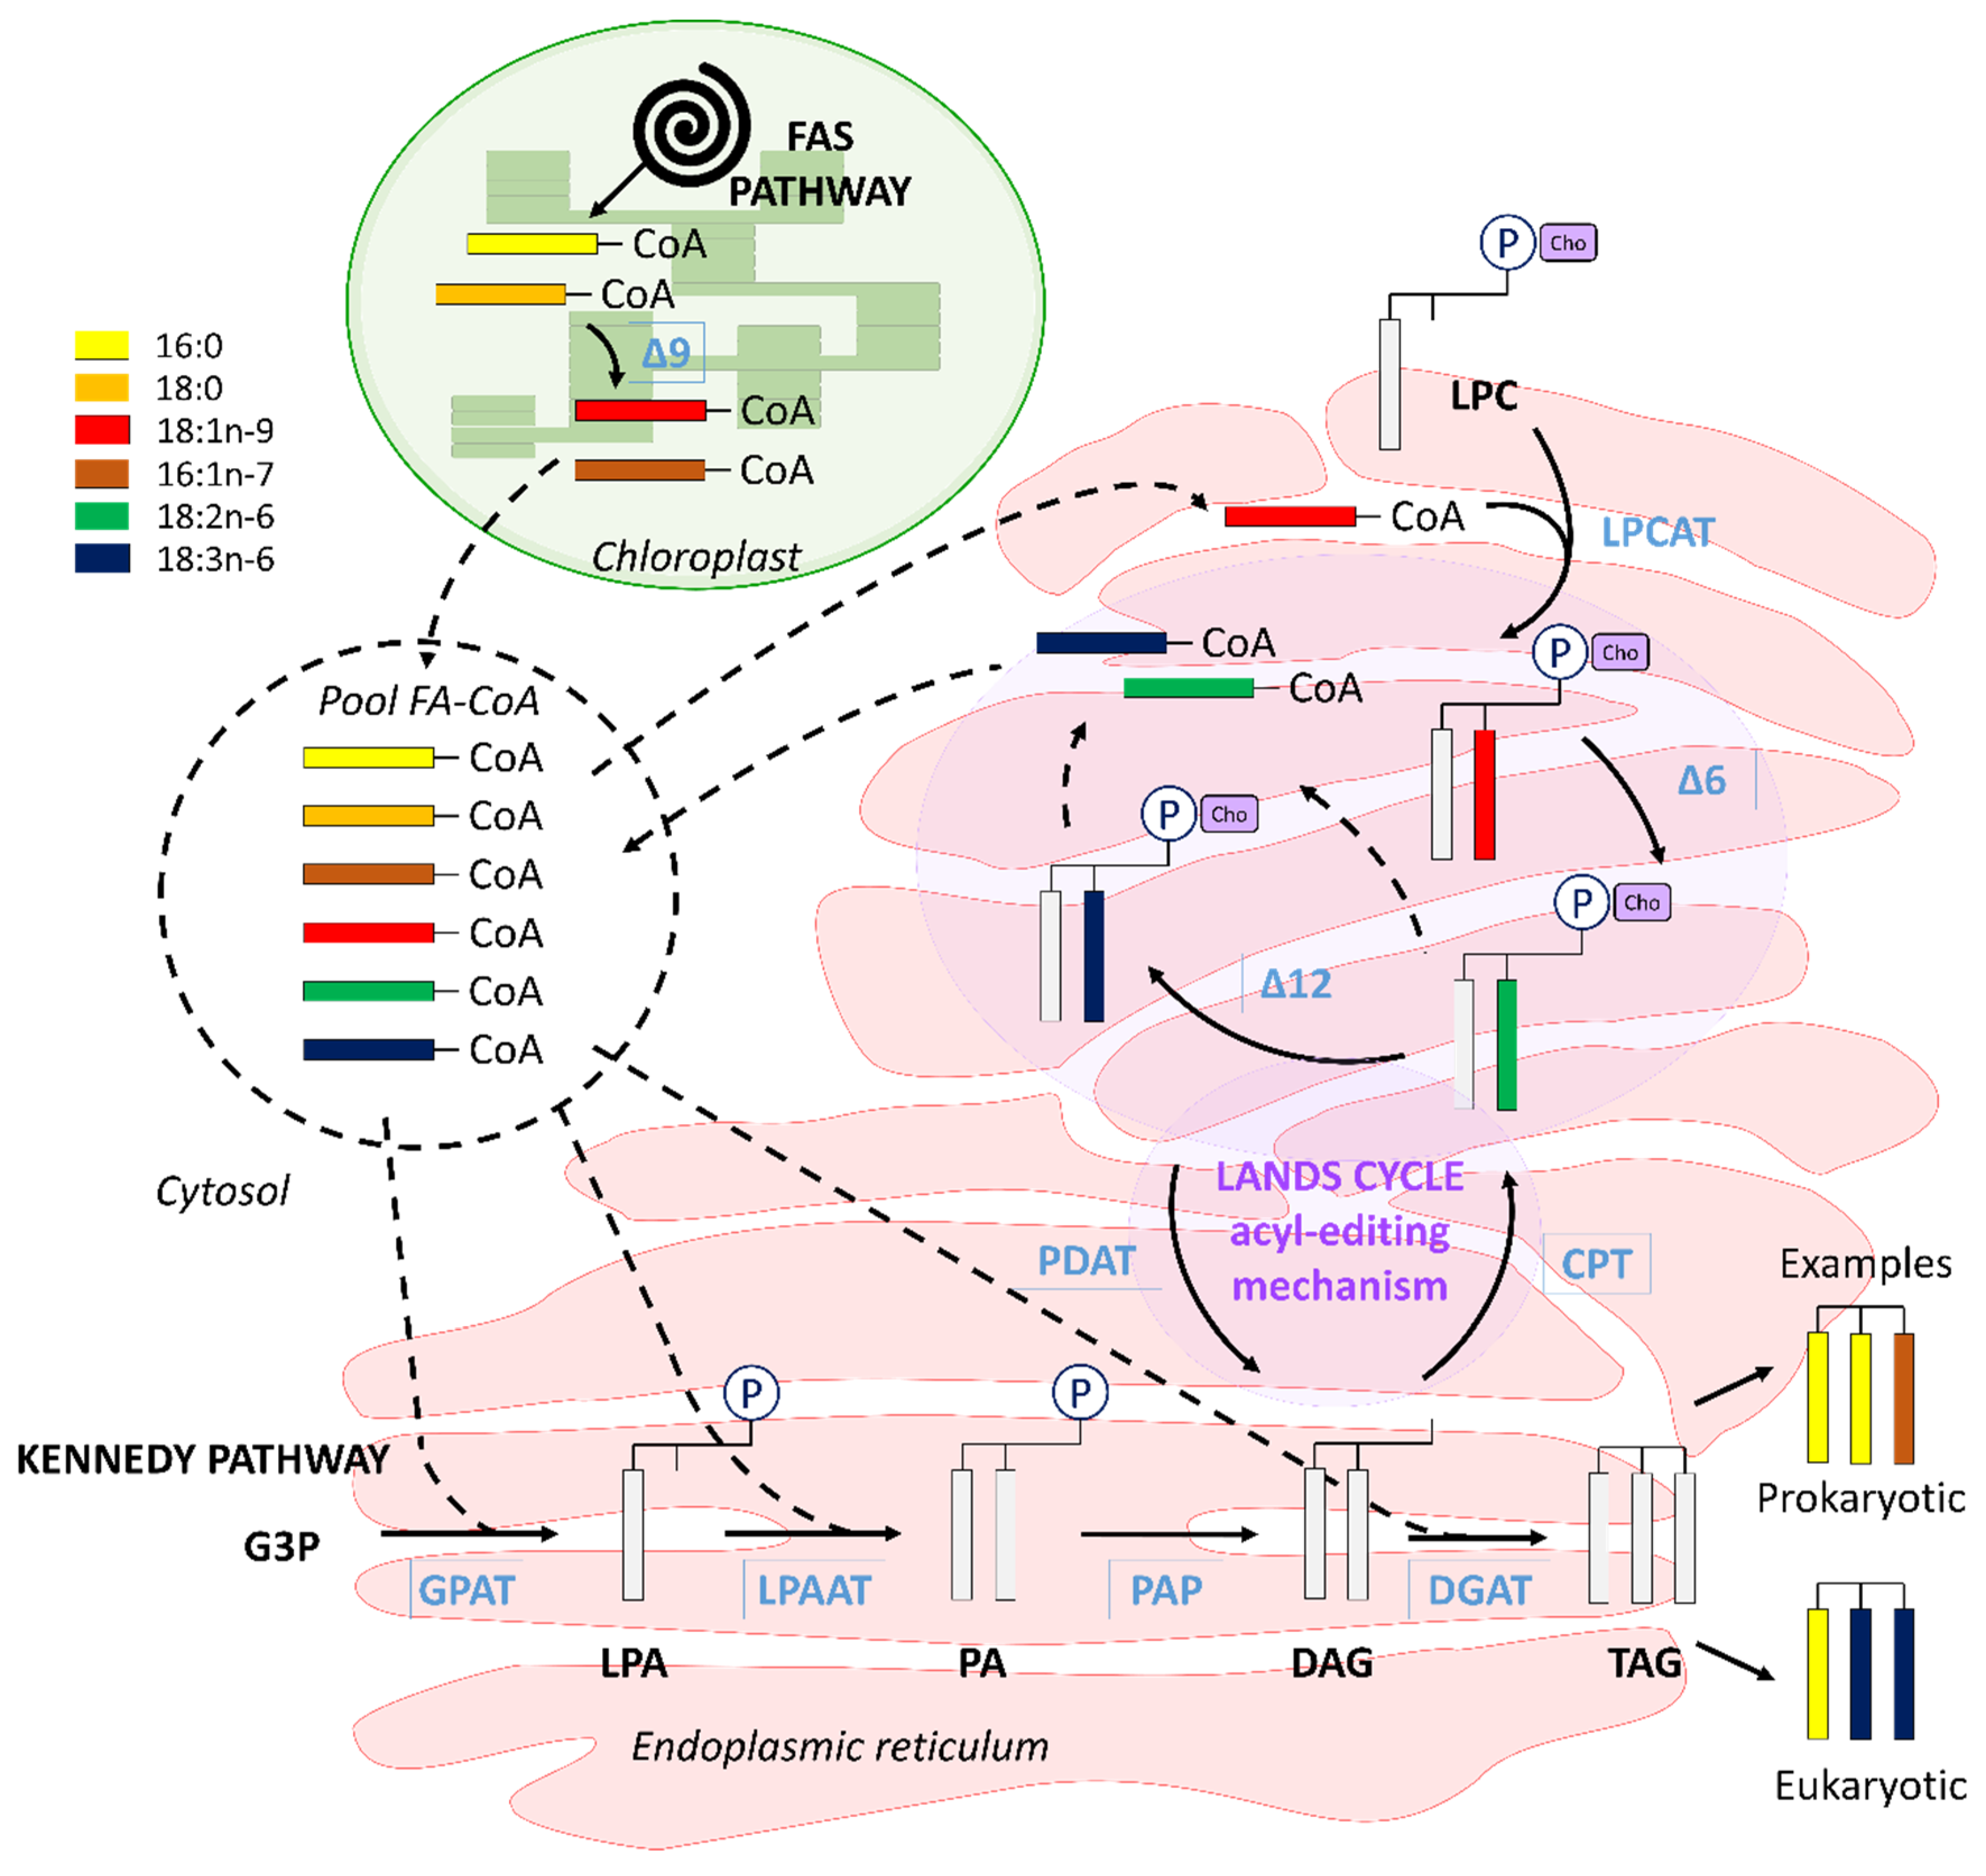
4.4. Interconnection between Polar and Neutral Pools in C. muelleri

The successions of fatty acid enrichments differed between NL and PL. While enrichments of 18:1n-9, 18:2n-6, 18:3n-6 and then 20:4n-6 were in agreement with the conventional n-6 pathway used by C. muelleri to synthesize its PUFAs in the polar fraction [14,15,16,19], the order varied for neutral lipids. Furthermore, the higher enrichments of 18:1n-9, 18:2n-6 and 18:3n-6 in PL as compared to NL strongly suggested that their synthesis and more specifically the insertion of the new double bound (desaturation) occurred in the form of glycolipid or phospholipid and are transferred to neutral lipids once synthesized. This can be linked to triacylglycerol (TAG) synthesis.
In diatoms, TAG are synthesized in the endoplasmic reticulum (ER) from diacylglycerol (DAG) [17,32]. They are used as energy or carbon storage. The synthesis of TAG occurs through the acyl-CoA pathway, called the Kennedy pathway. Some authors also hypothesized the possibility of TAG synthesis through an acyl-CoA-independent pathway [17,34]. The de novo Kennedy pathway consists in three consecutive acylations: (i) acylation of the sn-1 position of G3P by G3P acyltransferase (GPAT), producing lysophosphatidic acid (LPA), (ii) following esterification of LPA sn-2 position by lysophosphatidic acid acyltransferase (LPAAT) to give PA and (iii) finally, after release of the phosphate group, DAG sn-3 position acylation by DAG acyltransferase (DGAT) to produce TAG (Figure 12).
In the acyl-CoA-independent pathway, the phospholipid:DAG acyltransferase (PDAT) needs PC as an acyl donor to form DAG. This pathway relies on the Lands cycle, which consists of an acyl-editing mechanism that progressively changes the fatty acids composition of PC to a more unsaturated one [33,37] and thus modifies the final composition of the newly formed DAG (and consequently TAG) (Figure 12). The enzyme responsible for the combination of PC and DAG, the phospholipid:diacylglycerol acyltransferase (PDAT), has been identified in plants [74,75]. Enzymes involved in this Lands cycle pathway linking PC with DAG to form TAG and genes coding for PDAT have been identified in the diatom Phaeodactylum tricornutum [35,36]. This could support the existence of this pathway in diatoms as well.
If we apply these putative pathways to the observed enrichment dynamics, it seemed likely that 18:1n-9 (PL) was first synthesized in the chloroplast or in the cytosol where its suspected precursors can be found and entered PC after being transferred to the ER to be rapidly desaturated in 18:2n-6 (PL) and 18:3n-6 (PL) by the acyl-editing machinery. Then, these newly formed PUFAs can enter the acyl-CoA pool and be used for de novo synthesis by Kennedy pathway in the ER or C18 PUFAs can directly be exchanged with a low unsaturated FA in DAG to create a more highly unsaturated DAG, which was then used for TAG synthesis. Such interaction between phospholipids pool and DAG/TAG pool was suggested by Mus et al. [36] and Mülhroth et al. [35] following the discovery of gene coding for putative enzyme involved in this process. This would mainly concern 18:2 and 18:3 fatty acids [32]. Combined with our results, this supports the implication of PC-associated-PUFA in the TAG synthesis via DAG in diatoms (Figure 12).
18:1n-9 was enriched in the neutral fraction after 18:2n-6 and 18:3n-6. The ratio 18:2n-6/18:1n-9 was above 1 in NL, which indicates an unlikely synthesis of 18:2n-6 from 18:1n-9 within NL. We hypothesize that 18:1n-9 was synthesized in the cytosol from 18:0 (18:1n-9/18:0 < 1 in NL) at a slower rate than the transfer rates of 18:2n-6 and 18:3n-6 from the PL compartment to the neutral (storage) compartment. This would support the observation that the synthesis of 18:1n-9 can take place in both the plastid and the cytosol [76]. 18:1n-9 could then be introduced into DAG, and further, TAG by the Kennedy pathway. “Prokaryotic” configuration TAG with 18:0 or 18:1n-9 at position sn-1 or sn-3 has already been reported in diatoms [77,78,79].

4.5. C16 PUFAs and 20:5n-3: Linked on Glycerol Backbone in C. muelleri

Interconnections between polar and neutral lipids pools in diatoms were also revealed by the opposite trends observed for 20:5n-3 and 16:3n-4 in NL and PL fractions (concentrations of NL and PL fractions were anticorrelated: Spearman test, α = −0.66, p-value < 0.001 for 20:5n-3 and α = −0.73 for 16:3n-4, p-value < 0.001). These dynamics suggested some transfers between pools during C. muelleri growth. Moreover, both 16:3n-4 and 20:5n-3 were also correlated within the pool as shown with PCA analysis as well as with their respective atomic enrichment correlations (AE of 20:5n-3 and AE of 16:3n-4 were correlated: Spearman test α = 0.97, p-value < 0.001 and α = 0.99, p-value < 0.001, respectively, for NL and PL). However, these fatty acids were not directly associated in synthesis pathways (Figure 1). Consequently, these statistically connected dynamics would suggest 20:5n-3 and 16:3n-4 to be located on the same glycerol backbone and then presenting concomitant variation concentrations and enrichments between and/or within pools.
Based on cloning and functional characterization of P. tricornutum desaturases, Domergue et al. [66] and Mülhroth et al. [35] discussed the existence of connected pathways in diatoms between C16-PUFAs and 20:5n-3. Their idea came from the existence of a glycolipid presenting 16:3n-4 and 20:5n-3 at analogous positions (respectively position sn-2 and sn-1) of typical glycolipids (GL) produced via the prokaryotic pathway in P. tricornutum. Indeed, depending on the location of the synthesis of glycolipids (i.e., chloroplast “prokaryotic” or endoplasmic reticulum (ER) “eukaryotic”), the fatty acid composition varies: GL produced by the prokaryotic pathway will have C16 fatty acids at the sn-2 position, while those formed in the ER will present longer chain fatty acids (likely C18/C20 or C22) at sn-2 position [80,81]. Our results suggested the plastid origin of the glycolipids linking 20:5n-3 (sn-1) and 16:3n-4 (sn-2). However, 20:5n-3 synthesis and the responsible desaturase in P. tricornutum seemed exclusively located out of the chloroplast, contrasting with higher plant metabolism [66]. Then, to be added to chloroplast glycolipids, 20:5n-3 had to be transferred from the ER to the plastid. Transfers of FA precursors from the ER to the plastid have been reported to exist in plants and microalgae [17,82].
Thus, as for other diatoms and following the results introduced here, a structural and metabolic link could exist between 16:3n-4 and 20:5n-3 in C. muelleri, even if they were not synthesized in the same cell compartments (Figure 13). 20:5n-3 synthesized in the ER was assumed to be used to form prokaryotic glycolipids in association with 16:3n-4 produced in the chloroplast. Along the course of its synthesis, the molecule passed through polar and neutral pools, for example, PA to DAG (PL to NL pool) or DAG to glycolipids (NL to PL pool), which would explain the opposite dynamics observed in this experiment. Similar dynamics observed with 18:4n-3 could also be related to eukaryotic DAG synthesis in the ER (Figure 13).

5. Conclusions

C. muelleri synthetized 20:5n-3 via the combined use of n-3 and n-6 pathways. The conventional route via 18:3n-3 seemed inefficient and/or slow in the diatom: apart from 18:4n-3 and 20:5n-3, all the other n-3 PUFAs were present in low concentrations. As an alternative, C. muelleri appeared to produce its n-3 PUFAs from the n-6 substrate via the ω-3 desaturase pathway. This was especially the case of 18:3n-6, transformed into 18:4n-3 and 20:4n-6 converted into 20:5n-3. It was not possible to discriminate which PUFA between 20:4n-6 and 18:4n-3 was predominant in EPA synthesis. The use of 13C-label allowed us as well to assume the existence of an acyl-editing mechanism in C. muelleri responsible for the progressive desaturation of 18:1n-9. Initially produced in the plastid, this fatty acid would be transmitted to the ER combined with phosphatidylcholine (PC) to be desaturated into 18:2n-6 and 18:3n-6. This would allow the formation of a more unsaturated diacylglycerol, serving in turn to format of triacylglycerol or membrane lipids. C. muelleri relied on a tight connection between the neutral and polar pools. In the diatom, synthesis of galactolipids in the chloroplast might be dependent on acyl-CoA produced in the ER. This has been assumed with the opposite abundance dynamic of 16:3n-4 and 20:5n-3, which were both suspected to be located on the same glycerol backbone of glycolipids. 16:3n-4 would be produced in the plastid while 20:5n-3 by successive desaturation and elongation occurring in the ER.

Supplementary Materials

The following are available online at https://www.mdpi.com/2218-273X/10/5/797/s1.

Author Contributions

Conceptualization, M.R., F.P. and P.S.; data curation, M.R.; Formal analysis, M.R. and F.P.; funding acquisition, M.R., A.N.L., A.V. and P.S.; investigation, M.R., F.P., F.L.G., N.L.G., E.F., P.M. and P.S.; methodology, M.R., F.P., A.N.L., F.L.G., A.B., N.L.G., P.M. and P.S.; project administration, M.R. and P.S.; resources, P.M. and R.C.; software, M.R., F.L.G. and A.B.; supervision, M.R., F.P., A.N.L. and P.S.; validation, M.R. and N.L.G.; visualization, M.R.; writing—original draft, M.R.; writing—review and editing, M.R., F.P., A.N.L., F.L.G., A.B., N.L.G., E.F., P.M., R.C., A.V. and P.S. All authors have read and agreed to the published version of the manuscript.

Funding

This research was funded by the Université de Bretagne Occidentale (UBO) and Center for Marine Sciences (CMS) at the University of North Carolina Wilmington (UNCW), the Interdisciplinary School for the Blue Planet (ISblue) and the Walter-Zellidja grant of the Académie Française.

Acknowledgments

We would like to thank Christophe Lambert, Margaux Mathieu-Resuge, Adeline Bidault, Korydwen Terrasson and Corentin Baudet for their help during sampling and Oanez Lebeau for her support during isotopic analyses.

Conflicts of Interest

The authors declare no conflict of interest. The funders had no role in the design of the study; in the collection, analyses, or interpretation of data; in the writing of the manuscript, or in the decision to publish the results.

References

  1. Arts, M.T.; Ackman, R.G.; Holub, B.J. Essential fatty acids in aquatic ecosystems: A crucial link between diet and human health and evolution. Can. J. Fish. Aquat. Sci. 2001, 58, 122–137. [Google Scholar] [CrossRef]
  2. Mozzaffarian, D.; Wu, J.H.Y. (n-3) Fatty acids and cardiovascular health: Are effects of EPA and DHA shared or complementary? J. Nutr. 2012, 142, 614S–625S. [Google Scholar] [CrossRef] [PubMed] [Green Version]
  3. Hamed, I.; Özogul, F.; Özogul, Y.; Regenstein, J.M. Marine bioactive compounds and their health benefits: A review: Importance of functional seafood. Compr. Rev. Food Sci. Food Saf. 2015, 14, 446–465. [Google Scholar] [CrossRef]
  4. Tocher, D.; Betancor, M.B.; Sprague, M.; Olsen, R.E.; Napier, J.A. Omega-3 long-chain polyunsaturated fatty acids, EPA and DHA: Bridging the gap between supply and demand. Nutrients 2019, 11, 89. [Google Scholar] [CrossRef] [Green Version]
  5. Dalsgaard, J.; John, M.S.; Kattner, G.; Müller-Navarra, D.; Hagen, W. Fatty acid trophic markers in the pelagic marine environment. Adv. Mar. Biol. 2003, 46, 225–340. [Google Scholar] [CrossRef]
  6. Dijkman, N.A.; Kromkamp, J.C. Phospholipid-derived fatty acids as chemotaxonomic markers for phytoplankton: Application for inferring phytoplankton composition. Mar. Ecol. Prog. Ser. 2006, 324, 113–125. [Google Scholar] [CrossRef] [Green Version]
  7. Reuss, N.; Poulsen, L. Evaluation of fatty acids as biomarkers for a natural plankton community. A field study of a spring bloom and a post-bloom period off West Greenland. Mar. Biol. 2002, 141, 423–434. [Google Scholar] [CrossRef]
  8. Henjes, J.; Assmy, P.; Klaas, C.; Verity, P.; Smetacek, V. Response of microzooplankton (protist and small copepods) to an iron-induced phytoplankton bloom in the Southern Ocean (EisenEx). Deep Sea Res. Part I 2007, 54, 363–384. [Google Scholar] [CrossRef]
  9. Hernando, M.; Schloss, I.R.; Almandoz, G.O.; Malanga, G.; Varela, D.E.; De Troch, M. Combined effects of temperature and salinity on fatty acid content and lipid damage in Antarctic phytoplankton. J. Exp. Mar. Biol. Ecol. 2018, 503, 120–128. [Google Scholar] [CrossRef]
  10. Nichols, P.D.; Skerratt, J.H.; Davidson, A.; Burton, H.; McMeekin, T.A. Lipid of culture Phaecystis pouchetii: Signature for food-web, biogeochemical and environmental studies in Antartica and the Southern Ocean. Phytochemistry 1991, 30, 3209–3214. [Google Scholar] [CrossRef]
  11. Becker, S.; Graeve, M.; Bischof, K. Photosynthesis and lipid composition of the Antarctic endemic rhodophyte Palmaria decipiens: Effects of changing light and temperature levels. Polar Biol. 2010, 33, 945–955. [Google Scholar] [CrossRef] [Green Version]
  12. Christaki, U.; Obernosterer, I.; Van Wambeke, F.; Veldhuis, M.J.W.; Garcia, N.; Catala, P. Microbial food web structure in a naturally iron-fertilized area in the Southern Ocean (Kerguelen Plateau). Deep Sea Res. Part II Top. Stud. Oceanogr. 2008, 55, 706–719. [Google Scholar] [CrossRef]
  13. Corsolini, S.; Borghesi, N. A comparative assessment of fatty acids in Antarctic organisms from the Ross Sea: Occurrence and distribution. Chemosphere 2017, 174, 747–753. [Google Scholar] [CrossRef]
  14. Arao, T.; Yamada, M. Biosynthesis of polyunsaturated fatty acids in the marine diatom, Phaeodactylum tricornutum. Phytochemistry 1994, 35, 1177–1181. [Google Scholar] [CrossRef]
  15. Bell, M.V.; Tocher, D. Biosynthesis of polyunsaturated fatty acids in aquatic ecosystems: General pathways and new directions. In Lipids in Aquatic Ecosystems; Arts, M.T., Brett, M.T., Kainz, M., Eds.; Springer: New York, NY, USA, 2009; pp. 211–239. [Google Scholar]
  16. Gurr, M.I.; Harwood, J.L.; Frayn, K.N. Fatty acids structure and metabolism: Fatty acids biosynthesis. In Lipid biochemistry; Science, B., Ed.; Blackwell Science: Hoboken, NJ, USA, 2002; pp. 21–59. [Google Scholar]
  17. Khozin-Goldberg, I. The Physiology of Microalgae-Lipid metabolism in microalgae. In The Physiology of Microalgae; Borowitska, M.A., Beardall, J., Raven, J.A., Eds.; Springer International Publishing: Cham, Switzerland, 2016; pp. 413–484. [Google Scholar]
  18. Metz, J.G.; Roessler, P.; Facciotti, D.; Levering, C.; Dittrich, F.; Lassner, M.; Valentine, R.; Lardizabal, K.; Domergue, F.; Yamada, A.; et al. Production of polyunsaturated fatty acids by polyketide synthases in both prokaryotes and eukaryotes. Science 2001, 293, 290–293. [Google Scholar] [CrossRef]
  19. Domergue, F.; Lerchl, J.; Zähringer, U.; Heinz, E. Cloning and functional characterization of Phaeodactylum tricornutum front-end desaturases involved in eicosapentaenoic acid biosynthesis. Eur. J. Biochem. 2002, 269, 4105–4113. [Google Scholar] [CrossRef]
  20. Qi, B.; Beaudoin, F.; Fraser, T.; Stobart, A.K.; Napier, J.A.; Lazarus, C.M. Identification of a cDNA encoding a novel C18-Δ9 polyunsaturated fatty acid-specific elongating activity from the docosahexaenoic acid (DHA)-producing microalga, Isochrysis galbana. Febs Lett. 2002, 510, 159–165. [Google Scholar] [CrossRef] [Green Version]
  21. Zhou, X.; Robert, S.S.; Petrie, J.R.; Frampton, D.M.F.; Mansour, M.P.; Blackburn, S.I.; Nichols, P.D.; Green, A.G.; Singh, S.P. Isolation and characterization of genes from the marine microalga Pavlova salina encoding three front-end desaturases involved in docosahexaenoic acid biosynthesis. Phytochemistry 2007, 68, 785–796. [Google Scholar] [CrossRef]
  22. Sayanova, O.; Haslam, R.P.; Caleron, M.V.; Lopez, N.R.; Worthy, C.; Rooks, P.; Allen, M.J.; Napier, J.A. Identification and functional characterisation of genes encoding the omega-3 polyunsaturated fatty acid biosynthetic pathway from the coccolithophore Emiliania huxleyi. Phytochemistry 2011, 72, 594–600. [Google Scholar] [CrossRef]
  23. Ratledge, C. Fatty acid biosynthesis in microorganisms being used for Single Cell Oil production. Biochimie 2004, 86, 807–815. [Google Scholar] [CrossRef] [PubMed]
  24. Armenta, R.E.; Valentine, M.C. Single-cell oils as a source of omega-3 fatty acids: An overview of recent advances. J. Am. Oil Chem. Soc. 2013, 90, 167–182. [Google Scholar] [CrossRef]
  25. Ye, C.; Qiao, W.; Yu, X.; Ji, X.-J.; Huang, H.; Collier, J.L.; Liu, L. Reconstruction and analysis of the genome-scale metabolic model of Schizochytrium limacinum SR21 for docosahexaenoic acid production. BMC Genom. 2015, 16, 799–810. [Google Scholar] [CrossRef] [PubMed] [Green Version]
  26. Hauvermale, A.; Kuner, J.; Rosenzweig, B.; Guerra, D.; Diltz, S.; Metz, J.G. Fatty acid production in Schizochytrium sp.: Involvement of a polyunsaturated fatty acid synthase and a type I fatty acid synthase. Lipids 2006, 41, 739–747. [Google Scholar] [CrossRef] [PubMed]
  27. Pereira, H.; Barreira, L.; Figueiredo, F.; Custódio, L.; Vizetto-Duarte, C.; Polo, C.; Resek, E.; Engelen, A.; Varela, J. Polyunsaturated fatty acids of marine macroalgae: Potential for nutritional and pharmaceutical applications. Mar. Drugs 2012, 10, 1920–1935. [Google Scholar] [CrossRef] [Green Version]
  28. Caramujo, M.J.; Boschker, H.T.S.; Admiraal, W. Fatty acid profiles of algae mark the development and composition of harpacticoid copepods. Freshw. Biol. 2007, 53, 77–90. [Google Scholar] [CrossRef] [Green Version]
  29. Hixson, S.M.; Arts, M.T. Climate warming is predicted to reduce omega-3, long-chain, polyunsaturated fatty acid production in phytoplankton. Glob. Chang. Biol. 2016, 22, 2744–2755. [Google Scholar] [CrossRef]
  30. de Carvalho, C.; Caramujo, M.J. Fatty acids as a tool to understand microbial diversity and their role in food webs of mediterranean temporary ponds. Molecules 2014, 19, 5570–5598. [Google Scholar] [CrossRef] [Green Version]
  31. Sayanova, O.; Mimouni, V.; Ulmann, L.; Morant, A.; Pasquet, V.; Schoefs, B.; Napier, J.A. Modulation of lipid biosynthesis by stress in diatoms. Philos. Trans. R. Soc. B 2017, 372, 14. [Google Scholar] [CrossRef] [Green Version]
  32. Zulu, N.N.; Zienkiewicz, K.; Vollheyde, K.; Feussner, I. Current trends to comprehend lipid metabolism in diatoms. Prog. Lipid Res. 2018, 70, 1–16. [Google Scholar] [CrossRef]
  33. Bates, P.D.; Browse, J. The significance of different diacylgycerol synthesis pathways on plant oil composition and bioengineering. Front. Plant. Sci. 2012, 3, 147. [Google Scholar] [CrossRef] [Green Version]
  34. Maréchal, E.; Lupette, J. Relationship between acyl-lipid and sterol metabolisms in diatoms. Biochimie 2019, 169, 3–11. [Google Scholar] [CrossRef]
  35. Mülhroth, A.; Li, K.; Røkke, G.; Winge, P.; Olsen, Y.; Hohmann-Mariott, M.; Vadstein, O.; Bones, A. Pathways of lipid metabolism in marine algae, co-expression network, bottlenecks and candidate genes for enhanced production of EPA and DHA in species of Chromista. Mar. Drugs 2013, 11, 4662–4697. [Google Scholar] [CrossRef]
  36. Mus, F.; Toussaint, J.-P.; Cooksey, K.E.; Fields, M.W.; Gerlach, R.; Peyton, B.M.; Carlson, R.P. Physiological and molecular analysis of carbon source supplementation and pH stress-induced lipid accumulation in the marine diatom Phaeodactylum tricornutum. Appl. Microbiol. Biotechnol. 2013, 97, 3625–3642. [Google Scholar] [CrossRef] [Green Version]
  37. Lands, W.E.M. Metabolism of glycerolipides: A comparison of lecithin and triglycerides synthesis. J. Biol. Chem. 1958, 231, 883–888. [Google Scholar]
  38. Wang, L.; Shen, W.; Kazachkov, M.; Chen, G.; Chen, Q.; Carlsson, A.S.; Stymne, S.; Weselake, R.J.; Zou, J. Metabolic interactions between the Lands cycle and the Kennedy pathway of glycerolipid synthesis in Arabidopsis developing seeds. Plant. Cell 2012, 24, 4652–4669. [Google Scholar] [CrossRef] [Green Version]
  39. Courchesne, N.M.D.; Parisien, A.; Wang, B.; Lan, C.Q. Enhancement of lipid production using biochemical, genetic and transcription factor engineering approaches. J. Biotechnol. 2009, 141, 31–41. [Google Scholar] [CrossRef]
  40. Gong, Y.; Wan, X.; Jiang, M.; Hu, C.; Hu, H.; Huang, F. Metabolic engineering of microorganisms to produce omega-3 very long chain polyunsaturated fatty acids. Prog. Lipid Res. 2014, 56, 19–35. [Google Scholar] [CrossRef]
  41. Xiong, W.; Liu, L.; Wu, C.; Yang, C.; Wu, Q. 13C-tracer and Gas Chromatography-Mass Spectrometry analyses reveal metabolic flux distribution in the oleaginous microalga Chlorella protothecoides. Plant. Physiol. 2010, 154, 1001–1011. [Google Scholar] [CrossRef] [Green Version]
  42. Cui, J.; Diao, J.; Sun, T.; Shi, M.; Liu, L.; Wang, F.; Chen, L.; Zhang, W. 13C Metabolic Flux Analysis of enhanced lipid accumulation modulated by ethanolamine in Crypthecodinium cohnii. Front. Microbiol. 2018, 9, 956. [Google Scholar] [CrossRef]
  43. Martzolff, A.; Cahoreau, E.; Cogne, G.; Peyriga, L.; Portais, J.-C.; Dechandol, E.; Le Grand, F.; Massou, S.; Gonçalves, O.; Pruvost, J.; et al. Photobioreactor design for isotopic non-stationnary 13C-metabolic flux analysis (INST 13C-MFA) under photoautotrophic conditions. Biotechnol. Bioeng. 2012, 109, 3030–3040. [Google Scholar] [CrossRef] [Green Version]
  44. Grosse, J.; Van Breugel, P.; Boschker, H.T.S. Tracing carbon fixation in phytoplankton-compound specific and total 13C incorporation rates: 13C uptake into macromolecules. Limnol. Oceanogr. Methods 2015, 13, 288–302. [Google Scholar] [CrossRef] [Green Version]
  45. Menzel, R.; Ngosong, C.; Ruess, L. Isotopologue profiling enables insights into dietary routing and metabolism of trophic biomarker fatty acids. Chemoecology 2017, 27, 101–114. [Google Scholar] [CrossRef]
  46. Wei, X.; Shi, B.; Koo, I.; Yin, X.; Lorkiewicz, P.; Suhail, H.; Rattan, R.; Giri, S.; McClain, C.J.; Zhang, X. Analysis of stable isotope assisted metabolomics data acquired by GC-MS. Anal. Chim. Acta 2017, 980, 25–32. [Google Scholar] [CrossRef]
  47. Lima, V.F.; Perez de Souza, L.; Williams, T.C.R.; Fernie, A.R.; Daloso, D.M. Gas chromatography-mass spectrometry based 13C labeling studies in plant metabolomics. In Plant Metabolomics; Antonio, C., Ed.; Springer: New York, NY, USA, 2018; Volume 1778, pp. 47–58. [Google Scholar]
  48. Rousseaux, C.; Gregg, W. Interannual variation in phytoplankton primary production at a global scale. Remote Sens. 2014, 6, 1–19. [Google Scholar] [CrossRef] [Green Version]
  49. González-Fernández, C.; Toullec, J.; Lambert, C.; Le Goïc, N.; Seoane, M.; Moriceau, B.; Huvet, A.; Berchel, M.; Vincent, D.; Courcot, L.; et al. Do transparent exopolymeric particles (TEP) affect the toxicity of nanoplastics on Chaetoceros neogracile? Environ. Pollut. 2019, 250, 873–882. [Google Scholar] [CrossRef]
  50. Tracy, B.P.; Gaida, S.M.; Papoutsakis, E.T. Flow cytometry for bacteria: Enabling metabolic engineering, synthetic biology and the elucidation of complex phenotypes. Curr. Opin. Biotechnol. 2010, 21, 85–99. [Google Scholar] [CrossRef]
  51. Le Goïc, N.; Hegaret, H.; Boulais, M.; Béguel, J.-P.; Lambert, C.; Fabioux, C.; Soudant, P. Flow cytometric assessment of morphology, viability, and production of Reactive Oxygen Species of Crassostrea gigas oocytes. Application to toxic Dinoflagellate (Alexandrium minutum) exposure. Cytom. Part. A 2014, 85A, 1049–1056. [Google Scholar] [CrossRef] [Green Version]
  52. Seoane, M.; González-Fernández, C.; Soudant, P.; Huvet, A.; Esperanza, M.; Cid, A.; Paul-Pont, I. Polystyrene microbeads modulate the energy metabolism of the marine diatom Chaetoceros neogracile. Environ. Pollut. 2019, 251, 362–371. [Google Scholar] [CrossRef]
  53. Lelong, A.; Haberkorn, H.; Le Goïc, N.; Hégaret, H.; Soudant, P. A new insight into allelopathic effects of Alexandrium minutum on photosynthesis and respiration of the Diatom Chaetoceros neogracile revealed by photosynthetic-performance analysis and flow cytometry. Microb. Ecol. 2011, 62, 919–930. [Google Scholar] [CrossRef]
  54. Trull, T.W.; Davies, D.M.; Dehairs, F.; Cavagna, A.J.; Lasbleiz, M.; Laurenceau-Cornec, E.C.; Ovidio, F.; Planchon, F.; Leblanc, K.; Quéguiner, B.; et al. Chemometric perspectives on plankton community responses to natural iron fertilisation over and downstream of the Kerguelen Plateau in the Southern Ocean. Biogeosciences 2015, 12, 1029–1056. [Google Scholar] [CrossRef] [Green Version]
  55. Brooks, P.D.; Geilmann, H.; Werner, R.A.; Brand, W. Improved precision of coupled 13C and 15N measurements from single samples using an elemental analyser. Rapid Commun. Mass Spectrom. 2003, 12, 1924–1926. [Google Scholar] [CrossRef]
  56. United States Environmental Protection Agency, U.S.E. Methods for the Determination of Chemical Substances in Marine and Estuarine Environmental Matrices; US Environmental Protection Agency: Washington, DC, USA, 1997; p. 199. [Google Scholar]
  57. Assayag, N.; Rivé, K.; Ader, M.; Jézéquel, D.; Agrinier, P. Improved method for isotopic and quantitative analysis of dissolved inorganic carbon in natural water samples. Rapid Commun. Mass Spectrom. 2006, 20, 2243–2251. [Google Scholar] [CrossRef]
  58. Larsson, C.; Ahlstrøm, Ø.; Junghans, P.; Jensen, R.B.; Blache, D.; Tauson, A.-H. The oral [13C]bicarbonate technique for measurement of short-term energy expenditure of sled dogs and their physiological response to diets with different fat:carbohydrate ratios. J. Nutr. Sci. 2015, 4, 10. [Google Scholar] [CrossRef] [PubMed] [Green Version]
  59. Le Grand, F.; Soudant, P.; Siah, A.; Tremblay, P.; Marty, Y.; Kraffe, E. Disseminated Neoplasia in the soft-shell clam Mya arenaria: Membrane lipid composition and functional parameters of circulating cells. Lipids 2014, 49, 807–818. [Google Scholar] [CrossRef] [PubMed]
  60. Mathieu-Resuge, M.; Schaal, G.; Kraffe, E.; Corvaisier, R.; Lebeau, O.; Lluch-Costa, S.E.; Salgado García, R.L.; Kainz, M.J.; Le Grand, F. Different particle sources in a bivalve species of a coastal lagoon: Evidence from stable isotopes, fatty acids, and compound-specific stable isotopes. Mar. Biol. 2019, 166, 89–101. [Google Scholar] [CrossRef]
  61. Volkman, J.K.; Jeffrey, S.W.; Nichols, P.D.; Rogers, G.I.; Garland, C.D. Fatty acid and lipid composition of 10 species of microalgae used in mariculture. J. Exp. Mar. Biol. Ecol. 1989, 128, 219–240. [Google Scholar] [CrossRef]
  62. Hatate, H.; Ohgai, M.; Murase, N.; Miyake, N.; Suzuki, N. Accumulation of fatty acids in Chaetoceros gracilis (Bacillariophyceae) during stationary growth phase. Fish. Sci. 1998, 64, 578–581. [Google Scholar] [CrossRef] [Green Version]
  63. Vazhappilly, R.; Chen, F. Eicosapentaenoic acid and docosahexaenoic acid production potential of microalgae and their heterotrophic growth. J. Am. Oil Chem. Soc. 1998, 75, 393–397. [Google Scholar] [CrossRef]
  64. Pernet, F.; Tremblay, R.; Demers, E.; Roussy, M. Variation of lipid class and fatty acid composition of Chaetoceros muelleri and Isochrysis sp. grown in a semicontinuous system. Aquaculture 2003, 221, 393–406. [Google Scholar] [CrossRef]
  65. Vaezi, R.; Napier, J.A.; Sayanova, O. Identification and functional characterization of genes encoding omega-3 polyunsaturated fatty acid biosynthetic activities from unicellular microalgae. Mar. Drugs 2013, 11, 5116–5129. [Google Scholar] [CrossRef] [Green Version]
  66. Domergue, F.; Spiekermann, P.; Lerchl, J.; Beckmann, C.; Kilian, O.; Kroth, P.G.; Boland, W.; Zahringer, U.; Heinz, E. New insight into Phaeodactylum tricornutum fatty acid metabolism. Cloning and functional characterization of plastidial and microsomal Δ12-fatty acid desaturases. Plant. Physiol. 2003, 131, 1648–1660. [Google Scholar] [CrossRef] [PubMed] [Green Version]
  67. Desvillettes, C.; Bec, A. Formation and transfer of fatty acids in aquatic microbial food webs: Role of heterotrophic protists. In Lipids in Aquatic Ecosystems; Arts, M.T., Kainz, M., Eds.; Springer: New York, NY, USA, 2009; pp. 25–42. [Google Scholar]
  68. d’Ippolito, G.; Cutignano, A.; Briante, R.; Febbraio, F.; Cimino, G.; Fontana, A. New C16 fatty-acid-based oxylipin pathway in the marine diatom Thalassiosira rotula. Org. Biomol. Chem. 2005, 3, 4065. [Google Scholar] [CrossRef]
  69. d’Ippolito, G.; Tucci, S.; Cutignano, A.; Romano, G.; Cimino, G.; Miralto, A.; Fontana, A. The role of complex lipids in the synthesis of bioactive aldehydes of the marine diatom Skeletonema costatum. Biochim. Et Biophys. Acta (Bba) Mol. Cell Biol. Lipids 2004, 1686, 100–107. [Google Scholar] [CrossRef]
  70. Cutignano, A.; d’Ippolito, G.; Romano, G.; Lamari, N.; Cimino, G.; Febbraio, F.; Nucci, R.; Fontana, A. chloroplastic glycolipids fuel aldehyde biosynthesis in the marine diatom Thalassiosira rotula. ChemBioChem 2006, 7, 450–456. [Google Scholar] [CrossRef] [PubMed]
  71. Desbois, A.P.; Lebl, T.; Yan, L.; Smith, V.J. Isolation and structural characterisation of two antibacterial free fatty acids from the marine diatom, Phaeodactylum tricornutum. Appl. Microbiol. Biotechnol. 2008, 81, 755–764. [Google Scholar] [CrossRef] [PubMed]
  72. Khozin-Goldberg, I.; Iskandarov, U.; Cohen, Z. LC-PUFA from photosynthetic microalgae: Occurrence, biosynthesis, and prospects in biotechnology. Appl. Microbiol. Biotechnol. 2011, 91, 905–915. [Google Scholar] [CrossRef] [PubMed]
  73. Wen, Z.-Y.; Chen, F. Heterotrophic production of eicosapentaenoic acid by microalgae. Biotechnol. Adv. 2003, 21, 273–294. [Google Scholar] [CrossRef]
  74. Fan, J.; Yan, C.; Xu, C. Phospholipid:diacylglycerol acyltransferase-mediated triacylglycerol biosynthesis is crucial for protection against fatty acid-induced cell death in growing tissues of Arabidopsis. Plant. J. 2013, 76, 930–942. [Google Scholar] [CrossRef]
  75. Fan, J.; Yan, C.; Zhang, X.; Xu, C. Dual role for phospholipid:diacylglycerol acyltransferase: Enhancing fatty acid synthesis and diverting fatty acids from membrane lipids to triacylglycerol in Arabidopsis leaves. Plant. Cell 2013, 25, 3506–3518. [Google Scholar] [CrossRef] [Green Version]
  76. Dolch, L.-J.; Maréchal, E. Inventory of fatty acid desaturases in the pennate diatom Phaeodactylum tricornutum. Mar. Drugs 2015, 13, 1317–1339. [Google Scholar] [CrossRef] [Green Version]
  77. Li, H.-Y.; Lu, Y.; Zheng, J.-W.; Liu, W.-D. Biochemical and genetic engineering of diatoms for polyunsaturated fatty acid biosynthesis. Mar. Drugs 2014, 12, 153–166. [Google Scholar] [CrossRef] [PubMed]
  78. Yu, E.T.; Zendejas, F.J.; Lane, P.D.; Gaucher, S.; Simmons, B.A.; Lane, T.W. Triacylglycerol accumulation and profiling in the model diatoms Thalassiosira pseudonana and Phaeodactylum tricornutum (Baccilariophyceae) during starvation. J. Appl. Phycol. 2009, 21, 669–681. [Google Scholar] [CrossRef]
  79. Danielewicz, M.A.; Anderson, L.A.; Franz, A.K. Triacylglycerol profiling of marine microalgae by mass spectrometry. J. Lipid Res. 2011, 52, 2101–2108. [Google Scholar] [CrossRef] [PubMed] [Green Version]
  80. Roughan, P.G.; Holland, R.; Slack, C.R. The role of chloroplasts and microsomal fractions in polar-lipid synthesis from [1-14C]acetate by cell-free preparations from spinach (Spinacia oleracea) leaves. Biochem. J. 1980, 188, 17–24. [Google Scholar] [CrossRef] [PubMed] [Green Version]
  81. Heinz, E.; Roughan, P.G. Similarities and differences in lipid metabolism of chloroplast isolated from 18:3 and 16:3 plants. Plant. Physiol. 1983, 72, 273–279. [Google Scholar] [CrossRef] [Green Version]
  82. Wang, Z.; Benning, C. Chloroplast lipid synthesis and lipid trafficking through ER–plastid membrane contact sites. Biochem. Soc. Trans. 2012, 40, 457–463. [Google Scholar] [CrossRef] [PubMed] [Green Version]
Figure 1. Fatty acids synthesis in diatoms. Desaturases are noted with “ω” and/or “Δ” and refer to the location of carbon holding the newly formed double bond and its position within the methyl or front end of the acyl chain (2 types, methyl-end (grey or blue arrows) or front-end desaturases (yellow arrows)). Des: desaturase, Elo: elongase, FAS: fatty acid synthase.
Biomolecules 10 00797 g001
Figure 2. Experimental design of the enrichment experiment. The 13CO2 is supplied to the culture using a pH-stat system. To prevent contamination when sampling the algae, pliers are used to close/open the tubes/ways needed to first put the balloon under pressure and then allow sampling and finally rinse the tubes after collection.
Biomolecules 10 00797 g002
Figure 3. Dynamics of cell concentrations of the two enriched balloons of Chaetoceros muelleri (mean ± SD; solid line ● n = 2) and of the control balloon (solid line ○) (a) and the corresponding bacteria concentrations (b) during the 24 h experiment.
Biomolecules 10 00797 g003
Figure 4. Dynamics of Particulate Organic Carbon concentration (a) and of Total Fatty Acids concentration (b) for the two enriched balloons Cm1 and Cm2 (Cm = Chaetoceros muelleri) (mean ± SD; n = 3). The blue line corresponds to increasing trend between t0 and t24 (POC: y = 0.27x + 14, R2 = 76% p-value < 0.001; TFA: y = 0.08x + 2.5, R2 = 93% p-value < 0.001). POC concentration relationships with algae concentration (c) (eq: y = 2.4x − 5.7 R2 = 79%, p-value < 0.001) and with total fatty acid concentration (d) (eq: y = 0.23x − 0.5, R2 = 80%, p-value < 0.001) (mean; n = 3). Points below 8 × 10⁶ cells·mL−1 are not included in the linear regression and are considered as outliers (corresponding to t0.5 and t1 in Figure 3).
Biomolecules 10 00797 g004
Figure 5. Atomic enrichment (AE) of the Dissolved Inorganic Carbon (a). Atomic enrichment (AE) of Particulate Organic Carbon (b) (Cm = Chaetoceros muelleri).
Biomolecules 10 00797 g005
Figure 6. Proportions (% of Total Fatty Acids) of main fatty acids in neutral lipids (NL) and polar lipids (PL) of C. muelleri. (Mean ± SD n = 16 for each fraction). Among the 44 identified fatty acids (FA), only those accounting for more than 1% of the TFA are represented here (between 0.1% and 1%, 15:0, 18:0, 22:0, 14:1n-5, 16:1n-5, 22:2n-6 were detected in both neutral and polar lipids, iso15:0, 24:0, 16:1n-9, 17:1n-7, 16:2n-6 and 16:4n-3 were detected in neutral lipids and 18:1n-11, 18:1n-5, 16:4n-1, 18:3n-4, 20:3n-6, 20:4n-3 and 22:5n-3 were detected in polar lipids). The proportions of the 10 presented FA were significantly different between neutral lipids and polar lipids.
Biomolecules 10 00797 g006
Figure 7. Principal component analyses (PCA) made with %mass for all the fatty acids in the polar fraction (PL) (a) and the neutral fraction (NL) (b). Only the FA selected by SIMPER analysis are shown here (explaining 80% of the variability). The colors represent the different sampling times from t0 to t24, and the symbols represent the balloons considered. Cm1 and Cm2 are the enriched balloons, CmT the control balloon (Cm = Chaetoceros muelleri, n = 48 for NL and n = 48 for PL).
Biomolecules 10 00797 g007
Figure 8. FA concentration dynamics in neutral lipid fraction (NL—left) and polar lipid fraction (PL—right) with time for the two most abundant C16 fatty acids (16:0 and 16:1n-7), and the two end-product fatty acids (16:3n-4 and 20:5n-3) for the three culture balloons. Cm1 and Cm2 are the enriched balloons, and CmT is the control balloon (Cm = Chaetoceros muelleri).
Biomolecules 10 00797 g008
Figure 9. Atomic enrichment of the 10 most abundant FA in polar lipids (PL) and neutral lipids (NL) and suspected as involved in PUFA synthesis in C. muelleri. The standard deviation represents the variability between enriched balloons (Cm1 and Cm2, Cm = Chaetoceros muelleri).
Biomolecules 10 00797 g009
Figure 10. Specific uptake rates calculated with AE (µFA) of the 10 studied fatty acids in polar lipids (PL) and neutral lipids (NL) of C. muelleri (n = 2 for each).
Biomolecules 10 00797 g010
Figure 11. Summary of FA synthesis relationships in polar and neutral lipids pools for C. muelleri according to ratio calculation results. The solid arrows correspond to ratios of fatty acid B and suspected precursor A that are equal to or below 1, and red crosses correspond to ratios above 1. The fatty acids in grey were absent or present in trace amounts in this experiment, and consequently, the ways marked by dashed arrows were not possible to verify.
Biomolecules 10 00797 g011
Figure 12. Hypothesized synthesis of phosphatidylcholine (PC) and triacylglycerol (TAG) in C. muelleri. CoA: co-enzyme A, CPT: cytidine-5′-diphosphate choline phosphotransferase, DAG: diacylglycerol, DGAT: acyl-CoA DAG acyltransferase, G3P: glycerol-3-phosphate, GPAT: acyl-CoA-glycerol-3-phosphate acyltransferase, LPA: lysophosphatidic acid, LPC: lysophosphatidylcholine, LPAAT: acyl-CoA-lysophosphatidic-acid- acyltransferase, LPCAT: acyl-CoA LPC acyltransferase, PA: phosphatidic acid, PAP: acyl-CoA-phosphatidic acid phosphatase, PC (P-Cho): phosphatidylcholine, PDAT: phospholipid:DAG acyltransferase, TAG: triacylglycerol. Δ9, Δ12, Δ6 desaturases.
Biomolecules 10 00797 g012
Figure 13. Hypothesized pathway for the production of prokaryotic glycolipids in C. muelleri. Two pathways can produce DAG: one is located in the chloroplast (prokayotic pathway), the other in the endoplasmic reticulum (ER) (eukaryotic pathway). The 20:5n-3-CoA used for glycolipids synthesis is produced in the ER and collected from it to form prokaryotic DAG. This DAG can be further used to create glycolipids (configuration sn-1: 20:5n-3 and sn-2: 16:3n-4). The eukaryotic pathway in the ER could also explain the similar concentration dynamics observed between 20:5n-3 and 18:4n-3. CoA: co-enzyme A. DAG: diacylglycerol, DGD: digalactodiacylglycerol synthase, DGDG: digalactodiacylglycerol, G3P: glycerol-3-phosphate, GPAT: acyl-CoA-glycerol-3-phosphate acyltransferase, LPA: lysophosphatidic acid, LPAAT: acyl-CoA-lysophosphatidic-acid-acyltransferase, MGD: monogalactodiacylglycerol synthase, MGDG: monogalactodiacylglycerol, PA: phosphatidic acid, PAP: acyl-CoA-phosphatidic acid phosphatase, PC: phosphatidylcholine.
Biomolecules 10 00797 g013
Table 1. List of international and in-house standards used for EA-IRMS and GB-IRMS analysis. IAEA: International Atomic Energy Agency.
DescriptionNatureAnalysisδ13C (‰)SD
IAEA-CH6Sucrose (C12H22O11)13C-POC−10.450.03
IAEA-600Caffeine (C8H10N4O2)13C-POC−27.770.04
AcetanilideAcetanilide (C8H9NO)13C-POC29.530.01
CA21 (in-house std)Calcium carbonate (CaCO3)13C-DIC+1.47
Na2CO3 (in-house std)Sodium carbonate13C-DIC−6.88
NaHCO3 (in-house std)Sodium bicarbonate13C-DIC−5.93
Table 2. Groups of fatty acids formed according to their main pathways.
GroupFatty Acids Concerned
C16 PUFAs pathway 16:2n-7/16:2n-4/16:3n-4/16:4n-1
n-3 pathway18:3n-3/18:4n-3/20:4n-3/20:5n-3/22:5n-3/22:6n-3
n-6 pathway18:2n-6/18:3n-6/20:2n-6/20:3n-6/20:4n-6/22:2n-6/22:5n-6
FAS and post FAS 16:0/18:0/16:1n-7/18:1n-9
Bacterial FA15:0/17:0/iso15:0/iso17:0/17:1n-7
Table 3. Cellular parameters of C. muelleri using flow cytometry analysis (Mean ± SD, n = 3) according to sampling time. Control and enriched balloons were combined for this table as no differences were observed between balloons. Values for FDA and SYTOX are in %, values for BODIPY/FL3/SSC/FSC in arbitrary unit (a.u).
FL1-FDA
ACTIVE (%)
FL1-SYTOX
ALIVE (%)
FL1-BODIPY (a.u)FL3
(a.u)
SSC
(a.u)
FSC
(a.u)
093±499±1160±20263±248±1149±0
0.590±499±1215±23274±2050±2152±1
193±399±0233±31276±1856±10151±2
293±2100±0209±11275±1957±10153±1
393±2100±0245±25263±353±2152±1
492±198±2248±26260±253±1152±2
692±298±2194±17260±250±2152±1
890±198±3248±17260±253±2153±3
1090±198±2157±2262±352±3153±1
1289±499±1163±26262±451±2154±0
1489±297±4276±24261±453±0156±1
1686±397±3284±9261±452±2155±1
1887±298±3163±11259±652±3156±3
2088±499±2308±9258±656±1155±1
2287±496±5269±16258±555±2154±1
2488±399±2239±5257±654±1154±2
Table 4. Mean ratio of atomic enrichment (AE) for pairs of FA (FAA vs. FAB) in neutral lipids (NL) and polar lipids (PL) (Mean ± SD, n = 10 sampling dates) for the two enriched balloons (Cm1, Cm2; Cm = Chaetoceros muelleri). If the ratio is equal to or close to 1, A and B are assumed at equilibrium, and B is synthesized quickly from A; if the ratio is below 1, the transformation of B from A is possible but slow. Finally, if the ratio is above 1, A is not the main precursor of B, which has to be synthesized by a different pathway.
Neutral LipidsPolar Lipids
Cm1Cm2Cm1Cm2
Fatty acid B/Fatty acid AMeanSDMeanSDMeanSDMeanSD
18:1n-9/18:00.370.030.410.055.722.165.892.14
18:2n-6/18:1n-92.250.152.030.271.000.060.980.07
18:3n-6/18:2n-61.230.141.260.110.830.100.850.08
20:4n-6/18:3n-60.330.050.290.090.430.090.410.10
20:5n-3/18:4n-30.180.050.130.050.180.020.150.04
18:4n-3/18:3n-60.770.200.820.200.620.060.610.08
20:5n-3/20:4n-60.400.090.370.120.260.030.230.04
16:1n-7/16:00.630.030.630.010.580.030.570.03

