Article

L-Shell Photoionization of Magnesium-like Ions with New Results for Cl5+

by
Jean-Paul Mosnier
1,*,
Eugene T. Kennedy
1,
Jean-Marc Bizau
2,
Denis Cubaynes
2,3,
Ségolène Guilbaud
2,
Christophe Blancard
4,5,
M. Fatih Hasoğlu
6 and
Thomas W. Gorczyca
7
1
School of Physical Sciences and National Centre for Plasma Science and Technology (NCPST), Dublin City University, Dublin 9, Ireland
2
Institut des Sciences Moléculaires d’Orsay, UMR 8214, Rue André Rivière, Bâtiment 520, Université Paris-Saclay, 91405 Orsay, France
3
Synchrotron SOLEIL, L’Orme Des Merisiers, Saint-Aubin, BP 48, CEDEX, 91192 Gif-sur-Yvette, France
4
Commissariat à l’Énergie Atomique, DAM, DIF, 91297 Arpajon, France
5
Commissariat à l’Énergie Atomique, Laboratoire Matière en Conditions Extrêmes, Université Paris-Saclay, 91680 Bruyères le Châtel, France
6
Department of Computer Engineering, Hasan Kalyoncu University, Gaziantep 27010, Turkey
7
Department of Physics, Western Michigan University, Kalamazoo, MI 49008, USA
*
Author to whom correspondence should be addressed.
Atoms 2023, 11(4), 66; https://doi.org/10.3390/atoms11040066
Submission received: 5 January 2023 / Revised: 23 February 2023 / Accepted: 27 March 2023 / Published: 3 April 2023
(This article belongs to the Special Issue Photoionization of Atoms)

Abstract

:
This study reports on the absolute photoionization cross sections for the magnesium-like Cl5+ ion over the 190–370 eV photon energy range, corresponding to the L-shell (2s and 2p subshells) excitation regime. The experiments were performed using the Multi-Analysis Ion Apparatus (MAIA) on the PLéIADES beamline at the SOLEIL synchrotron radiation storage ring facility. Single and double ionization ion yields, produced by photoionization of the 2p subshell of the Cl5+ ion from the 2p63s2 1S0 ground state and the 2p63s3p 3P0,1,2 metastable levels, were observed, as well as 2s excitations. Theoretical calculations of the photoionization cross sections using the Multi-Configuration Dirac-Fock and R-matrix approaches were carried out, and the results were compared with the experimental data. The Cl5+ results were examined within the overall evolution of L-shell excitation for the early members of the Mg-like isoelectronic sequence (Mg, Al+, Si2+, S4+, Cl5+). Characteristic photon energies for P3+ were estimated by interpolation.

1. Introduction

Photon-driven excitation and ionization along the magnesium isoelectronic sequence have long been of interest in experimental and theoretical investigations e.g., [1,2,3,4,5,6,7,8,9,10,11,12,13,14,15,16,17,18]. This is not surprising, given the nature of magnesium-like systems with their simple closed-subshell ground state configuration 2p63s2. The 1S0 ground state tends to make it a relatively stable ion configuration in many plasma environments; therefore, from a theoretical point of view, photoionization calculations should focus mainly on the effects of excited state configurations. However, this ideal picture largely fails in practice, as electron correlations, e.g., two-electron excitations, turn out to be extremely important in this system, leading to a significant departure from the simple one-electron excitation picture. Many early investigations concentrating on the first ionization threshold energy region highlighted the complexity of such electron interactions, along with consequent demands on appropriate theories, see e.g., [17] and the references therein. As short wavelength photon interactions lead to inner-shell excitations, which couple with multiple excitations of the valence electrons, photoionization calculations become even more challenging due to the increased number of unfilled (sub)shells. Reliable photoionization laboratory investigations of magnesium-like ions in the inner-shell excitation photon energy regime are therefore of continuing interest as they provide robust benchmarking opportunities for different theoretical approaches.
Experimental and theoretical investigations of the photoionization of free atomic ions are becoming ever more important, stimulated by the abundant data obtained from X-ray satellite observatories such as Chandra and XMM-Newton. Future space missions such as XRISM and Athena promise even greater sensitivity and higher spectral resolution. Optimizing the value of astrophysical spectral observations, and the concomitant provision of greater physical insights, requires improved theoretical modelling and simulation of astrophysical plasma environments. The latter rely on fundamental atomic data, such as those provided by ongoing systematic and complementary experimental and theoretical investigations of the interaction of ionizing photons with free atomic ions. This is evidenced by the recent growth in laboratory astrophysics initiatives and associated data banks [19,20,21,22,23,24].
In the absence of experimental results, much of the atomic photoionization data exploited in modelling ionized environments has to rely on atomic physics calculations. Investigations of isoelectronic magnesium-like ions (twelve bound electrons) provide one important avenue for the calibration of different theoretical approaches. Along the isoelectronic sequence from neutral magnesium through Al+, Si2+, P3+, S4+ to Cl5+ ions, the increasing core charge leads to significant changes in the relative effects of the nuclear charge versus electron–electron interactions on the photoionization properties. The sequence provides an ideal case study to examine the ability of theoretical models to predict and interpret these changes, which involve level crossing and plunging configurations [17].
Plasma-based light source experiments were successful in recording resonances and ionization thresholds for early members of the magnesium sequence for both ground and excited states, see, for example [1,5,6,7,25].
The biggest step, however, in the systematic investigation of the inner-shell photoionization of positive ions in general has resulted from dedicated merged photon-ion beam facilities at synchrotron radiation storage rings, notably, Daresbury (UK), SuperACO and later SOLEIL (France), ASTRID (Denmark), ALS (USA), and PETRA III (Germany), see e.g., [26,27,28,29,30] and the references therein. The great advantage of such merged beam experiments is that they isolate specific ion stages and allow quantitative results to be obtained at high spectral resolution. This often results in absolute cross sections for different ionization channels, thereby providing the highest quality fundamental data for atomic and plasma modelling, as well as for benchmarking the most advanced atomic theories.
Absolute cross sections for L-shell ( 2 s and 2 p ) photoionization along the magnesium series have been previously obtained through synchrotron radiation-based merged-beam experiments for Al+ [9,31], Si2+ [10], S4+ [18], and Fe14+ [32], with the latter produced in an electron beam ion trap. These experiments have been complemented by various theoretical investigations. These investigations have interpreted the evolution of the observed resonances in the early part of the sequence, showing that considerable changes in the relative intensities and positions of resonances take place as the core charge increases along the sequence. The L-shell single and double photoionization cross sections of magnesium itself have been studied extensively using synchrotron radiation in high resolution experiments, but only on a relative scale, see [16] and the references therein.
The next member of the sequence is Cl5+. Chlorine is an extremely reactive element, appearing in many gaseous, liquid, and solid molecular forms of considerable scientific and industrial significance. Similarly to all halogens, it is strongly oxidizing as it is one electron short of the neighboring inert gas configuration. Chlorine ions play key roles in many terrestrial and astrophysical environments; therefore, understanding their interaction with radiation is important [33,34,35,36,37,38].
In this article, we report the first study of L-shell photoionization of magnesium-like Cl5+ for photon energies between 190 and 370 eV, straddling the 2s and 2p inner-shell excitation regimes. It is interesting to compare the success of the Multi-Configuration Dirac Fock (MCDF) and the R-matrix theoretical treatments of Cl5+ with the success of the previous analogous treatments of S4+ [18]. Our results provide experimental absolute photoionization cross sections for Cl5+, a comparison with the theoretical predictions of both the MCDF and the R-matrix approaches, as well as insights into the evolution along the isoelectronic sequence from Al+ to Cl5+. To the best of our knowledge, no such photoionization data for P3+ is available in the open literature. From the observed trends along the sequence, we estimated the values of some relevant characteristic energies for P3+.

2. Experimental Details

The experimental results for Cl5+ reported in this study were obtained using the dedicated merged photon-ion apparatus, MAIA (Multi-Analysis Ion Apparatus), on the ultra-high resolution soft X-ray (10 eV to 1 keV photons) PLÉIADES beamline at SOLEIL. Well-characterized synchrotron photon and ion beams overlap, and the resulting photoionization ions are selectively measured, providing cross section information for the different ionization channels. An advantage of working with ions over neutral species is that the number density in the overlap region can be determined. This allows the absolute cross sections to be measured. A comprehensive description of MAIA, and how absolute photoionization cross section results may be determined, is provided in [26]. Here we provide a shorter description to include the specific experimental parameters used for the Cl5+ investigations.
HCl gas was introduced into an Electron Cyclotron Resonance (ECR) ion source in order to generate chlorine ions. The Cl5+ ions were extracted and accelerated by an applied potential difference of −4 kV. They were then guided by a 900 bending magnet into the overlap region to meet the counter-propagating synchrotron radiation beam. An input power of 32 W at 12.36 GHz was used to optimize the production of Cl5+ ions. The magnetic filter enabled the selection of the most abundant 35Cl5+ isotope. The ion current, measured in a Faraday cup placed after the magnet exit, was of the order of 10 μA. This beam was then focused and shaped to match the size of the counter-propagating photon beam. The remaining current of ions interacting with the photons was typically of the order of 300 nA. The length of the interaction region was determined by a 57 cm long tube placed in the path of the two beams and polarized at a voltage of −2kV. Three transverse profilers, located at the center and at both ends of this pipe, respectively, allowed measurement of the overlap of the photon beam and the ion beam; a Form Factor [26] of 32,000 m−1 was reached. The primary ion beam current was measured after the interaction region using a Faraday cup. The photoionized ions, either singly ionized Cl6+ or doubly ionized Cl7+, were separated from the primary Cl5+ beam by a second dipole magnet, selected in speed by an electrostatic analyzer, and measured with a microchannel-plate detector coupled to a counter. A photon chopper was used to subtract the contribution of ions produced by collisions in the residual gas (background pressure of 1.5 × 10⁻⁹ mbar) to the Cl6+ or Cl7+ signal. The photon beam flux was monitored by a calibrated photodiode, and a typical current of ~100 μA at 195 eV photon energy and 150 meV bandwidth was measured. Knowing the photodiode current, the Cl5+ ion current, the form factor characterizing the overlap of the two beams, the length of the interaction region, the ion speed, and the efficiencies of the photodiode and channel-plate detectors, and recording the Cl6+ and the Cl7+ signals as functions of the photon energy, allowed the determination of the single and double absolute photoionization cross sections of the Cl5+ ions. During the Cl5+ experiments, SOLEIL was operated with a current of 450 mA. Circular left polarization, which delivers the highest flux in the photon range of interest, was used. The photon energy, corrected for the Doppler shift due to ion velocity, was calibrated using a gas cell containing argon, where the 2p3/2-> 4s transition in argon at 244.39 eV [39] was measured. The energy uncertainties were of the order of 20 meV, but varied depending on the resonance (see tables). The total uncertainty of the measured cross sections was estimated to be not greater than 15%, and was mostly due to the combined effects of the inaccuracy of the determination of the beam overlaps (the form factor), the efficiency of the detector, and the photon flux.
The heating microwaves interacted directly with the electrons at the ion source through the ECR mechanism, and a complicated range of processes involving energetic electrons was responsible for producing the ions. The detailed electron energy distribution was not known and the ECR ion source plasma was not in equilibrium [40]. A well-recognized result is that in the merged beam technique, the ions in the interaction region can often exist in excited states as well as the ground state [26,27,28,29,30]. The population of excited levels depends on their lifetimes and whether they survive the journey from the source into the interaction region. In general, this can be the case for metastable levels, some of which can have relatively long lifetimes. We will see below how the issue of excited states for the specific case of magnesium-like ions can be satisfactorily resolved.

3. Theoretical Details

For the recent analogous investigations of photoionization of S4+, we used two quite disparate theoretical approaches––MCDF and R-matrix theory [18]. We used the same methods to predict and interpret the new Cl5+ results presented here. While long-established and used to calculate many photoionization cross sections for a wide variety of ion species, both methods are being continuously reviewed and improved. In the MCDF approach, the twelve-electron magnesium-like ion is tackled directly. The quality of the results critically depends on including the most relevant electron configurations, although this is subject to calculational limitations. The R-matrix approach treats the magnesium-like challenge as a problem of an incident electron scattering off the eleven-electron sodium-like ion. Therefore, the quality of the final overall results depends on the accuracy of the intermediate target description. In many cases, some of the thresholds of the target system are already known, and this information can be used to help in the R-matrix approach. This was indeed the case for S4+ [18], but not for Cl5+. It is therefore interesting to see how the R-matrix code works for the latter when compared with the former. Both length and velocity gauge calculations were carried out using both approaches, and very satisfactory agreement was shown each time. Consequently, for the sake of brevity, only the length gauge results are presented in this paper.
Because of the similarity of the computations for the Cl5+ system with those previously carried out for the S4+ ion [18], we provide only brief descriptions of the R-matrix and MCDF calculations. In order to focus on the problem at hand, viz., the L-shell photoionization of Cl5+ and its behavior along the beginning of the magnesium sequence, we do not provide lengthy mathematical descriptions to support the fundamental aspects of the theoretical descriptions. Only the most important details are provided, i.e., those specific to the case of Cl5+. For additional information on the more fundamental and mathematical aspects of the MCDF and R-matrix theories, see the following recent references that will provide didactic descriptors as well as extensive lists of anterior references, namely, [41,42,43] for MCDF and [44,45,46,47] for R-Matrix.

3.1. R-Matrix Calculations

The calculational convenience of transitioning from Mg-like S4+ to Cl5+ is that the electronic orbital and configurational descriptions are the same once proper Z-scaling is accounted for. Previous R-matrix calculations for S4+ have been described in detail [18,48,49]; the changes for the new calculations of Cl5+ simply require adding one more proton to the nucleus, while keeping the same number of electrons. Indeed, from simple Z-scaling of the radial coordinate ρ = Z r , the radial orbital P ρ Z 1 / 2 P r , and the cross section σ Z σ 1 / Z 2 , the plots of the corresponding radial orbitals P r (shown in Figure 1) and the resultant photoabsorption cross sections are both remarkably similar. The Z-scaling also naturally leads to a reduction in the electron correlation effect, manifested via the electron–electron repulsion 1 / r 1 r 2 that scales as 1 / Z and becomes less significant at higher Z . Therefore, Cl5+ is expected to show a more hydrogenic structure than S4+. This behavior is seen in Figure 1, where both sets of orbitals exhibit very similar patterns, with a slightly greater localization of the orbitals near the nuclear core for Cl5+.
For the present Cl5+ work, the main series considered within the R-matrix formulation are the 2s22p63l channels of Cl6+ and the 2s22p53s3l and 2s22p53s2 inner-shell channels. Note that again, as for S4+, the 2s2p63s3p channels are omitted to keep the computation tractable. This means that certain weak resonances, which are seen in the MCDF results, will be absent. Nevertheless, the main 2p → nd Rydberg resonance series are well featured in the computed end results, and the weaker interspersed 2p → (n + 1)s series and 2s → np series at higher photon energy are also included.
It can never be overstated that the primary source of uncertainty in any R-matrix calculation is due to a lack of convergence in the initial and/or final state energies, given that the calculation is based on a variational principle. This leads, in turn, to a corresponding non-convergence of the photon transition energies. In order to simplify the comparison, we present ab initio results for Cl5+ rather than using certain empirical energy information [50], knowing in advance that certain energy shifts must be aligned with the experimental results. Additionally, the R-matrix results are preconvolved with a resonance width of Γ s p e c t a t o r = 2.5 × 10 3 Ryd for the spectator Auger decay process. This is to ensure the full resolution of the various infinite Rydberg series of otherwise narrowing resonances ( Γ p a r t i c i p a t o r 1 / n 3 ). Γ p a r t i c i p a t o r refers to the resonance width of the participator Auger decay in which the initially photon-excited electron engages in the Auger process. While in contrast, this does not occur in spectator Auger decay.
As a final note, the R-matrix method does include the Fano interference [51] between direct photoionization and indirect photoexcitation–autoionization. Therefore, asymmetric profiles can be revealed in general. This is in contrast to perturbative methods, such as the MCDF method, where the resonance is treated as a single final state, giving a Breit–Wigner (symmetric Lorentzian) resonance profile added incoherently to the (uncoupled) smooth background photoionization cross section. Hence, the asymmetrical profile of the experimental results of the 2s → np Rydberg series, in particular, can only be reproduced by the R-matrix calculations here.

3.2. MCDF Calculations

An updated version of the MCDF code developed by Bruneau [42] has been used to compute the relevant photoexcitation and photoionization cross sections. Calculations were performed using a full intermediate coupling scheme in a jj basis set. The calculations were restricted to electric dipole transitions using both the Coulomb and the Babushkin gauges, which correspond to the velocity and the length form of the electric dipole operator in the non-relativistic limit, respectively [42]. Preliminary calculations were performed to compute a set of one-electron wave functions resulting from the energy minimization of the Slater transition state [52] using the following configuration set: [Ne]3snl, [Ne]3s, and [F]3s2, and [He]2s2p63s2, where n = 3,…7 and l = s, p, d, and where [He], [F], and [Ne] mean 1s2, 1s22s22p5, and 1s22s22p6, respectively. This one-electron wave function set (OWFS) was used to calculate the 2s and 2p photoexcitation cross sections from the 1S0 level of the [Ne]3s2 ground configuration and from the 3P0,1,2 metastable levels of the [Ne]3s3p configuration. With regard to the photoexcitation cross sections from the ground level, the following photo-excited configurations were retained: [F]3s23d, [F]3s3p2, [F]3s2n’l’, and [He]2s2p63s2nd, where n’ = 4,…, 7 and l’ = s, d. For the photoexcitation cross sections from the [Ne]3s3p 3P0, 1, 2 metastable levels, the photo-excited configurations retained were: [F]3s23p, [F]3s3p3d, [F]3s3pn’l’, [He]2s2p63s3p2, and [He]2s2p63s3pn’p. The initial OWFS was also used to compute the autoionization rates for [F]3s23d and [F]3s23p/3s3p3d levels photoexcited from the [Ne]3s2 1S0 ground level and the [Ne]3s3p 3P0, 1, 2 metastable levels, respectively. The largest calculated autoionization rates were found for the [F]3s23d 1P1 and 3P1 excited levels, with corresponding Auger widths equal to 86 and 92 meV, respectively. The Auger widths for the [F]3s23p excited levels were all lower than 3.6 meV. The direct 2p and 3s photoionization cross sections were also calculated using the initial OWFS for the [Ne]3s2 1S0 and [Ne]3s3p 3P0,1,2 initial levels. The 3p photoionization cross sections were also computed for the [Ne]3s3p 3P0,1,2 levels.

4. Results

4.1. L-Shell Photoionization of Cl5+

This section presents the results for the single and double ionization of Cl5+ ions over the photon energy range corresponding to the L-shell excitations (both 2s and 2p). Figure 2 shows a schematic energy level diagram indicating some of the main ionization pathways due to photon absorption in the L-shell excitation regime. In particular, it shows excitation from the ground 2p63s2 1S, and the metastable 2p63s3p 3P levels which lie just over 12 eV above the ground state (the vertical upward lines indicate photoabsorption). The final inner-shell excited states shown lying above ~211 eV then give rise to Auger decay resonances in the photoionization cross section. These can interact with the underlying direct photoionization process, and the downward dotted arrows illustrate the ensuing production of either Cl6+ or Cl7+ ions due such non-radiative decay process(es) of the original 2p vacancy.
Figure 3 shows the measured photoionization cross section over the photon energy region from 190 to 370 eV. The 285–320 eV photon region was not scanned as resonances were not expected in this interval. All cross sections between 190 and 285 eV were measured in the very dominant single ionization (SI) channel, while all the cross sections above 326 eV were measured in the double ionization (DI) channel (which becomes the dominant channel above the 2p−1 ionization limit). We also show the results of the ab initio MCDF and R-matrix calculations where the theoretically predicted resonances are folded with the experimentally determined bandpasses for the different spectral regions. Because of the weakness of the resonances near 200 eV and those above 320 eV, their cross sections (both experimental and theoretical) were multiplied by a factor of ten, which accounts for the apparent vertical displacements of the cross sections on the right-hand side of Figure 3.
We first discuss how we estimated the contribution of metastable levels to the overall photoionization cross section. We then analyse the experimental cross section in comparison with the MCDF and R-matrix predictions in separate contiguous energy regions corresponding to changing photon interaction processes and taking into account the contribution due to metastable levels.

4.1.1. Metastable Resonance Region

The important contribution of metastable levels to photoabsorption of plasmas containing magnesium-like ions has been recognized in some early dual laser produced plasma experiments [6]. These experiments showed that for Mg, Al+, and Si2+, the resonances arising from the 2p63s3p 3P levels appear in a separate photon energy region to the resonances arising from the ground state [5,7]. This feature allows the estimation of the metastable states population fractions by comparing the theoretically predicted cross sections from these states with the measured ones at those photon energies. Similar advantageous behavior was observed for S4+ [18], and was again the case for the current Cl5+ results.
In Figure 3, the photoionization resonances arising from the excitation from the 3P metastable levels (2p63s3p 3P → 2p53s23p 3S, 3P, 3D) can be seen in the 195–201 eV photon energy region, well separated from the ground state resonances lying above 220 eV photon energy. We can estimate the relative populations of the metastable levels by comparing the experimental data with the MCDF and R-matrix predicted cross sections. Figure 4 shows details of the measured cross section due to the metastable levels and the comparative cross sections from both the MCDF (blue line) and the R-matrix (red line) calculations. The detailed comparison of the relative strengths of the individual resonances is determined by the relative populations of the individual 3P0,1,2 J-levels. The summation of the cross section over all the resonances depends on the relative metastable to ground state ratio. The best fit of the theoretical with experimental data implies relative populations of 77% 1S0 + 4% 3P0 + 1% 3P1 + 18% 3P2. As for S4+, the very low contribution of the 2p63s3p 3P1 state is readily explained by its E1 radiative decay lifetime of ~2.6 μs [52], which contributes to significantly repopulating the ground state by the time the fast (3.23 × 10⁵ ms−1) Cl5+ sample ions reach the interaction zone. These relative population factors are used in all future figures where we compare the experimental data with the theoretical predictions.
It should be noted that in comparing the experimental data of Figure 4 with theory, the ab initio MCDF predictions were shifted by −0.54 eV, while the ab initio R-matrix results were shifted by −0.64 eV. The integrated cross sections over the metastable resonances, taking into account the relative populations, were: experimental data (2.9 ± 0.4 Mb.eV), MCDF (2.36 Mb.eV), and R-matrix (2.91 Mb.eV). In Table 1, we show experimental and theoretical (both R-matrix and MCDF) resonance energies, together with resonance line strengths (cross section integrated over a single resonance profile) and assignments for the structures in the 195 eV to 200 eV photon energy region arising from inner-shell excitations of the valence-excited metastable 3P levels. The assignments are based on best intensity and energy position matchings of the observed resonances and the MCDF predictions.

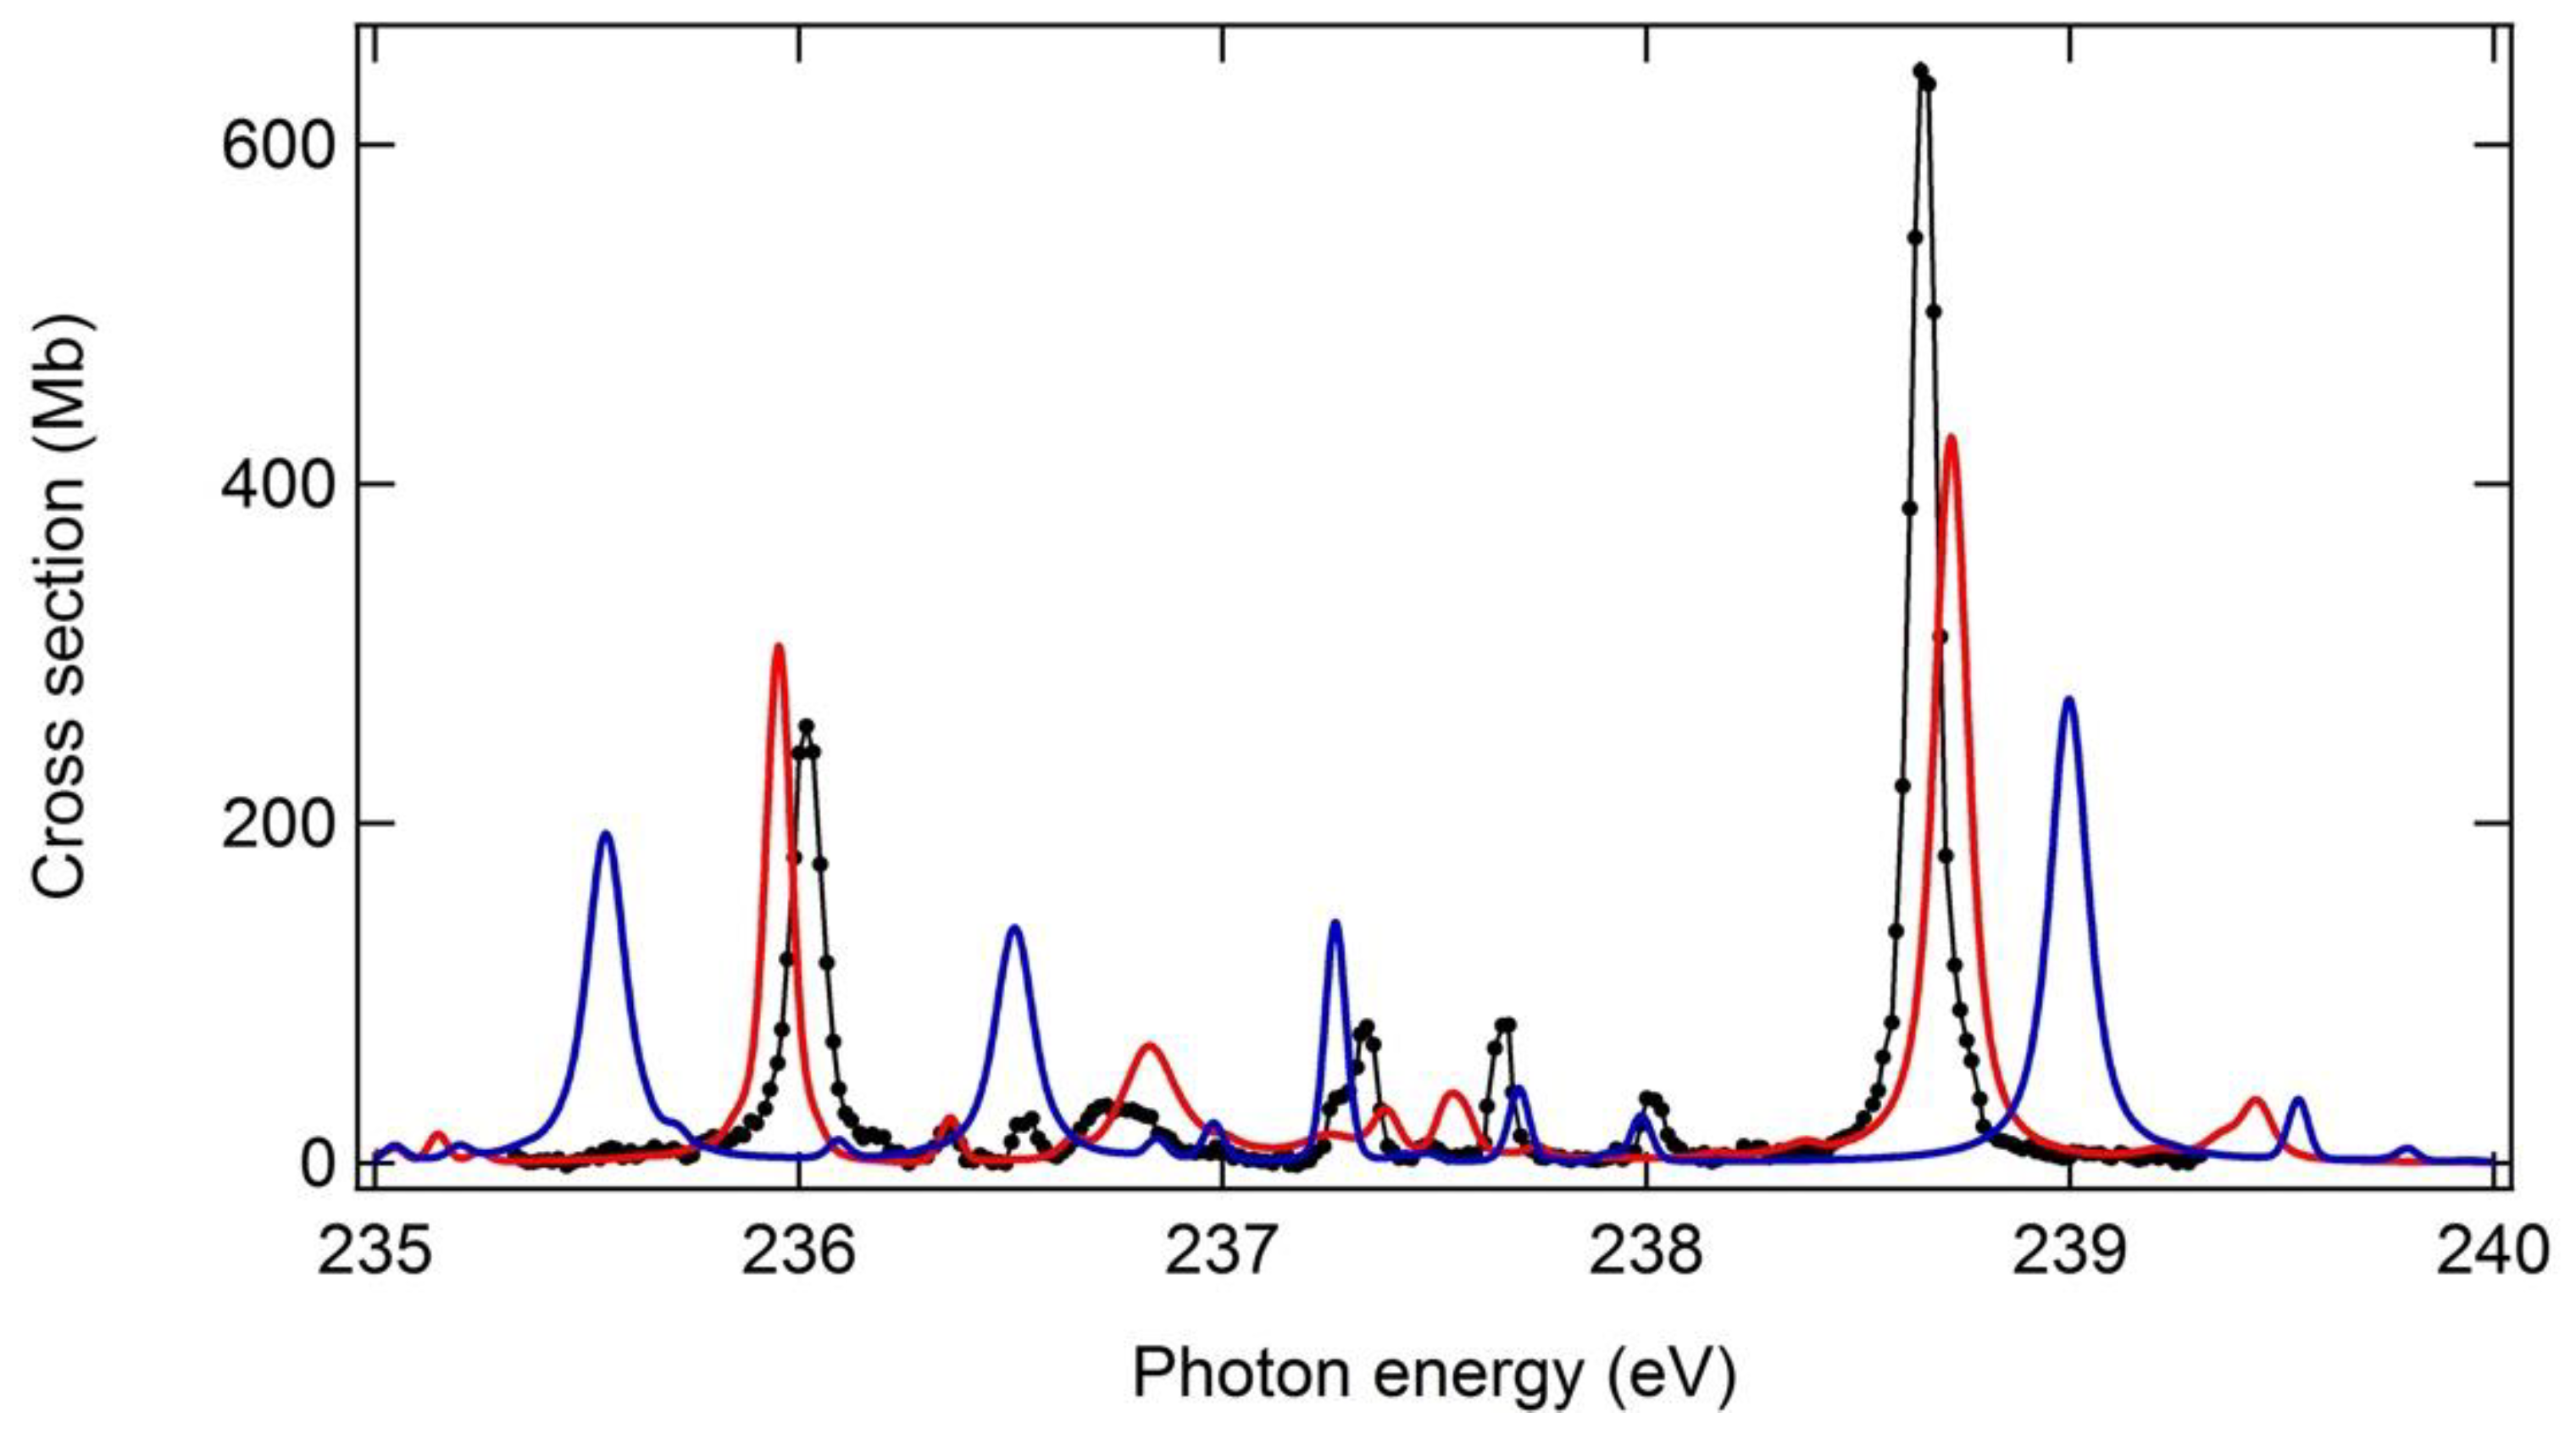
4.1.2. 2p → 3d Excitation Region

The dominant resonance structures observed between 235 and 240 eV in Figure 3 are due to the expected 2p–3d excitations, accompanied by considerably weaker 2p–ns resonances. These are shown in detail in Figure 5. The relative strengths of the individual resonances within this group vary considerably as one progresses from neutral magnesium toward Cl5+. The detailed spectroscopic assignments of the corresponding resonances for the early members of the sequence have given rise to considerable early discussions [1,2,5,16], with the labelling to some extent depending on the particular theoretical approach. This is not surprising because, as previously noted in Section 3., considerable challenge arise in the theoretical calculations due to the complexity associated with multiply excited outer electron configurations combining with the inner-shell excited 2p (or 2s) hole. Further complexity arises from the nominally closed shell ground state of 3s2 1S0 mixing with configurations such as 3p2 [5,9,10]. The theoretical calculations indicate that some of the weaker resonances in Figure 5 can be attributed to such electron correlation effects between energetically close-lying, multiply excited states.
As can be seen in Figure 5, the R-matrix results mimic the experimental data in this region somewhat better than the corresponding MCDF predictions, however, only by a small amount. Both theoretical approaches require systematic energy shifts in order to bring the strongest resonances into approximate agreement with the experimental data (MCDF and R-matrix shifts of −0.46 eV and −1.86 eV, respectively). When compared with the experimental data, the R-matrix relative strengths of the main resonances are somewhat underestimated, while the energy separation of the strongest resonances is slightly overestimated (typically by an amount of less than 0.5 eV) in the MCDF calculations. For the latter approach, the use of an even more extended set of ground state and photoexcited configurations would likely improve the value of this energy separation, via both improved OWFS and description of ground and excited state correlations. This relatively minor improvement would require significant additional computational efforts, which were not available to the authors. The cross sections integrated over the photon energies of the spectral region of Figure 5 are: experimental data (129 ± 19 Mb.eV), MCDF (111.2 Mb.eV), and R-matrix (118.9 Mb.eV), respectively.

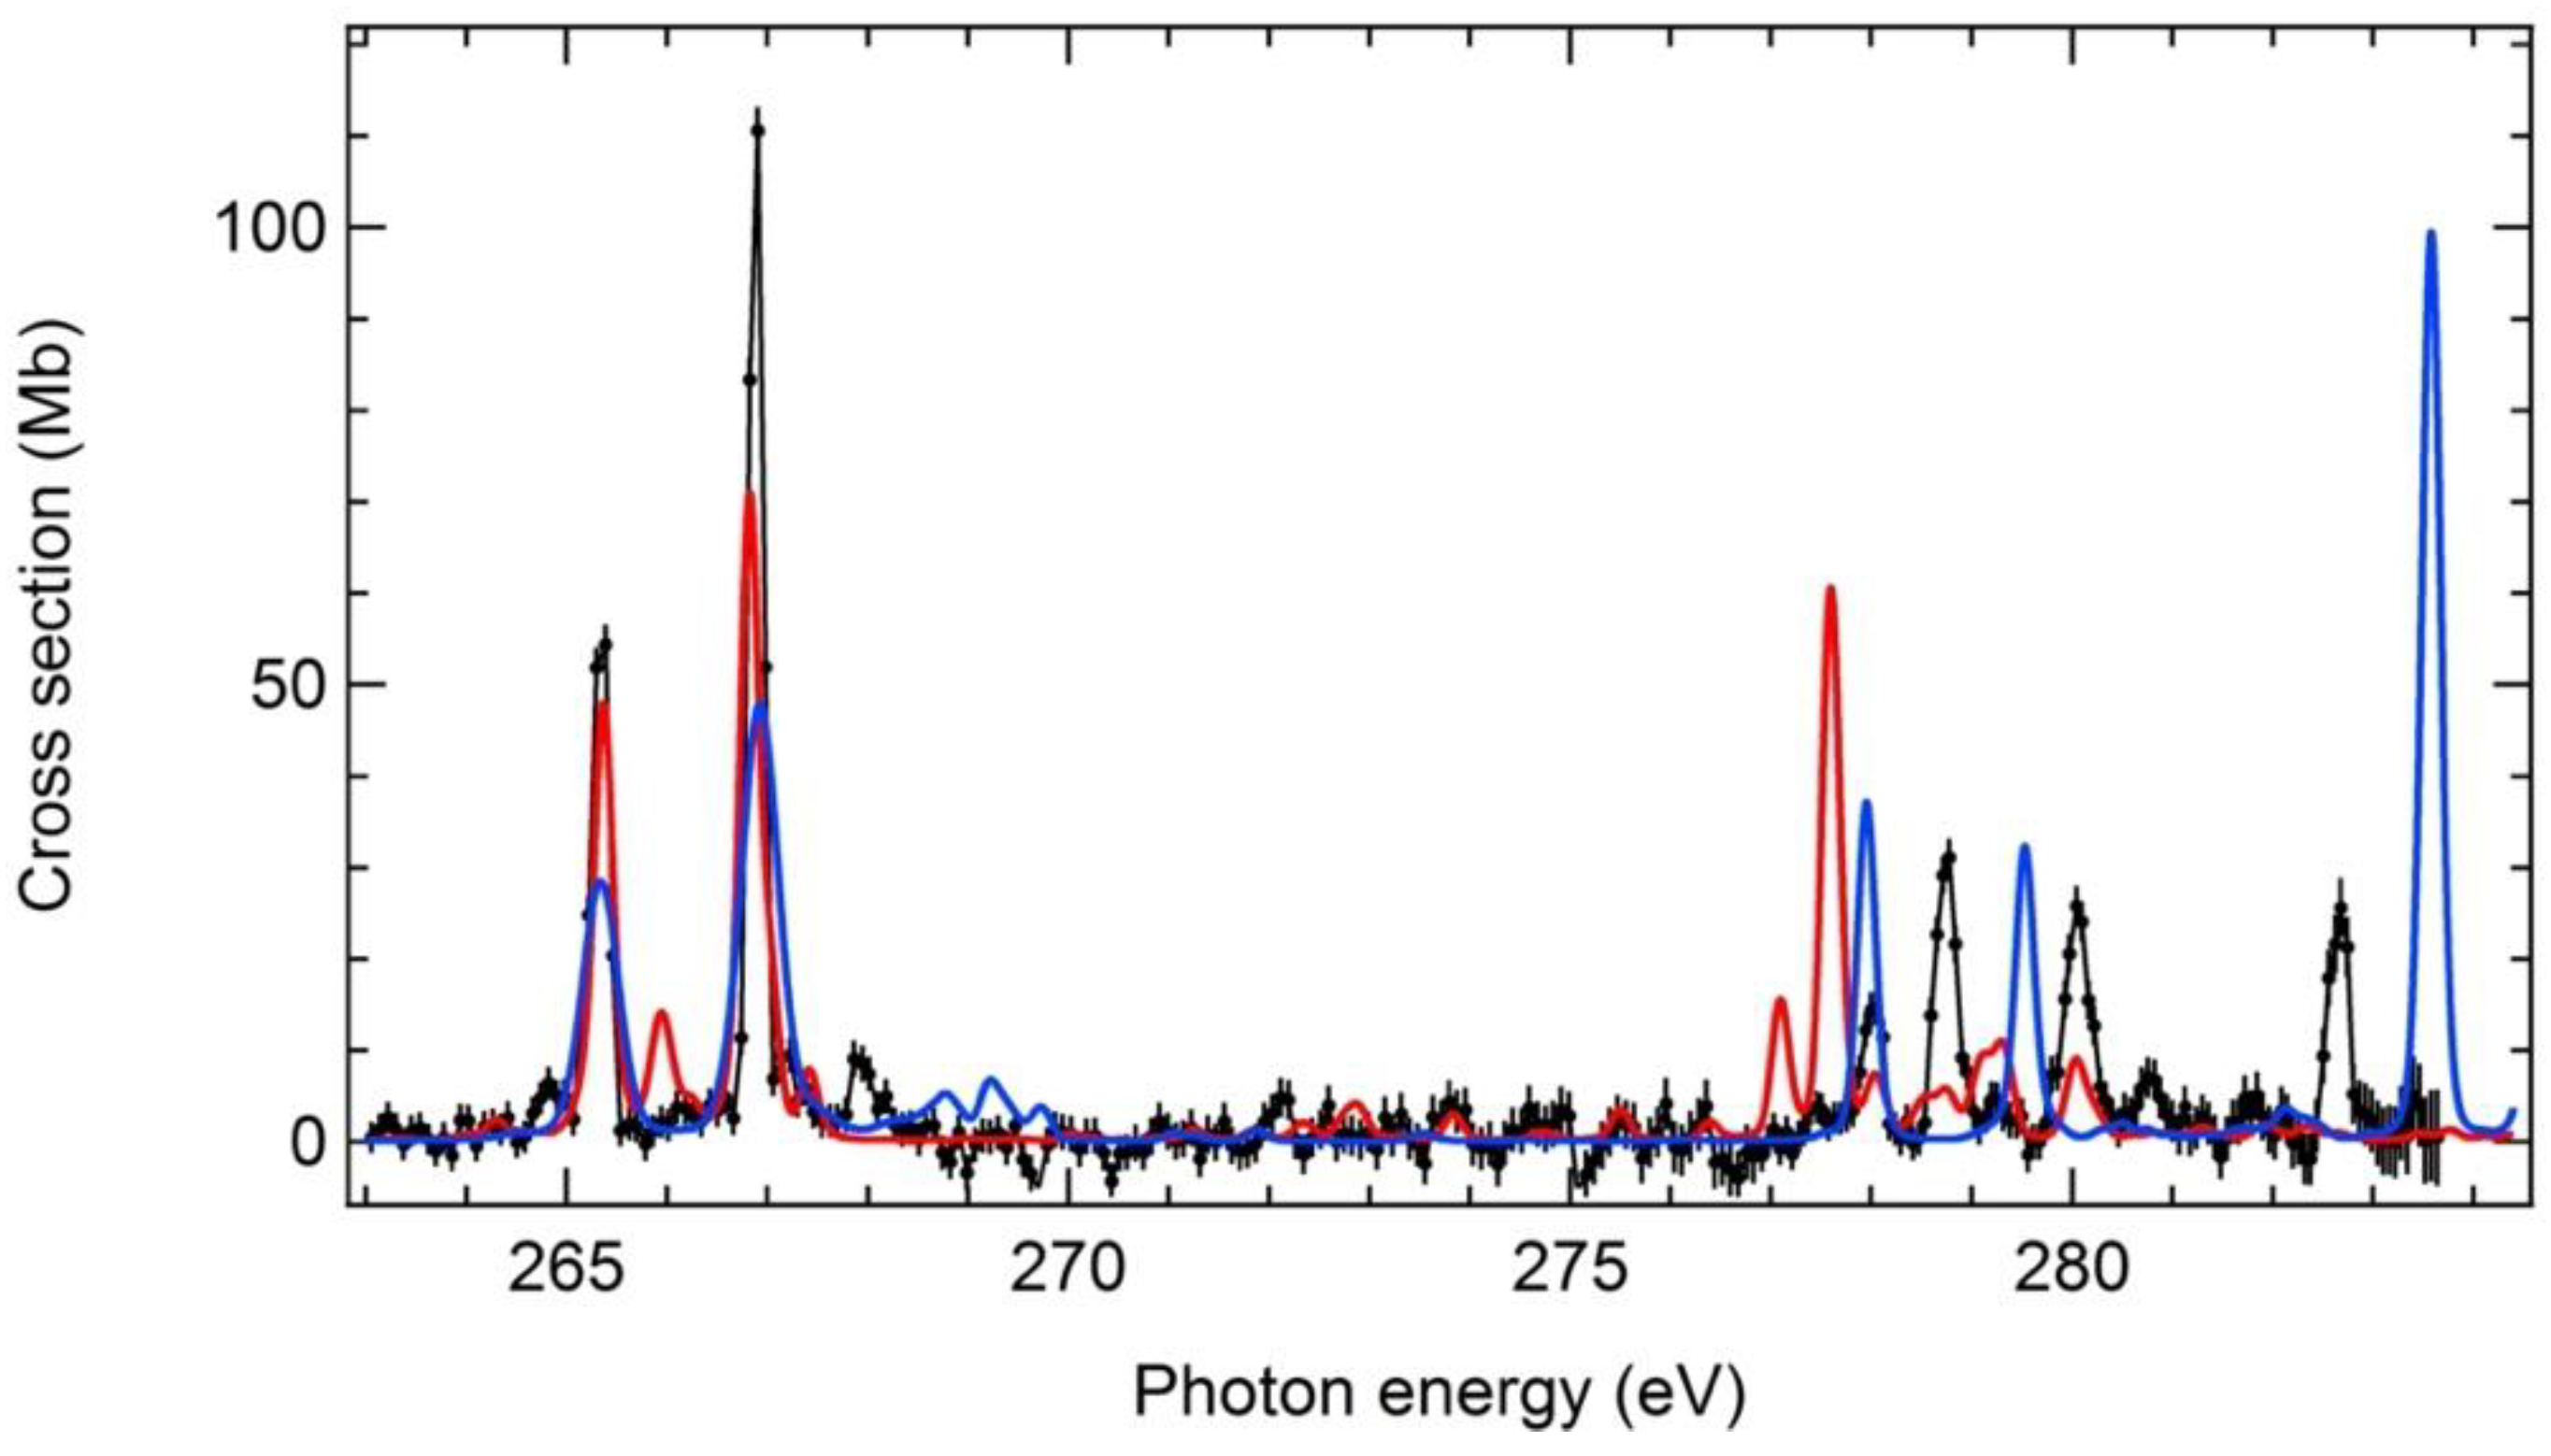
4.1.3. Region of 2p → nd Excitations

Figure 6 shows the corresponding comparisons for the experimental and ab initio theoretical predictions for the resonances in the 2p → nd (n > 3) photon energy region. The systematic energy shifts required to bring the theoretical predictions into approximate agreement with the experimental data were +0.97 eV for the MCDF and a larger shift of −4.36 eV for the R-matrix calculations. The integrated cross sections over the spectral region covered by Figure 6 were in good agreement, and were: experimental data (87 ± 13 Mb.eV), MCDF (71.8 Mb.eV), and R-matrix (85.4 Mb.eV), respectively. Both the R-matrix and MCDF results suggest that the strong resonance feature observed at 282.66 eV likely corresponds with the first member (n = 3) of the 2s → np 1P1 series. Numerical fitting of the Rydberg series for the 2p → nd series using the basic E n = I p 13.6   ×   6 2 n δ 2   hydrogenic quantum defect formula (in eV) led to values of 299.6 2   eV   and 0.22 1 for the (2s22p53s2) 2P ionization limit I p and quantum defect δ , respectively. In the experimental conditions, it was not possible to reliably access the energy values of the two fine-structure limits 2P1/2,3/2. The comments in Section 4.1.2 about the use of more extended OFWS and configuration sets are also applicable here.

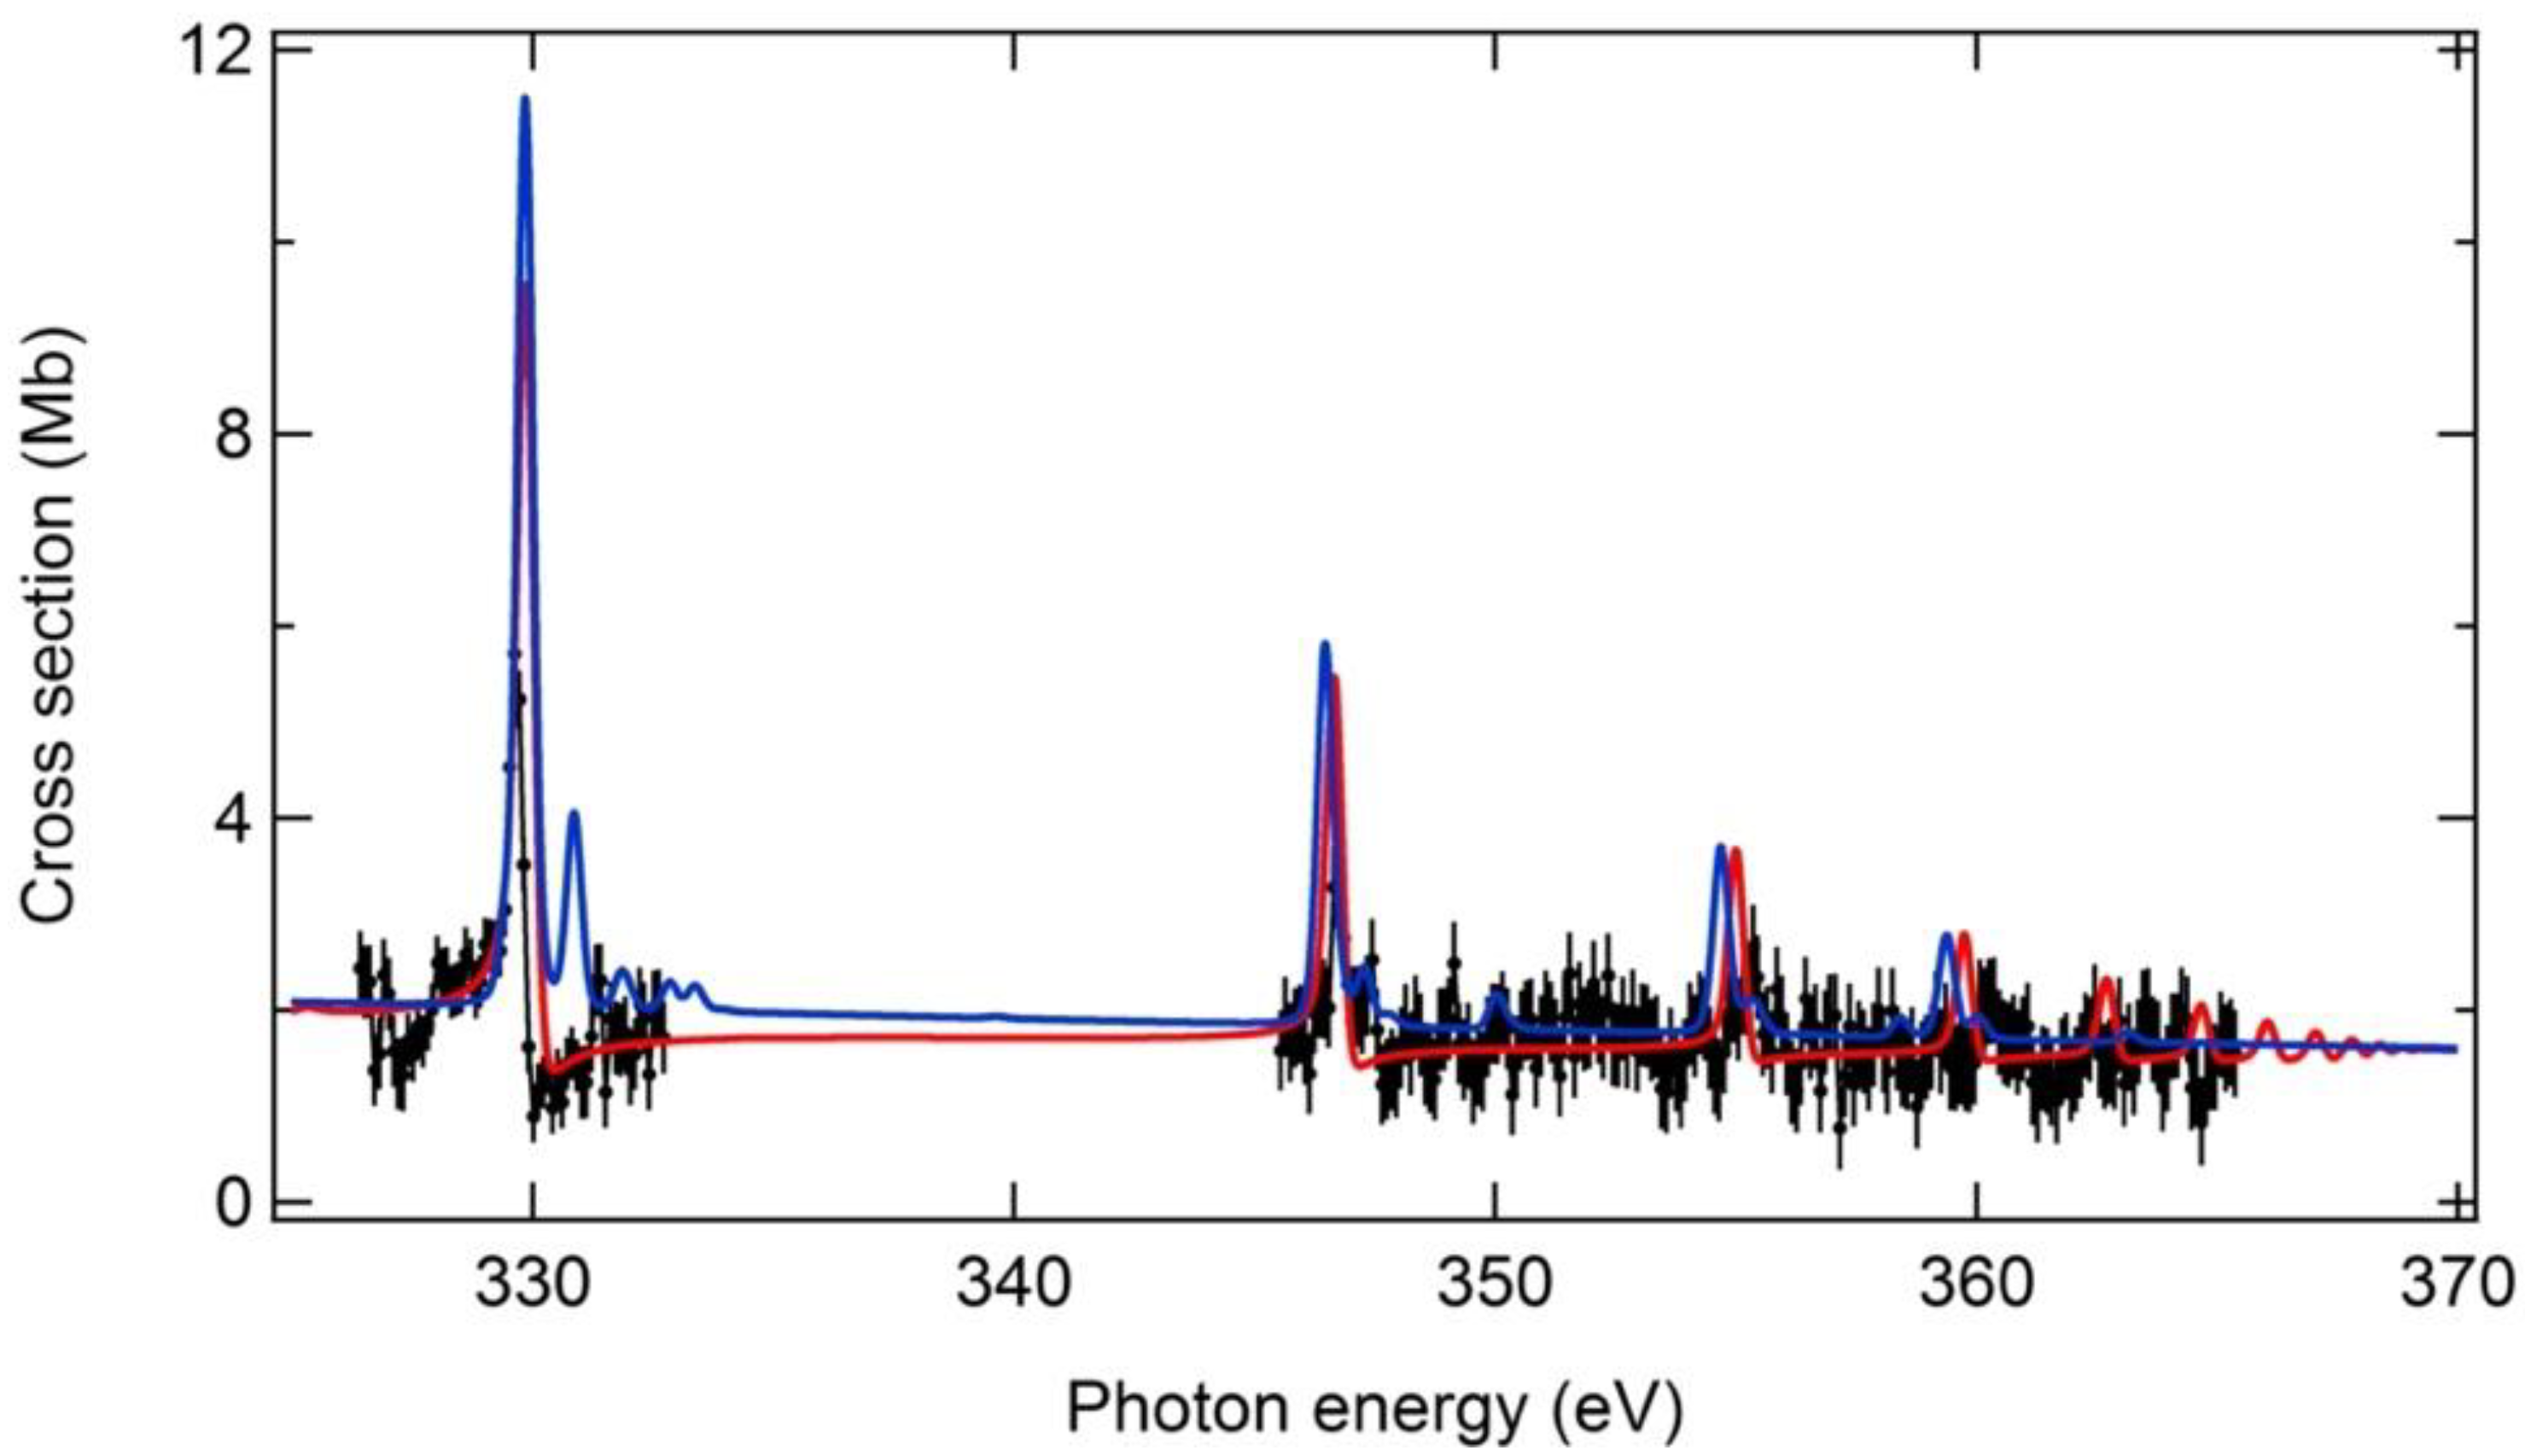
4.1.4. Region of 2s → np Excitations

Above the 2p53s2 2P limit, we observed a regular series of relatively weak resonances, analogous in shape to those previously observed [18] for S4+. As experimental absolute cross sections were not available here, the data were instead normalized to the theoretical cross sections, as shown in Figure 7. The strongest resonance lay at ~330 eV, identified as the 2s → 4p member of the series. The most striking feature of the resonances in this region was the strongly asymmetrical Fano profiles due to the strong autoionization interaction with the underlying continua. As noted in Section 3.1, the R-matrix calculation includes the Fano interference between the resonance and the underlying continua, and mimics rather well the observed asymmetric profiles. Hydrogenic extrapolation (see previous paragraph) of the experimental 2s → np series led to the best fit values of 373.2(6) eV and 0.70(1) for the 2 s   S 2 1 / 2 ionization threshold energy and quantum defect of the 2 s n p   P 1 1 levels, respectively.
In Table 2, we gather together the experimental measurements and the corresponding theoretical predictions for all resonances observed between 225 and 370 eV, most of which have been shown in detail in Figure 5, Figure 6 and Figure 7. Table 2 shows that the vast majority of the observed resonances are reasonably accounted for by both theories in terms of resonance energy, strength, and width. In addition, the supernumerary low-intensity peaks seen in Figure 5 are readily interpreted as transitions from the 2 p 6 3 s 3 p   P 3 0 , 2 metastable states to 3 S , 3 D states of the multiply excited 2 p 5 3 s 3 p 3 d configuration. This is consistent with our interpretation of the 195 eV–201 eV low-energy photon region (see Section 4.1.1).

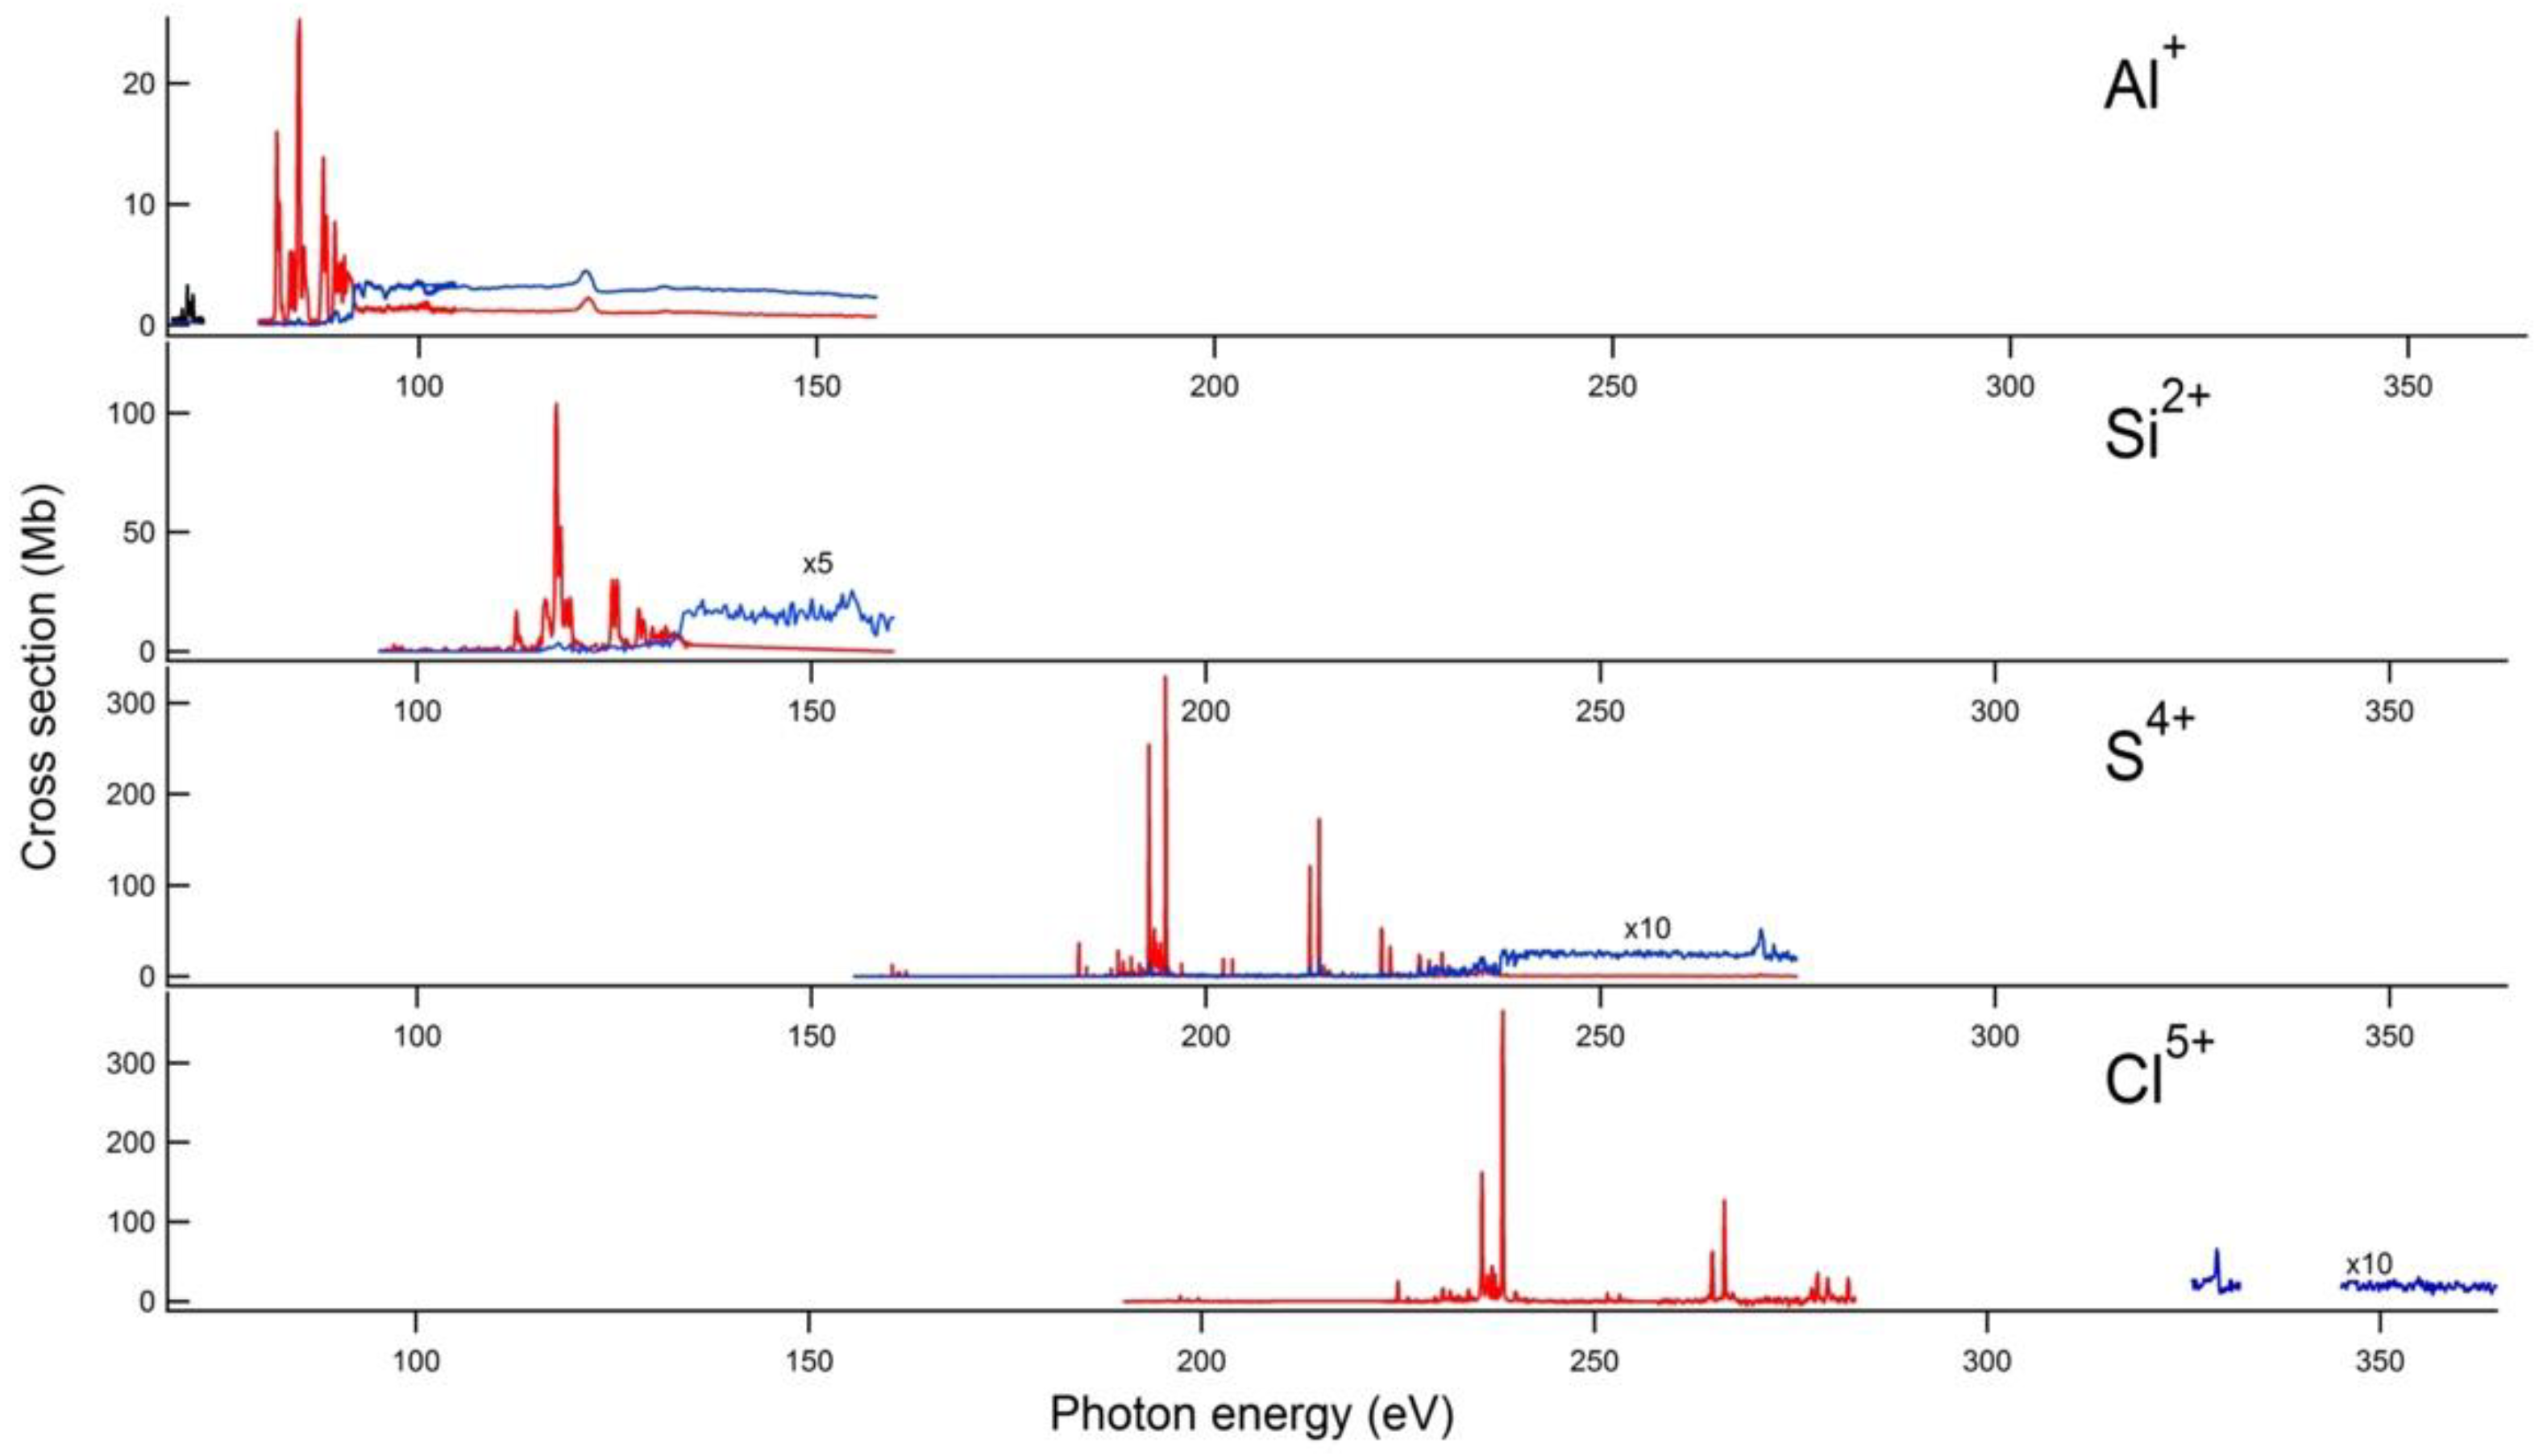
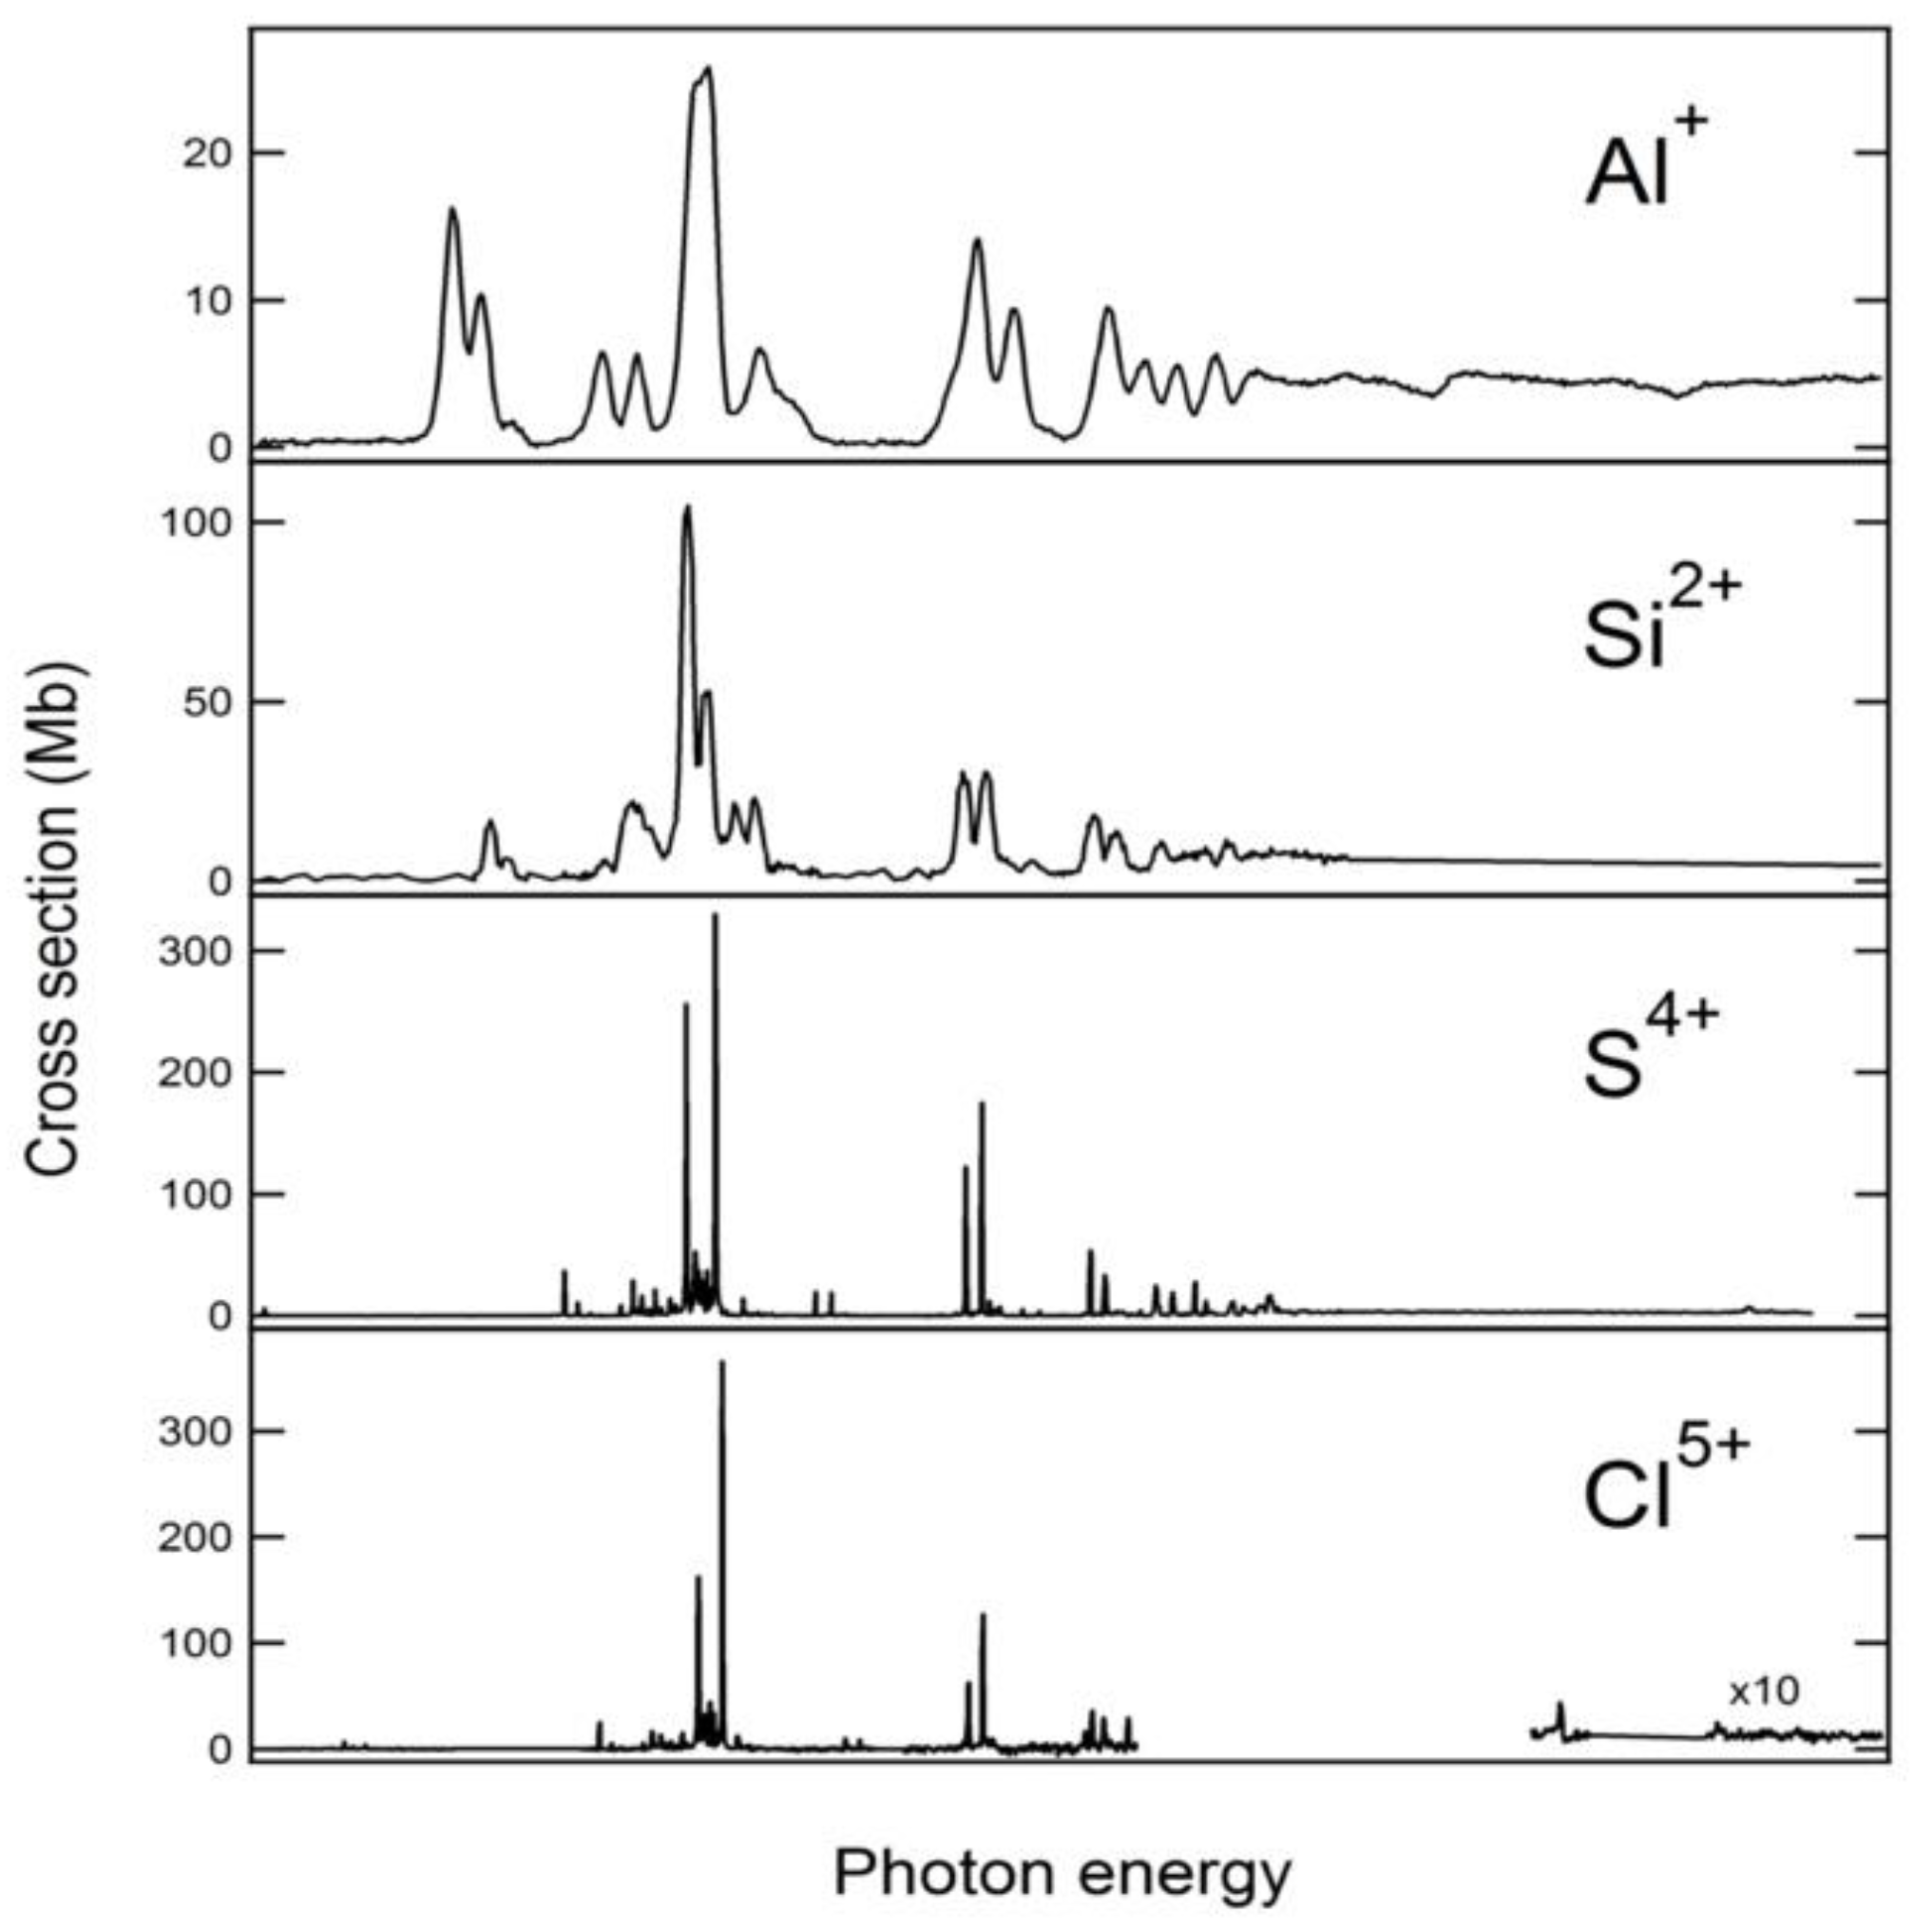
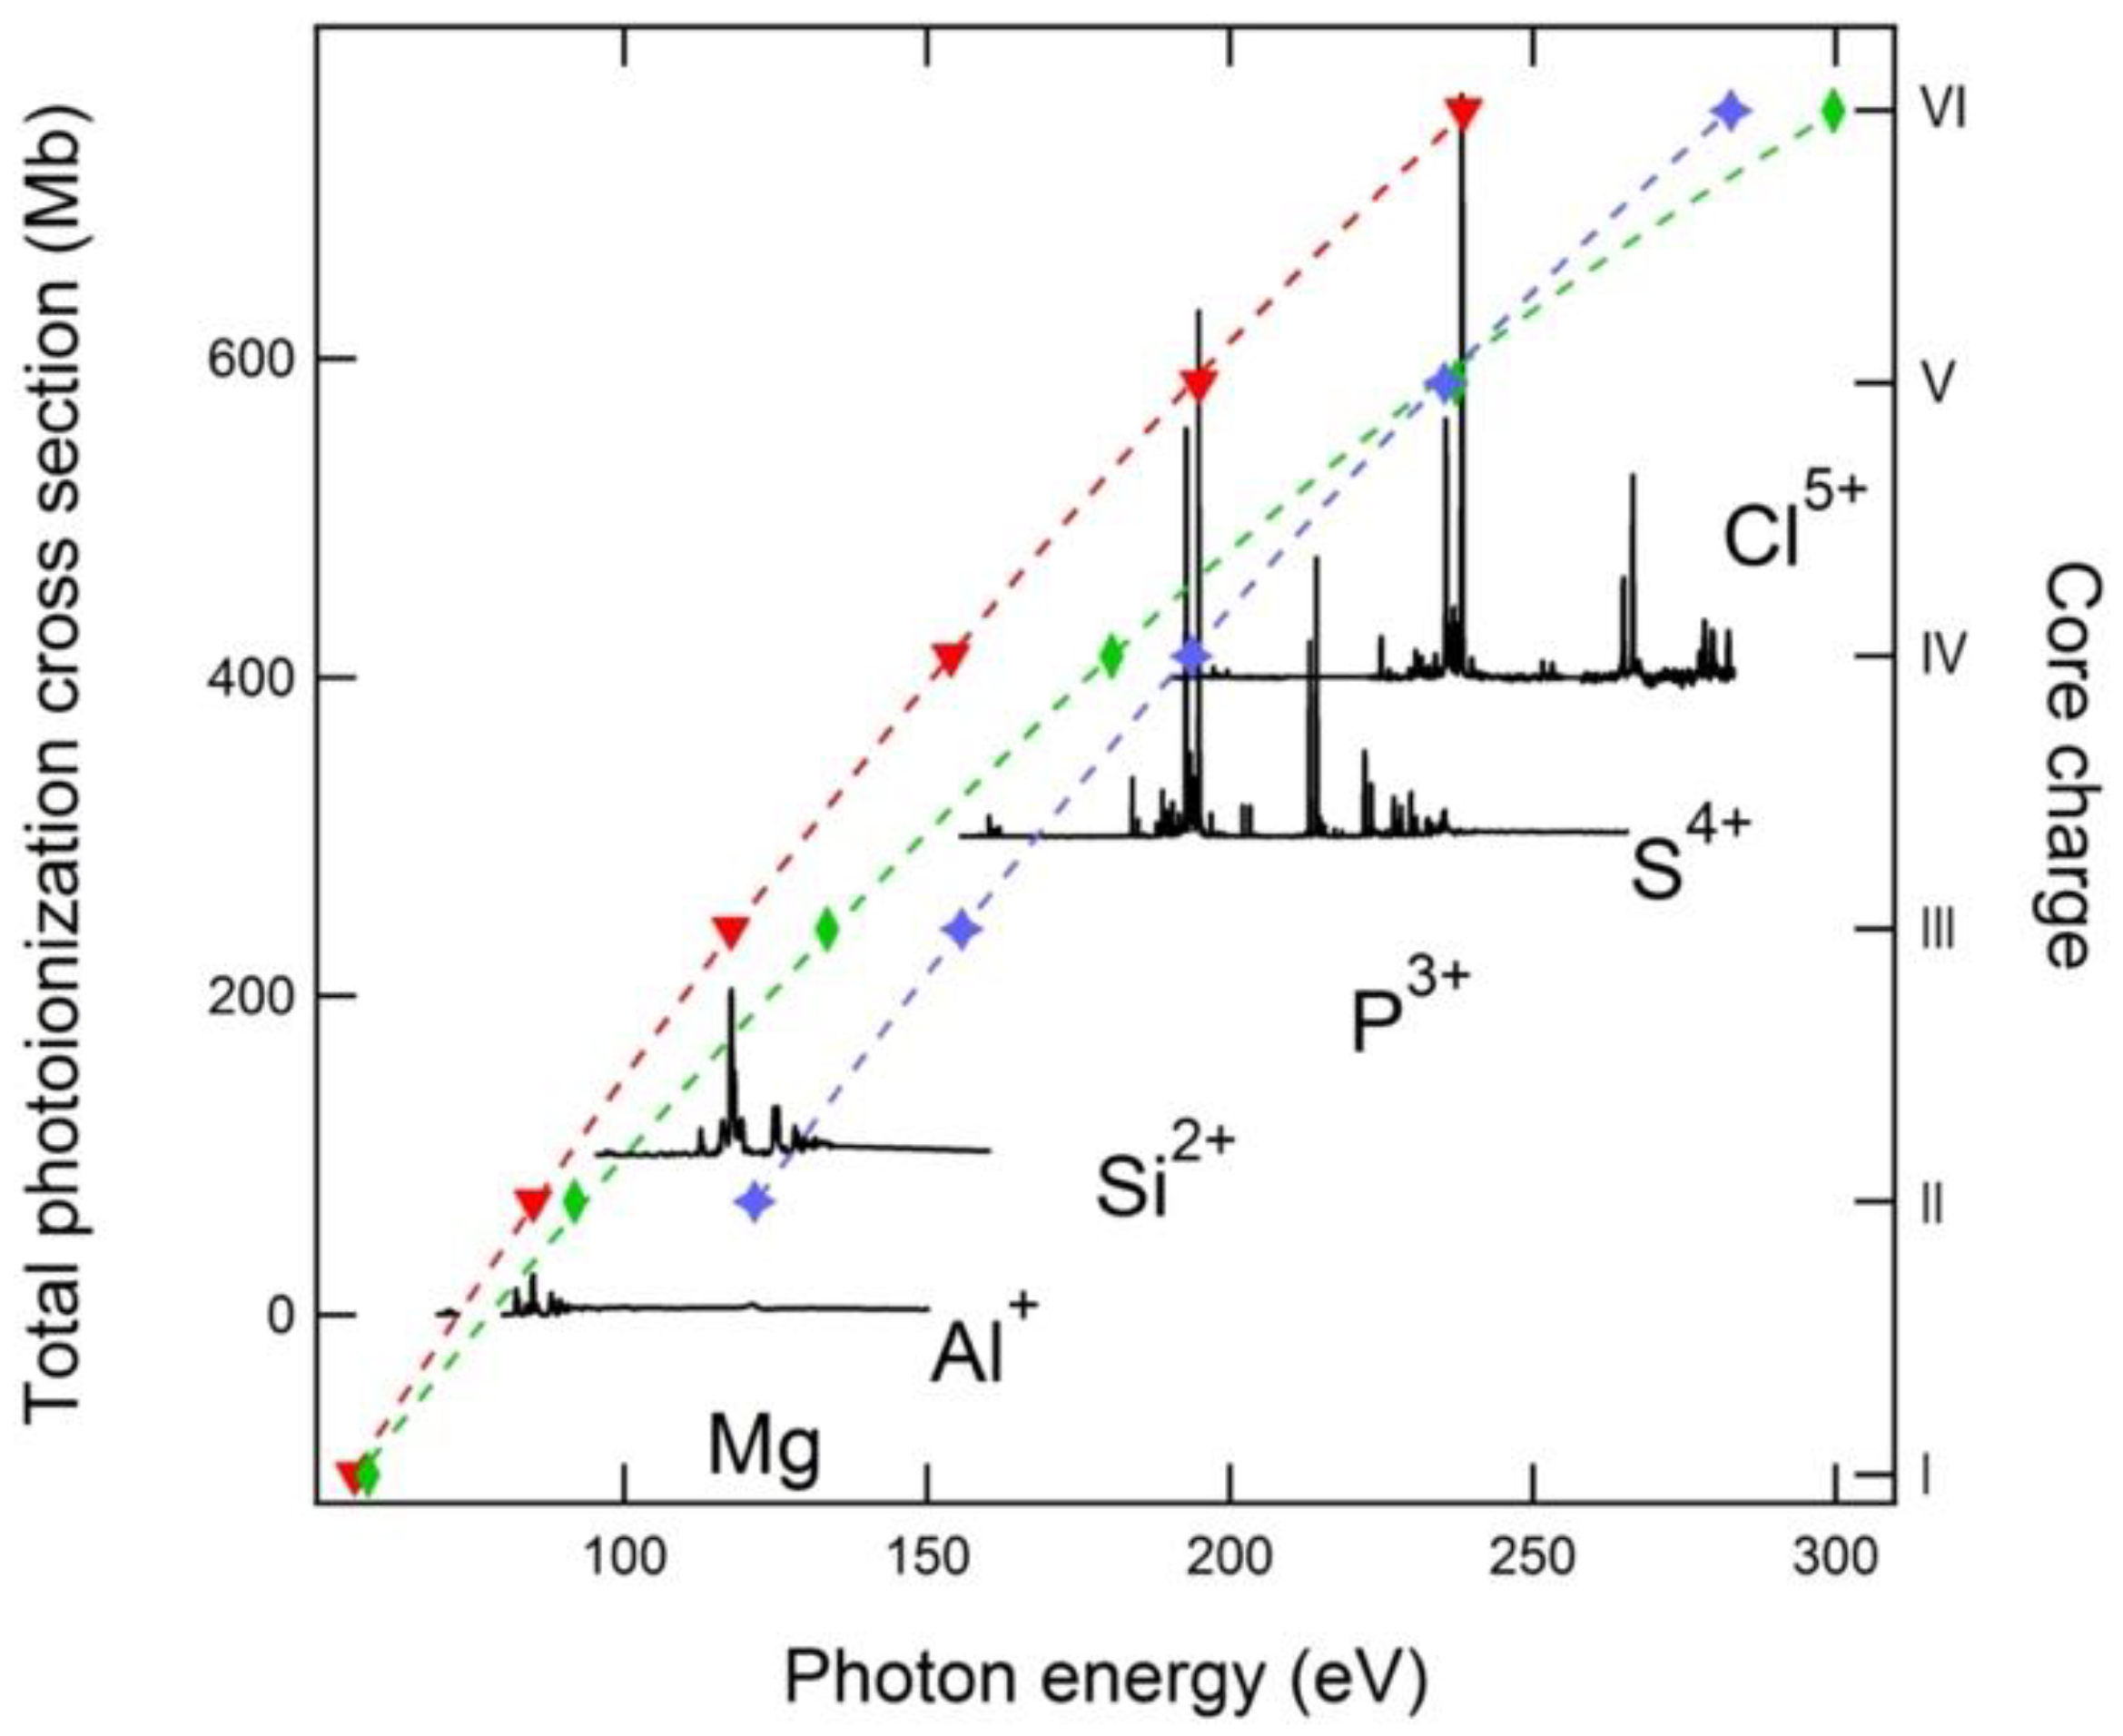
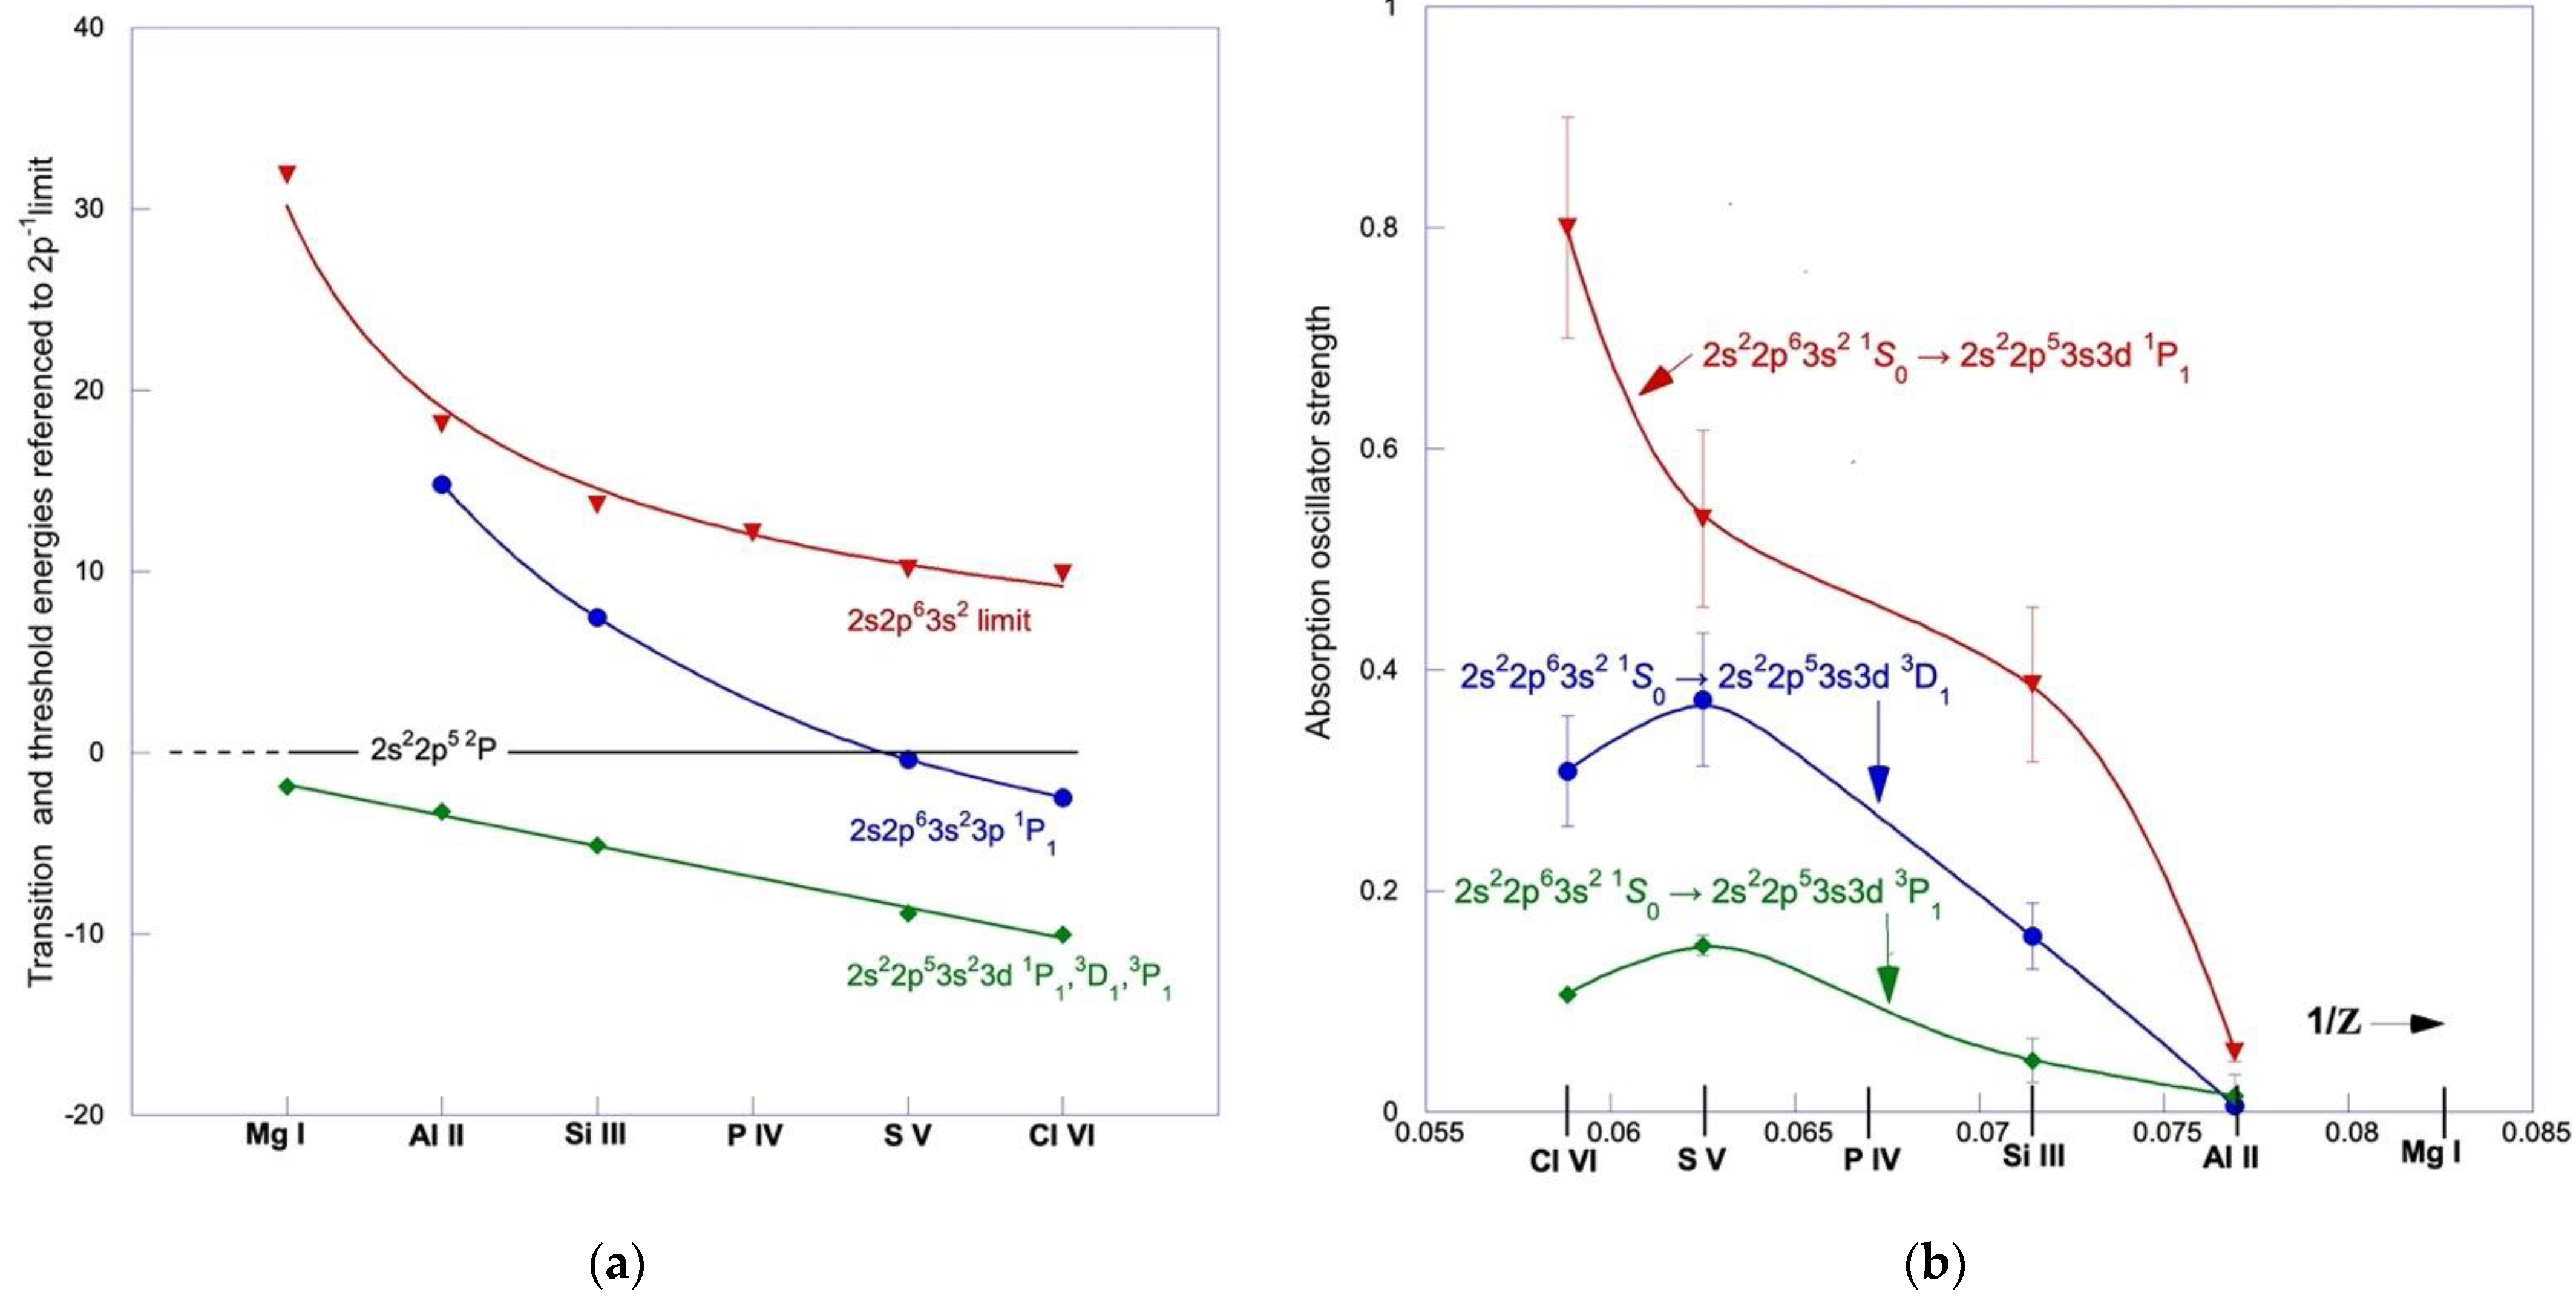
4.2. Evolution along the Mg-like Sequence

Studies of isoelectronic sequences of atomic energy levels [53] and absorption oscillator strengths (f-values) [54], line strengths or cross sections are of fundamental interest. New atomic data can be inferred from isoelectronic sequences via the interpolation/extrapolation to neighboring atoms and ions of sets of f -values/energies exhibiting smooth and systematic variations. Further, trends along isoelectronic sequences are also of great general interest because a smooth trend can be modeled using Z -dependent perturbation theory. Irregular, non-monotonic trends are also known to occur, and are commonly related to the crossing of levels of correlation–mixed states from interacting electronic configurations or spin–orbit mixed states [55]. The magnesium spectrum is a case in point for correlation mixing due to the strongly perturbing effects of the 3 p 2 configuration on the 3 s 3 d configuration as well as over the entire 3 d n s series indeed. As pointed out in the introduction, these effects are found to persist in the presence of a 2 p vacancy. Therefore, it is interesting to view the Cl5+ results within the overall context of the magnesium isoelectronic sequence.
Figure 8 provides a full view of both the single and double experimental photoionization cross sections, measured in synchrotron radiation-based, merged-beam experiments, including Al+ [9] (ASTRID), Si2+ [10] (SuperACO), S4+ [18] (SOLEIL), and Cl5+ (SOLEIL, this study). Although it is not possible to make detailed and/or quantitative intercomparisons between the four traces of Figure 8 due to their very different photon energy ranges with associated different spectral dispersions (determined by the beamline instrumentation), as well as the choice of experimental monochromator bandpass(es), the following qualitative remarks can be made. As expected, the resonance structures shift markedly to higher energies as the nuclear charge increases. The corresponding trends are explored in greater detail below for selected transitions. Progressing along the series, the progressive discretization of the SI resonance structure (i.e., mostly the 2 p 5 3 s 2 nd resonances) into a seemingly hydrogenic Rydberg series for Cl5+, as well as the concomitant redistribution of the line strengths into the first 2 p 5 3 s 2 3 d series member, are apparent.
In order to better visualize and characterize the main features of isoelectronic evolution, Figure 9 shows the total cross sections for the ions Al+ to Cl5+; however, these are displayed on modified photon energy scales so that the resulting spectra line up for better inter-comparison. To accomplish this, the energy scales are multiplied by appropriate numerical factors and suitably shifted so that the main 2 p 3 d and 2 p 4 d resonance structures line up (i.e., the same 2 p 3 d , 2 p 4 d energy difference is maintained for the four ions) below each other. It is clear from Figure 9 that for S4+ and Cl5+, the overall resonance structures are very similar. This confirms that by S4+, the increased core charge has become the dominating factor, simplifying the spectra as they become more hydrogenic in character. For the early members of the sequence, the 2 p 3 d structures show considerable changes as we move from Al+ to S4+: the supernumerary resonances to the lower energy side of the 2 p 3 d group, in particular, are strong for Al+, weaker for Si2+, and much weaker for S4+ and Cl5+. This shows the rapidly diminishing effects of the main 2 p 5 3 s 3 p 2 series perturber (see above).
Table 3 shows the main energy level and strength data (resonance energies and inner ionization thresholds) for all the early members of the sequence including magnesium. Where necessary, explanations regarding the origin of some data entries are provided in the footnote of Table 3. We plotted this data in two different ways in order to establish isoelectronic trends and interpolate with the missing P3+ ion.
Firstly, as shown in Figure 10, the cross section data (represented to scale for all the ions where electronic data are available) are displayed as a function of photon energy, and parametrically, as a function of the net core charge ζ   seen by a Rydberg electron ( ζ = 1 for Mg, ζ = 2 for Al+, etc…). The spectra are shifted vertically from one to the next by an arbitrary amount of 100 Mb for clarity. The three curves in Figure 10 show the movement of the strongest 2 p 3 d (the energy differences between the three possible final states of Table 3 are too small to be seen in Figure 9) and 2 s 3 p resonances, and the 2p ionization threshold as the net core charge increases from one to six. Noting the very smooth evolution of the curves along the sequence, the data are very accurately represented by 3rd-order polynomial fits (red-, blue- and green-colored broken lines, respectively), it seems justified to derive results for the missing member P3+ by interpolation, we show the corresponding data in Table 3.
We note that for the first four members, the 2 s 3 p resonance is found at energies above the 2 p threshold. For a value of the net core charge close to five (vicinity of S4+), this situation is reversed. This is discussed in greater detail below.
Secondly, we examine the isoelectronic trends of characteristic (resonance and threshold) energies and absorption oscillator strength, as shown in Figure 11a,b, respectively. Figure 11a plots the E 2 p 3 d   and E 2 s 3 p transition energies divided by the net core charge, referred to the energy value of the first inner limit 2 p 5 3 s 2   P 2   E 2 p ,   divided by the net core charge ( ζ ), i.e., E 2 p     3 d E 2 p / ζ and E 2 s     3 p E 2 p / ζ , respectively. The energy differences between the three possible final states 1 P 1 ,   3 D 1 , 3 P 1 are too small to be seen in Figure 11a. Further relevant data in the form of the theoretical 2s−1 threshold energies taken from [56], referred to the 2p−1 threshold in the same manner, are also included in Figure 11a.
From Figure 11a, we observe a regular (linear) series behavior for the 2 p 5 3 s 2 3 d average term energy, while for both the 2 s 2 p 6 3 s 2 3 p   P 1 1 and the 2s−1 threshold energies, the series behaviors are clearly non-linear, although smooth. Notably, the energy position of the first member of the asymmetric profile 2 s 3 p   P 1 1 excitation moves closer to the 2p−1 threshold as the core charge increases, and drops just below and well below the 2p−1 threshold for S4+ [18] and Cl5+, respectively. This crossing of the 2p−1 threshold by the 2 s 2 p 6 3 s 2 3 p   P 1 1 state is accompanied by a noticeable change from a Fano to a Lorentzian profile and a prominence of the resonance in the single ionization channel only. As one moves further up the sequence, this downward movement toward the 2p−1 threshold (and finally below) is expected to be replicated for the higher members of the series (n > 3). We note the similarity of this behavior with the previously observed behavior for the 2 s np transitions in the neon-like sequence [57]. This suggests a lesser role played by the aforementioned ( 3 s 2 + 3 p 2 + 3 d 2 )   correlations on the 2 s 3 p transition compared with the 2 p 3 d for the early members of the Mg-like sequence. If we interpolate the data for P3+ from Figure 11a, we obtain the values 154 eV (2p-3d) and 195 eV (2s-3p), which compare favorably with the corresponding predictions from Figure 10, as shown in Table 3. The value of the 2p−1 threshold for P3+, which is needed to obtain the data just quoted, was estimated from [58] to be (183 ± 1) eV. This is in reasonable agreement with the interpolated value shown in Table 3.
In Figure 11b, we plot the oscillator strengths f i     j for the 2 p 3 d   1 P 1 ,   3 D 1 , 3 P 1 transitions obtained from the integrated cross sections (in Mb eV) shown in Table 3, using the standard equation l i n e σ E d E = 109.8 f i j l i n e Φ i j E d E , where Φ i j is the normalized line profile as a function of 1 / Z , where Z is the atomic number. Correction factors of 0.95, 0.975, 0.78, and 0.77 were applied to the Al+, Si2+, S4+, and Cl5+ strength values, respectively, in Table 3 to take into account the different initial ground state populations. The curves for the 2 p 3 d   3 D 1 , 3 P 1 transitions are seen to present a maximum (near S4+), which is characteristic of series where configuration interaction effects are known to be important [55]. This is fully compatible with our previous discussions regarding the effects of the ( 3 s 2 3 d + 3 s 3 p 2 ) mixing along the magnesium sequence. As the nuclear charge increases, the oscillator strength transfers into the fully LS allowed 2 p S 1 0 3 d   1 P 1 transition, in tandem with the weakening of the configuration interaction effects discussed above.

5. Conclusions

The development of the storage ring-based, merged-beam technique has allowed the systematic study of inner-shell photoionization for extended isoelectronic sequences. For magnesium-like ions, the current results extend the sequence up to Cl5+. The similarity of the S4+ and Cl5+ ion yields implies that the photoionization behavior settles down when compared with earlier members of the sequence. The new experimental results for Cl5+ are compared with ab initio MCDF and R-matrix calculations. Differences between the experimental data and the theoretical predictions underscore the importance of the ongoing benchmarking of theory. While the relative energies and strengths of resonances are reasonably predicted by theory, it is clear that significant systematic energy shifts are required to bring the theoretically predicted resonance structures into reasonable coincidence with experimental data. Interpolation of the results along the sequence provides estimates for the energies of the 2p–3d and 2s–3p resonances and the 2p−1 and 2s−1 thresholds for the P3+ ion, which have not yet been experimentally studied.

Author Contributions

D.C., J.-M.B., E.T.K., J.-P.M. and S.G. conducted experiments and data collection. The theoretical predictions were contributed by C.B., M.F.H. and T.W.G. The figures and tables were prepared by J.-M.B., J.-P.M. and D.C. All the authors contributed to the analyses and conclusions. E.T.K., J.-P.M., T.W.G. and J.-M.B. prepared the original draft. All the authors reviewed subsequent draft versions. All authors have read and agreed to the published version of the manuscript.

Funding

This research received no external funding.

Data Availability Statement

Data supporting the results reported here can be obtained by directly contacting the authors.

Acknowledgments

T.W.G. was supported in part by NASA. The authors would like to thank the SOLEIL and PLÉIADES beamline staff, J. Bozek, C. Nicolas, and A. Milosavljevic for their support throughout the experiment. ETK and JPM thank SOLEIL for partial support.

Conflicts of Interest

The authors declare no conflict of interest.

References

  1. Esteva, J.M.; Mehlman, G. Autoionization Spectra of Magnesium (Mg I, Mg II and Mg III) in the 50- to 110-eV Energy Range. Astrophys. J. 1974, 193, 747–754. [Google Scholar] [CrossRef]
  2. Mehlman, G.; Weiss, A.W.; Esteva, J.M. Revised Classification of Mg II Levels between 59 and 63 EV. Astrophys. J. 1976, 209, 640–641. [Google Scholar] [CrossRef]
  3. Shorer, P.; Lin, C.D.; Johnson, W.R. Oscillator Strengths for the Magnesium Isoelectronic Sequence. Phys. Rev. A 1977, 16, 1109–1116. [Google Scholar] [CrossRef]
  4. Butler, K.; Mendoza, C.; Zeippen, C.J. Oscillator Strengths and Photoionization Cross-Sections for Positive Ions in the Magnesium Isoelectronic Sequence. Mon. Not. R. Astron. Soc. 1984, 209, 343–351. [Google Scholar] [CrossRef] [Green Version]
  5. Costello, J.T.; Evans, D.; Hopkins, R.B.; Kennedy, E.T.; Kiernan, L.; Mansfield, M.W.D.; Mosnier, J.-P.; Sayyad, M.H.; Sonntag, B.F. The 2p-Subshell Photoabsorption Spectrum of Al+ in a Laser-Produced Plasma. J. Phys. B At. Mol. Opt. Phys. 1992, 25, 5055–5068. [Google Scholar] [CrossRef]
  6. Mosnier, J.P.; Costello, J.T.; Kennedy, E.T.; Kiernan, L.; Sayyad, M.H. Even-Parity Autoionizing States in the Extreme-Ultraviolet Photoabsorption Spectra of Mg, Al+, and Si2+. Phys. Rev. A 1994, 49, 755–761. [Google Scholar] [CrossRef] [Green Version]
  7. Sayyad, M.H.; Kennedy, E.T.; Kiernan, L.; Mosnier, J.-P.; Costello, J.T. 2p-Subshell Photoabsorption by Si2+ Ions in a Laser-Produced Plasma. J. Phys. B At. Mol. Opt. Phys. 1995, 28, 1715–1722. [Google Scholar] [CrossRef]
  8. Fang, T.K.; Nam, B.I.; Kim, Y.S.; Chang, T.N. Resonant Structures of Overlapping Doubly Excited Autoionization Series in Photoionization of Mg-like Al+ and Si2+ Ions. Phys. Rev. A 1997, 55, 433–439. [Google Scholar] [CrossRef] [Green Version]
  9. West, J.B.; Andersen, T.; Brooks, R.L.; Folkmann, F.; Kjeldsen, H.; Knudsen, H. Photoionization of Singly and Doubly Charged Aluminum Ions in the Extreme Ultraviolet Region: Absolute Cross Sections and Resonance Structures. Phys. Rev. A 2001, 63, 052719. [Google Scholar] [CrossRef]
  10. Mosnier, J.-P.; Sayyad, M.H.; Kennedy, E.T.; Bizau, J.-M.; Cubaynes, D.; Wuilleumier, F.J.; Champeaux, J.-P.; Blancard, C.; Varma, R.H.; Banerjee, T.; et al. Absolute Photoionization Cross Sections and Resonance Structure of Doubly Ionized Silicon in the Region of the 2p−1 Threshold: Experiment and Theory. Phys. Rev. A 2003, 68, 052712. [Google Scholar] [CrossRef] [Green Version]
  11. Ho, H.C.; Johnson, W.R.; Blundell, S.A.; Safronova, M.S. Third-Order Many-Body Perturbation Theory Calculations for the Beryllium and Magnesium Isoelectronic Sequences. Phys. Rev. A 2006, 74, 022510. [Google Scholar] [CrossRef] [Green Version]
  12. Kim, D.-S.; Kim, Y.S. Theoretical Photoionization Spectra in the UV Photon Energy Range for a Mg-like Al+ Ion. J. Phys. B At. Mol. Opt. Phys. 2008, 41, 165002. [Google Scholar] [CrossRef]
  13. Pradhan, G.B.; Jose, J.; Deshmukh, P.C.; Radojević, V.; Manson, S.T. Photoionization of Mg and Ar Isonuclear Sequences. Phys. Rev. A 2009, 80, 053416. [Google Scholar] [CrossRef]
  14. Kim, D.-S.; Kwon, D.-H. Theoretical Photoionization Spectra for Mg-Isoelectronic Cl 5+ and Ar 6+ Ions. J. Phys. B At. Mol. Opt. Phys. 2015, 48, 105004. [Google Scholar] [CrossRef]
  15. Khatri, I.; Goyal, A.; Diouldé Ba, M.; Faye, M.; Sow, M.; Sakho, I.; Singh, A.K.; Mohan, M.; Wagué, A. Screening Constant by Unit Nuclear Charge Calculations of Resonance Energies and Widths of the 3pns 1,3P° and 3pnd 1P° Rydberg Series of Mg-like (Z = 13–26) Ions. Radiat. Phys. Chem. 2017, 130, 208–215. [Google Scholar] [CrossRef]
  16. Wehlitz, R.; Juranić, P.N. Relative Single- and Double-Photoionization Cross Sections of Mg around the 2p → nl Resonances. Phys. Rev. A 2009, 79, 013410. [Google Scholar] [CrossRef]
  17. Safronova, U.I.; Johnson, W.R.; Berry, H.G. Excitation Energies and Transition Rates in Magnesiumlike Ions. Phys. Rev. A 2000, 61, 052503. [Google Scholar] [CrossRef] [Green Version]
  18. Mosnier, J.-P.; Kennedy, E.T.; Cubaynes, D.; Bizau, J.-M.; Guilbaud, S.; Hasoglu, M.F.; Blancard, C.; Gorczyca, T.W. L-Shell Photoionization of Mg-like S4+ in Ground and Metastable States: Experiment and Theory. Phys. Rev. A 2022, 106, 033113. [Google Scholar] [CrossRef]
  19. Kallman, T.R.; Palmeri, P. Atomic Data for X-Ray Astrophysics. Rev. Mod. Phys. 2007, 79, 79–133. [Google Scholar] [CrossRef] [Green Version]
  20. Foster, A.R.; Smith, R.K.; Brickhouse, N.S.; Kallman, T.R.; Witthoeft, M.C. The Challenges of Plasma Modeling: Current Status and Future Plans. Space Sci. Rev. 2010, 157, 135–154. [Google Scholar] [CrossRef]
  21. Kallman, T.R. Modeling of Photoionized Plasmas. Space Sci. Rev. 2010, 157, 177–191. [Google Scholar] [CrossRef] [Green Version]
  22. Savin, D.W.; Brickhouse, N.S.; Cowan, J.J.; Drake, R.P.; Federman, S.R.; Ferland, G.J.; Frank, A.; Gudipati, M.S.; Haxton, W.C.; Herbst, E.; et al. The Impact of Recent Advances in Laboratory Astrophysics on Our Understanding of the Cosmos. Rep. Prog. Phys. 2012, 75, 036901. [Google Scholar] [CrossRef] [PubMed] [Green Version]
  23. Mendoza, C.; Bautista, M.A.; Deprince, J.; García, J.A.; Gatuzz, E.; Gorczyca, T.W.; Kallman, T.R.; Palmeri, P.; Quinet, P.; Witthoeft, M.C. The XSTAR Atomic Database. Atoms 2021, 9, 12. [Google Scholar] [CrossRef]
  24. Nahar, S. Database NORAD-Atomic-Data for Atomic Processes in Plasma. Atoms 2020, 8, 68. [Google Scholar] [CrossRef]
  25. Kennedy, E.T.; Costello, J.T.; Mosnier, J.-P.; Cafolla, A.A.; Collins, M.; Kiernan, L.; Koeble, U.; Sayyad, M.H.; Shaw, M.; Sonntag, B.F.; et al. Extreme-Ultraviolet Studies with Laser-Produced Plasmas. Opt. Eng. 1994, 33, 3984–3992. [Google Scholar] [CrossRef]
  26. Bizau, J.M.; Cubaynes, D.; Guilbaud, S.; El Eassan, N.; Al Shorman, M.M.; Bouisset, E.; Guigand, J.; Moustier, O.; Marié, A.; Nadal, E.; et al. A Merged-Beam Setup at SOLEIL Dedicated to Photoelectron–Photoion Coincidence Studies on Ionic Species. J. Electron. Spectrosc. Relat. Phenom. 2016, 210, 5–12. [Google Scholar] [CrossRef]
  27. Kjeldsen, H. Photoionization Cross Sections of Atomic Ions from Merged-Beam Experiments. J. Phys. B At. Mol. Opt. Phys. 2006, 39, R325–R377. [Google Scholar] [CrossRef]
  28. Phaneuf, R.A.; Kilcoyne, A.L.D.; Müller, A.; Schippers, S.; Aryal, N.; Baral, K.; Hellhund, J.; Aguilar, A.; Esteves-Macaluso, D.A.; Lomsadze, R. Cross-Section Measurements with Interacting Beams; American Institute of Physics: Gaithersburg, MD, USA, 2013; pp. 72–78. [Google Scholar] [CrossRef]
  29. Schippers, S.; Kilcoyne, A.L.D.; Phaneuf, R.A.; Muller, A. Photoionization of ions with synchrotron radiation: From ions in space to atoms in cages. Contemp. Phys. 2016, 57, 215–229. [Google Scholar] [CrossRef] [Green Version]
  30. Schippers, S.; Buhr, T.; Borovik, A., Jr.; Holste, K.; Perry-Sassmannshausen, A.; Mertens, K.; Reinwardt, S.; Martins, M.; Klumpp, S.; Schubert, K.; et al. The Photon-Ion Merged-Beams Experiment PIPE at PETRAIII—The First Five Years. X-ray Spectrom. 2020, 49, 11–20. [Google Scholar] [CrossRef] [Green Version]
  31. Hudson, C.E.; West, J.B.; Bell, K.L.; Aguilar, A.; Phaneuf, R.A.; Folkmann, F.; Kjeldsen, H.; Bozek, J.; Schlachter, A.S.; Cisneros, C. A Theoretical and Experimental Study of the Photoionization of AlII. J. Phys. B At. Mol. Opt. Phys. 2005, 38, 2911–2932. [Google Scholar] [CrossRef]
  32. Simon, M.C.; Crespo López-Urrutia, J.R.; Beilmann, C.; Schwarz, M.; Harman, Z.; Epp, S.W.; Schmitt, B.L.; Baumann, T.M.; Behar, E.; Bernitt, S.; et al. Resonant and Near-Threshold Photoionization Cross Sections of Fe 14 +. Phys. Rev. Lett. 2010, 105, 183001. [Google Scholar] [CrossRef] [Green Version]
  33. Blake, G.A.; Anicich, V.G.; Huntress, W.T., Jr. Chemistry of Chlorine in Dense Interstellar Clouds. Astrophys. J. 1986, 300, 415. [Google Scholar] [CrossRef]
  34. Feldman, P.D.; Ake, T.B.; Berman, A.F.; Moos, H.W.; Sahnow, D.J.; Strobel, D.D.; Weaver, H.H. Detection of Chlorine Ions in the Far Ultraviolet Spectroscopic Explorer Spectrum of the IO Plasma Torus. Astrophys. J. 2001, 554, L123–L126. [Google Scholar] [CrossRef]
  35. Kounaves, S.P.; Carrier, B.L.; O’Neil, G.D.; Stroble, S.T.; Claire, M.W. Evidence of Martian Perchlorate, Chlorate, and Nitrate in Mars Meteorite EETA79001: Implications for Oxidants and Organics. Icarus 2014, 229, 206–213. [Google Scholar] [CrossRef]
  36. Neufeld, D.A.; Wiesemeyer, H.; Wolfire, M.J.; Jacob, A.M.; Buchbender, C.; Gerin, M.; Gupta, H.; Güsten, R.; Schilke, P. The Chemistry of Chlorine-Bearing Species in the Diffuse Interstellar Medium, and New SOFIA/GREAT*Observations of HCl+. Astrophys. J. 2021, 917, 104. [Google Scholar] [CrossRef]
  37. Maas, Z.G.; Pilachowski, C.A.; Hinkle, K. Chlorine Abundances in Cool Stars. Astron. J. 2016, 152, 196. [Google Scholar] [CrossRef] [Green Version]
  38. Wallström, S.H.J.; Muller, S.; Roueff, E.; Le Gal, R.; Black, J.H.; Gérin, M. Chlorine-Bearing Molecules in Molecular Absorbers at Intermediate Redshifts. Astron. Astrophys. 2019, 629, A128. [Google Scholar] [CrossRef]
  39. Ren, L.-M.; Wang, Y.-Y.; Li, D.-D.; Yuan, Z.-S.; Zhu, L.-F. Inner-Shell Excitations of 2 p Electrons of Argon Investigated by Fast Electron Impact with High Resolution. Chin. Phys. Lett. 2011, 28, 053401. [Google Scholar] [CrossRef]
  40. Thuillier, T.; Benitez, J.; Biri, S.; Rácz, R. X-ray Diagnostics of ECR Ion Sources—Techniques, Results, and Challenges. Rev. Sci. Instrum. 2022, 93, 021102. [Google Scholar] [CrossRef]
  41. Bieron, J.; Froese-Fischer, C.; Jonsson, P. Special Issue “The General Relativistic Atomic Structure Package—GRASP”. 2022. Available online: https://www.mdpi.com/journal/atoms/special_issues/the_grasp#info (accessed on 14 March 2023).
  42. Bruneau, J. Correlation and Relaxation Effects in Ns2-Nsnp Transitions. J. Phys. B At. Mol. Phys. 1984, 17, 3009. [Google Scholar] [CrossRef]
  43. Grant, I.P. Gauge Invariance and Relativistic Radiative Transitions. J. Phys. B At. Mol. Phys. 1974, 7, 1458. [Google Scholar] [CrossRef]
  44. Savukov, I.M. Special Issue “Atomic Structure Calculations of Complex Atoms”. 2021. Available online: https://www.mdpi.com/journal/atoms/special_issues/AtomicStructureCalculations_ComplexAtoms (accessed on 14 March 2023).
  45. Schneider, B.I.; Hamilton, K.R.; Bartschat, K. Generalizations of the R-Matrix Method to the Treatment of the Interaction of Short-Pulse Electromagnetic Radiation with Atoms. Atoms 2022, 10, 26. [Google Scholar] [CrossRef]
  46. Sardar, S.; Xu, X.; Xu, L.-Q.; Zhu, L.-F. Relativistic R-Matrix Calculations for Photoionization Cross-Sections of C IV: Implications for Photorecombination of C V. Mon. Not. R. Astron. Soc. 2018, 474, 1752–1761. [Google Scholar] [CrossRef] [Green Version]
  47. Delahaye, F.; Ballance, C.P.; Smyth, R.T.; Badnell, N.R. Quantitative Comparison of Opacities Calculated Using the R -Matrix and Distorted-Wave Methods: Fe xvii. Mon. Not. R. Astron. Soc. 2021, 508, 421–432. [Google Scholar] [CrossRef]
  48. Burke, P.G. R-Matrix Theory of Atomic Collisions; Springer: New York, NY, USA, 2011. [Google Scholar]
  49. Berrington, K.A.; Eissner, W.B.; Norrington, P.H. RMATRX1: Belfast Atomic R-Matrix Codes. Comput. Phys. Commun. 1995, 92, 290–420. [Google Scholar] [CrossRef]
  50. Kramida, A.; Ralchenko, Y.; Reader, J.; NIST ASD Team. NIST Atomic Spectra Database; Version 5.10; NIST: Gaithersburg, MD, USA, 2022. [CrossRef]
  51. Fano, U. Effects of Configuration Interaction on Intensities and Phase Shifts. Phys. Rev. 1961, 124, 1866–1878. [Google Scholar] [CrossRef]
  52. Froese Fischer, C.; Tachiev, G.; Irimia, A. Relativistic Energy Levels, Lifetimes, and Transition Probabilities for the Sodium-like to Argon-like Sequences. At. Data Nucl. Data Tables 2006, 92, 607–812. [Google Scholar] [CrossRef]
  53. Curtis, L.J. Bengt Edlén’s Handbuch Der Physik Article—26 Years Later. Phys. Scr. 1987, 35, 805–810. [Google Scholar] [CrossRef]
  54. Wiese, W. Regularities of Atomic Oscillator Strengths in Isoelectronic Sequences. In Beam-Foil Spectroscopy; Springer: Berlin/Heidelberg, Germany, 1976; pp. 145–178. [Google Scholar]
  55. Hasoğlu, M.F.; Nikolić, D.; Gorczyca, T.W.; Manson, S.T.; Chen, M.H.; Badnell, N.R. Nonmonotonic Behavior as a Function of Nuclear Charge of the K -Shell Auger and Radiative Rates and Fluorescence Yields along the 1s2s22p3 Isoelectronic Sequence. Phys. Rev. A 2008, 78, 032509. [Google Scholar] [CrossRef]
  56. Verner, D.A.; Yakovlev, D.G.; Band, I.M.; Trzhaskovskaya, M.B. Subshell Photoionization Cross Sections and Ionization Energies of Atoms and Ions from He to Zn. At. Data Nucl. Data Tables 1993, 55, 233–280. [Google Scholar] [CrossRef]
  57. Chakraborty, H.S.; Gray, A.; Costello, J.T.; Deshmukh, P.C.; Haque, G.N.; Kennedy, E.T.; Manson, S.T.; Mosnier, J.-P. Anomalous Behavior of the Near-Threshold Photoionization Cross Section of the Neon Isoelectronic Sequence: A Combined Experimental and Theoretical Study. Phys. Rev. Lett. 1999, 83, 2151–2154. [Google Scholar] [CrossRef] [Green Version]
  58. Brilly, J.; Kennedy, E.T.; Mosnier, J.P. The 2p-Subshell Absorption Spectrum of Al III. J. Phys. B At. Mol. Opt. Phys. 1988, 21, 3685–3693. [Google Scholar] [CrossRef]
Figure 1. Plots of radial orbitals P n l r   as a function of the radial coordinate r (in atomic units) used in the present R-matrix calculations. The same orbitals are plotted using the same colour code for both S4+ and Cl5+.
Atoms 11 00066 g001
Figure 2. Schematic energy level diagram for Cl5+ showing excitation energies and ionization thresholds. The vertical solid and dashed lines indicate absorption pathways for synchrotron radiation (SR) photons, starting from the ground level 3s2 1S and the metastable 3s3p 3P levels, respectively. The dotted lines show how the inner-shell excitations lead to single ionization (Cl6+) or double ionization (Cl7+) channels.
Atoms 11 00066 g002
Figure 3. Photoionization cross section data, measured (black trace) and calculated using the R-matrix and MCDF theories (red and blue traces, respectively) for Cl5+ for photon energies lying between 190 and 370 eV. The experimental data (labelled Exp.) are the single ionization below the photon energy of 300 eV and the double ionization above the photon energy of 300 eV. The region around 200 eV corresponds with 2p excitations from the metastable 2p63s3p 3P levels. The resonances lying to higher photon energies arise predominantly from 2p (and 2s) excitations from the ground state 2p63s2 1S0 level. The cross section values in both the 200 eV and above 320 eV regions are ×10 in order to enhance visibility.
Atoms 11 00066 g003
Figure 4. Experimental (single ionization) and scaled theoretical photoionization cross sections of Cl5+ in the 195–201 eV photon region. The observed resonance structure corresponds to 2p excitations from the metastable 2p63s3p 3P to 2p53s23p 3S, 3P, 3D levels. The relative ground and 2p63s3p 3P metastable level populations are derived from fitting the theoretical MCDF (blue) and R-matrix (red) cross sections, shown here after convolution with a Gaussian profile of 110 meV FWHM and shifted by −0.54 eV meV and −0.64 meV, respectively, to the experimental data (black line with superimposed statistical error bars).
Atoms 11 00066 g004
Figure 5. Photoionization cross sections for Cl5+ in the photon energy region corresponding to 2p → 3d excitations: experimental data (single ionization, black trace), MCDF (blue), and R-matrix (red) theoretical predictions, respectively. The theoretical predictions are folded with the experimental bandpass (Gaussian profile of 50 meV FWHM) and weighted according to semi-empirically determined population percentages (see text). The MCDF and R-matrix theoretical predictions are shifted by −0.46 eV and −1.86 eV, respectively.
Atoms 11 00066 g005
Figure 6. Photoionization cross sections for Cl5+ in the photon energy region corresponding to 2p → nd excitations: experimental data (single ionization, black trace), MCDF (blue), and R-matrix (red) theoretical predictions, respectively. The theoretical predictions are folded with the experimental bandpass (Gaussian profile of 190 meV FWHM) and weighted according to semi-empirically determined population percentages (see text). The MCDF and R-matrix theoretical predictions are shifted by +0.97 eV and −4.36 eV, respectively.
Atoms 11 00066 g006
Figure 7. Photoionization cross sections for Cl5+ in the photon energy region corresponding to excitations from the 2s inner-shell: MCDF (blue) and R-matrix (red) theoretical predictions, and experimental data (double ionization, black trace) normalized to the theoretical curves. The theoretical predictions are folded with the experimental bandpass (Gaussian profile of 340 meV FWHM) and weighted according to semi-empirically determined population percentages (see text). The MCDF and R-matrix theoretical predictions are shifted by +1.0 eV and −7.0 eV, respectively.
Atoms 11 00066 g007
Figure 8. Single (red) and double (blue) photoionization cross sections for the magnesium-like ions Al+ [9], Si2+ [10], S4+ [18], and Cl5+ [this study] in the photon energy region corresponding to L-shell excitations.
Atoms 11 00066 g008
Figure 9. Photoionization cross sections for the magnesium-like ions Al+ [9], Si2+ [10], S4+ [18] (sum of the single and double ionization channels) and Cl5+ (this study: single ionization below or double ionization above the photon energy of 300 eV) in the photon energy region corresponding to L-shell excitations, with modified photon energy scales (see text).
Atoms 11 00066 g009
Figure 10. Photoionization cross sections for the magnesium-like sequence Al+ [9], Si2+ [10], S4+ [18] (sum of the single and double ionization channels) and Cl5+ (this study: single ionization below, or double ionization above, the photon energy of 300 eV) in the photon energy region corresponding to L-shell excitations. No experimental data as yet exist for P3+. The scale ticks on the right-hand side indicate the net core charge of the ion. The energies of the strongest 2 p 3 d resonance (red triangles), the 2 s 3 p resonance (blue stars), and the 2p−1 threshold (green diamonds) are shown for each ion. The data are accurately represented by 3rd-order polynomial fits (red-, blue-, and green-colored broken lines, respectively), yielding the corresponding photon energies for P3+ by interpolation.
Atoms 11 00066 g010
Figure 11. Isoelectronic plots for selected L-shell transitions and thresholds along the magnesium electronic sequence. (a) Transition and threshold energies (in eV) relative to the 2p limit, divided by the net core charge (spectral roman number) for the first six members of the sequence (the experimental data for P IV is unknown). (b) Absorption oscillator strength plotted as a function of 1/Z for the 2 p 3 d   1 P 1 ,   3 D 1 , 3 P 1 transitions. Further details for both plots are given in the text. The solid lines joining the points in both plots are cubic-spline numerical fits to guide the eye more easily through the data.
Atoms 11 00066 g011
Table 1. Experimental energies, theoretical energies, line strengths, and assignments in LSJ notation (based on MCDF results) for Cl5+ resonances in the 195 eV–200 eV photon energy range, arising from 2p → 3s inner-shell excitations from the valence-excited metastable 2p63s3p 3P0,1,2 states.
Energy (eV)/Strength (Mb.eV)
Experimental * R-MatrixMCDFAssignment
195.66(4)/0.09(2) 196.61/0.083196.84/0.0643P2-3S1
195.95(3)/0.15(3)196.83/0.074197.05/0.0643P0-3S1
197.29(2)/0.85(13)198.20/0.864198.13/0.7003P2-3D3
197.54(4)/0.09(2)198.47/0.118198.38/0.0363P1-3D2
198.12(3)/0.27(4)199.04/0.268198.97/0.2113P0-3D1
198.31(4)/0.28(5)199.24/0.076199.10/0.2733P2-3P2
199.09(4)/0.07(3)200.04/0.054199.94/0.0483P2-3D1
199.33(4)/0.09(2)200.18/0.013200.08/0.0123P1-3D1
199.49(4)/0.11(2)200.25/0.028200.15/0.0243P0-3D1
199.59(2)/0.47(8)200.51/0.478200.36/0.3063P2-3D2
200.57/0.252200.47/0.1563P2-3P1
199.97(5)/0.05(2)200.79/0.067200.68/0.503P0-3P1
* The number in brackets is the experimental uncertainty on the last digit, i.e., 195.66(4) eV is the same as (195.66 ± 0.04) eV. The same convention is used for all the data presented in this column.
Table 2. Experimental and theoretical (MCDF and R-matrix) energies, as measured line strengths and, where available, Auger widths for the Cl5+ resonances due to 2p → nd and 2s → np inner-shell excitations from the 2p63s2 1S0 ground state. Where identifiable from the output of the MCDF theory, the dominant electron configuration and leading LSJ character of the final state of the resonance is given in the outermost right column.
Energy (eV)/Strength (Mb eV)/Auger Width (meV) *
Experimental **
Energy (eV)/Strength (Mb eV)/Auger Width (meV) *
R-matrix
Energy (eV)/Strength (Mb eV)/Auger Width (meV) *
MCDF
Assignment (MCDF)
225.28(3)/4.0(7)/x226.77/3.94/x224.78/5.06/x 2 p 5 3 s 3 p 2   D 3 1
226.56(7)/0.7(4)/x228.08/0.63/x225.93/6.57/x 2 p 5 3 s 3 p 2   P 3 1
230.03(7)/0.9(4)/x231.91/1.07/x
231.01(3)/2.9(6)/x232.88/2.75/x231.25/1.32/x 2 p 5 3 s 3 p 2   P 3 1
231.93(4)/2.2(5)/x233.80/2.12/x
232.49(7)/0.8(4)/x
233.05(5)/1.2(4)/x235.18/0.19/x
233.64(10)/0.5(4)/x
234.26(4)/2.4(5)/x 234.48/2.83/x 2 p 5 3 s 3 p 3 d   D 3 3
234.73(6)/1.0(4) /x
235.98(2)/26(4)/51(4) 237.81/29/37236.01/39.8/45 2 p 5 3 s 2 3 d   D 3 1
236.35(3)/1.1(4)/x
236.54(3)/1.5(4)/x
236.71(3)/9(2)/158(65)238.69/20.3/134236.97/28/92 2 p 5 3 s 2 3 d   P 3 1
237.27(3)/2.2(3)/x
237.34(3)/4.7(8)/x 237.73/5.5/x 2 p 5 3 s 3 p 3 d   D 3 2 ***
237.49(4)/0.5(4)/x
237.66(3)/4.8(8)/x 238.16/2.7/x 2 p 5 3 s 3 p 3 d   D 3 3 ***
238.01(3)/2.3(5)/x 238.45/1.72/ x 2 p 5 3 s 3 p 3 d   D 3 1 ***
238.61(2)/78(12)/46(2)240.58/58.1/69239.46/42.6/86 2 p 5 3 s 2 3 d   P 1 1
240.26(4)/2.0(5)/x 240/2.24/x 2 p 5 3 s 3 p 3 d   S 3 1 ***
240.47(7)/9(4)/x
251.98(2)/1.5(2)/x255.97/1.9/ 87251.10/1.0/x 2 p 5 3 s 2 4 s   P 3 1
253.55(2)/1.4(2)/x257.51/1.8/87 252.71/0.8/x 2 p 5 3 s 2 4 s   P 3 1
265.33(3)/13(2)/x269.73/12.2/59264.36/14.0/x 2 p 5 3 s 2 4 d   D 3 1
266.88(3)/21(3)/x271.18/17.9/53265.96/21.8/x 2 p 5 3 s 2 4 d   P 3 1
278.01(3)/4.1(7)/x
278.75/8.5(1.3)/x 276.98/9.09/x 2 p 5 3 s 2 5 d   P 3 1
280.05(3)/8.4(1.3)/x 278.56/7.57/x 2 p 5 3 s 2 5 d   P 3 1
282.66(3)/6.5(1.0)/x 282.60/21.9/x 2 s 2 p 6 3 s 2 3 p   P 1 1
329.6(1)/x/x336.88/x/x328.85/4.27/x 2 s 2 p 6 3 s 2 4 p   P 1 1
346.7(1)/x/x353.38/x/x345.47/1.77/x 2 s 2 p 6 3 s 2 5 p   P 1 1
355.3(1)/x/x362.03/x/x353.69/0.88/x 2 s 2 p 6 3 s 2 6 p   P 1 1
360.4(1)/x/x366.67/x/x358.38/0.49/x 2 s 2 p 6 3 s 2 7 p   P 1 1
* The symbol x indicates partial absence of data for that entry. No entry at all means that there are no data available. ** The number in brackets is the experimental uncertainty on the last digit of the data, i.e., 235.98(2)/26(4)/51(4) is the same as (235.98 ± 0.02) eV/(26 ± 4) Mb.eV/(51 ± 4) meV. The same notation convention is used for all the data presented in this column. *** These resonances are due to 2p → 3d excitations from the initial 2 p 6 3 s 3 p   P 3 0 , 2 metastable states.
Table 3. Top line: Experimental energy (eV), middle line: Non radiative (NR) width (meV), and bottom line: Strength (Mb eV) for the strongest 2 p 3 d   1 P 1 ,   3 D 1 , 3 P 1 resonances, energy of the 2p limit (eV), and experimental energy of the 2 s 3 p   1 P 1 resonance along the magnesium-like sequence. Experimental data and their references are provided for all members of the sequence up to Cl5+, apart from P3+, for which interpolated values are deduced. The symbol x indicates that data are not available. The number in brackets is the experimental uncertainty on the last digit of the data, i.e., 55.492(1) is the same as (55.492 ± 0.001) etc. The same convention is used for all the data presented in this table where error values are available.
Atom/Ion 2 p 3 d
1 P 1
2 p 3 d
3 D 1
2 p 3 d
3 P 1
2p Limit 2 s 3 p
1 P 1
Mg I55.492(1) 55.677(1)55.838(1)57.658(2) ex
4.6(9)5.0(1)8.2(4)
xxx
Al II 84.99(2)85.36(2)85.57(2)91.75(15) c121.5(5)
xxx
5.6 b0.54 b1.5 b
Si III 117.6(1)118.1(1)118.8(1)133.5(1) c155.7(4)
xxx
37(7) b17(3) b5(1) b
P IV (present work) a154.4153.9154.7180.5193.6
x
x
x
x
x
x
S V194.88
51
46(7) b
192.74
47
32(5) b
193.42
149
13(2) b
237.35 c235.4
Cl VI (present work)238.61(2)
46(2)
68(10) b
235.98(2)
51(4)
26(4) b
236.71(3)
158(65)
9(2) b
299.6 d282.66
a For P IV, the entries are obtained by interpolation of the isoelectronic plots of Figure 10 and italicized for clarity. b Not corrected for possible contributions of metastable states. c Values estimated from the experimental photon energy of the onset of double ionization. d From hydrogenic fit (see text). e Statistically averaged over the 2 P 1 / 2 and 2 P 3 / 2 components.
Disclaimer/Publisher’s Note: The statements, opinions and data contained in all publications are solely those of the individual author(s) and contributor(s) and not of MDPI and/or the editor(s). MDPI and/or the editor(s) disclaim responsibility for any injury to people or property resulting from any ideas, methods, instructions or products referred to in the content.

