
Charge Exchange Spectroscopy of Multiply Charged Erbium Ions

 , , ,
, , ,
Abstract
:1. Introduction
2. Experiment
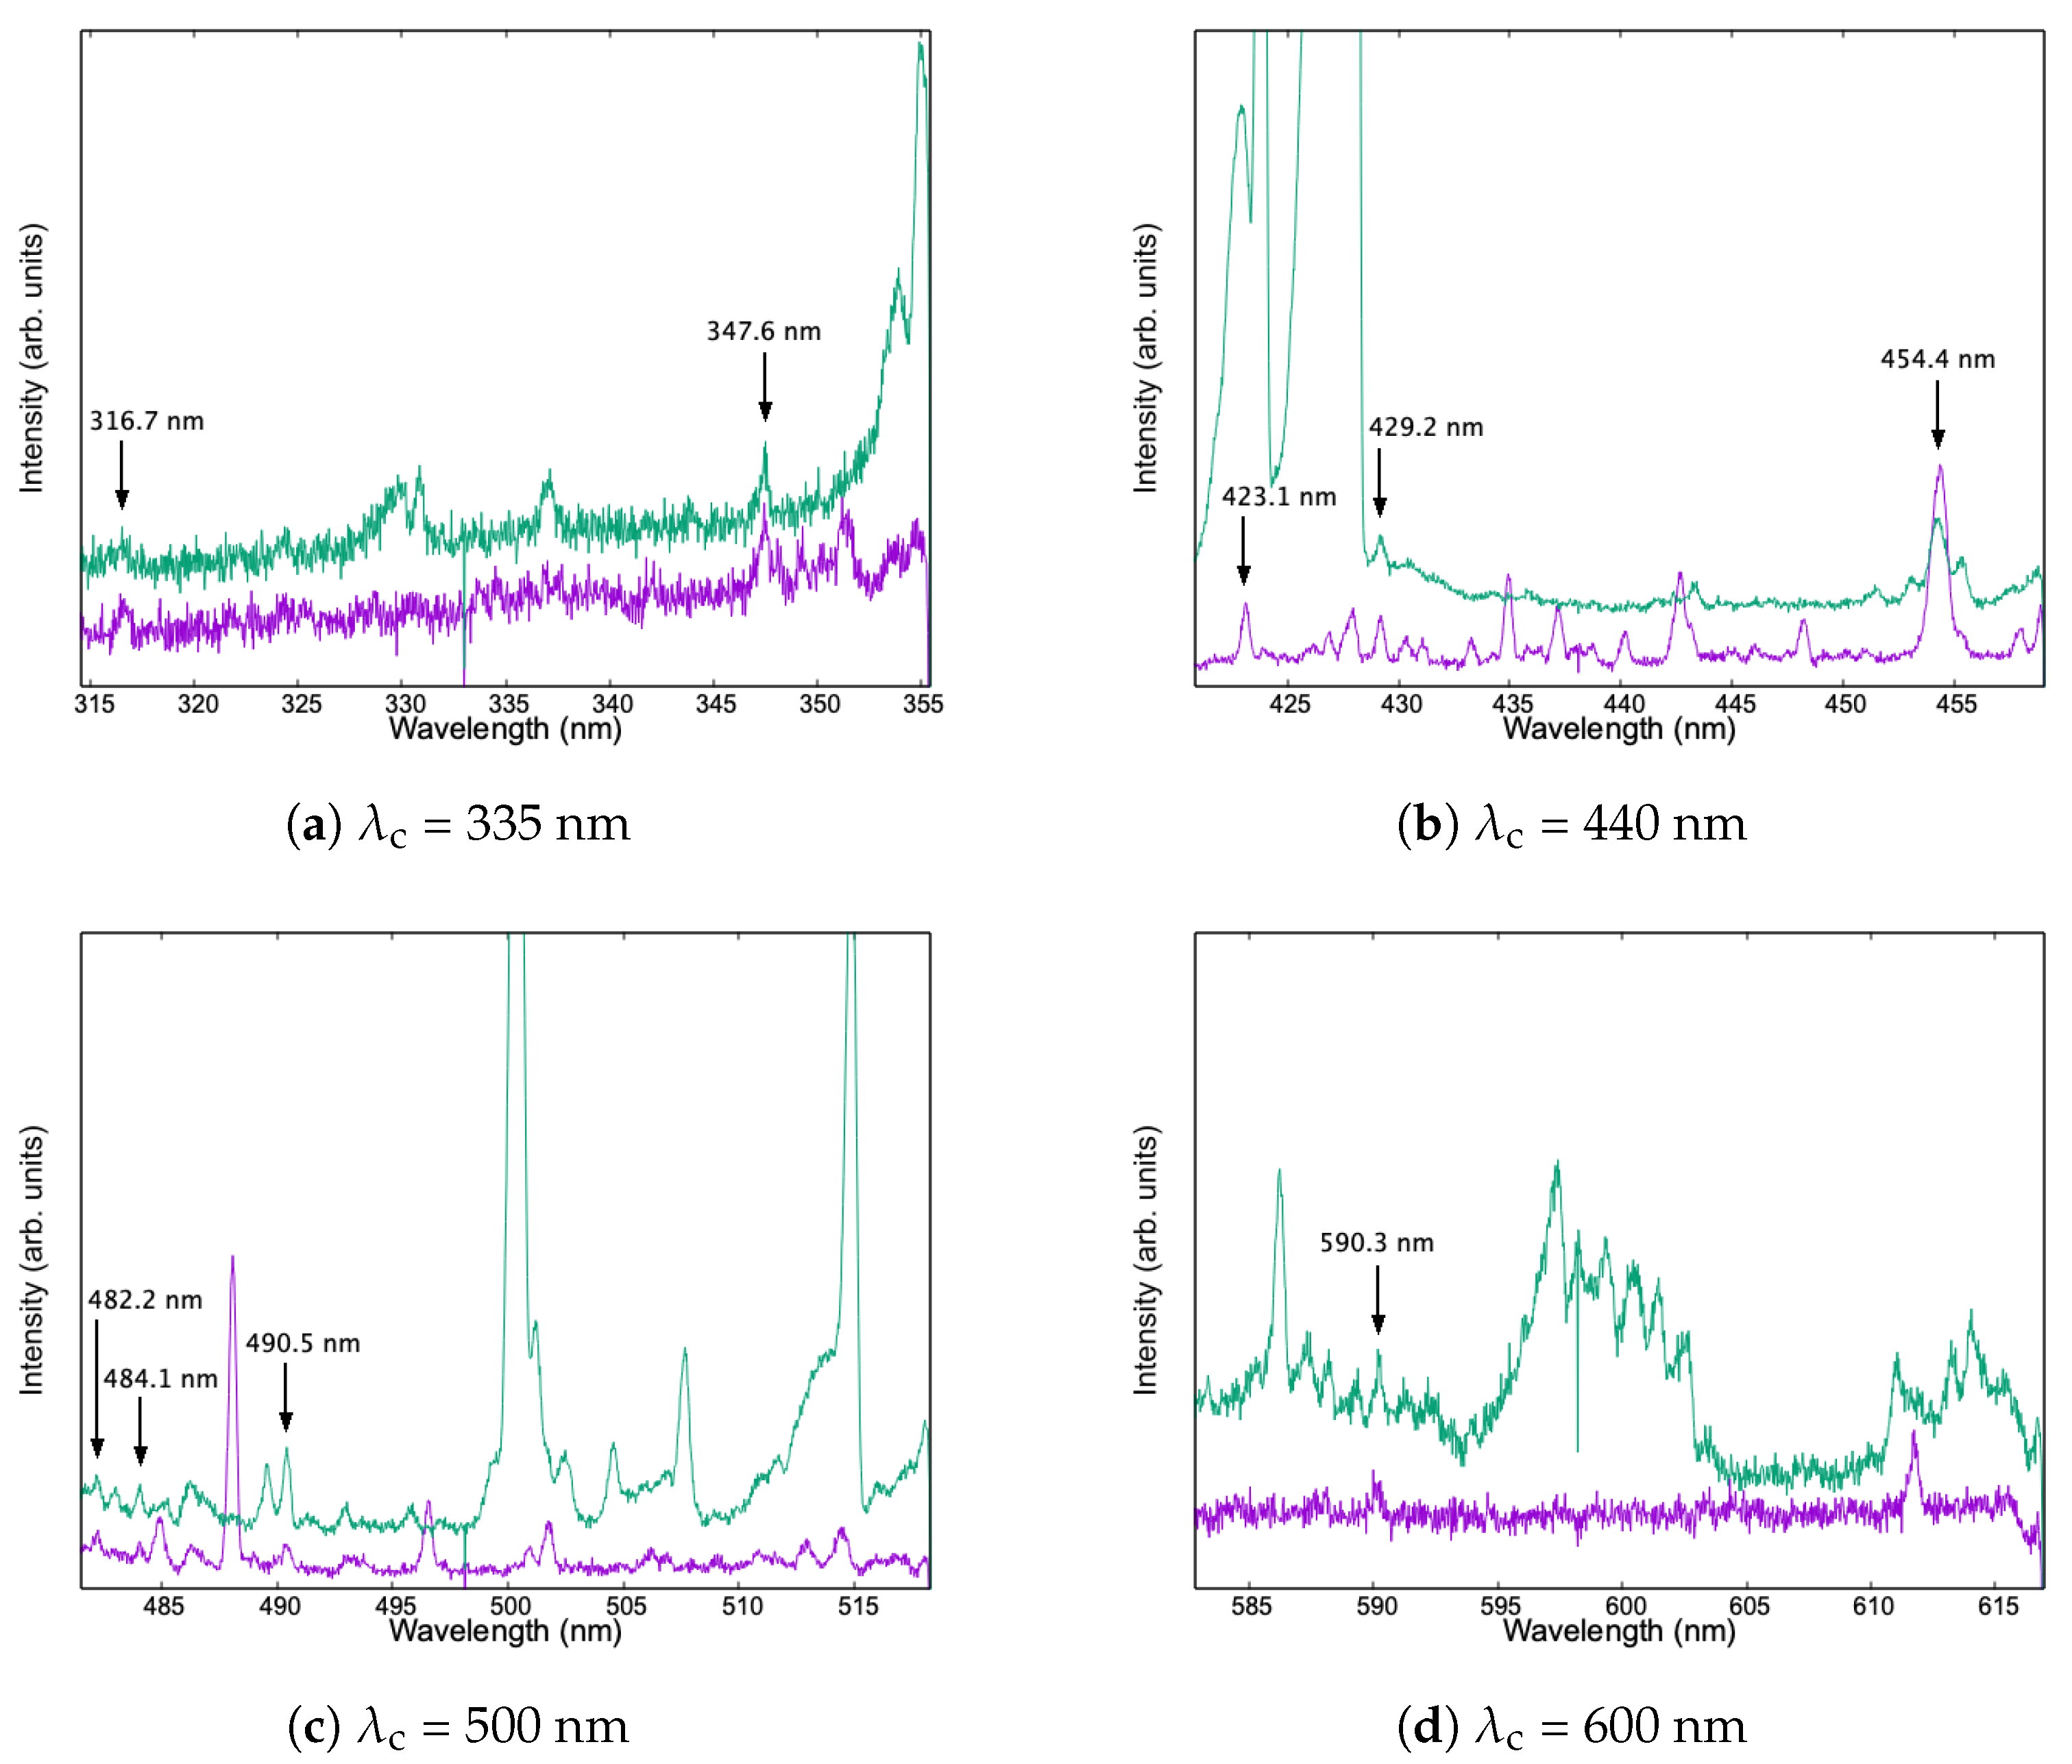
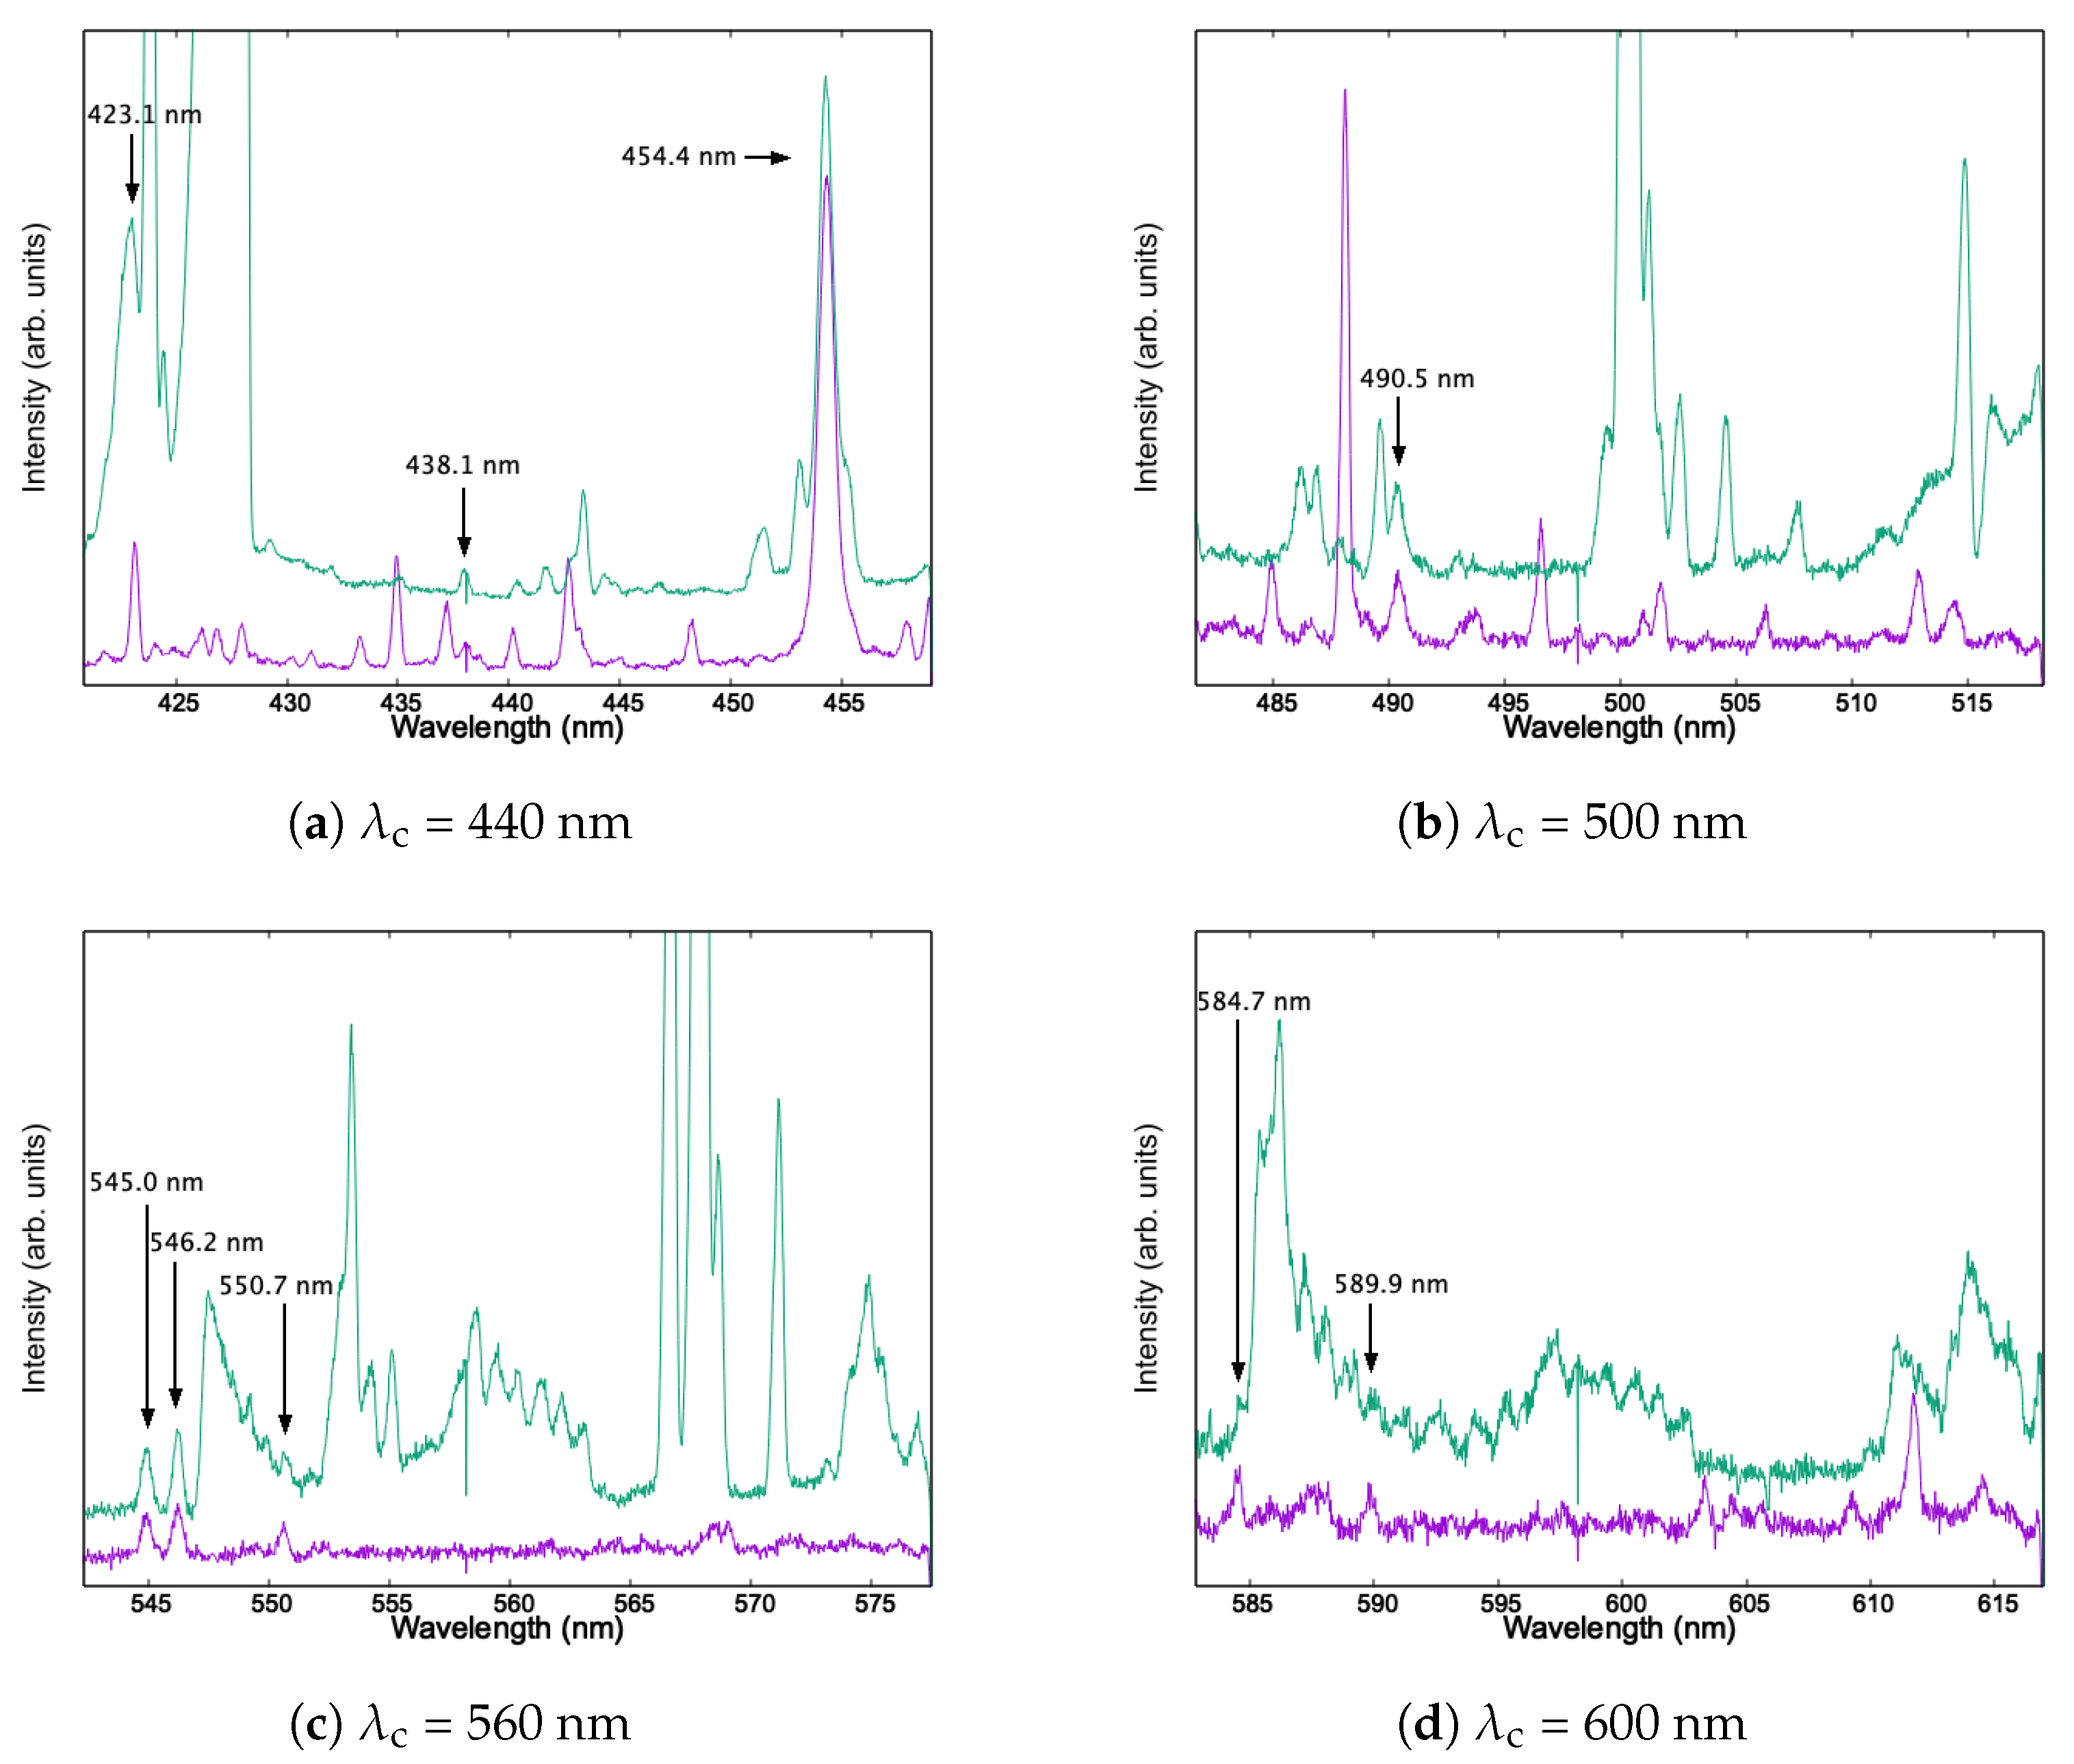
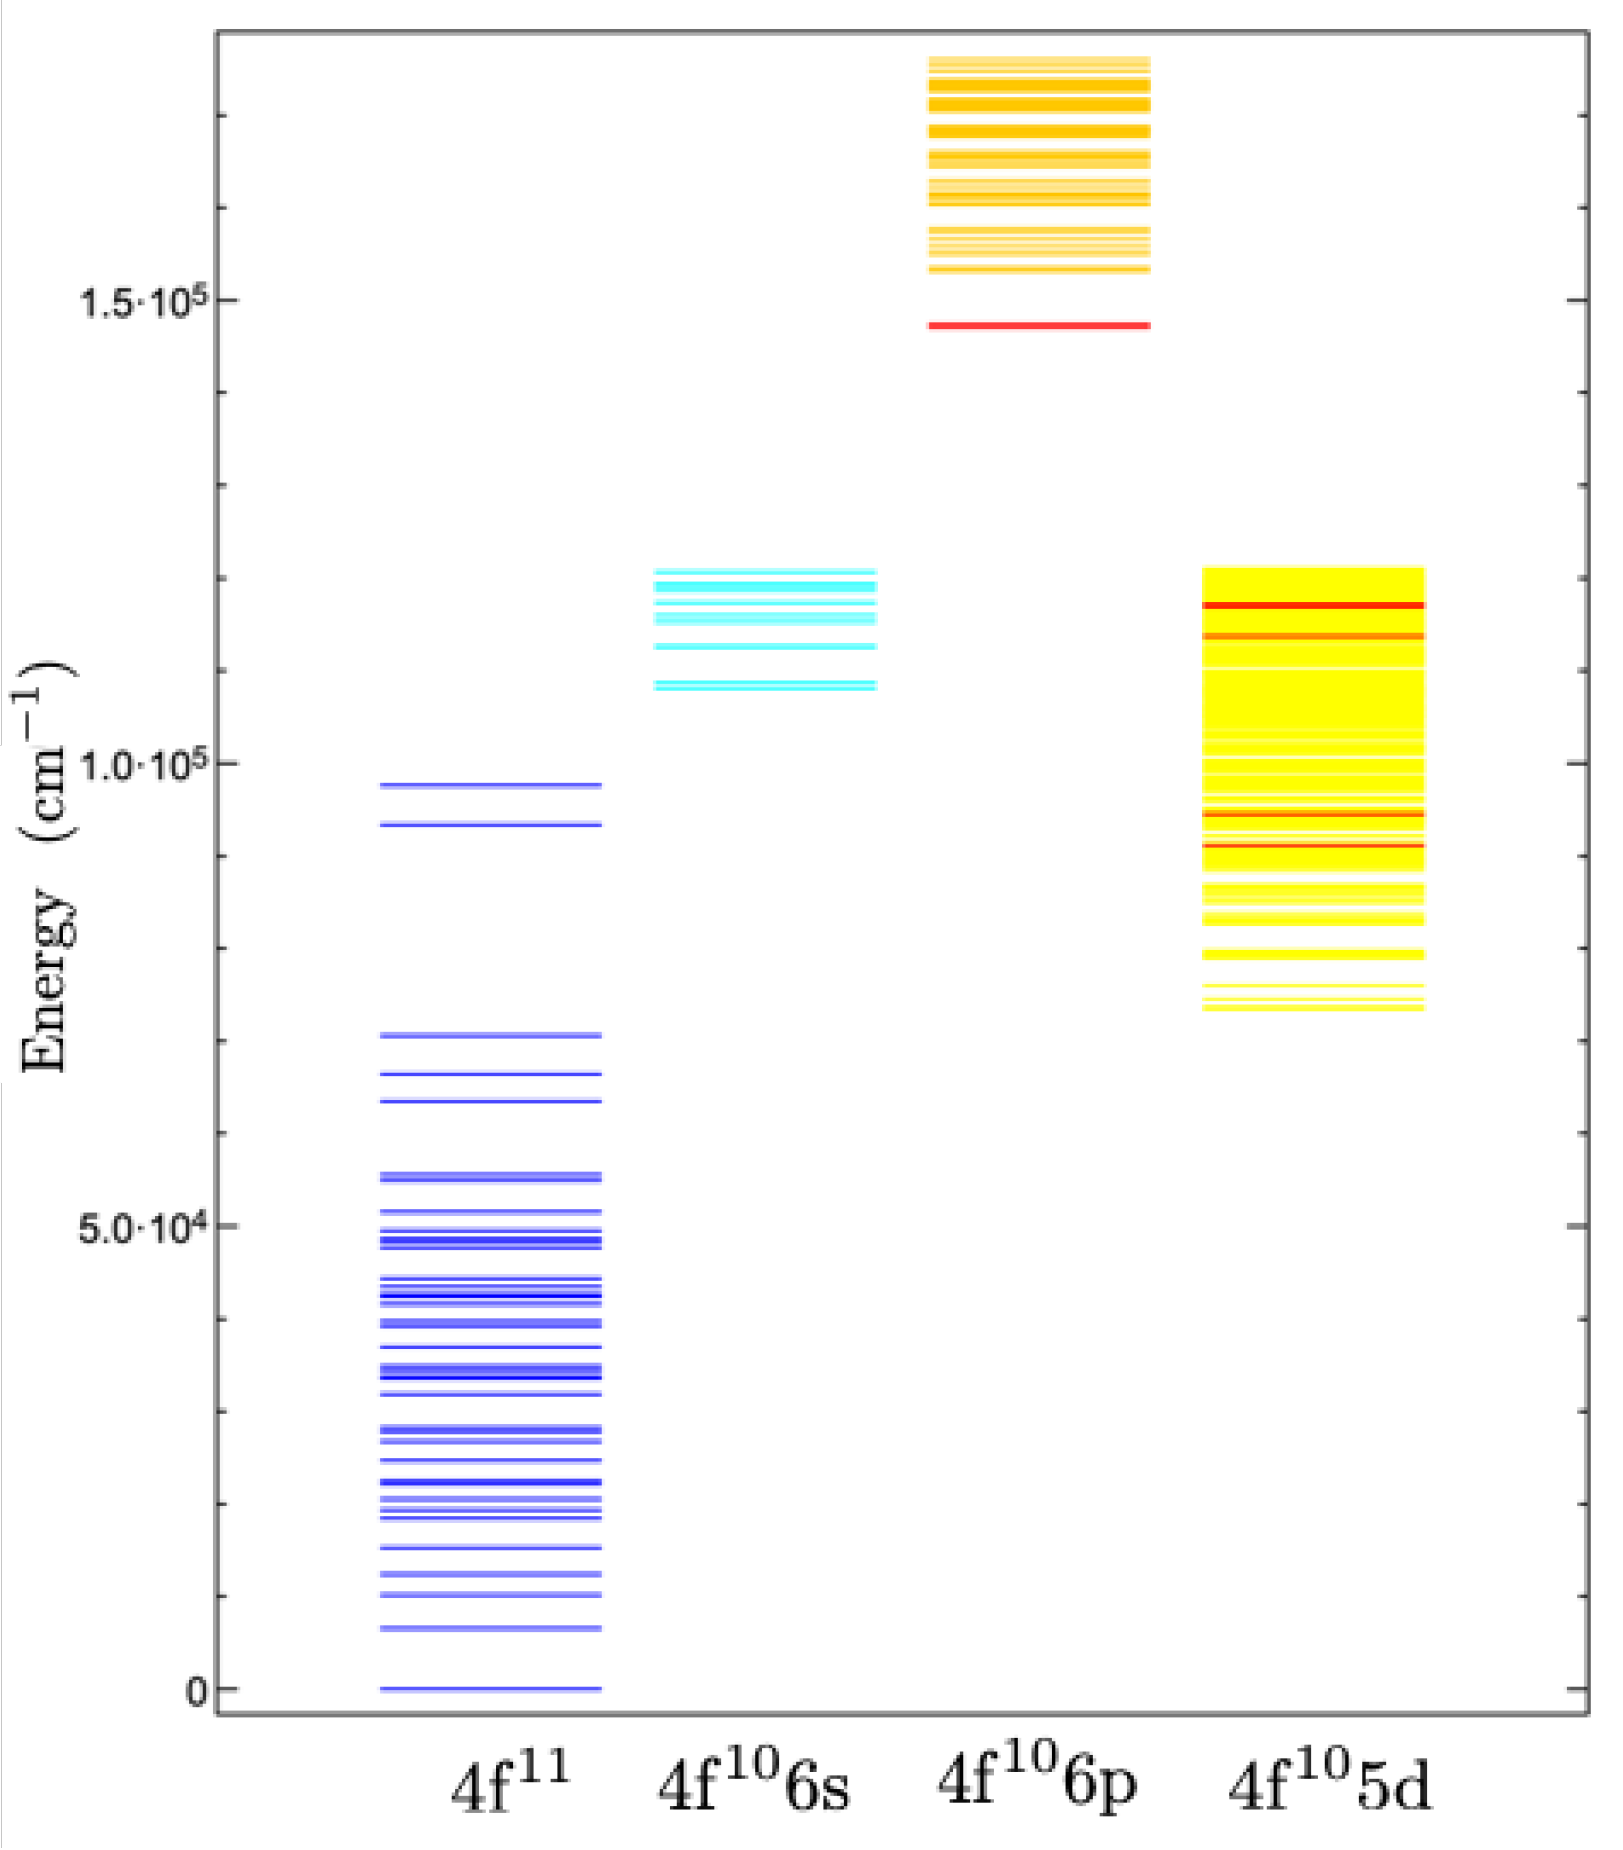
3. Results
4. Discussion
Funding
Conflicts of Interest
References
- Cowan, J.J.; Sneden, C.; Lawler, J.E.; Aprahamian, A.; Wiescher, M.; Langanke, K.; Martínez-Pinedo, G.; Thielemann, F.K. Origin of the heaviest elements: The rapid neutron-capture process. Rev. Mod. Phys. 2021, 93, 015002. [Google Scholar] [CrossRef]
- Tanaka, M.; Utsumi, Y.; Mazzali, P.A.; Tominaga, N.; Yoshida, M.; Sekiguchi, Y.; Morokuma, T.; Motohara, K.; Ohta, K.; Kawabata, K.S.; et al. Kilonova from post-merger ejecta as an optical and near-Infrared counterpart of GW170817. Publ. Astron. Soc. Japan 2017, 69, 102. [Google Scholar] [CrossRef]
- Tanaka, M.; Hotokezaka, K. Radiative transfer simulations of neutron star merger ejecta. Astrophys. J. 2013, 775, 113. [Google Scholar] [CrossRef]
- Meftah, A.; Mammar, S.A.; Wyart, J.F.; Tchang-Brillet, W.Ü.; Champion, N.; Blaess, C.; Deghiche, D.; Lamrous, O. Analysis of the free ion spectrum of Er3+(Er IV). J. Phys. B 2016, 49, 165002. [Google Scholar] [CrossRef]
- Tanuma, H.; Matsumoto, J.; Nishide, T.; Shiromaru, H.; Kobayashi, N. Present Status of Highly Charged Ion Experiments with an ECR Ion Source at TMU. J. Chin. Chem. Soc. 2001, 48, 389–394. [Google Scholar] [CrossRef]
- Kramida, A.; Ralchenko, Y.; Reader, J.; NIST ASD Team. NIST Atomic Spectra Database (ver. 5.10); National Institute of Standards and Technology: Gaithersburg, MD, USA, 2022. [Google Scholar] [CrossRef]
- Lee, C.S.; Suen, J.T. A study of the first negative system induced by H+, , , He+, and Ne+. Nucl. Instrum. Methods Phys. Res. B 1998, 140, 273–280. [Google Scholar] [CrossRef]
- Taulbjerg, K. Reaction windows for electron capture by highly charged ions. J. Phys. B 1986, 19, L367. [Google Scholar] [CrossRef]


| (nm) | Upper Level | (cm−1) | Lower Level | (cm−1) | (cm−1) | (nm) | ||
|---|---|---|---|---|---|---|---|---|
| 347.7 | 4f6p (I)H | 7.5 | 147,062.3 | 4f5d d(M)L | 8.5 | 117,818.7 | 29,243.6 | 341.955 |
| 4f6p (I)H | 7.5 | 147,062.3 | 4f5d d(L)L | 7.5 | 118,103.2 | 28,959.1 | 345.315 | |
| 4f6p (I)H | 7.5 | 147,062.3 | 4f5d d(M)K | 7.5 | 118,356.0 | 28,706.3 | 348.356 | |
| 4f6p (I)K | 8.5 | 147,473.8 | 4f5d d(M)K | 7.5 | 118,356.0 | 29,117.8 | 343.433 | |
| 423.2 | 4f5d d(I)I | 5.5 | 94,497.7 | 4f G2 | 4.5 | 70,623.3 | 23,874.4 | 418.859 |
| 4f5d d(G)D | 1.5 | 116,918.7 | 4f F1 | 2.5 | 93,368.7 | 23,550.0 | 424.628 | |
| 4f5d d(G)H | 3.5 | 117,197.3 | 4f F1 | 2.5 | 93,368.7 | 23,828.6 | 419.664 | |
| 454.5 | n/a | |||||||
| 482.4 | 4f5d d(I)L | 5.5 | 91,148.2 | 4f G2 | 4.5 | 70,623.3 | 20,524.9 | 487.213 |
| 484.2 | 4f5d d(I)L | 5.5 | 91,148.2 | 4f G2 | 4.5 | 70,623.3 | 20,524.9 | 487.213 |
| 490.6 | 4f5d d(I)L | 5.5 | 91,148.2 | 4f G2 | 4.5 | 70,623.3 | 20,524.9 | 487.213 |
| 4f5d d(P)F2 | 2.5 | 113,690.4 | 4f F1 | 2.5 | 93,368.7 | 20,321.7 | 492.085 |
Disclaimer/Publisher’s Note: The statements, opinions and data contained in all publications are solely those of the individual author(s) and contributor(s) and not of MDPI and/or the editor(s). MDPI and/or the editor(s) disclaim responsibility for any injury to people or property resulting from any ideas, methods, instructions or products referred to in the content. |
© 2023 by the authors. Licensee MDPI, Basel, Switzerland. This article is an open access article distributed under the terms and conditions of the Creative Commons Attribution (CC BY) license (https://creativecommons.org/licenses/by/4.0/).
Share and Cite
Nishimura, Y.; Imaizumi, S.; Tanuma, H.; Nakamura, N.; Sekiguchi, Y.; Wanajo, S.; Sakaue, H.A.; Kato, D.; Murakami, I.; Tanaka, M.; et al. Charge Exchange Spectroscopy of Multiply Charged Erbium Ions. Atoms 2023, 11, 40. https://doi.org/10.3390/atoms11020040
Nishimura Y, Imaizumi S, Tanuma H, Nakamura N, Sekiguchi Y, Wanajo S, Sakaue HA, Kato D, Murakami I, Tanaka M, et al. Charge Exchange Spectroscopy of Multiply Charged Erbium Ions. Atoms. 2023; 11(2):40. https://doi.org/10.3390/atoms11020040
Chicago/Turabian StyleNishimura, Yuki, Saki Imaizumi, Hajime Tanuma, Nobuyuki Nakamura, Yuichiro Sekiguchi, Shinya Wanajo, Hiroyuki A. Sakaue, Daiji Kato, Izumi Murakami, Masaomi Tanaka, and et al. 2023. "Charge Exchange Spectroscopy of Multiply Charged Erbium Ions" Atoms 11, no. 2: 40. https://doi.org/10.3390/atoms11020040