Article

Analytical and Statistical Modelling of a Fast Ion Source Formed by Injection of a Neutral Beam into Magnetically Confined Plasma

Advanced Plasma Research Laboratory, Peter the Great St. Petersburg Polytechnic University, Saint Petersburg 195251, Russia
Atoms 2023, 11(2), 24; https://doi.org/10.3390/atoms11020024
Submission received: 30 December 2022 / Revised: 20 January 2023 / Accepted: 23 January 2023 / Published: 30 January 2023
(This article belongs to the Special Issue Neutral Atoms in Controlled Fusion and Space Plasmas)

Abstract

:
Mathematical modelling of heating and current drive as well as yields and distributions of fusion products in a magnetically confined plasma subject to neutral beam injection requires, in turn, modelling of distributions of fast ions, which is a complex task including calculations of the source of suprathermal particles, i.e., the number of fast ions occurring in unit volume during unit time owing to the injection of fast atoms. The knowledge of the magnetohydrodynamic equilibrium, beam injection geometry and spatial distribution of the magnetic field are the necessary prerequisites. Explicit general analytical formulae for the source of fast ions have been obtained by two different methods. In addition, a method of statistical modelling is presented. Calculations of spatial and angular distributions of the fast ion source for a tokamak and verifications of the obtained results have been performed by a number of methods.

1. Introduction

At an early stage of controlled nuclear fusion research in review paper [1] L.A. Artsimovich mentioned the injection of beams of fast neutral particles into plasma as one of the natural ways of achieving the required level of ion temperatures and predicted that, although little or nothing had then been done to develop this method, probably it would own the future, taking an important place in the overall research programme. In [2], T. Ohkawa suggested the use of beams of neutral atoms as a method of driving the plasma current.
Today neutral beam injection (NBI) is an established method of heating and non-inductive generation of an electric current in many experimental fusion devices with magnetic confinement of plasma [3]. ITER will be equipped with the most powerful neutral beam injectors ever, capable of delivering higher energy beams for longer than any previous systems [4]. Prototypes of neutral beam injectors [5,6] are being developed for the Tokamak with Reactor Technologies (TRT) [7]. NBI is also being considered for demonstrative fusion power plant concepts (DEMO) [8].
In the works on the development of fusion neutron sources and fusion-fission hybrid systems NBI is considered as the main source of high-energy particles generating primary neutrons [9,10]. Calculations of spatial, angular, and energetic distributions of the neutron source in a plasma and the subsequent modelling of neutron transport processes first require distributions of velocities of plasma ions to be obtained, which in turn require calculations of the penetration of fast neutral beams into plasma.
Calculations of the penetration and deposition of neutral beams for large tokamaks such as TFTR [11,12], EAST [13,14], KSTAR [15], and JET [16] were made on the basis of [17,18]. Simulations of the neutral beam injection in ITER were reported in [19]. NBI-induced effects in plasma of a compact fusion neutron source were studied in [20]. Applications of NBI modelling for stellarator/heliotron devices, such as LHD [21] and W7-X [22], were based on the works [23] and [24] correspondingly.
The above-mentioned bibliographic sources are mostly relying on basic descriptions of different sorts of simulation techniques predominantly related to various Monte Carlo methods, rather than explicit general analytical closed-form expressions for the source function of fast ions produced in a magnetically confined plasma due to neutral beam injection. The treatments in [25,26] include a larger mathematical background. A compact overview of commonly adopted approaches to describe the penetration of neutral beams into fusion plasmas is given in [27]. Among newer works dedicated to the modelling of neutral beam injection, articles [28,29,30] can be referenced. As stated in [25,27,31], if the confinement of fast ions is sufficiently good, an ion originating from NBI can be assumed to stay on its magnetic surface. The same assumption is adopted herein. Deviations from such a basic model, i.e., corrections for drift orbits, are beyond the scope of this study and may be introduced on top of the present results.
The purpose of this article is to present rigorous general derivations of the source function by two different methods, providing a cross check, in addition to statistical modelling. The approach presented here is based on explicit analytical formulae, which are reproducible and exact in the frame of the adopted physics model. This approach is preferable from the viewpoint of the development of the physics basis as well as the reliability and the computational speed of the integrated systems codes where the complexity necessitates optimisation.
Two alternative derivations of the analytical formulae are given in Section 2. Statistical modelling based on kernel smoothing is described in Section 3. Examples of calculations of spatial and angular distributions of the source of fast ions originating from neutral beam injection into a tokamak are shown in Section 4, followed by conclusions in Section 5.

2. Analytical Approach

Two methods are given in this section to derive an analytical formula for the local source of suprathermal ions supplied by a monoenergetic beam of fast neutral atoms injected into a magnetically confined fusion plasma. The local source S [cm−3s−1] is the number of ions, occurring in unit volume during unit time, expressed as a function of coordinates. A phenomenological derivation method and a more formal mathematical method lead to the same result, thus providing a validating cross check.

2.1. Phenomenological Derivation

First, let us consider a mathematical line instead of a finite width beam. Figure 1 shows such a line and a cross-section of nested magnetic surfaces in a device for the magnetic confinement of plasma. It is assumed that once an injected H0 (or D0, or T0) atom loses its electron and becomes an ion, it remains at the same magnetic surface, i.e., that the source S ( ρ ) is a function of the dimensionless magnetic flux surface label ρ , which is a generalisation of radius. This can be e.g., the normalised poloidal radius defined as
ρ = Ψ Ψ a Ψ b Ψ a ,
where Ψ is the local value of the poloidal magnetic flux function, Ψ a is its value at the magnetic axis, where ρ = 0 , and Ψ b is its value at the boundary, where ρ = 1 . Let us denote the length along the injection line as Λ . The line is crossing the last closed flux surface ρ = 1 at Λ = Λ e n , where it is entering the plasma and at Λ = Λ e x , where it is exiting the plasma. Let us denote the neutral particle current carried by this injection line as I [s−1].
The probability that an atom entering the plasma at Λ e n penetrates to a position Λ is given by the Poisson exponent
P ( Λ ) = e Λ e n Λ d l λ m f p ,
where λ m f p is the mean free path of an atom with respect to electron loss, so the integral Λ e n Λ d l λ m f p is the average number of electron loss events along the path from Λ e n to Λ . This means that the injected neutral particle density along the line n b ( Λ ) decreases exponentially as
n b ( Λ ) = n b ( Λ e n ) e Λ e n Λ d l λ m f p ,
where n b ( Λ e n ) is the initial density at the entrance to the plasma. The electron loss frequency ν [s−1] is
ν = v b λ m f p ,
where v b is the injection velocity. By electron loss throughout this article all the electric charge changing processes of the type H 0 H + are meant, including charge exchange, impact ionisation, etc.
The above considerations lead to the following qualitatively derived source function of fast ions in the plasma at the position Λ along the fast atom injection line
S ( Λ ) = ν n b ( Λ ) = n b ( Λ e n ) v b λ m f p e Λ e n Λ d l λ m f p .
However, this qualitative derivation above is not yet properly taking into account the geometry. The desired quantity is the source of fast ions at a given magnetic surface. As Figure 2 illustrates, a given increment of the effective radius d ρ may correspond to different increments d Λ of the length along the injection line, depending on the injection direction.
Let us attribute a cross-section area d S to the injection line, considering it as a narrow infinitesimal beam, as shown in Figure 3. Then d S d Λ is the volume of the cylinder between the magnetic surfaces ρ and ρ + d ρ .
The number of atoms undergoing electron loss collisions in the depicted volume d S d Λ at the position Λ per second is the product of this volume d S d Λ and the number of electron loss events per unit volume during unit time S ( Λ ) , given by (5). Assuming that all the resulting fast ions are staying at the corresponding magnetic surface ρ , we need to divide the mentioned quantity, i.e., the number of atoms undergoing electron loss collisions per second, by the corresponding volume d V enclosed between the magnetic surfaces ρ and ρ + d ρ . This will be the desired source function S ( ρ ) per unit volume during unit time. Using (5) we have
S ( ρ ) = I e Λ e n Λ d l λ m f p l λ m f p Λ d Λ d ρ d V d ρ ,
because the initial injection current at the entrance equals
I = n b Λ e n v b d S .
Such is the phenomenological derivation of the analytic formula for the fast ion source function. Since Λ ( ρ ) is a multivalued function, the final formula needs to contain the sum over all branches of this function. An example is depicted in Figure 4a showing an injection line crossing the magnetic surfaces, and in Figure 4b showing the variation of the effective radius versus the distance along this injection line. The value ρ * designates some particular magnetic surface. There are four branches with alternating monotonicity in this example. These branches are shown by different colours. This illustrates that different values of Λ may contribute to the source function S ( ρ ) at the same magnetic surface ρ .
Therefore, the formula becomes
S ( ρ ) = k I λ m f p Λ k e Λ e n Λ k d l λ m f p l d Λ d ρ Λ k d V d ρ Λ k .
The argument Λ k is the spatial location. This is the value of Λ corresponding to the given ρ at the k-th branch. The value d V d ρ does not depend on the branch index k. The mean free path of a fast hydrogen atom in a fusion plasma in accordance with the models [32,33] is
λ m f p = 1 n e σ s ,
where n e is the electron density and σ s is the effective stopping cross-section depending on the electron temperature T e , the electron density n e , and impurity densities. The value σ s is determined by parameterisations given in [32,33]. The mean free path λ m f p given by (9) is also a function of the magnetic surface, i.e., does not depend on the branch index k in (8). Taking λ m f p and d V d ρ out of the summation over the branches we obtain
S ( ρ ) = I λ m f p ρ d V d ρ ρ k d Λ d ρ k e Λ e n Λ k d l λ m f p l .
Such is the source function of fast ions in the plasma due to the injection of fast atoms along a mathematical line representing a narrow beam.

2.2. Mathematical Derivation

A formula identical to (10) can be obtained formally using the language of mathematical statistics as follows. The probability for an atom to undergo no electron loss collisions along the path inside the plasma from Λ e n to the point Λ on the injection line is given by (2). The value Λ , where the electron loss takes place, is a random number. The cumulative distribution function for Λ is then
F ( Λ ) = 1 P ( Λ ) ,
which is the probability that the electron loss does occur somewhere along the path inside the plasma from Λ e n to the point Λ , i.e., that the atom does not penetrate as deep as to the point Λ . For the probability density function (p.d.f.) for Λ , using (2), we therefore have
f ( Λ ) = d F d Λ = 1 λ m f p e Λ e n Λ d l λ m f p l .
The probability that the electron loss occurs between Λ and Λ + d Λ is
d P = f ( Λ ) d Λ .
Let d 𝒫 be the probability that the electron loss occurs between ρ and ρ + d ρ . To calculate d 𝒫 we need the summation over all Λ k values corresponding to the given ρ value, i.e., over all branches of the function Λ ( ρ ) , thus
d 𝒫 = k f Λ k d Λ k d ρ d ρ = 1 λ m f p ρ k d Λ k d ρ e Λ e n Λ k d l λ m f p l d ρ .
This means that the probability density f ρ for the ρ coordinate of the electron loss location is
f ρ = 1 λ m f p ρ k d Λ d ρ k e Λ e n Λ k d l λ m f p l .
The source function of fast ions at the magnetic surface ρ is
S ρ = I d 𝒫 ρ d V ρ ,
where I [s−1] is the ‘input’ neutral current attributed to the injection line under consideration, d V ρ is the volume where the ions reside, occurring due to the electron loss by the injected atoms, d 𝒫 ρ is the probability that the electron loss occurs particularly at the given ρ value. Using (14), (15) and (16) we arrive at the source function
S ρ = I d V / d ρ f ρ = I λ m f p ρ d V d ρ ρ k d Λ d ρ k e Λ e n Λ k d l λ m f p l ,
which coincides with (10), i.e., the formal result is the same as the phenomenologically derived expression.

3. Statistical Approach

An alternative way to calculate f ρ instead of Formula (15) is to use the so-called kernel probability density function (p.d.f.) estimator
f ρ 1 N h i = 1 N K ρ ρ i h ,
where K is called a kernel function, h is an arbitrary positive number called the kernel bandwidth, and N is the number of random values of the electron loss locations ρ i . The selection of an optimum bandwidth and an optimum kernel function is a separate subject in mathematical statistics. With I ( 1 , 1 ) z being equal to unity inside the 1 , 1 interval and equal to nought outside, kernel functions typically in use include the rectangular window function
K ( z ) = 1 2 I ( 1 , 1 ) z ,
Gaussian kernel
K ( z ) = 1 2 π e z 2 / 2 ,
Epanechnikov kernel
K ( z ) = 3 4 1 z 2 I ( 1 , 1 ) z ,
and others.
The algorithm to calculate f ρ via the kernel p.d.f. estimator (18) is as follows. First of all, N uniformly distributed random numbers u i in the 0 , 1 interval need to be generated, where i 1 , N ¯ . Each u i will represent the value of the probability (2) for an atom to reach the location Λ i along the injection line in plasma in accordance with
u i = e Λ e n Λ i d l λ m f p l .
Next, the corresponding Λ i values need to be calculated from (22) for each of the N numbers u i . The knowledge of the local mean free path λ m f p of an atom in the plasma is required, as a function of the kinetic energy of the atom and the plasma parameters depending on the spatial coordinates. After that, the obtained values Λ i of the length along the injection line need to be recalculated into the corresponding values of the effective radius ρ i where the electron loss occurs. For this, the equation of the injection line is needed and the transformation of the coordinates in configuration space (Cartesian of cylindrical) to flux coordinates using the magnetohydrodynamic equilibrium data determining the geometry of magnetic surfaces. Finally, the obtained ρ i values need to be substituted to (18).
Calculations show that both the statistical approach (18) and the analytical Formula (15) for the probability density f ρ for the ρ coordinate of the electron loss location lead to the same source function S ( ρ ) .

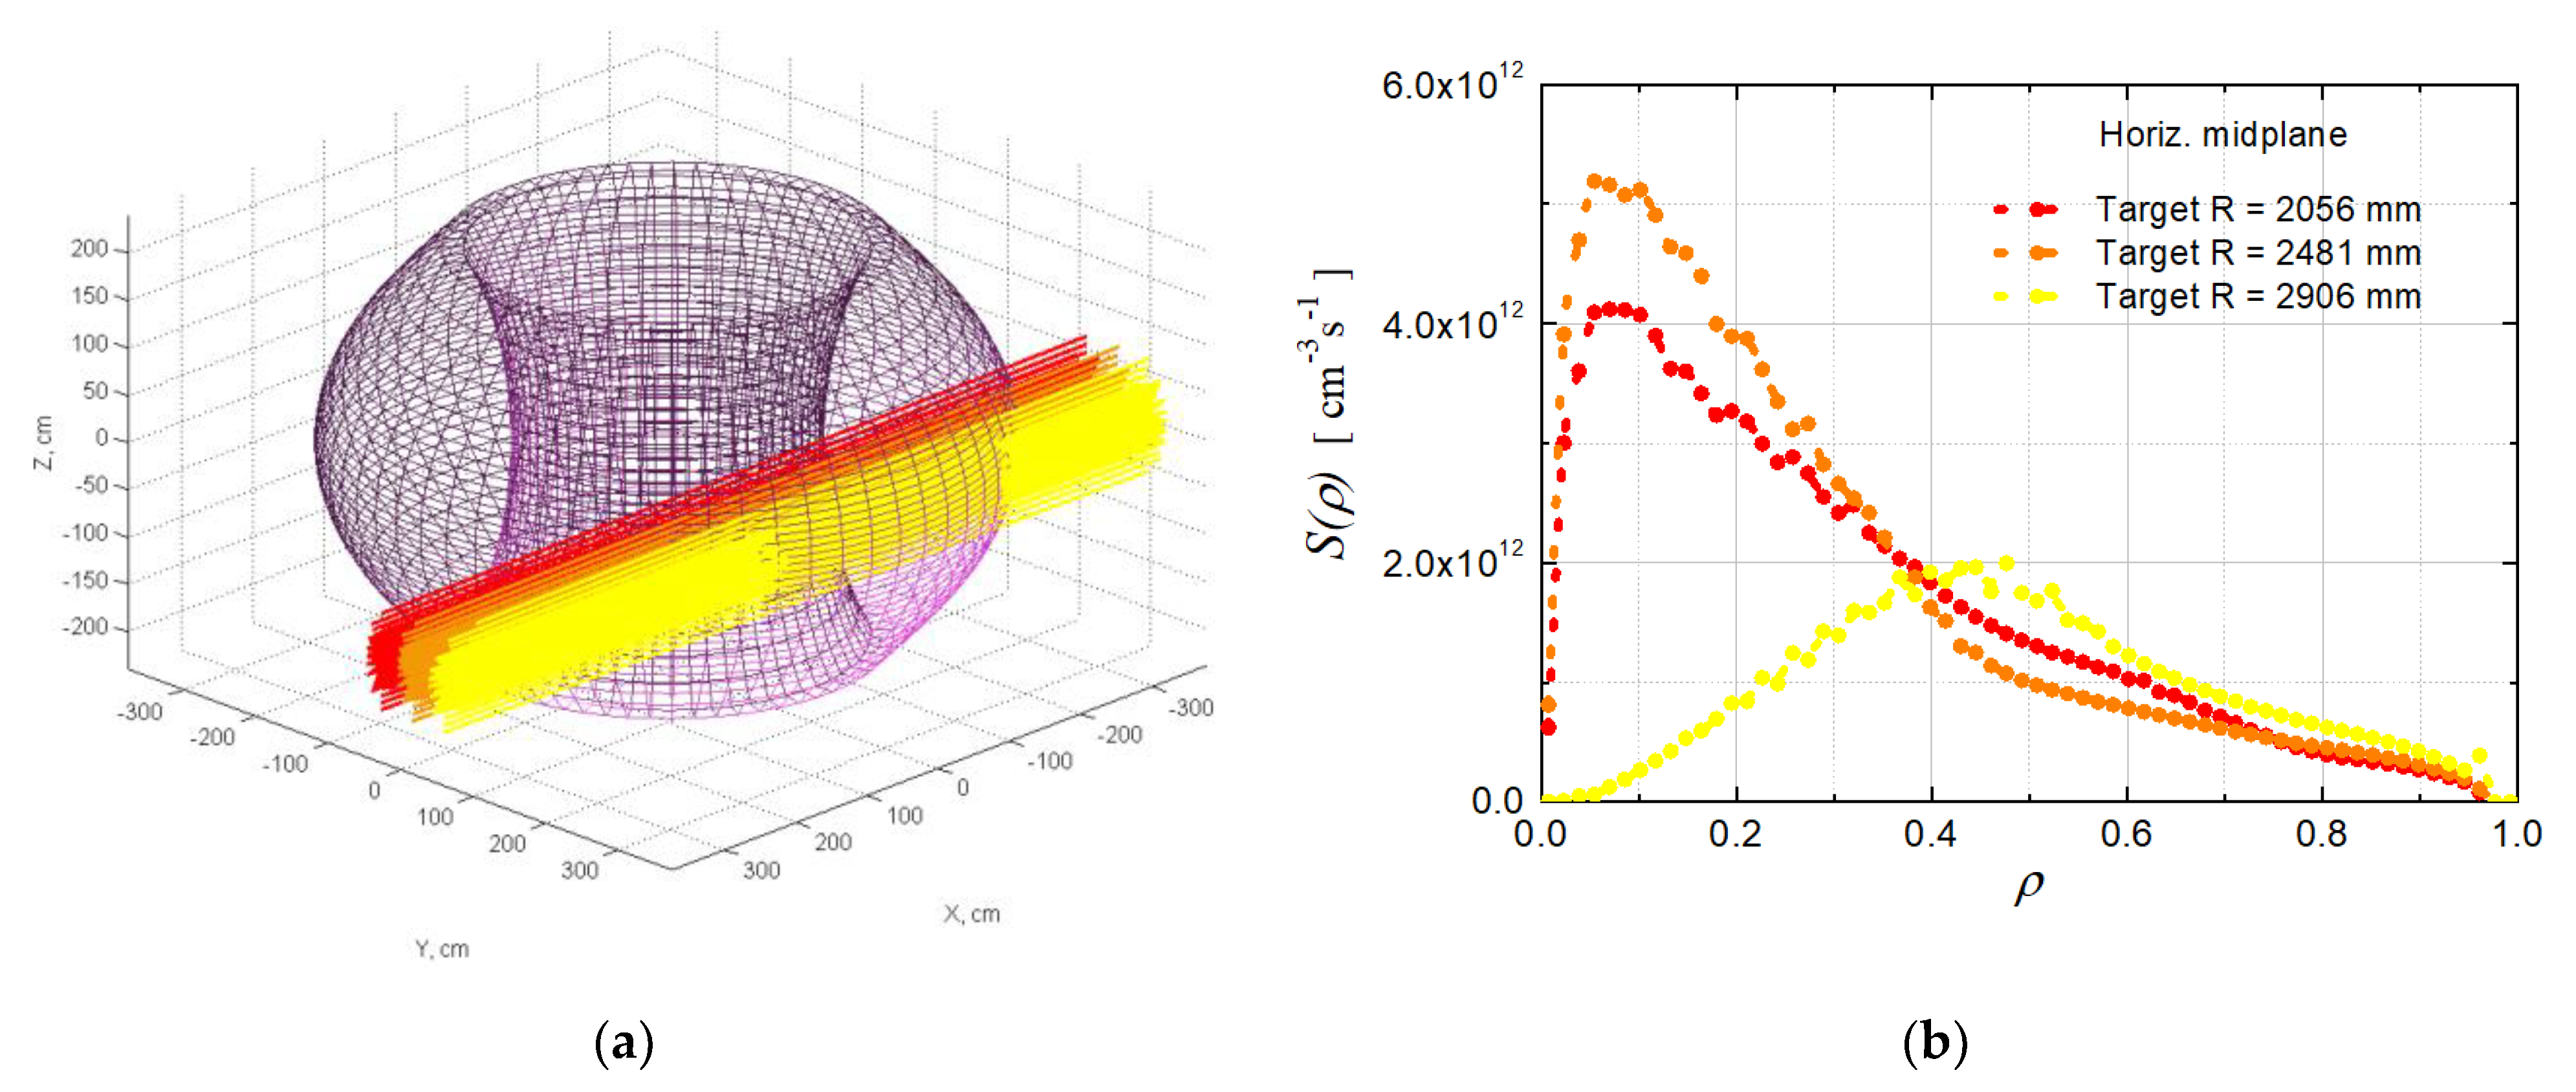
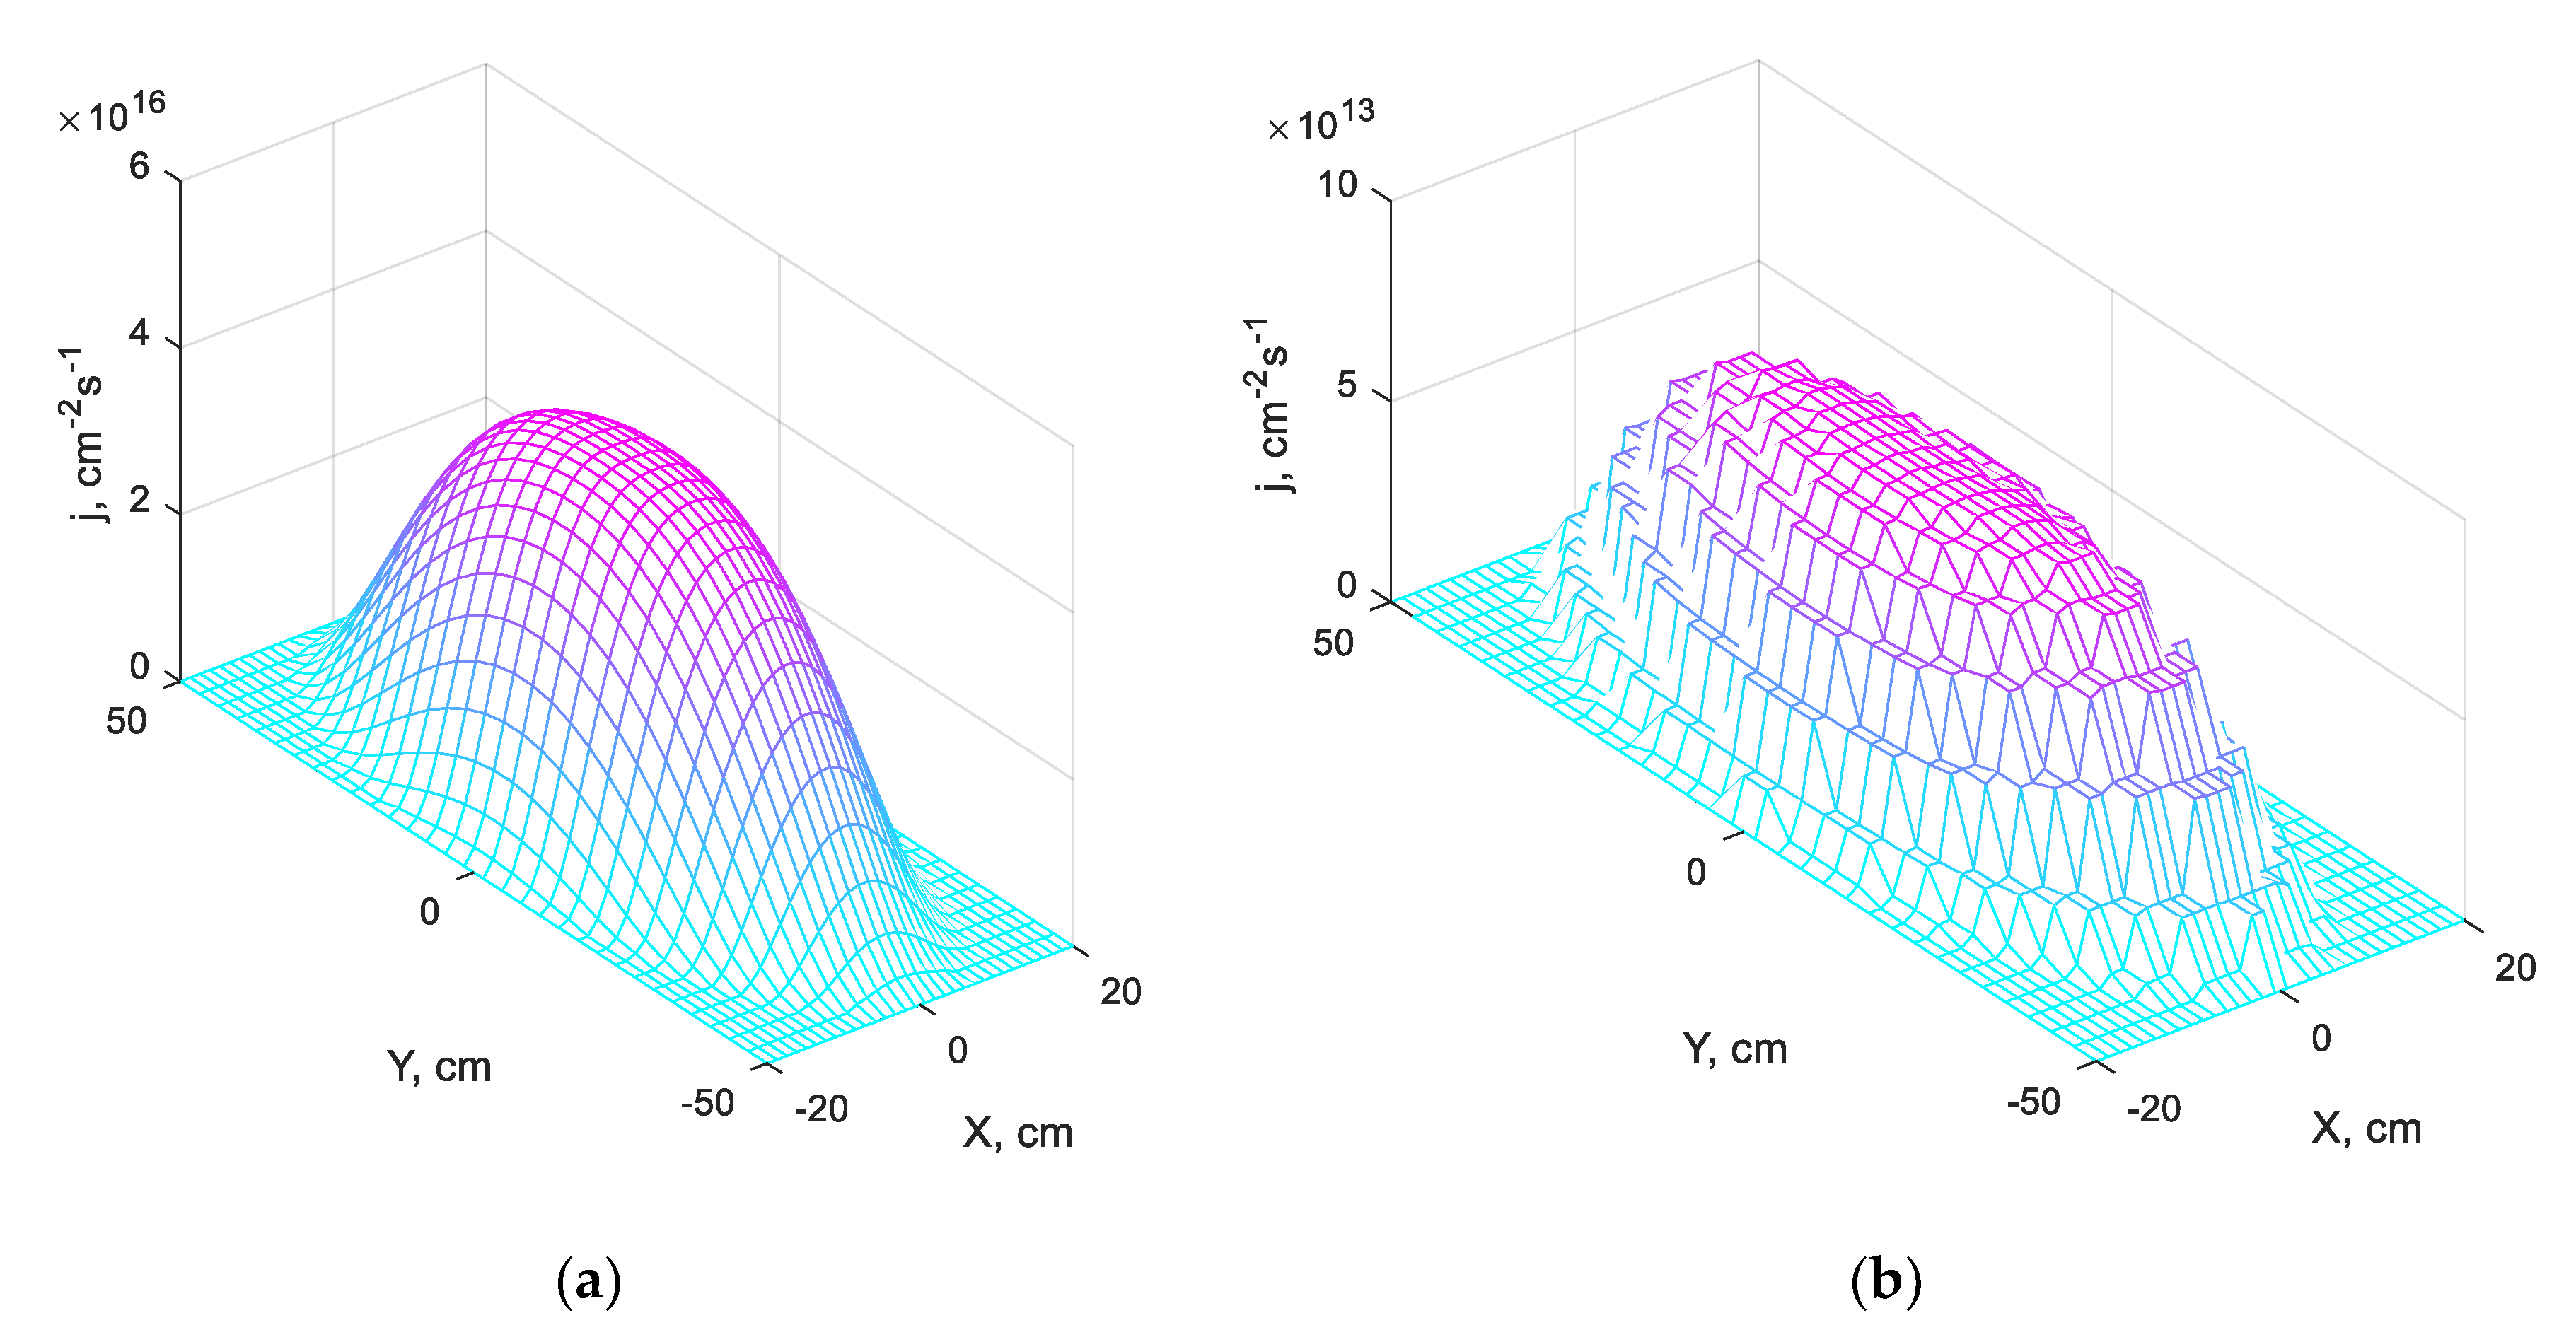
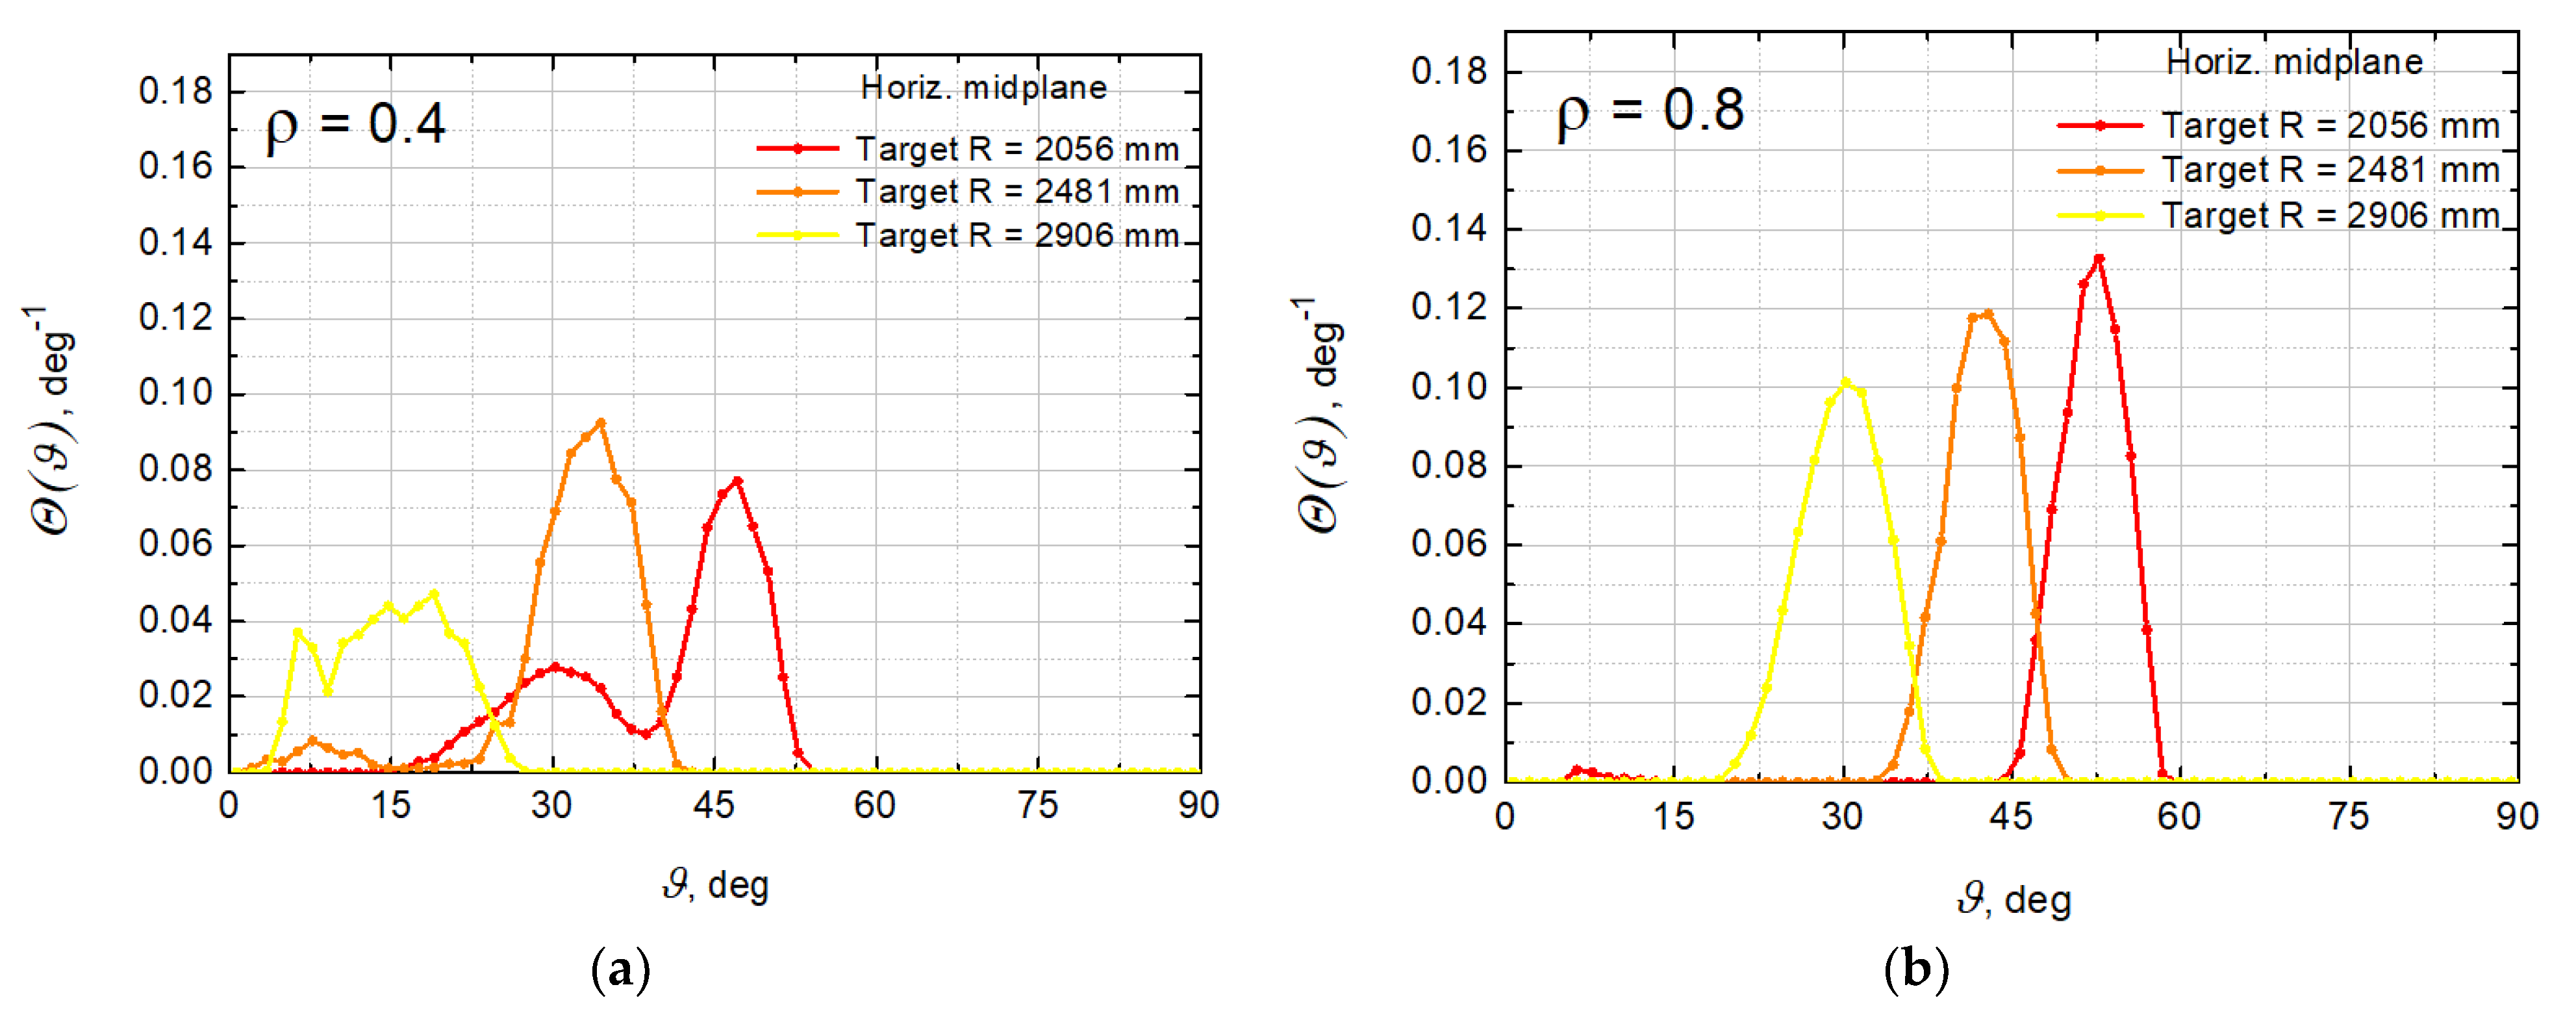
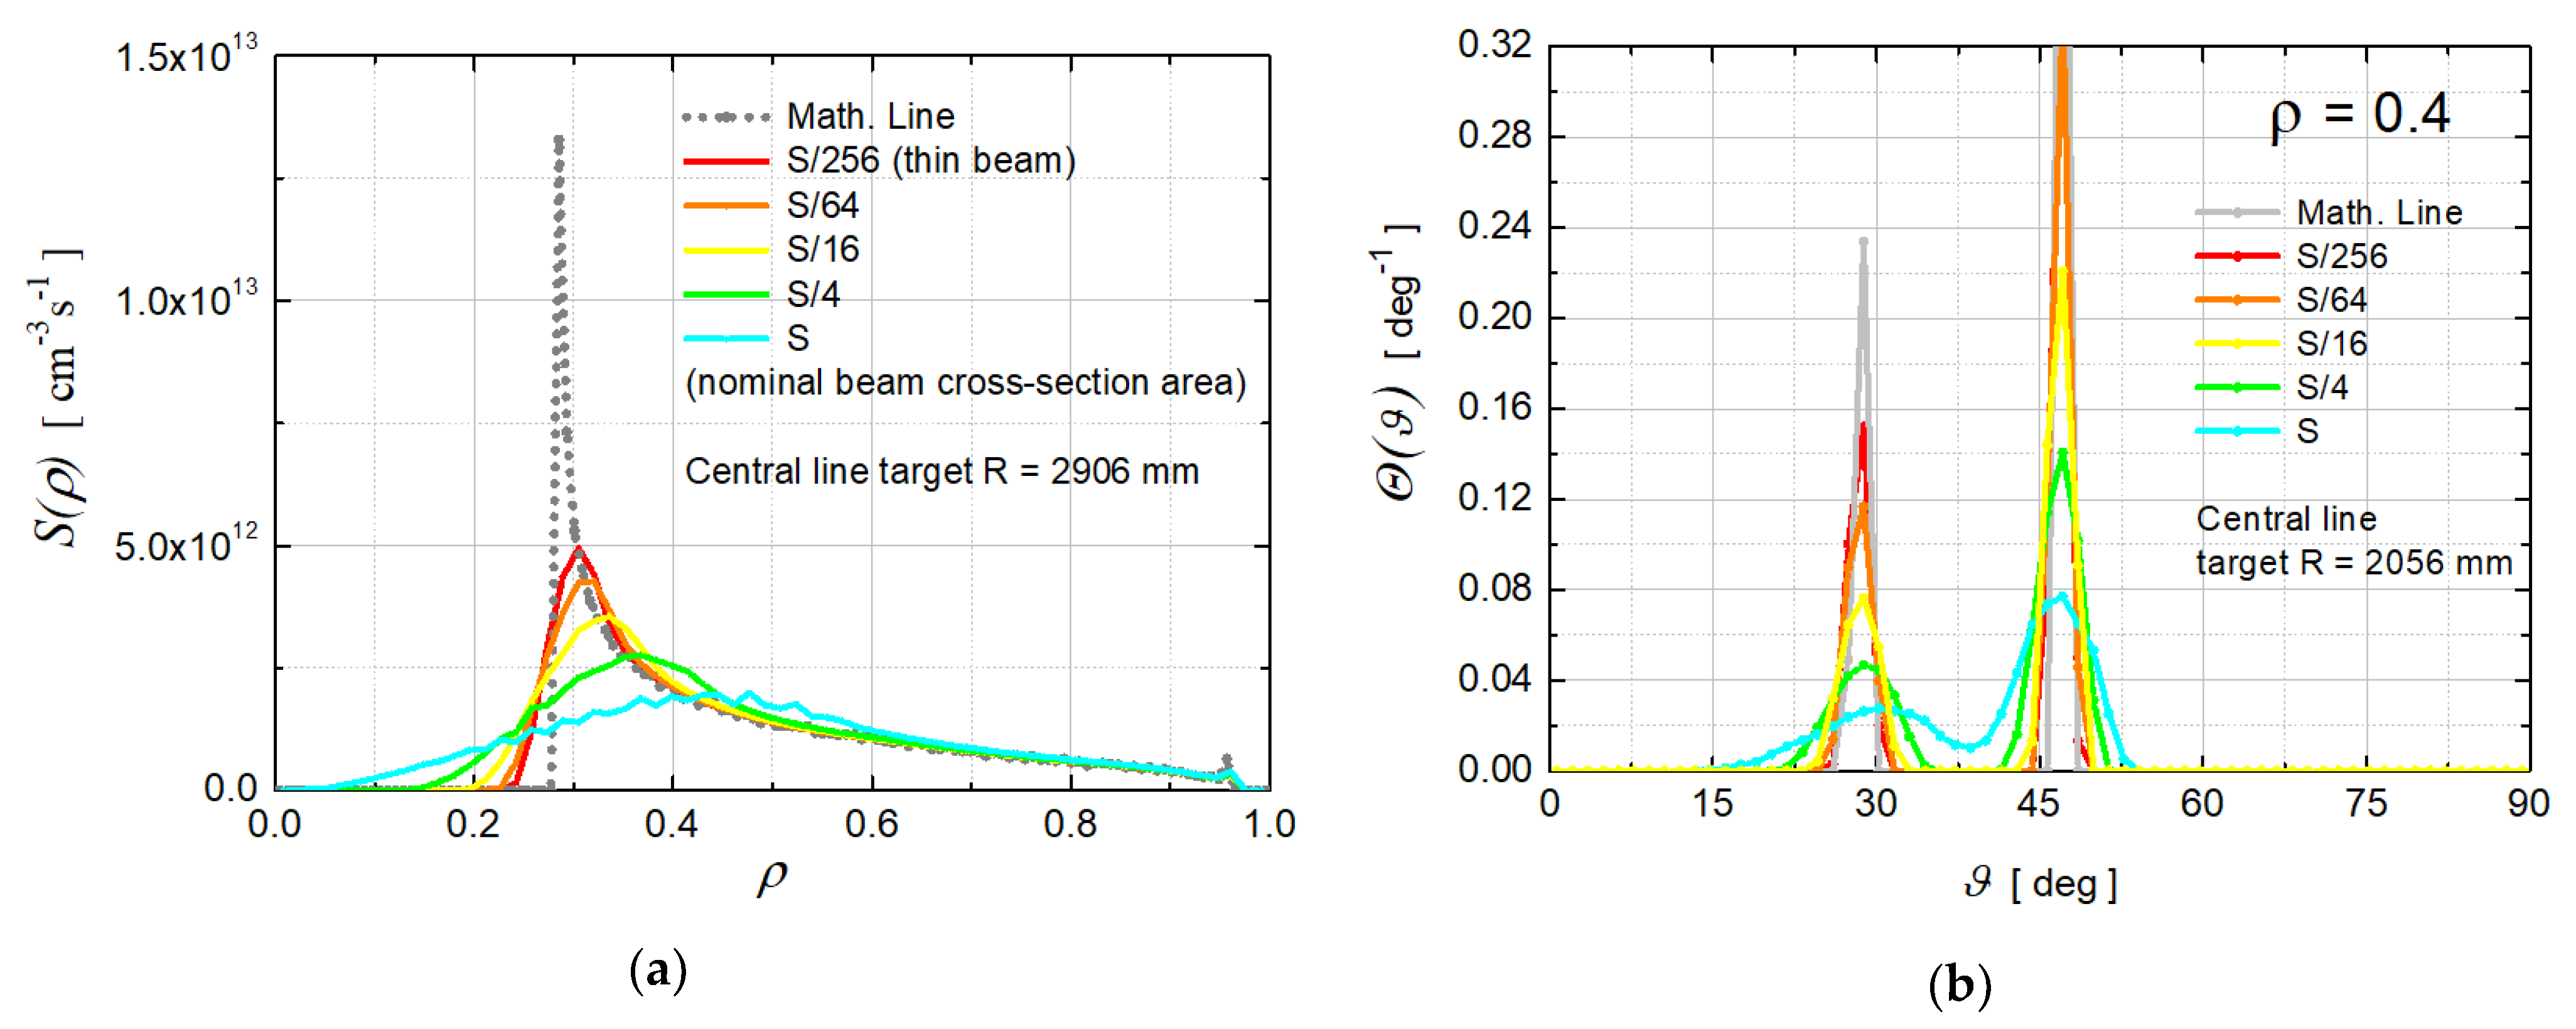
4. Calculations of Spatial and Angular Distributions of the Fast Ion Source

The initial angle between the fast ion velocity and the magnetic field, i.e., the angle between the injection line and the magnetic field at the spatial point where the fast neutral beam atom undergoes the electron loss, is obviously not constant along the injection line. The source of fast ions has a certain angular distribution. This section illustrates the approach to calculate this distribution.
In addition, the source function S ( ρ ) considered in Section 2 was obtained for the injection along a mathematical line, which is an abstraction, necessary as a building block for the modelling of realistic beams. This section also describes the approach to calculate the source of fast ions in the plasma for the case of a finite width of a neutral beam.
Figure 5a shows the poloidal cross-section of magnetic surfaces, i.e., the nested isolines of the normalised poloidal radius calculated on the basis of magnetohydrodynamic equilibrium data for the DEMO-FNS project [34] for a candidate operating regime used herein as a sample case. Either analytical equilibria such as the Soloviev solution [35] of the Grad–Shafranov equation or numerical magnetohydrodynamic codes such as [36] can be employed. The values R a x and Z a x in Figure 5a refer to the magnetic axis position, a h is the horizontal minor radius, the values ε ( 1 ) , τ ( 1 ) , and Δ ( 1 ) correspond to the elongation, triangularity and the Shfranov shift calculated for the last closed flux surface (LCFS), V ( 1 ) denotes the volume enclosed by the LCFS, and S ( 1 ) is the LCFS area. The functions of the volume enclosed by magnetic surfaces and its derivative, with respect to the normalised poloidal radius, are shown in Figure 5b versus the normalised poloidal radius defined by (1).
Details of the implementation of the analytical geometry to calculate coordinates along injection lines and the transformation between cylindrical coordinates ( R , Z , φ ) and flux coordinates ( ρ , ϑ , φ ) are not discussed here since these both are rather common techniques. Suffice it to mention that the volume enclosed by the magnetic surface labeled ρ is given by
V ( ρ ) = 0 ρ 0 2 π 0 2 π R ( ρ ˜ , ϑ , φ ) J d ρ ˜ d ϑ d φ ,
the azimuthal (toroidal) angle φ 0 , 2 π preserves when azimuthally symmetric magnetic surfaces are assumed for tokamaks, and the Jacobian determinant is
J = R ρ R ϑ 0 Z ρ Z ϑ 0 0 0 1 .
Jacobian determinant (24) calculated using the DEMO-FNS magnetohydrodynamic equilibrium data is depicted in Figure 6 as a surface plot versus the normalised poloidal radius ρ and the poloidal angle ϑ to illustrate a typical example of the qualitative behaviour for a tokamak equilibrium where the volume derivative is
d V d ρ = 2 π 0 2 π R ( ρ , ϑ , φ ) J d ϑ .
The coordinate transformation procedure is involved in such calculations.
A 3D mesh in Figure 7a illustrates the last closed flux surface corresponding to the normalised poloidal radius ρ = 1 . The three lines in Figure 7a show three different injection directions corresponding to three different values of tangency radius. The values of the effective radius (dashed lines) and the angle (solid lines) between the injection line and the magnetic field vector are shown in Figure 7b for each of the injection lines by the corresponding colours. The radial profiles of the plasma parameters used in calculations are shown in Figure 8. The profiles were fixed, and no self-consistent iterative procedures were involved herein to simulate the effect of neutral beam injection on the plasma parameters. The specified impurity densities represent a sample model example used for illustrative purposes. In practice either numerical modelling, or experimental data are required.
Actual neutral beams of a finite width are approximated by a large number of mathematical lines, i.e., infinitesimal beams. Injection geometry and beam divergence are taken into account. A certain neutral current is attributed to each of the injection lines in accordance with the beam current density distribution in the beam cross-section plane. Figure 9a shows such approximations of beams with cross-section areas comparable with the poloidal cross-section area of the plasma column. Three beams are shown, each of which is approximated by a large number of mathematical lines. The central lines of the beams are the lines shown in Figure 7a by the corresponding colours.
The resultant source function of fast ions in the plasma is calculated for a neutral beam of a finite width as the sum of the source functions obtained as described in Section 2 for each of the mathematical lines all together approximating the beam. An example of such a calculation is shown in Figure 9b for three neutral beams shown in Figure 9a assuming the magnetohydrodynamic equilibrium depicted in Figure 5 and Figure 6.
The distribution of the source of fast ions in the plasma noticeably depends on the beam injection geometry. Different colours in Figure 9b correspond to different tangency radii of the beam central lines. Mathematical modelling of the interaction of fast ions with the background plasma is described in [37] and references therein.
The initial beam current density distribution in the beam cross-section plane is shown in Figure 10a, and the residual beam current density distribution where the “remainder” of the beam “exits” the plasma is shown in Figure 10b. This is the so-called shine-through which is rather small in this example being three orders of magnitude weaker than the initial beam current density. For a more peripheral injection, i.e., for the beam with tangency radius R = 2906 mm shown by the yellow colour in Figure 9a, the shine-through current density is greater reaching several per cent of the initial current density.
The angular distribution of the source function at each magnetic surface is calculated as a histogram of the values of the angle between the injection line and the magnetic field at the point where the beam atom undergoes the electron loss. Figure 11a,b show the obtained angular distributions at ρ = 0.4 and at ρ = 0.8 respectively. Angular distributions of the source of fast ions in the plasma noticeably depend on the beam injection geometry as well.
Figure 12 shows verifications of the spatial and angular distributions of the source of fast ions in the plasma due to neutral beam injection. The lowermost curves are those obtained for finite width beams with nominal cross-section areas. The other coloured curves were calculated for narrower beams with smaller and smaller cross-section areas. Figure 12a shows that as the beam cross-section is decreasing, the source function is approaching the radial distribution, shown by the grey colour, obtained for a mathematical line corresponding to the central line of the beam. Similarly, Figure 12b shows that as the beam cross-section is decreasing, the angular distribution is approaching the curve, shown by the grey colour, obtained for a mathematical line corresponding to the central line of the beam, as it ought to be.
It should be noted that although an azimuthally symmetric sample case is illustrated for simplicity, the presented general formalism for the fast ion source due to neutral beam injection is certainly applicable equally well for stellarator/heliotron devices, however the treatment of the equilibrium and coordinates will be different, e.g., based on [38].

5. Conclusions

Explicit general analytical formulae have been obtained for the source of fast ions originating from the injection of fast neutral beams into magnetically confined fusion plasma. Two derivation methods for the analytical formulae have been demonstrated. Both the phenomenological and the formal mathematical approach lead to identical results, which fact is one of successfully performed verifications of the obtained results. In addition, an alternative method has been described for calculations of the source of fast ions in a beam heated plasma. This method is based on mathematical statistics and the use of kernel estimation of the probability density, also called kernel smoothing. For this approach related to statistical modelling, an explicit mathematical formulation is given as well. This method of statistical modelling of the penetration of neutral beams into plasma produces the same results as calculations by the analytical formulae, which is an additional verification.
The obtained results have been applied to a sample case input data corresponding to a candidate operating regime of a classical tokamak DEMO-FNS [34]. Spatial and angular distributions of the source of fast ions in plasma subject to neutral beam injection have been obtained. As an extra verification, a number of test calculations have been performed with a gradual decrease in the cross-section area of the injected beam. As it ought to be, in this case the results approach the distributions calculated independently for the simple limiting case of a mathematical line.
The use of a rigorous analytical approach is beneficial for the development of the physics basis of controlled fusion and the reliability, reproducibility, and operation speed of integrated numerical codes.

Funding

This work was funded by the Ministry of science and higher education of the Russian Federation in the framework of the state contract in the field of science under project No. 0784-2020-0020.

Informed Consent Statement

Not applicable.

Data Availability Statement

Not applicable.

Acknowledgments

This work was partially supported in the framework of the IAEA Coordinated Research Project under contract No. 22765. The results were obtained using computational resources of Peter the Great Saint Petersburg Polytechnic University’s Supercomputing Center (scc.spbstu.ru) and the resources of the Federal Joint Research Center “Material science and characterization in advanced technology” of Ioffe Institute, including the unique scientific facility “Spherical tokamak Globus-M”.

Conflicts of Interest

The author declares no conflict of interest.

References

  1. Artsimovich, L.A. The prospects of investigations of the problem of controlled nuclear fusion. Sov. Phys. Uspekhi 1967, 10, 117–126. [Google Scholar] [CrossRef]
  2. Ohkawa, T. New methods of driving plasma current in fusion devices. Nucl. Fusion 1970, 10, 185–188. [Google Scholar] [CrossRef]
  3. Hopf, C.; Starnella, G.; Harder, N.D.; Fantz, U. Neutral beam injection for fusion reactors: Technological constraints versus functional requirements. Nucl. Fusion 2021, 61, 106032. [Google Scholar] [CrossRef]
  4. Hemsworth, R.S.; Boilson, D.; Blatchford, P.; Palma, M.D.; Chitarin, G.; de Esch, H.P.L.; Geli, F.; Dremel, M.; Graceffa, J.; Marcuzzi, D.; et al. Overview of the design of the ITER heating neutral beam injectors. New J. Phys. 2017, 19, 025005. [Google Scholar] [CrossRef]
  5. Belchenko, Y.I.; Burdakov, A.V.; Davydenko, V.I.; Gorbovskii, A.I.; Etmelev, I.S.; Ivanov, A.A.; Sanin, A.L.; Sotnikov, O.Z. Possible Scheme of Atomic Beam Injector for Plasma Heating and Current Drive at the TRT Tokamak. Plasma Phys. Rep. 2021, 47, 1151–1157. [Google Scholar] [CrossRef]
  6. Ivanov, A.A.; Abdrashitov, G.F.; Anashin, V.V.; Belchenko, Y.I.; Burdakov, A.V.; Davydenko, V.I.; Deichuli, P.P.; Dimov, G.I.; Dranichnikov, A.N.; Kapitonov, V.A.; et al. Development of a negative ion-based neutral beam injector in Novosibirsk. Rev. Sci. Instrum. 2014, 85, 02B102. [Google Scholar] [CrossRef]
  7. Krasilnikov, A.V.; Konovalov, S.V.; Bondarchuk, E.N.; Mazul’, I.V.; Rodin, I.Y.; Mineev, A.B.; Kuz’Min, E.G.; Kavin, A.A.; Karpov, D.A.; Leonov, V.M.; et al. Tokamak with Reactor Technologies (TRT): Concept, Missions, Key Distinctive Features and Expected Characteristics. Plasma Phys. Rep. 2021, 47, 1092–1106. [Google Scholar] [CrossRef]
  8. Sonato, P.; Agostinetti, P.; Bolzonella, T.; Cismondi, F.; Fantz, U.; Fassina, A.; Franke, T.; Furno, I.; Hopf, C.; Jenkins, I.; et al. Conceptual design of the DEMO neutral beam injectors: Main developments and R&D achievements. Nucl. Fusion 2017, 57, 056026. [Google Scholar] [CrossRef] [Green Version]
  9. Dlougach, E.; Shlenskii, M.; Kuteev, B. Neutral Beams for Neutron Generation in Fusion Neutron Sources. Atoms 2022, 10, 143. [Google Scholar] [CrossRef]
  10. Ananyev, S.S.; Dlougach, E.D.; Krylov, A.I.; Kuteev, B.V.; Panasenkov, A.A. Concept of Plasma Heating and Current Drive Neutral Beam System for Fusion Neutron Source DEMO-FNS. Phys. At. Nucl. 2019, 82, 981–990. [Google Scholar] [CrossRef]
  11. Park, H.K.; Barnes, C.; Budny, R.; McCune, D.; Taylor, G.; Zalrnstorff, M. Comparison of measured electron density rise and calculated neutral beam particle deposition in the TFTR tokamak. Nucl. Fusion 1992, 32, 1042. [Google Scholar] [CrossRef] [Green Version]
  12. Park, H.K.; Bell, M.; Tang, W.; Taylor, G.; Yamada, M.; Budny, R.; McCunet, D.; Wielalnd, R. Role of neutral-beam fuelling profile in energy confinement and neutron emission on TFTR. Nucl. Fusion 1994, 34, 1271. [Google Scholar] [CrossRef]
  13. Wu, B.; Wang, J.; Li, J.; Walng, J.; Hu, C. Neutral beam injection simulation of EAST. Fusion Eng. Des. 2011, 86, 947–950. [Google Scholar] [CrossRef]
  14. Ni, Q.; Fan, T.; Zhang, X.; Zhang, C.; Ren, Q.; Hu, C. Predictive Calculation of Neutral Beam Heating Plasmas in EAST Tokamak by NUBEAM Code for Certain Parameter Ranges. Plasma Sci. Technol. 2010, 12, 661–667. [Google Scholar] [CrossRef]
  15. Na, B.; Kang, J.; Lee, M.; Jung, L.; Hahn, S.; Yoo, J.; Jeong, J.; Ko, J.; Sung, C. Experimental and numerical evaluation of the neutral beam deposition profile in KSTAR. Fusion Eng. Des. 2022, 185, 113320. [Google Scholar] [CrossRef]
  16. Štancar, Ž.; Gorelenkova, M.; Conroy, S.; Sauvan, P.; Buchanan, J.; Weisen, H.; Snoj, L.; Contributors, J.E.T. Multiphysics approach to plasma neutron source modelling at the JET tokamak. Nucl. Fusion 2019, 59, 096020. [Google Scholar] [CrossRef]
  17. Goldston, R.J.; McCune, D.; Towner, H.; Davis, S.; Hawryluk, R.; Schmidt, G. New techniques for calculating heat and particle source rates due to neutral beam injection in axisymmetric tokamaks. J. Comput. Phys. 1981, 43, 61–78. [Google Scholar] [CrossRef]
  18. Pankin, A.; McCune, D.; Andre, R.; Bateman, G.; Kritz, A. The tokamak Monte Carlo fast ion module NUBEAM in the National Transport Code Collaboration library. Comput. Phys. Commun. 2004, 159, 157–184. [Google Scholar] [CrossRef]
  19. Aleynikov, P.B.; Dlougach, E.D. Monte Carlo Simulations of the Neutral Beam Injection in ITER. Prob. At. Sci. Technol. Ser. Thermonucl. Fusion 2012, 35, 31–44. [Google Scholar] [CrossRef]
  20. Dlougach, E.; Panasenkov, A.; Kuteev, B.; Serikov, A. Neutral Beam Coupling with Plasma in a Compact Fusion Neutron Source. Appl. Sci. 2022, 12, 8404. [Google Scholar] [CrossRef]
  21. Vincenzi, P.; Bolzonella, T.; Murakami, S.; Osakabe, M.; Seki, R.; Yokoyama, M. Upgrades and application of FIT3D NBI–plasma interaction code in view of LHD deuterium campaigns. Plasma Phys. Control. Fusion 2016, 58, 125008. [Google Scholar] [CrossRef] [Green Version]
  22. Lazerson, S.A.; Ford, O.P.; Nuehrenberg, C.; Äkäslompolo, S.J.; Poloskei, P.Z.; Machielsen, M.; McNeely, P.; Vano, L.; Rust, N.; Bozhenkov, S.A.; et al. Validation of the BEAMS3D neutral beam deposition model on Wendelstein 7-X. Nucl. Fusion 2020, 60, 076020. [Google Scholar] [CrossRef]
  23. Murakami, S.; Nakajima, N.; Okamoto, M. Finite β Effects on the ICRF and NBI Heating in the Large Helical Device. Fusion Sci. Technol. 1995, 27, 256–259. [Google Scholar] [CrossRef]
  24. McMillan, M.; Lazerson, S.A. BEAMS3D Neutral Beam Injection Model. Plasma Phys. Control. Fusion 2014, 56, 095019. [Google Scholar] [CrossRef]
  25. Otsuka, M.; Nagami, M.; Matsuda, T. Birth: A neutral beam deposition code for non-circular tokamak plasmas. J. Comput. Phys. 1983, 52, 219–236. [Google Scholar] [CrossRef]
  26. Feng, Y.; Wolle, B.; Hübner, K. New, simplified technique for calculating particle source rates due to neutral beam injection into tokamaks. Comput. Phys. Commun. 1995, 88, 161–172. [Google Scholar] [CrossRef]
  27. Koch, R. Fast Particle Heating. Fusion Sci. Technol. 2010, 57, 185–195. [Google Scholar] [CrossRef]
  28. Schneider, M.; Eriksson, L.-G.; Jenkins, I.; Artaud, J.; Basiuk, V.; Imbeaux, F.; Oikawa, T.; Contributors, J.-E.; Contributors, I.-T. Simulation of the neutral beam deposition within integrated tokamak modelling frameworks. Nucl. Fusion 2011, 51, 063019. [Google Scholar] [CrossRef]
  29. Asunta, O.; Govenius, J.; Budny, R.; Gorelenkova, M.; Tardini, G.; Kurki-Suonio, T.; Salmi, A.; Sipilä, S. Modelling neutral beams in fusion devices: Beamlet-based model for fast particle simulations. Comput. Phys. Commun. 2015, 188, 33–46. [Google Scholar] [CrossRef] [Green Version]
  30. Weiland, M.; Bilato, R.; Dux, R.; Geiger, B.; Lebschy, A.; Felici, F.; Fischer, R.; Rittich, D.; Van Zeeland, M.A. RABBIT: Real-time simulation of the NBI fast-ion distribution. Nucl. Fusion 2018, 58, 082032. [Google Scholar] [CrossRef]
  31. Dlougach, E.; Kuteev, B. Impact of Neutral Beam and Plasma Shaping on the Current Drive Efficiency and Fast Ion Losses in a Compact Tokamak FNS-ST. IEEE Trans. Plasma Sci. 2022, 50, 4047–4053. [Google Scholar] [CrossRef]
  32. Janev, R.K.; Boley, C.D.; Post, D.E. Penetration of energetic neutral beams into fusion plasmas. Nucl. Fusion 1989, 29, 2125–2140. [Google Scholar] [CrossRef]
  33. Suzuki, S.; Shirai, T.; Nemoto, M.; Tobita, K.; Kubo, H.; Sugie, T.; Sakasai, A.; Kusama, Y. Attenuation of high-energy neutral hydrogen beams in high-density plasmas. Plasma Phys. Control. Fusion 1998, 40, 2097–2111. [Google Scholar] [CrossRef]
  34. Kuteev, B.V.; Azizov, E.; Alexeev, P.; Ignatiev, V.; Subbotin, S.; Tsibulskiy, V. Development of DEMO-FNS tokamak for fusion and hybrid technologies. Nucl. Fusion 2015, 55, 073035. [Google Scholar] [CrossRef]
  35. Soloviev, L.S. Hydromagnetic stability of closed plasma configurations. In Reviews of Plasma Physics; Leontovich, M.A., Ed.; Consultants Bureau: New York, NY, USA, 1975; Volume 6, pp. 239–331. [Google Scholar]
  36. Khayrutdinov, R.R.; Lukash, V.E. Studies of plasma equilibrium and transport in a tokamak fusion device with the inverse-variable technique. J. Comput. Phys. 1993, 109, 193–201. [Google Scholar] [CrossRef]
  37. Goncharov, P.R.; Kuteev, B.; Ozaki, T.; Sudo, S. Analytical and semianalytical solutions to the kinetic equation with Coulomb collision term and a monoenergetic source function. Phys. Plasmas 2010, 17, 112313. [Google Scholar] [CrossRef]
  38. Lao, L.L.; Hirshman, S.P.; Wieland, R.M. Variational moment solutions to the Grad–Shafranov equation. Phys. Fluids 1981, 24, 1431–1441. [Google Scholar] [CrossRef]
Figure 1. Neutral particle injection line crossing an arbitrary system of convex closed curves representing a cross-section of nested magnetic surfaces.
Atoms 11 00024 g001
Figure 2. Two different injection directions and two different increments d Λ 1 and d Λ 2 of the distance along the injection line, both corresponding to the same increment of the effective radius d ρ .
Atoms 11 00024 g002
Figure 3. An elementary volume of a narrow infinitesimal beam between the magnetic surfaces labeled ρ and ρ + d ρ .
Atoms 11 00024 g003
Figure 4. (a) An example of an injection line crossing the magnetic surface ρ = ρ * four times; (b) Four branches of the function Λ ( ρ ) with alternating monotonicity shown by different colours corresponding to the colours of the segments of the injection line in (a).
Atoms 11 00024 g004
Figure 5. (a) Isolines of the effective radius in the poloidal plane; (b) Volume (left scale) enclosed by a magnetic surface versus the normalised poloidal radius and the derivative of the volume (right scale) calculated for a candidate regime of DEMO-FNS.
Atoms 11 00024 g005
Figure 6. Jacobian determinant (24) for a candidate regime of DEMO-FNS.
Atoms 11 00024 g006
Figure 7. (a) LCFS and three injection lines corresponding to three different target points or tangency radii R = 2056 mm (red), R = 2481 mm (orange), R = 2906 mm (yellow); (b) Values of the effective radius (dashed curves, right scale) and the injection angle (solid curves, left scale) along the three injection lines versus the distance along the corresponding line.
Atoms 11 00024 g007
Figure 8. Plasma parameters used in calculations of neutral beam penetration: (a) Electron temperature (red curve, left scale) and electron density (blue curve, right scale); (b) Effective charge (dashed curve, left scale) and impurity ion densities (solid curves, right scale).
Atoms 11 00024 g008
Figure 9. (a) Approximation of finite width neutral beams by a large number of mathematical lines. The central injection lines correspond to those shown in Figure 6a; (b) Source functions of fast ions produced by neutral beams depicted by the corresponding colours.
Atoms 11 00024 g009
Figure 10. (a) Initial neutral particle current density distribution over the beam cross-section; (b) Residual neutral particle current density distribution over the beam cross-section (shine-through) for the beam with tangency radius R = 2056 mm corresponding to the red colour in Figure 8a.
Atoms 11 00024 g010
Figure 11. Angular distributions of the source of fast ions produced by three neutral beams shown in Figure 8a by the corresponding colours, (a) at ρ = 0.4 ; (b) at ρ = 0.8 .
Atoms 11 00024 g011
Figure 12. (a) Verification of the source function of fast ions produced by the neutral beam with tangency radius R = 2906 mm; (b) Verification of the angular distribution of the source of fast ions produced by the neutral beam with tangency radius R = 2056 mm.
Atoms 11 00024 g012
Disclaimer/Publisher’s Note: The statements, opinions and data contained in all publications are solely those of the individual author(s) and contributor(s) and not of MDPI and/or the editor(s). MDPI and/or the editor(s) disclaim responsibility for any injury to people or property resulting from any ideas, methods, instructions or products referred to in the content.

