
Electron-Impact Excitation of the λ190.8 nm and λ179.9 nm Intercombination Lines in the Tl+ Ion


Abstract
:1. Introduction
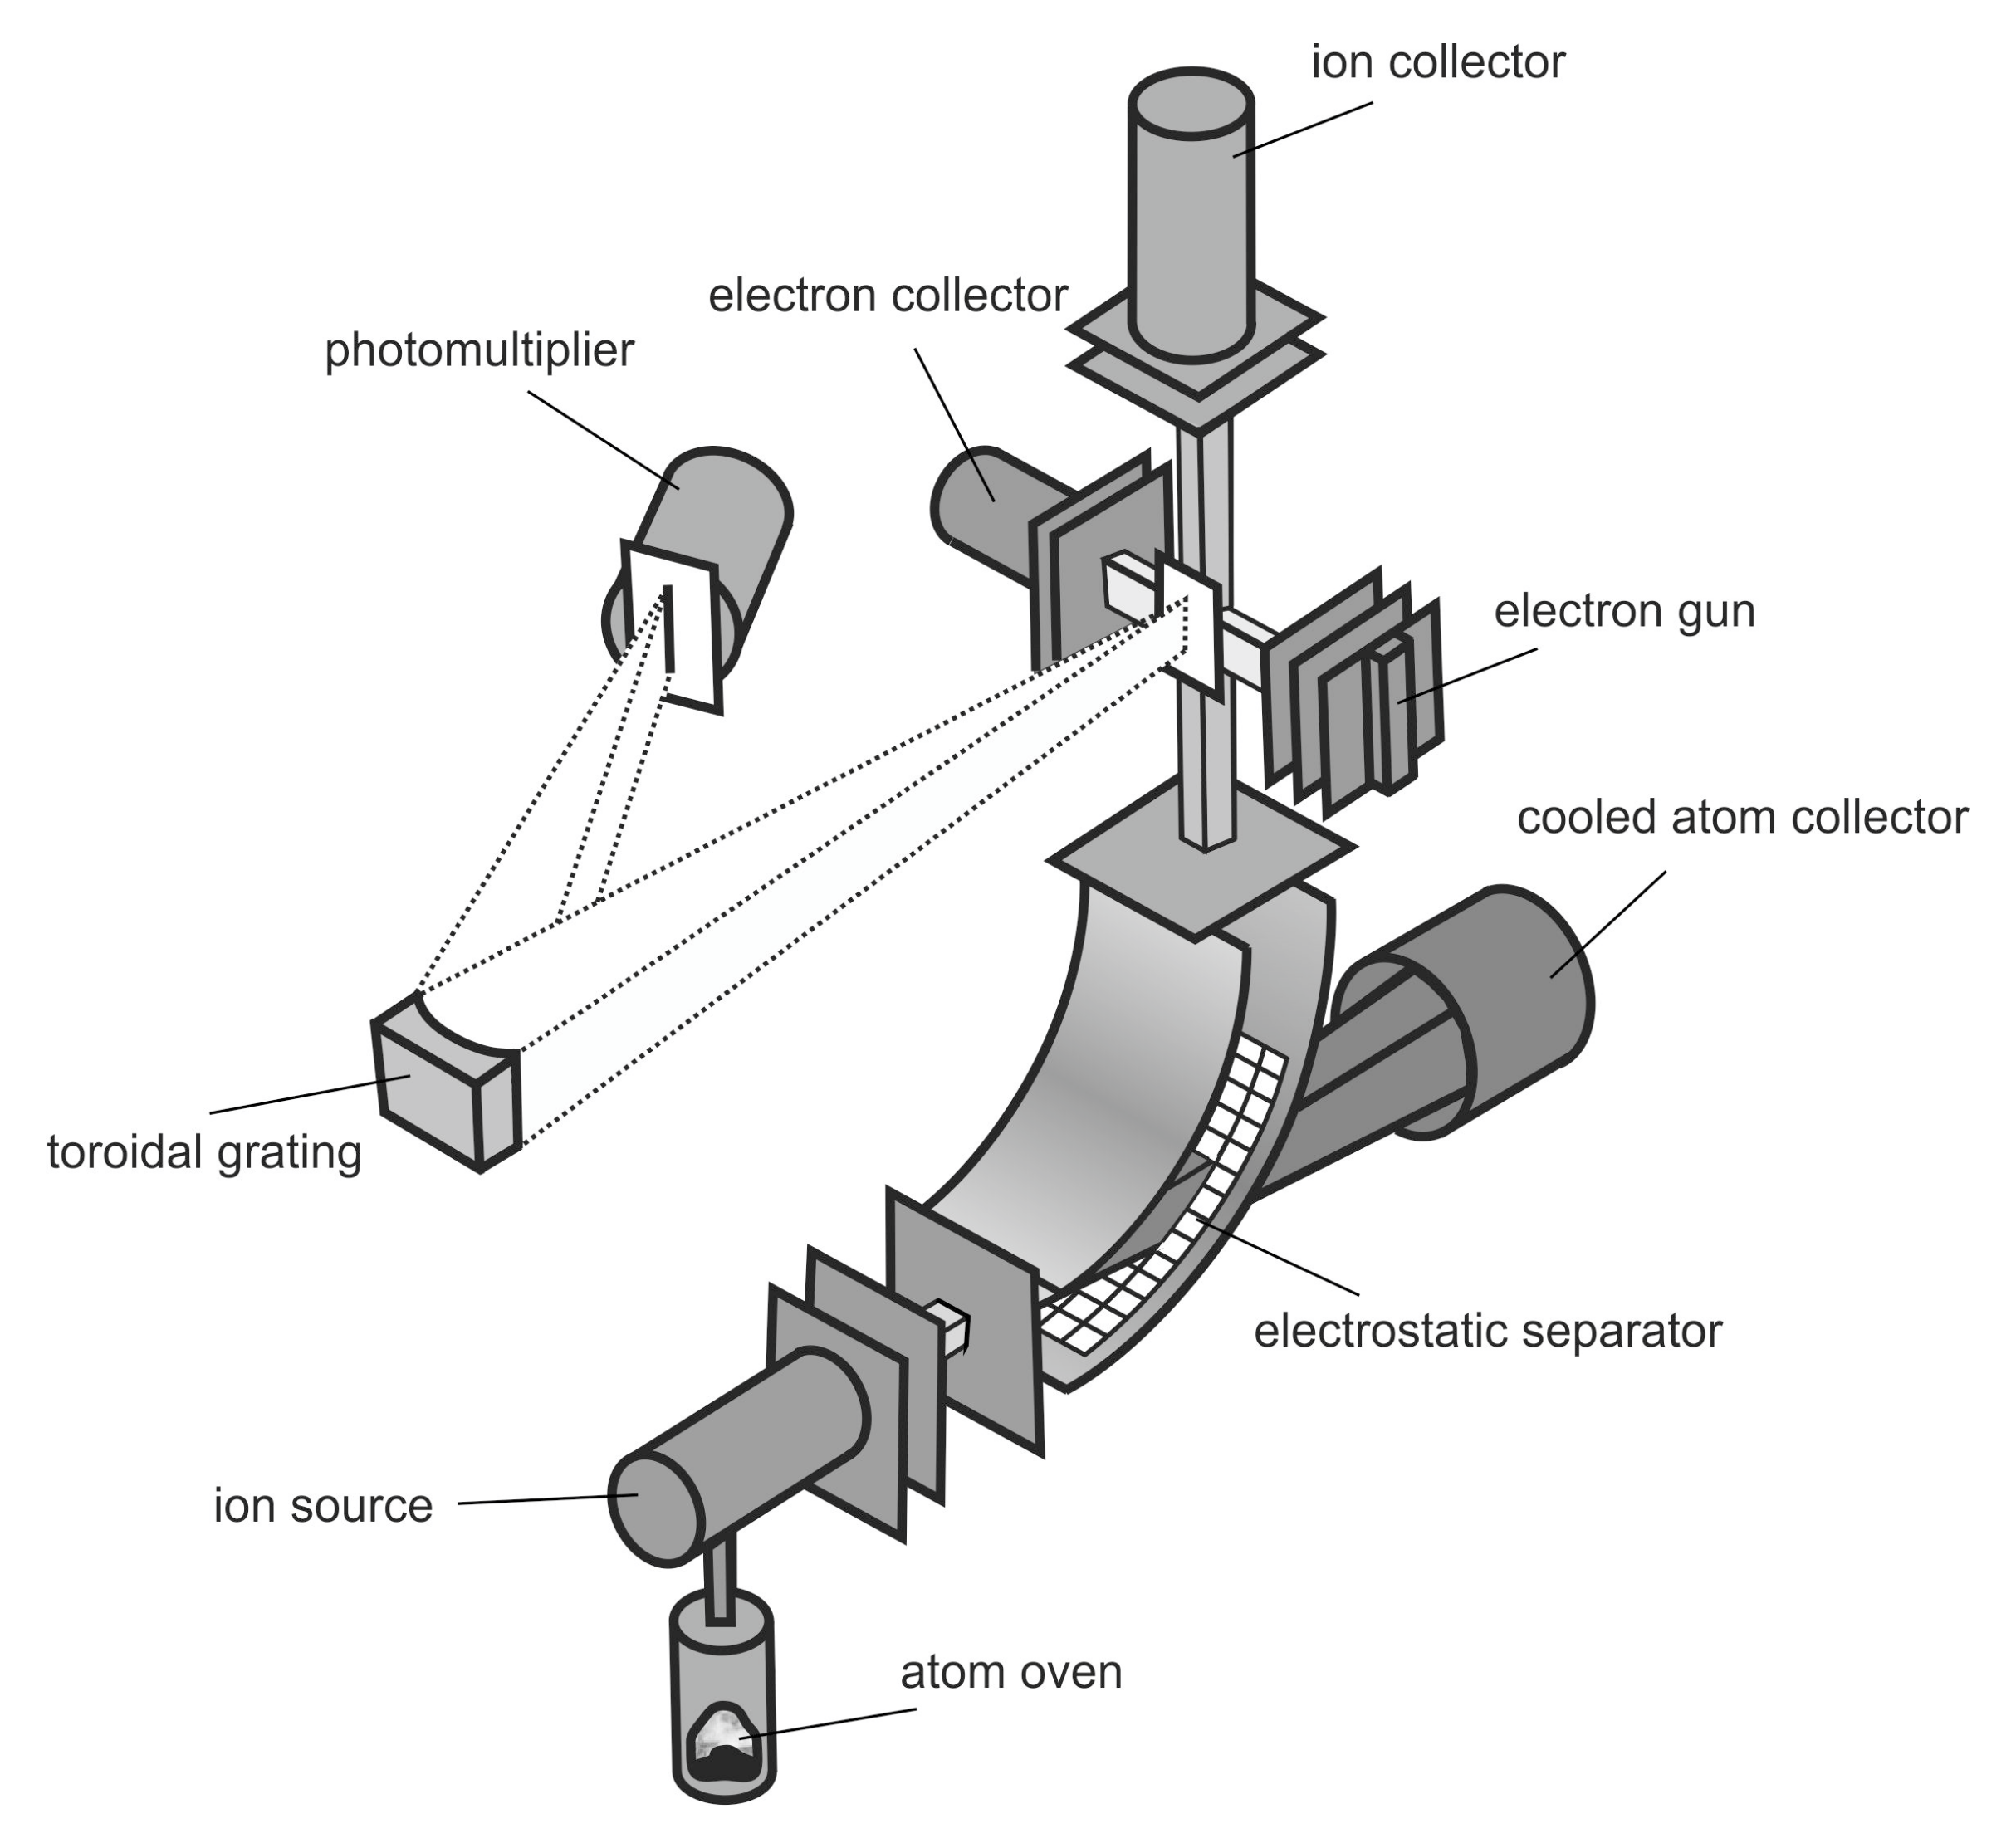
2. Experiment
3. Theoretical Method
4. Results and Discussion
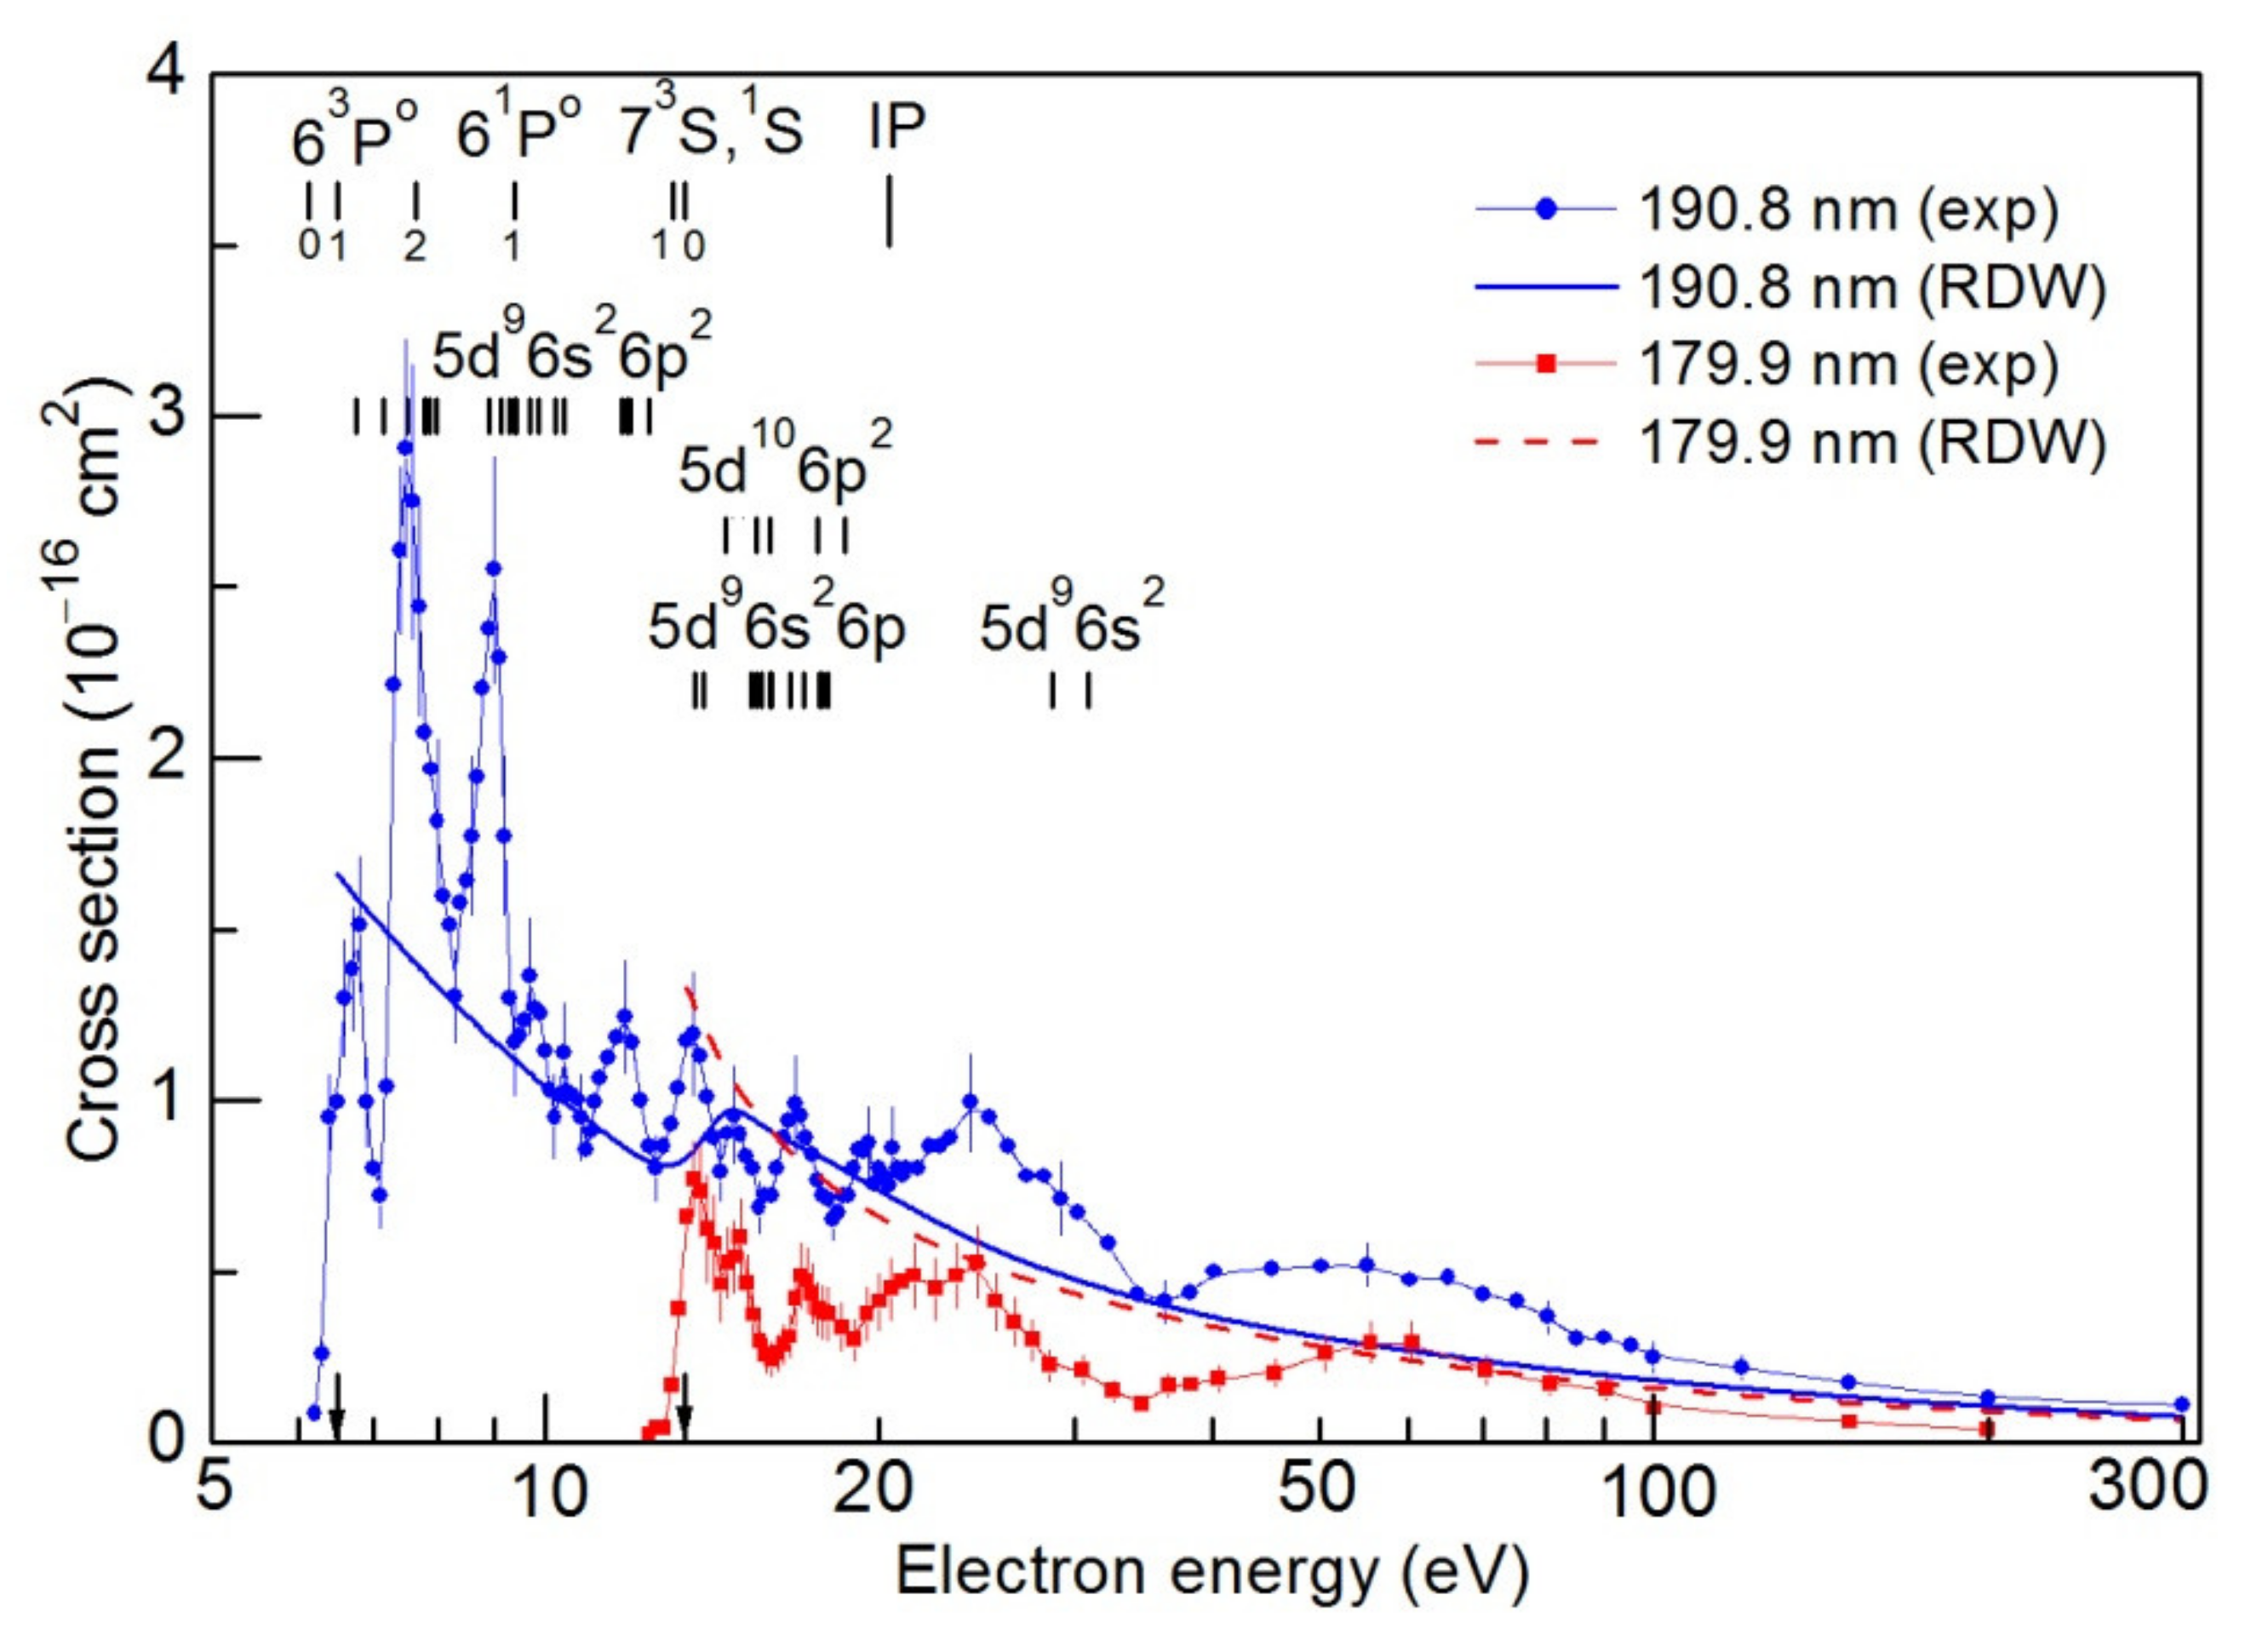
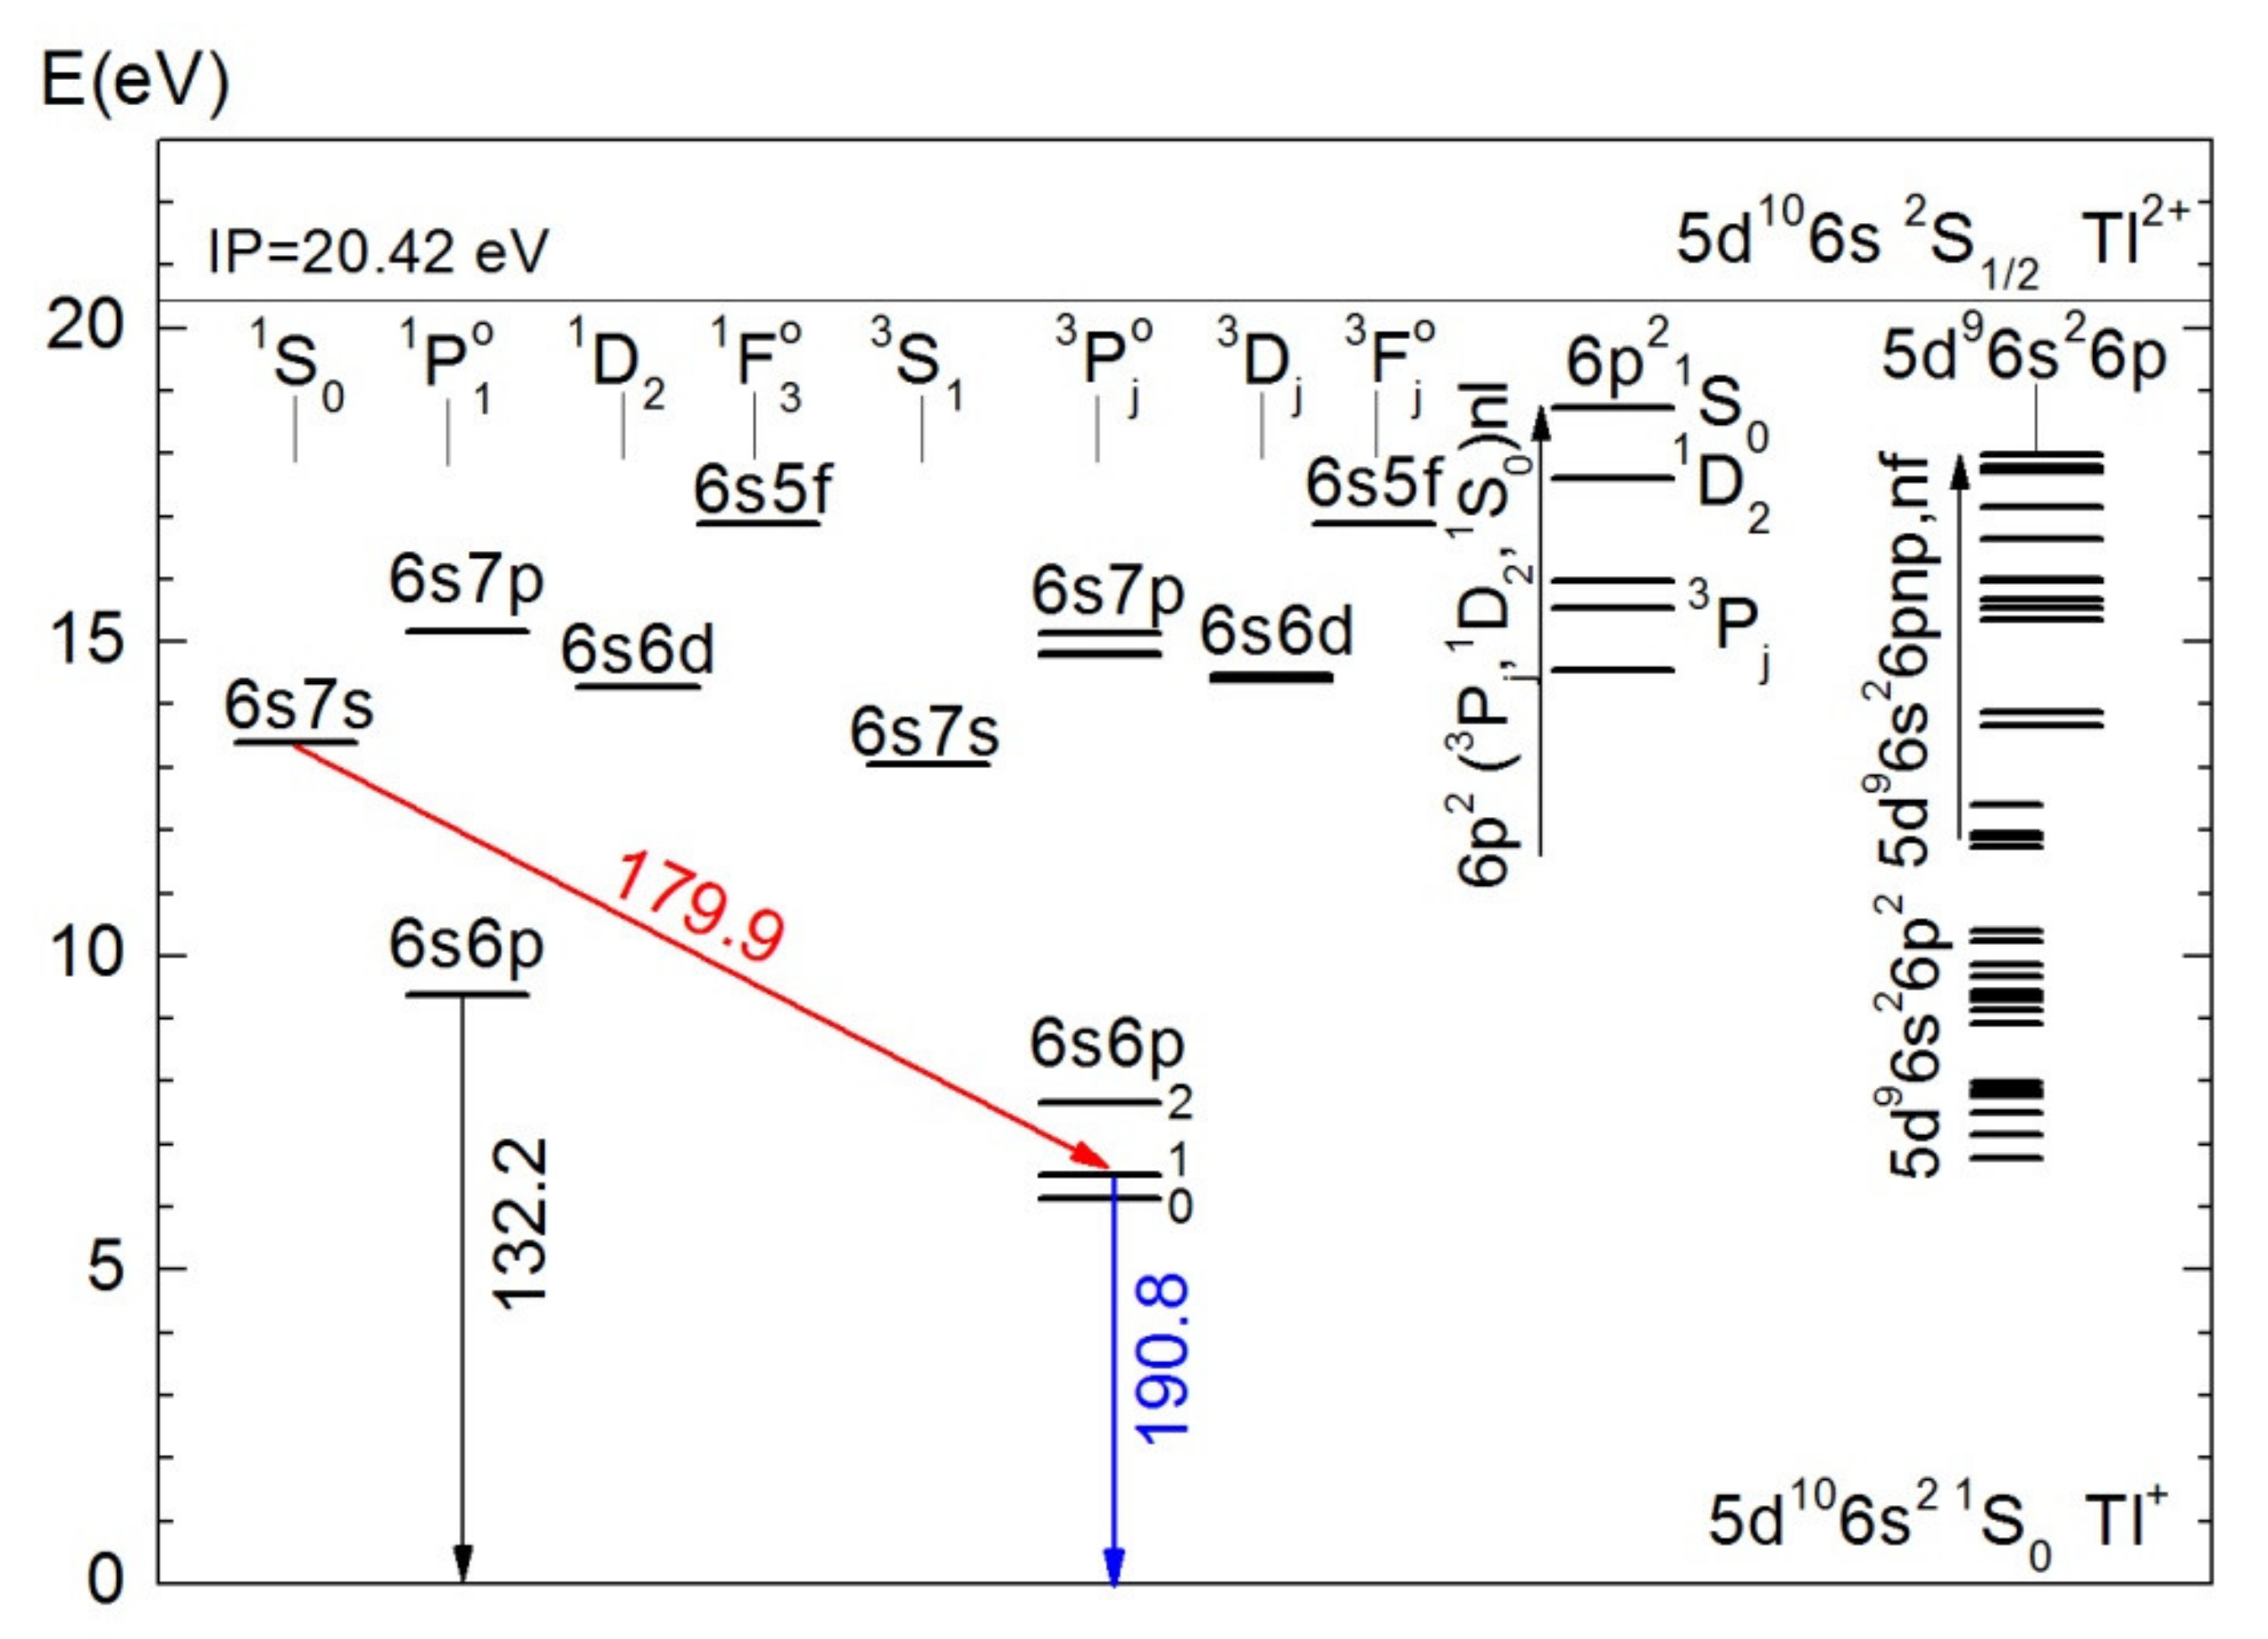
4.1. Experimental Excitation Functions
4.2. Absolute Excitation Cross-Sections
5. Conclusions
Author Contributions
Funding
Data Availability Statement
Conflicts of Interest
References
- Brage, T.; Leckrone, D.S.; Fischer, C.F. Core-valence and core-core correlation effects on hyperfine-structure parameters and oscillator strengths in Tl II and Tl III. Phys. Rev. A. 1996, 53, 192–200. [Google Scholar] [CrossRef] [PubMed]
- Leckrone, D.S.; Johansson, S.; Kalus, G.; Wahlgren, G.M.; Brage, T.; Proffitt, C.R. Abundance and Isotopic Anomalies of Thallium in the Atmosphere of the HgMn Star χ LUPI. Astrophys. J. 1996, 462, 937–942. [Google Scholar] [CrossRef]
- Leckrone, D.; Johansson, S.; Wahlgren, G.; Proffitt, C.; Brage, T. Stellar chemical abundances with the GHRS. Phys. Scr. 1996, 65, 110–114. [Google Scholar] [CrossRef]
- Leckrone, D.S.; Proffitt, C.R.; Wahlgren, G.M.; Johansson, S.G.; Brage, T. Very High Resolution Ultraviolet Spectroscopy of a Chemically Peculiar Star: Results of the χ Lupi Pathfinder Project. Astron. J. 1999, 117, 1454–1470. [Google Scholar] [CrossRef]
- Glowacki, L.; Migdalek, J. Relativistic configuration-interaction oscillator strength calculations with ab initio model potential wavefunctions. J. Phys. B At. Mol. Opt. Phys. 2003, 36, 3629–3636. [Google Scholar] [CrossRef]
- Muller, A. Electron–ion collisions: Fundamental processes in the focus of applied research. Adv. At. Mol. Opt. Phys. 2008, 55, 293–417. [Google Scholar]
- Rogers, W.T.; Olsen, J.O.; Dunn, G.H. Absolute emission cross section for electron-impact excitation of Li+ to the (23P) level. Phys. Rev. A. 1978, 18, 1353–1363. [Google Scholar] [CrossRef]
- Christensen, R.B.; Norcross, D.W. Electron-impact excitation of Li II: A model study of wave-function and collisional approximations and of resonance effects. Phys. Rev. A. 1984, 31, 142–151. [Google Scholar] [CrossRef]
- Tayal, S.S.; Burke, S.S.; Kingston, A.E. Electron impact excitation of intercombination transitions in Al II. J. Phys. B At. Mol. Phys. 1984, 17, 3847–3856. [Google Scholar] [CrossRef]
- Zapesochnyi, I.P.; Imre, A.I.; Kontrosh, E.E.; Zapesochnyi, A.I.; Gomonai, A.N. Resonances caused by the excitation of a 6 1S0—6 3P1 intercombination transition of a thallium ion in the electron-ion collisions. JETP Lett. 1986, 43, 596–598. [Google Scholar]
- Roman, V.; Gomonai, A.I.; Sharma, L.; Sahoo, A.K.; Gomonai, A.N. Electron impact excitation of the Tl+ ion: Resonance and cascade transitions. J. Phys. B At. Mol. Opt. Phys. 2022, 55, 165203. [Google Scholar] [CrossRef]
- Ovcharenko, E.V.; Imre, A.I.; Gomonai, A.N.; Hutych, Y.I. Emission cross-sections of the In2+ ion VUV laser transitions at electron-In+ ion collisions. J. Phys. B At. Mol. Opt. Phys. 2010, 43, 175206. [Google Scholar] [CrossRef]
- Mumma, M.J.; Zipf, E.C. Dissociative excitation of vacuum-ultraviolet emission features by electron impact on molecular gases. II. N2. J. Chem. Phys. 1971, 55, 5582–5587. [Google Scholar] [CrossRef] [Green Version]
- Fischer, C.F.; Gaigalas, G.; Jönsson, P.; Bieroń, J. GRASP2018—A Fortran 95 version of the general relativistic atomic structure package. Comput. Phys. Commun. 2019, 237, 184–187. [Google Scholar] [CrossRef]
- Kramida, A.; Ralchenko, Y.; Reader, J. NIST Atomic Spectra Database (ver. 5.9). Available online: https://physics.nist.gov/asd (accessed on 10 October 2022).
- Curtis, L.J. Branching fractions and transition probabilities for Ga II, In II and Tl II from measured lifetime and energy level data. Phys. Scr. 2000, 62, 31. [Google Scholar] [CrossRef]
- Andrés-García, I.; Colón, C.; Fernández-Martínez, F. Stark broadening parameters and transition probabilities of persistent lines of Tl II. Mon. Not. R. Astron. Soc. 2018, 476, 793–803. [Google Scholar] [CrossRef]
- Brage, T.; Proffitt, C.R.; Leckrone, D.S. Relativistic ab initio calculations of oscillator strengths and hyperfine structure constants in Tl II. J. Phys. B At. Mol. Opt. Phys. 1999, 32, 3183. [Google Scholar] [CrossRef]
- Sharma, L.; Surzhykov, A.; Srivastava, R.; Fritzsche, S. Electron-impact excitation of singly charged metal ions. Phys. Rev. A 2011, 83, 062701. [Google Scholar] [CrossRef]
- Moore, C.E. Atomic Energy Levels as Derived from Analyses of Optical Spectra. Available online: https://nvlpubs.nist.gov/nistpubs/Legacy/NSRDS/nbsnsrds35v1.pdf (accessed on 10 October 2022).
- Johansson, S.; Kalus, G.; Brage, T.; Leckrone, D.S.; Wahlgren, G. Hyperfine Structure and Isotope Shift in Tl II with Astrophysical Applications. Astrophys. J. 1996, 462, 943–947. [Google Scholar] [CrossRef]
- Wilson, M. The 6p2 configuration of Hg I. Phys. Lett. A 1985, 111, 363–366. [Google Scholar] [CrossRef]
- Desclaux, J.P.; Kim, Y. Relativistic effects in outer shells of heavy atoms. J. Phys. B At. Mol. Phys. 1975, 8, 1177–1182. [Google Scholar] [CrossRef]
- Connerade, J.P. The Absorption Spectrum of Tl I in the Vacuum Ultraviolet. Astrophys. J. 1972, 172, 213–227. [Google Scholar] [CrossRef]
- Connerade, J.P.; Garton, W.R.S.; Mansfield, M.W.D.; Martin, M.A.P. The Tl I Absorption Spectrum in the Vacuum Ultraviolet. Proc. R. Soc. Lond. Ser. A 1976, 350, 47–60. [Google Scholar]
- Martin, W.C.; Sugar, J.; Tech, J.L. Application of Slater-Condon Theory with Configuration Interaction to the 5d106s6p, 5d96s26p, 5d106s7p, and 5d106s5f Configurations in HgI, TlII, PbIII, and BiIV. Phys. Rev. A 1972, 6, 2022–2035. [Google Scholar] [CrossRef]
- Connerade, J.P. Revised assignments for d9s2p2 and d9s2p3 in Ga, In, Tl, Ge, Se and Pb. J. Phys. B At. Mol. Phys. 1979, 12, L223–L227. [Google Scholar] [CrossRef]
- Baig, M.A.; Connerade, J.P. New high-resolution study of the 6s subshell spectrum of Tl I. J. Phys. B At. Mol. Phys. 1985, 18, 3487–3497. [Google Scholar] [CrossRef]
- Baig, M.A.; Ahmad, S.; Akram, M.; Connerade, J.P.; Hormes, J. The absorption spectrum of Tl in the vacuum ultraviolet: Single and double excitations of 5d, 6s and 6p electrons. J. Phys. B At. Mol. Opt. Phys. 1992, 25, 1719–1734. [Google Scholar] [CrossRef]
- Back, C.; Pejcev, V.; Ross, K.J.; Wilson, M. The ejected-electron spectrum of thallium vapour autoionising levels excited by low-energy electron impact. J. Phys. B At. Mol. Phys. 1983, 16, 2413–2426. [Google Scholar] [CrossRef]
- Sandner, W.; Kachru, R.; Safinya, K.A.; Gounand, F.; Cooke, W.E.; Gallagher, T.F. Energy and angular distributions of electrons ejected from the Ba (6pjns1/2)1 states. Phys. Rev. A. 1983, 27, 1717–1723. [Google Scholar] [CrossRef]
- Kachru, R.; Tran, N.H.; van Linden van den Heuvell, H.B.; Gallagher, T.F. Enhancement of the autoionization rate of two-photon excited states of Ba (6d5/2nd5/2(3/2))J=4 near the Ba+ 6d3/2 limit. Phys. Rev. A 1984, 30, 667–669. [Google Scholar] [CrossRef]
- Ellis, C.B.; Sawyer, R.A. An Extension of the Thallium II Spectrum. Phys. Rev. 1936, 49, 145–150. [Google Scholar] [CrossRef]
- Gutmann, F.; Cooker, A.M. Extensions in the Spark Spectra of Tl III and Pb IV. Can. J. Phys. 1973, 51, 1823–1830. [Google Scholar] [CrossRef]
- Martin, W.C.; Sugar, J. Perturbations and Coupling in the d9sp Configurations of Cu I, Zn II, Ag I, Cd II, and Tl III. J. Opt. Soc. Am. 1969, 59, 1266–1280. [Google Scholar] [CrossRef]
- Rojas, H. The threshold photoelectron spectrum of mercury. J. Phys. B At. Mol. Opt. Phys. 2013, 46, 085002. [Google Scholar] [CrossRef]
- Gomonai, A.; Ovcharenko, E.; Imre, A.; Hutych, Y. Peculiarities of the electron-impact excitation of single-charged indium ion. Nucl. Instrum. Methods Phys. Res. B 2005, 233, 250–254. [Google Scholar] [CrossRef]
- Henderson, M.; Curtis, L.J. Lifetime measurements in Tl II. J. Phys. B At. Mol. Opt. Phys. 1996, 29, L629–L634. [Google Scholar] [CrossRef]


| Configuration | Term | J | Energy (eV) | Reference |
|---|---|---|---|---|
| 5d106s2 | 1S | 0 | 0.00 | [20,21] |
| 5d106s6p | 3Po | 0 | 6.13 | [20,21] |
| 1 | 6.50 | [20,21] | ||
| 2 | 7.65 | [20,21] | ||
| 5d106s6p | 1Po | 1 | 9.38 | [20,21] |
| 5d106s7s | 3S | 1 | 13.05 | [20,21] |
| 5d106s7s | 1S | 0 | 13.39 | [20,21] |
| 5d106s6d | 1D | 2 | 14.28 | [20,21] |
| 5d106s6d | 3D | 1 | 14.40 | [20,21] |
| 2 | 14.43 | [20,21] | ||
| 3 | 14.48 | [20,21] | ||
| 5d106s7p | 3Po | 0 | 14.80 | [20,21] |
| 1 | 14.82 | [20,21] | ||
| 2 | 15.13 | [20,21] | ||
| 5d106s7p | 1Po | 1 | 15.17 | [20,21] |
| 5d106s5f | 3Fo | 3 | 16.87 | [20,21] |
| 2 | 16.88 | [20,21] | ||
| 4 | 16.887 | [20,21] | ||
| 5d106s5f | 1Fo | 3 | 16.89 | [20,21] |
| 5d106p2 | 3P | 0 | 14.56 | [20] |
| 1 | 15.54 | [20] | ||
| 2 | 15.97 | [20] | ||
| 5d106p2 | 1D | 2 | 17.60 | [20] |
| 5d106p2 | 1S | 0 | 18.72 | [22] |
| 5d96s26p | 1° | 2 | 13.67 | [20,24,25] |
| 2° | 3 | 13.88 | [24,25] | |
| 3° | 4 | 15.36 | [25] | |
| 4° | 2 | 15.54 | [20,24,25] | |
| 5° | 1 | 15.67 | [20,24,25] | |
| 6° | 3 | 15.96 | [20,24,25] | |
| 7° | 2 | 16.00 | [20,24,25] | |
| 8° | 1 | 16.65 | [20,24,25] | |
| 9° | 0 | 17.14 | [25] | |
| 10° | 3 | 17.70 | [20,24,25] | |
| 11° | 1 | 17.80 | [20,24,25] | |
| 12° | 2 | 17.99 | [20,24,25] | |
| 5d96s26p2 * | 6.77 | [30] | ||
| 7.15 | [30] | |||
| 7.43 | [30] | |||
| 5d96s26p2 * | 7.78 | [30] | ||
| 7.82 | [30] | |||
| 7.88 | [24,30] | |||
| 7.99 | [24,30] | |||
| 8.91 | [30] | |||
| 9.14 | [30] | |||
| 9.29 | [30] | |||
| 9.38 | [30] | |||
| 9.43 | [25,30] | |||
| 9.68 | [24,30] | |||
| 9.86 | [30] | |||
| 10.23 | [30] | |||
| 10.39 | [24] | |||
| 11.73 | [24] | |||
| 11.86 | [24,25] | |||
| 11.94 | [25] | |||
| 12.39 | [25] | |||
| Tl2+ (5d106s 2S1/2) | Limit | 20.42 | [20] |
Publisher’s Note: MDPI stays neutral with regard to jurisdictional claims in published maps and institutional affiliations. |
© 2022 by the authors. Licensee MDPI, Basel, Switzerland. This article is an open access article distributed under the terms and conditions of the Creative Commons Attribution (CC BY) license (https://creativecommons.org/licenses/by/4.0/).
Share and Cite
Gomonai, A.; Roman, V.; Gomonai, A.; Sahoo, A.K.; Sharma, L. Electron-Impact Excitation of the λ190.8 nm and λ179.9 nm Intercombination Lines in the Tl+ Ion. Atoms 2022, 10, 136. https://doi.org/10.3390/atoms10040136
Gomonai A, Roman V, Gomonai A, Sahoo AK, Sharma L. Electron-Impact Excitation of the λ190.8 nm and λ179.9 nm Intercombination Lines in the Tl+ Ion. Atoms. 2022; 10(4):136. https://doi.org/10.3390/atoms10040136
Chicago/Turabian StyleGomonai, Anna, Viktoria Roman, Aleksandr Gomonai, Aloka Kumar Sahoo, and Lalita Sharma. 2022. "Electron-Impact Excitation of the λ190.8 nm and λ179.9 nm Intercombination Lines in the Tl+ Ion" Atoms 10, no. 4: 136. https://doi.org/10.3390/atoms10040136