
The Response of Auroral-Oval Waves to CIR-Driven Recurrent Storms: FY-3E/ACMag Observations

 , , and
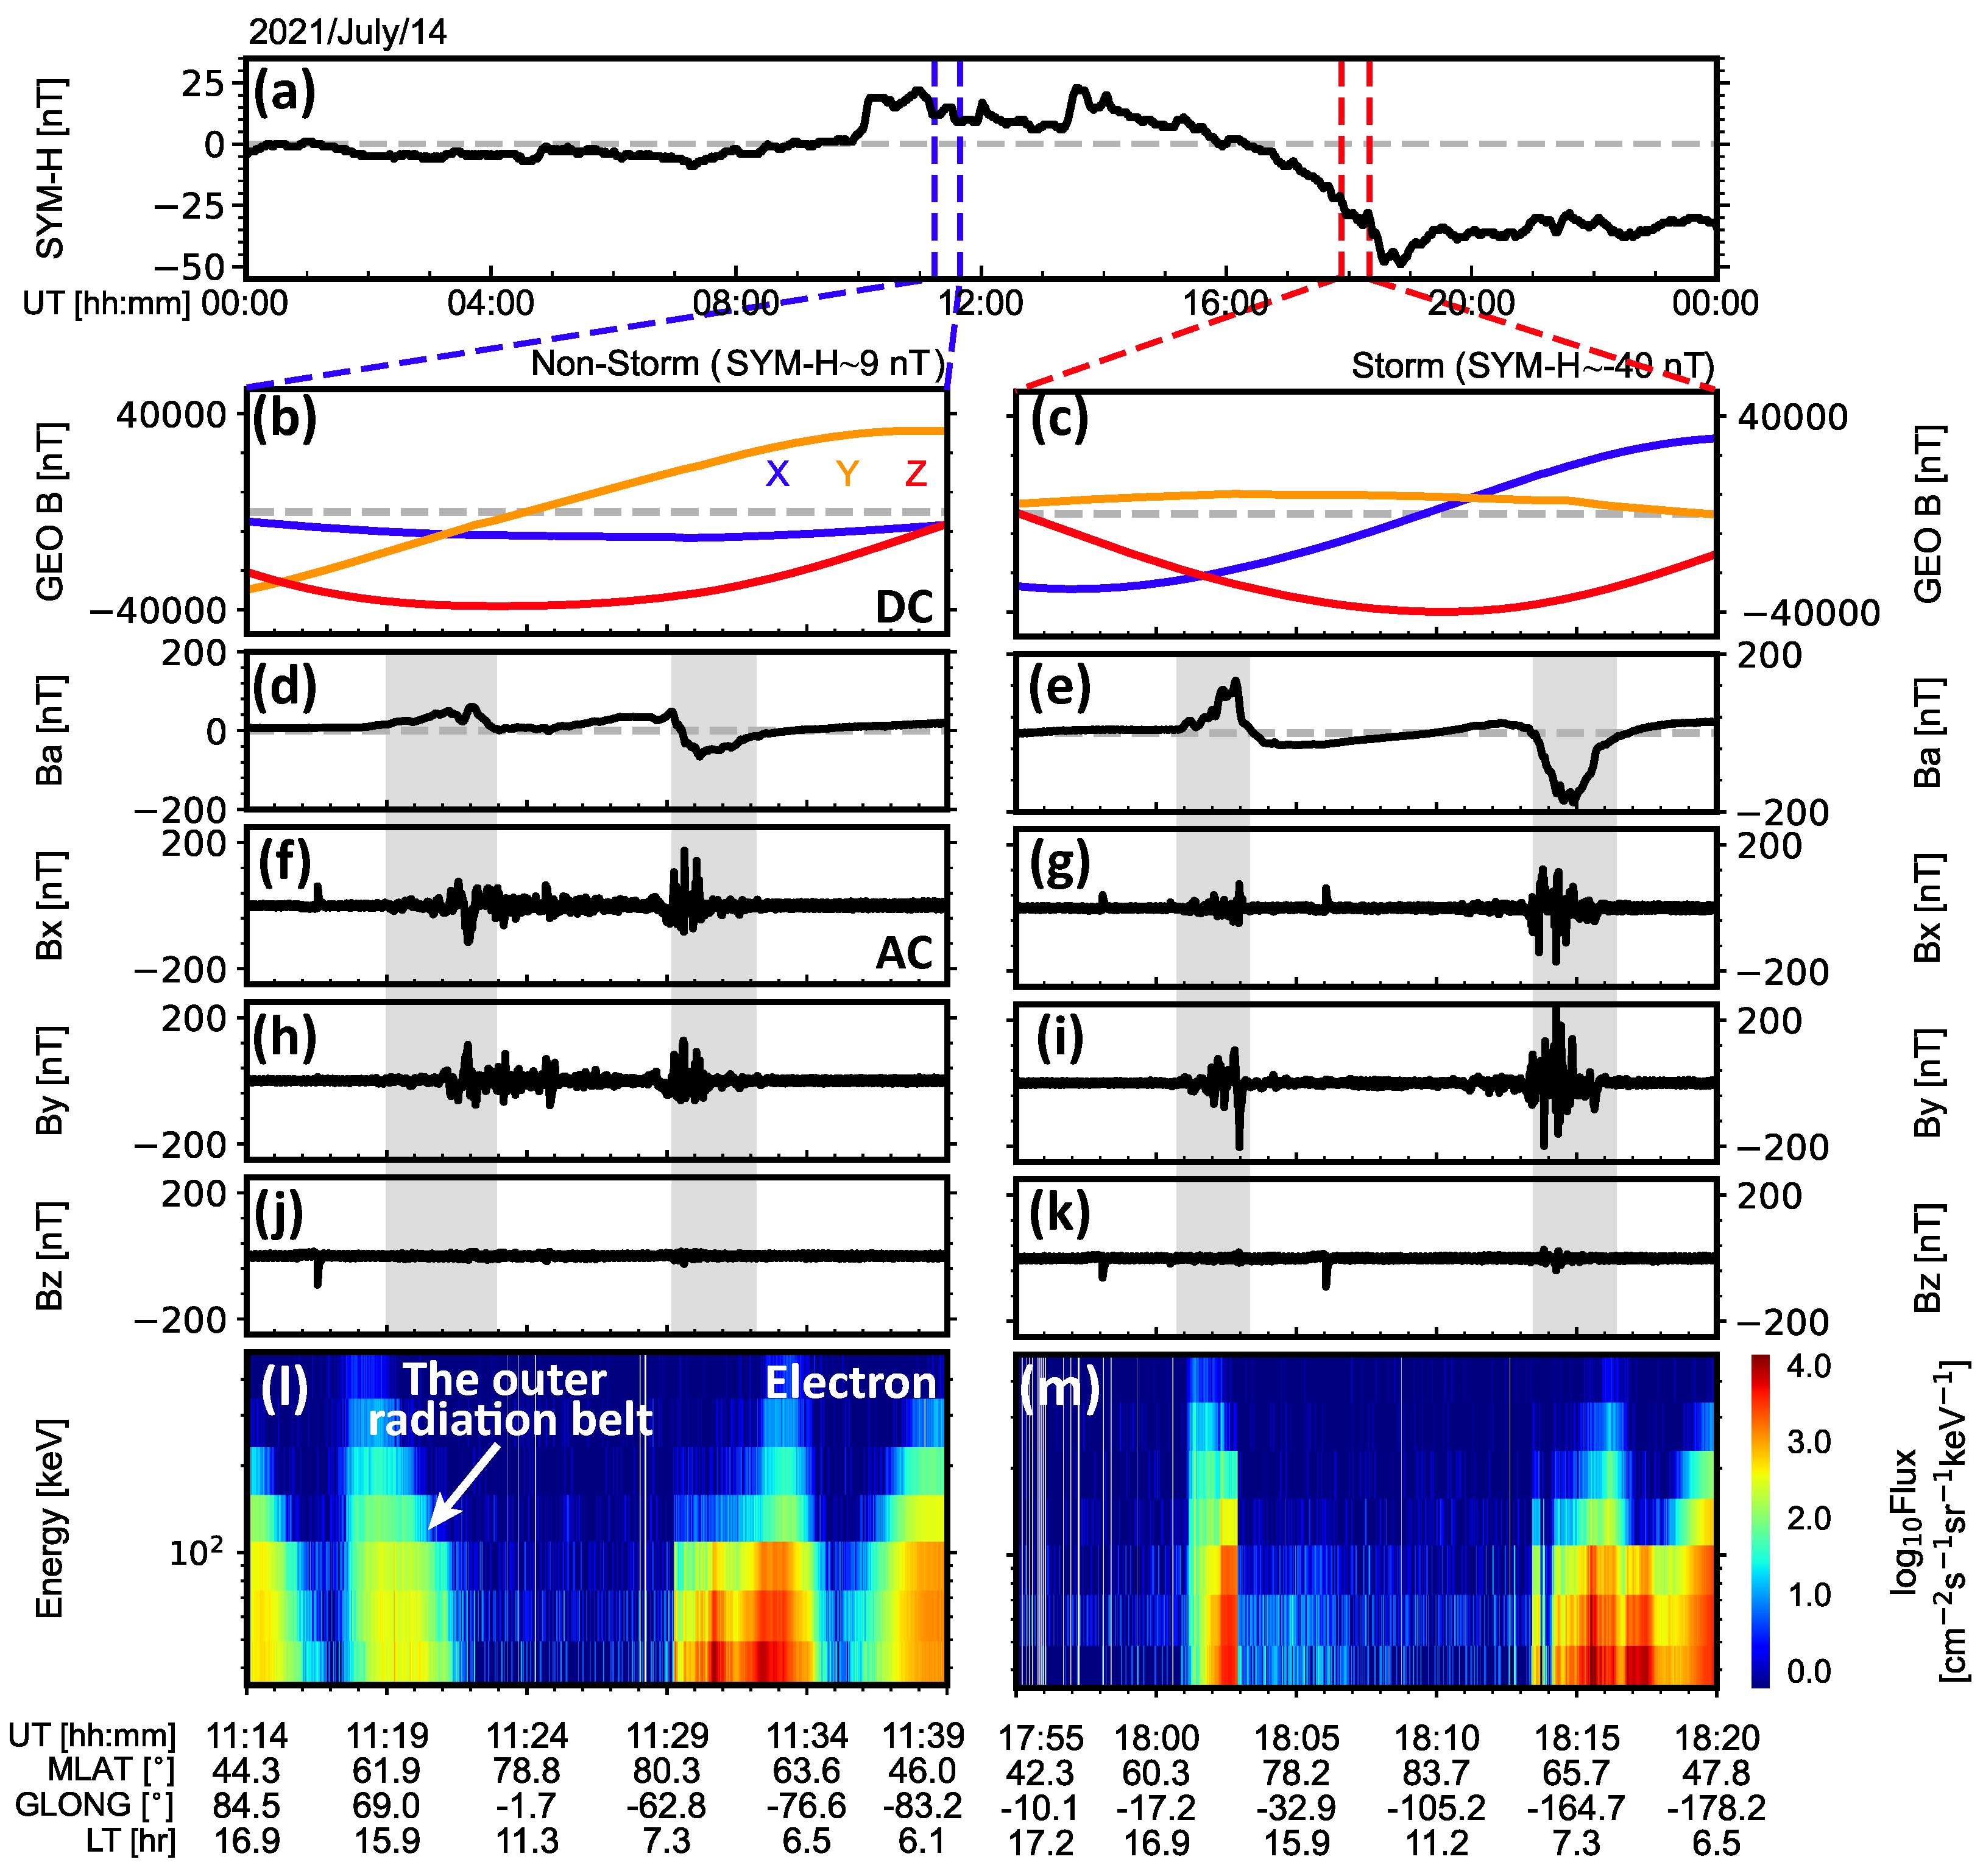
Abstract
:1. Introduction
2. Materials and Methods
3. The Auroral-Oval Waves Observed by FY-3E/ACMag
4. Response of the Auroral-Oval Waves to CIR-Driven Storms
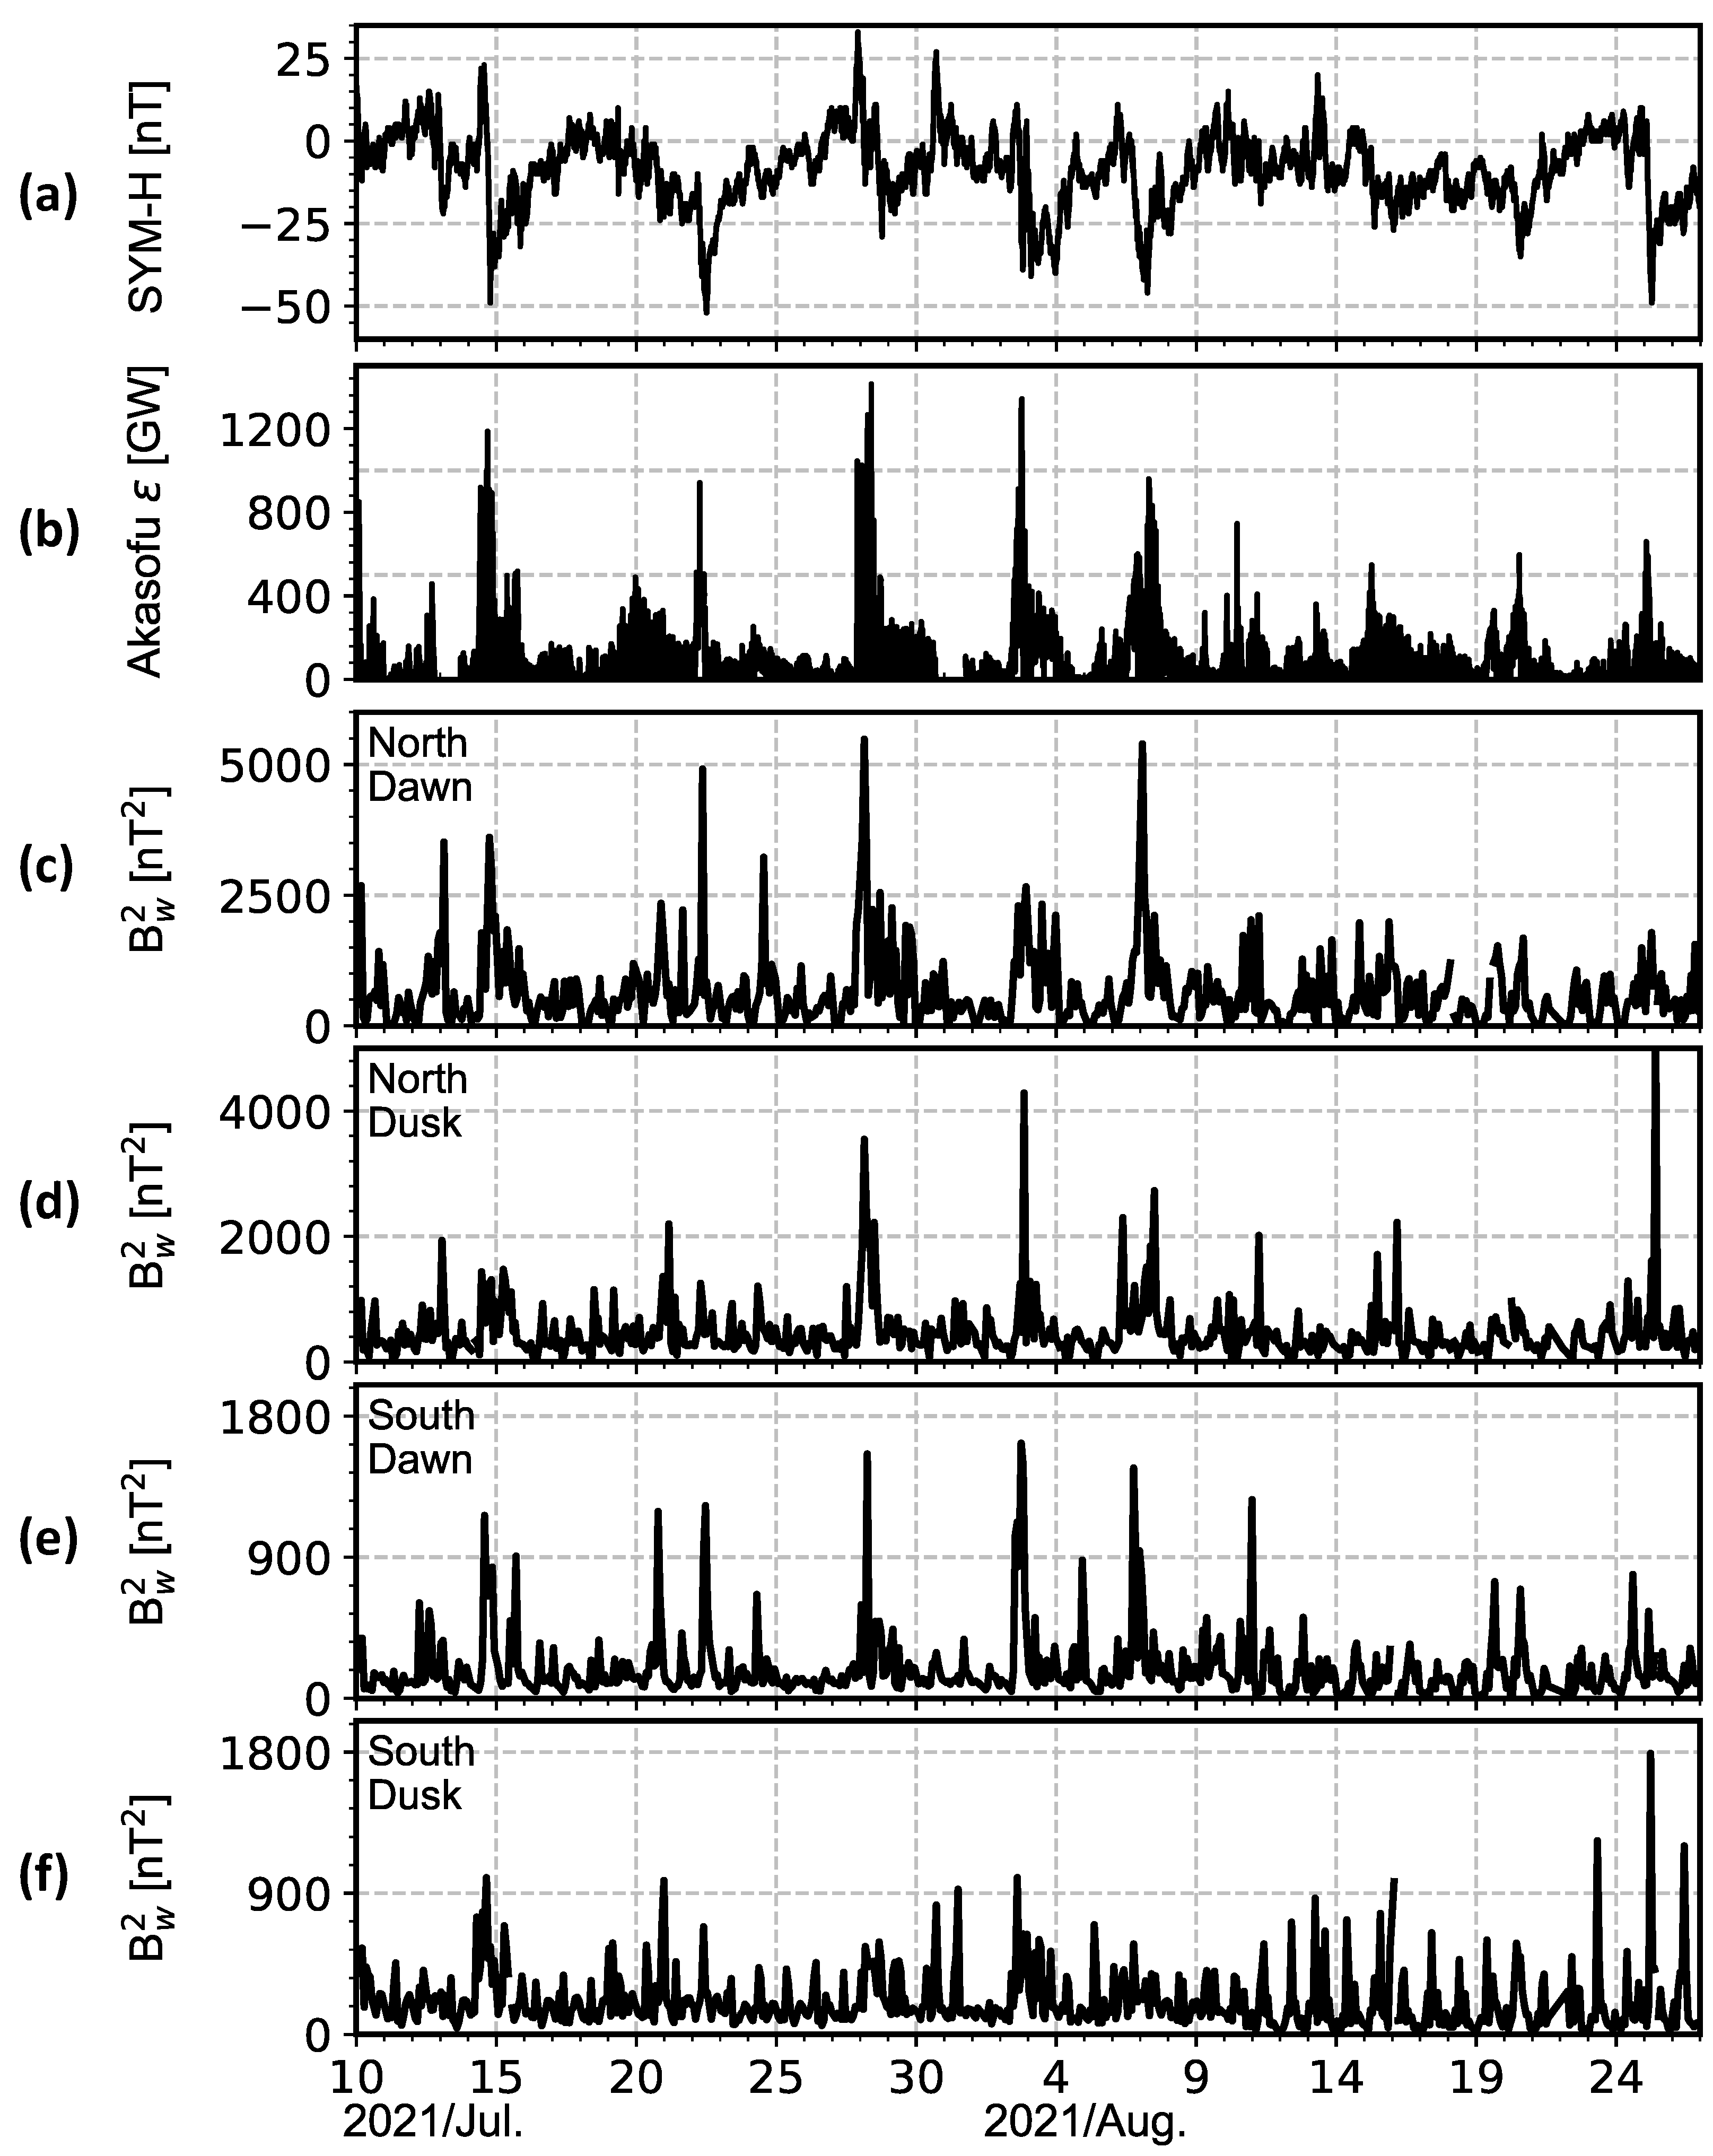
4.1. Overview
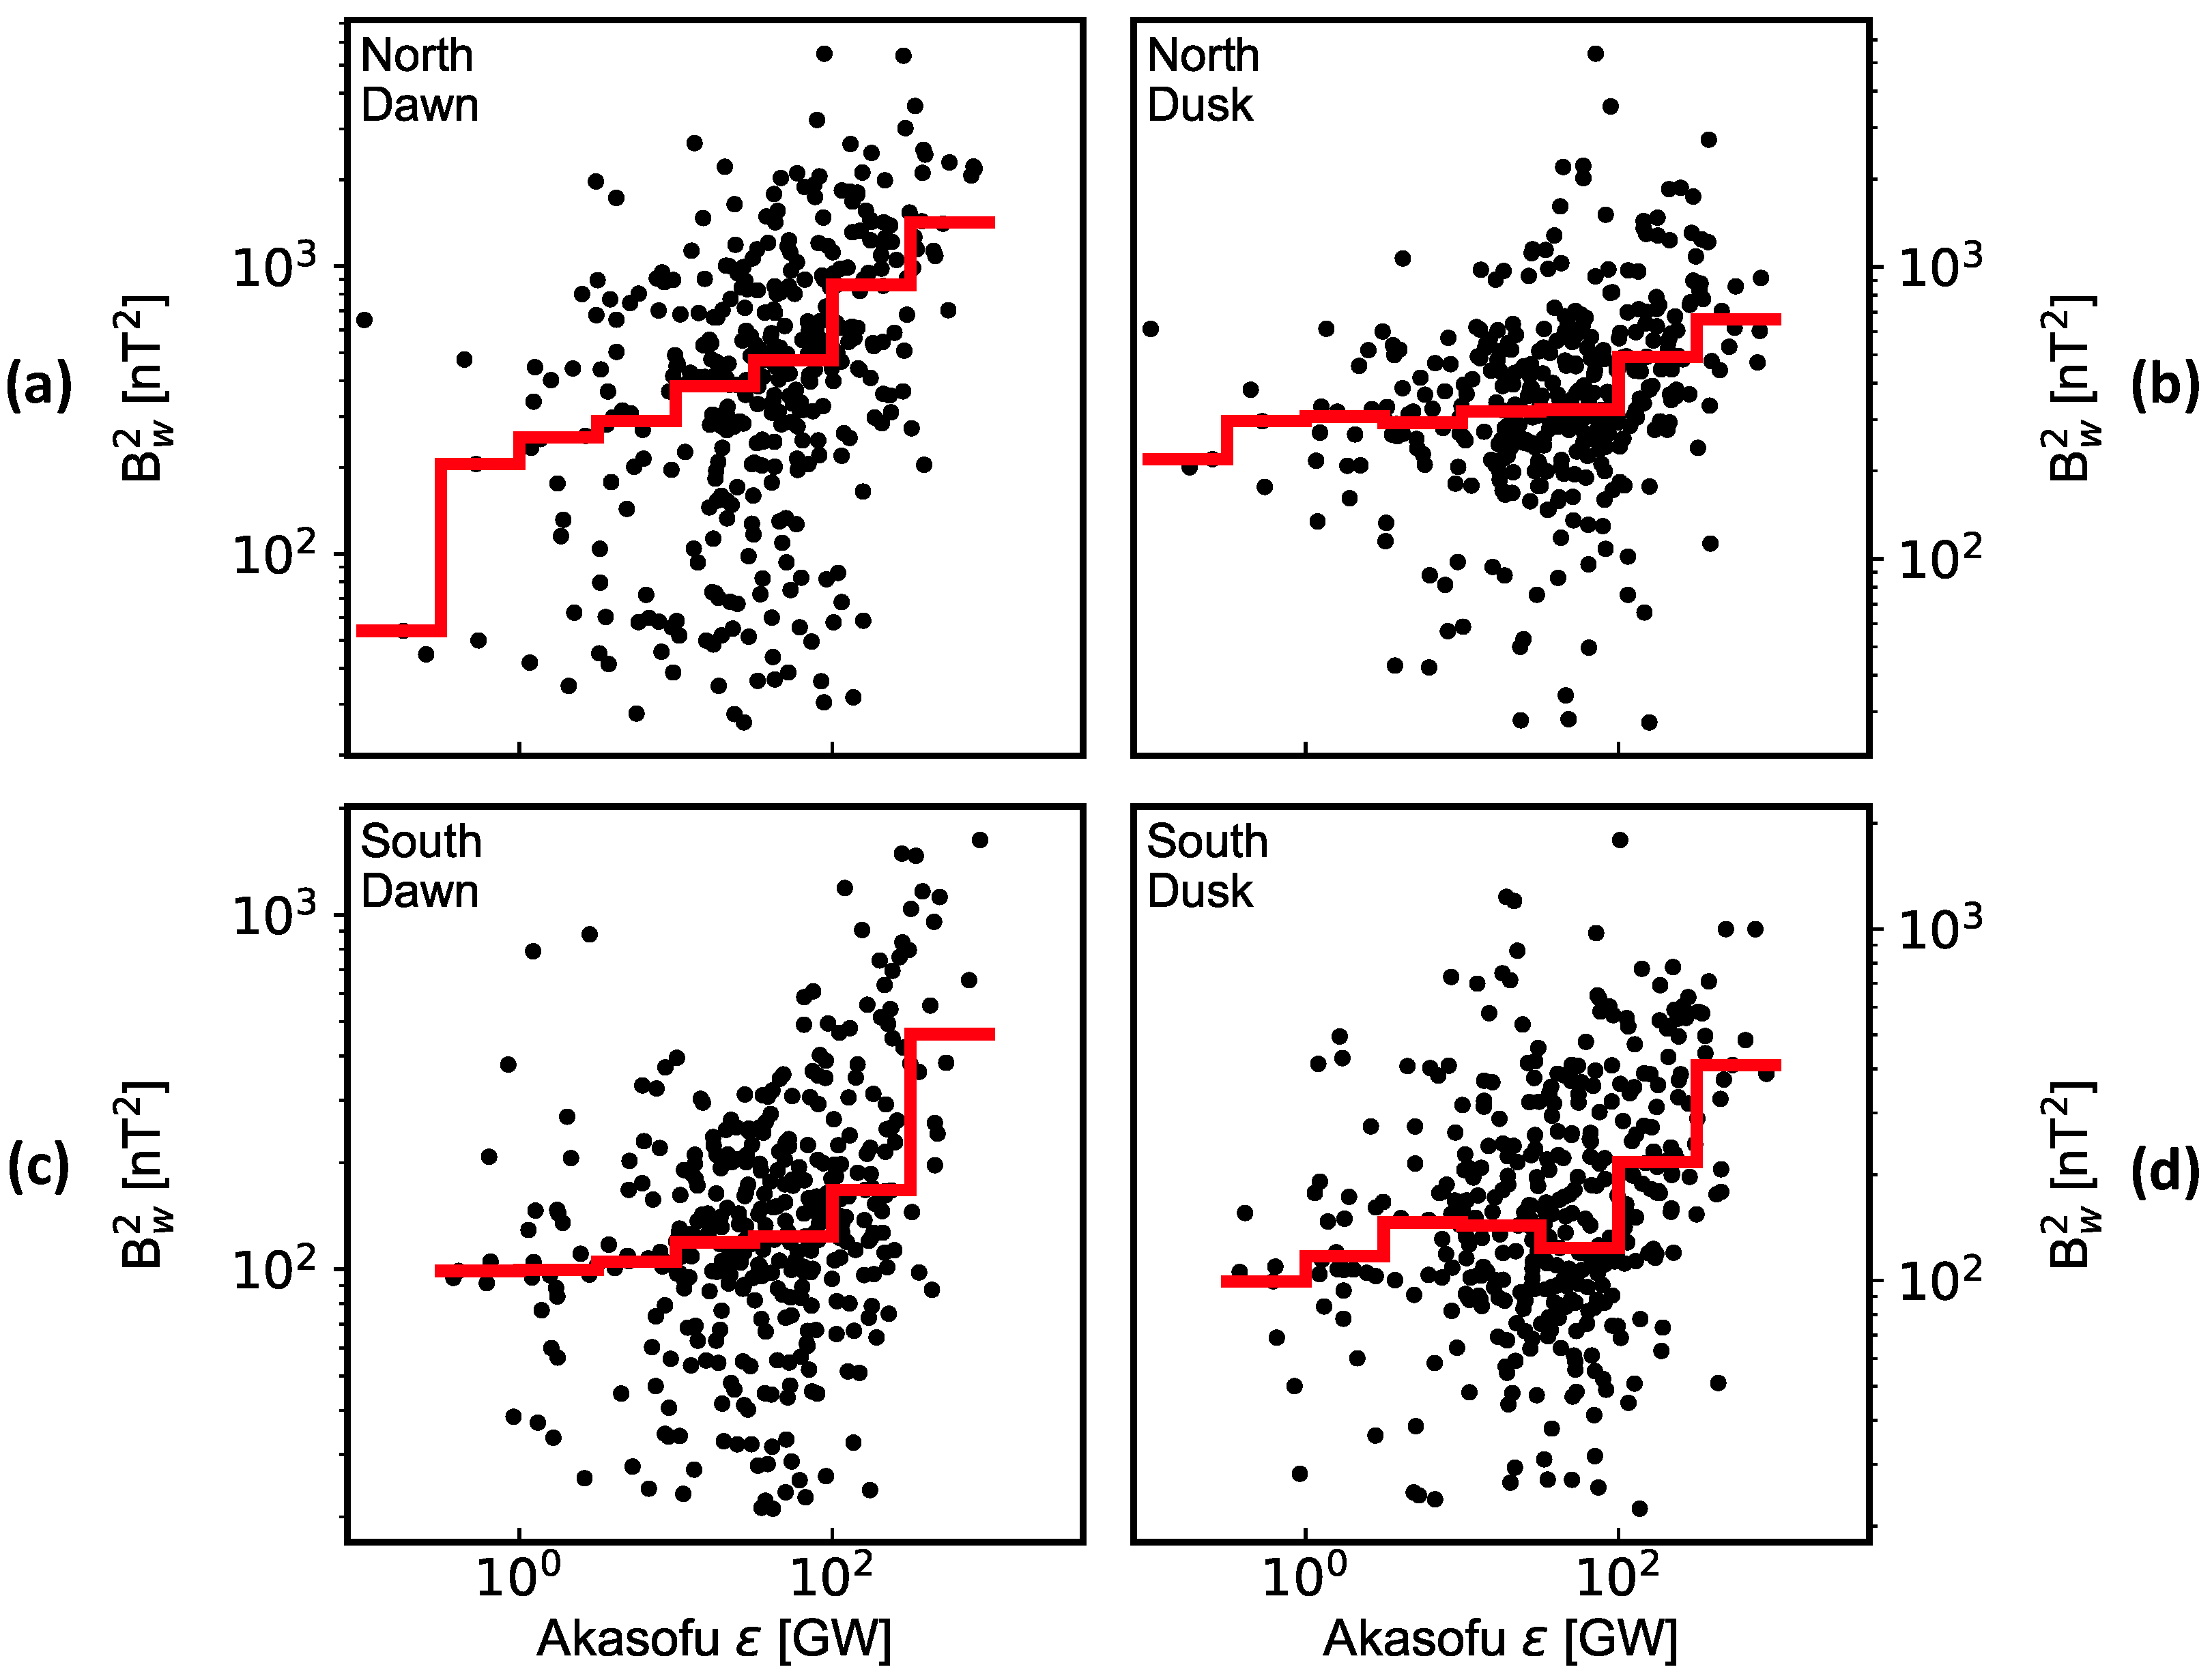
4.2. The Power of the Auroral-Oval Waves
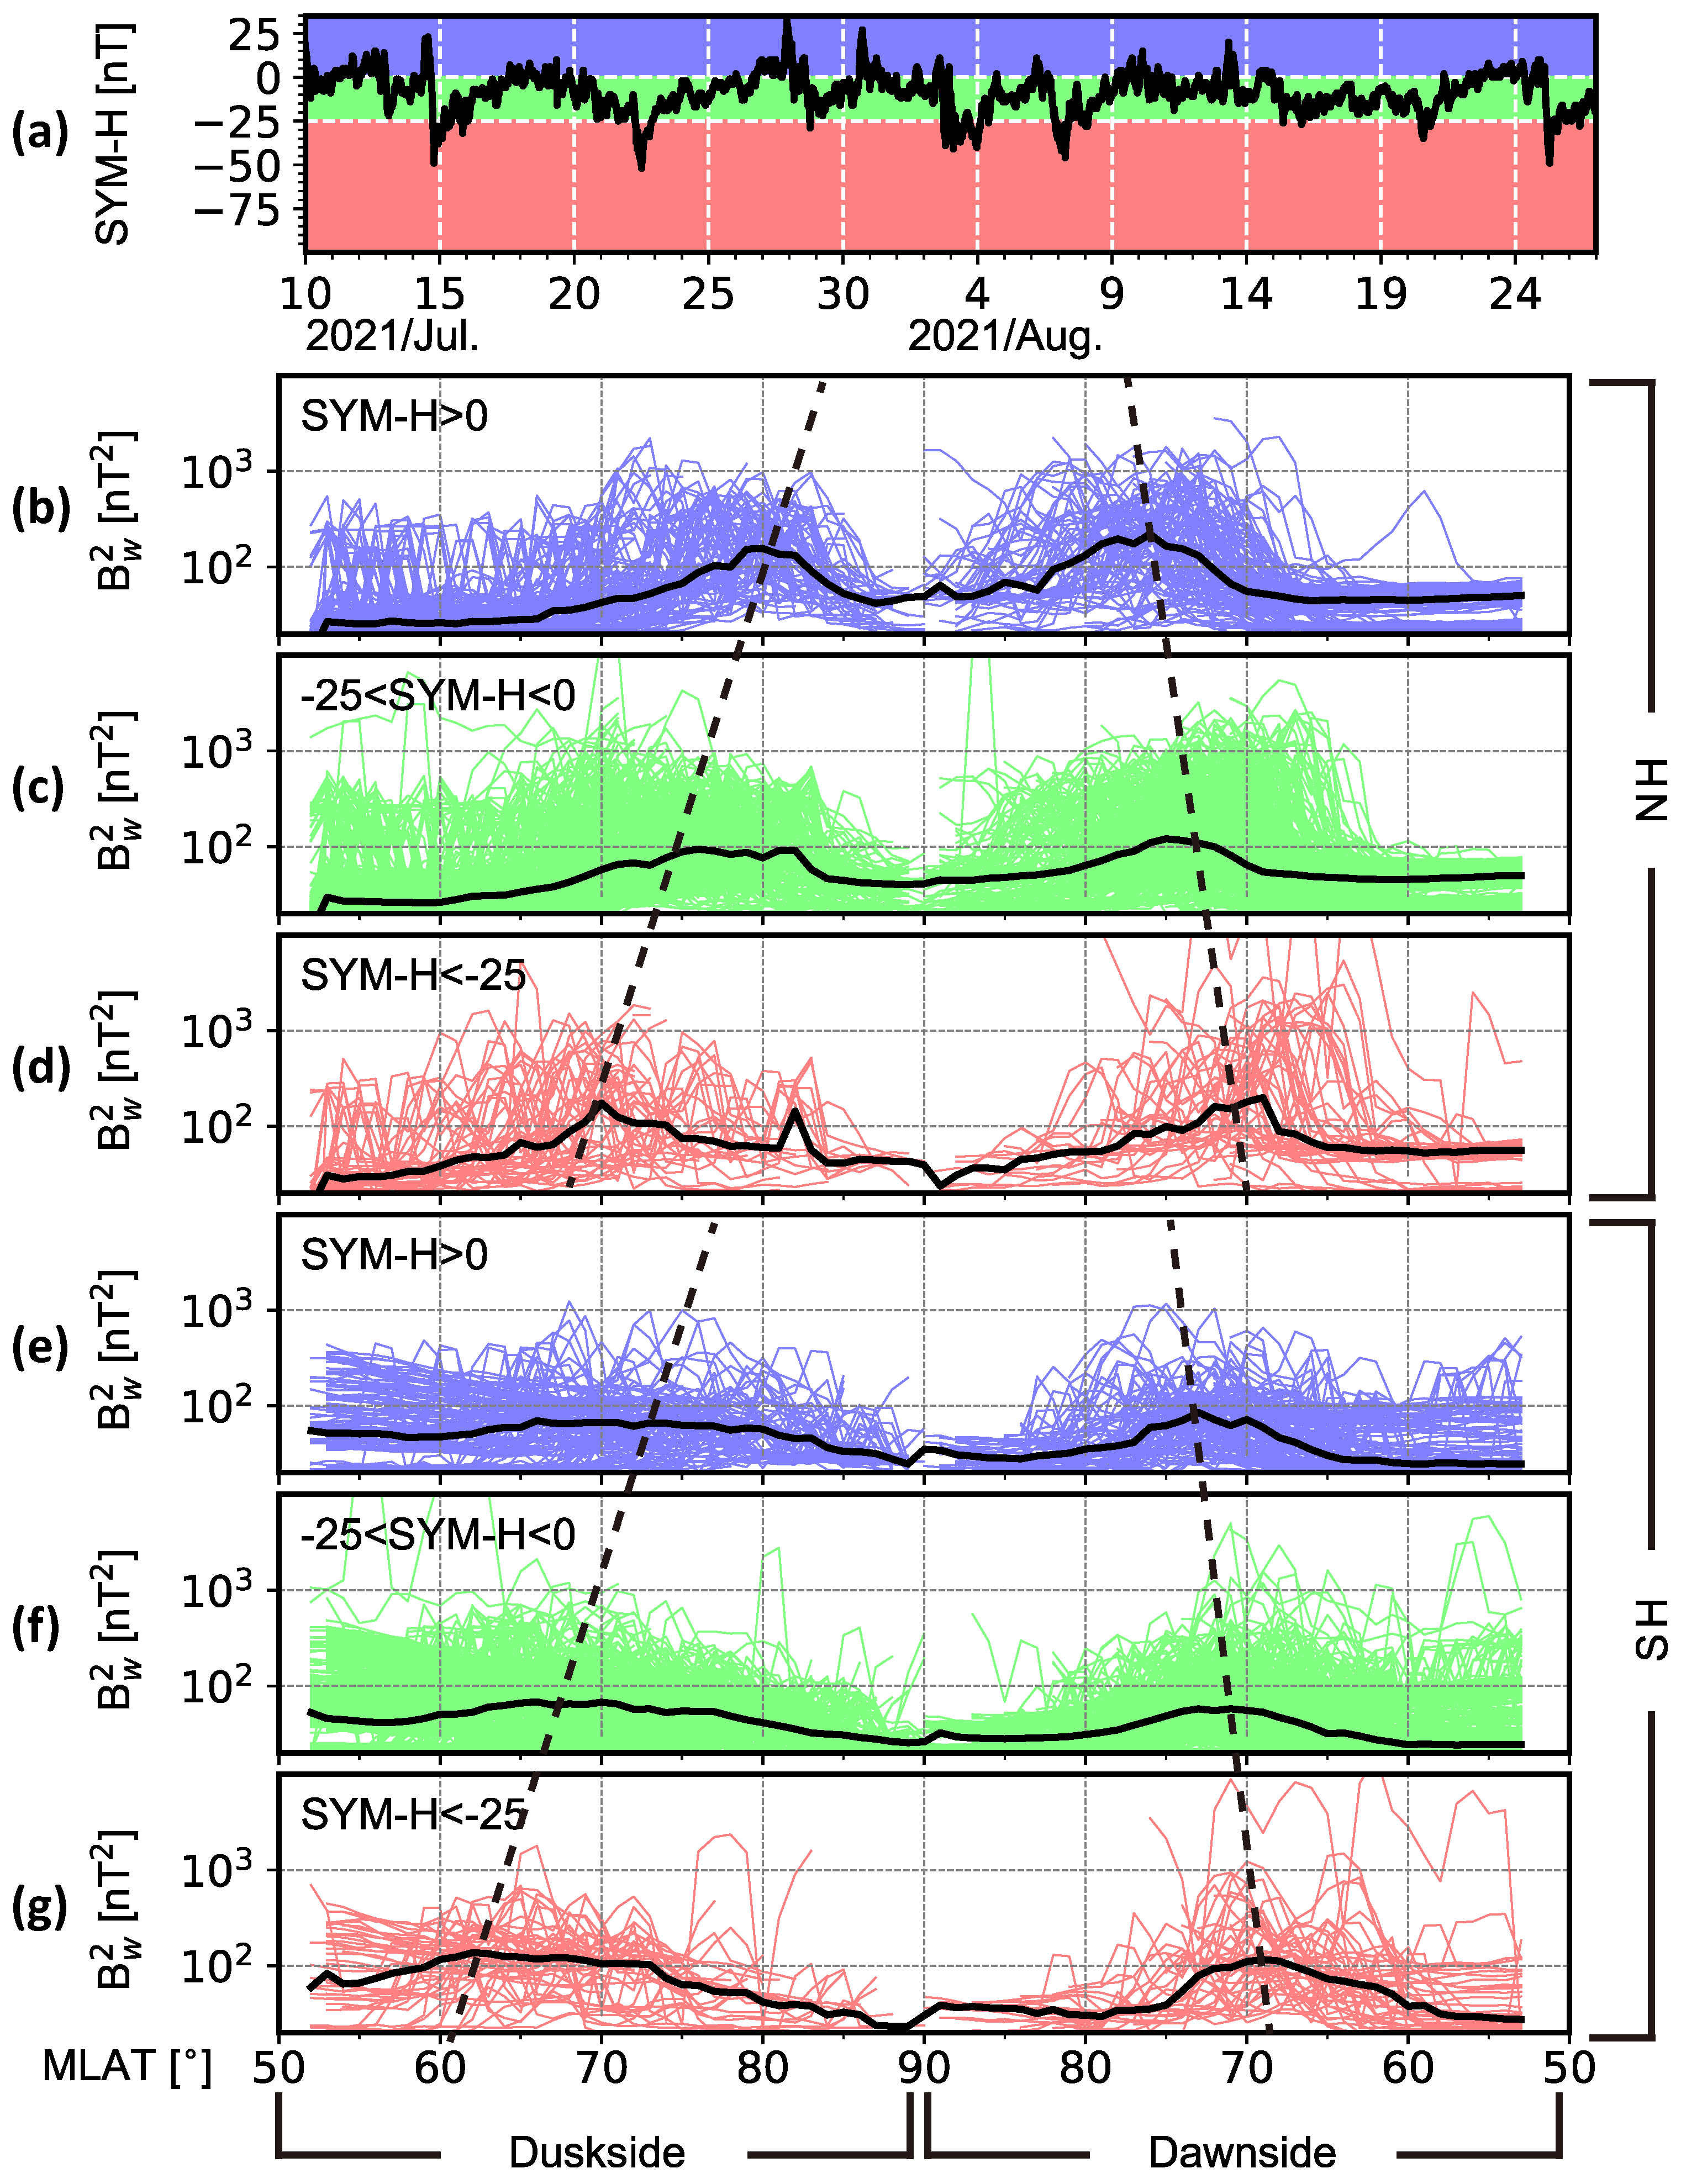
4.3. The Latitude Profiles of the Auroral-Oval Waves
5. Discussion and Summary
- The auroral-oval waves are a permanent feature of the auroral oval, although they vary significantly with time.
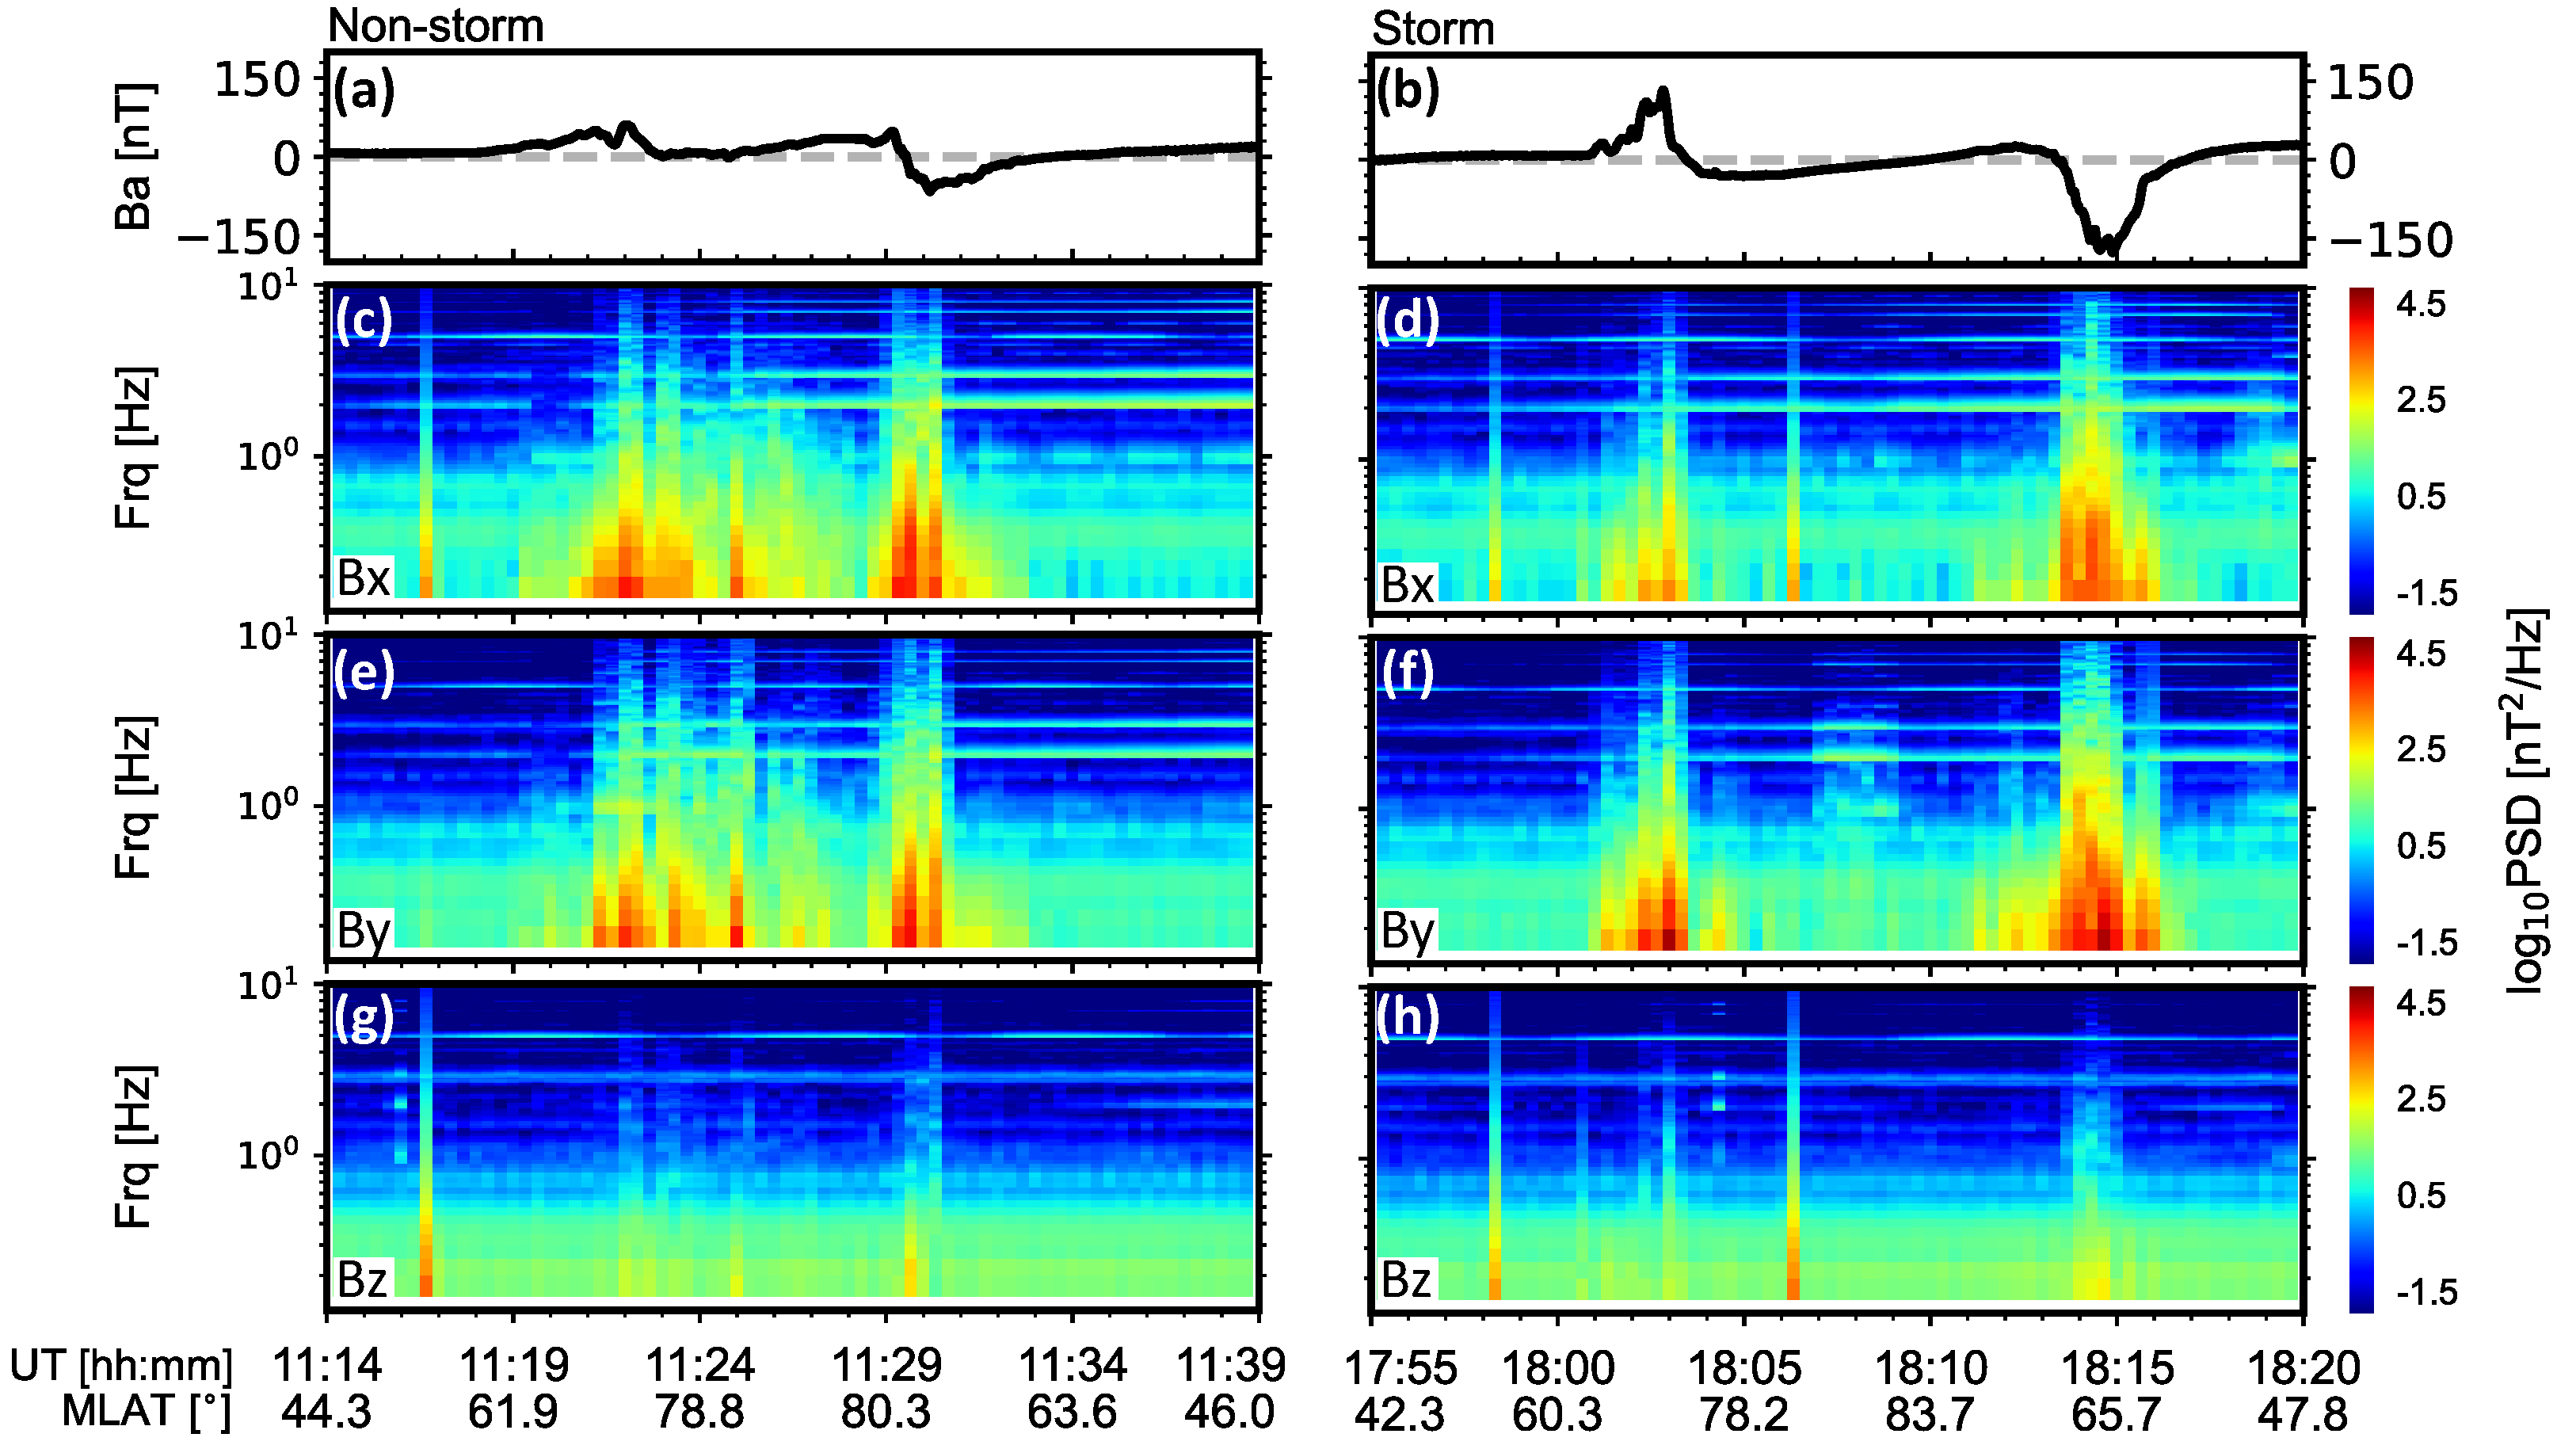
- The auroral-oval waves are broadband in general, with higher power and harder spectra seen at the center of the FACs.
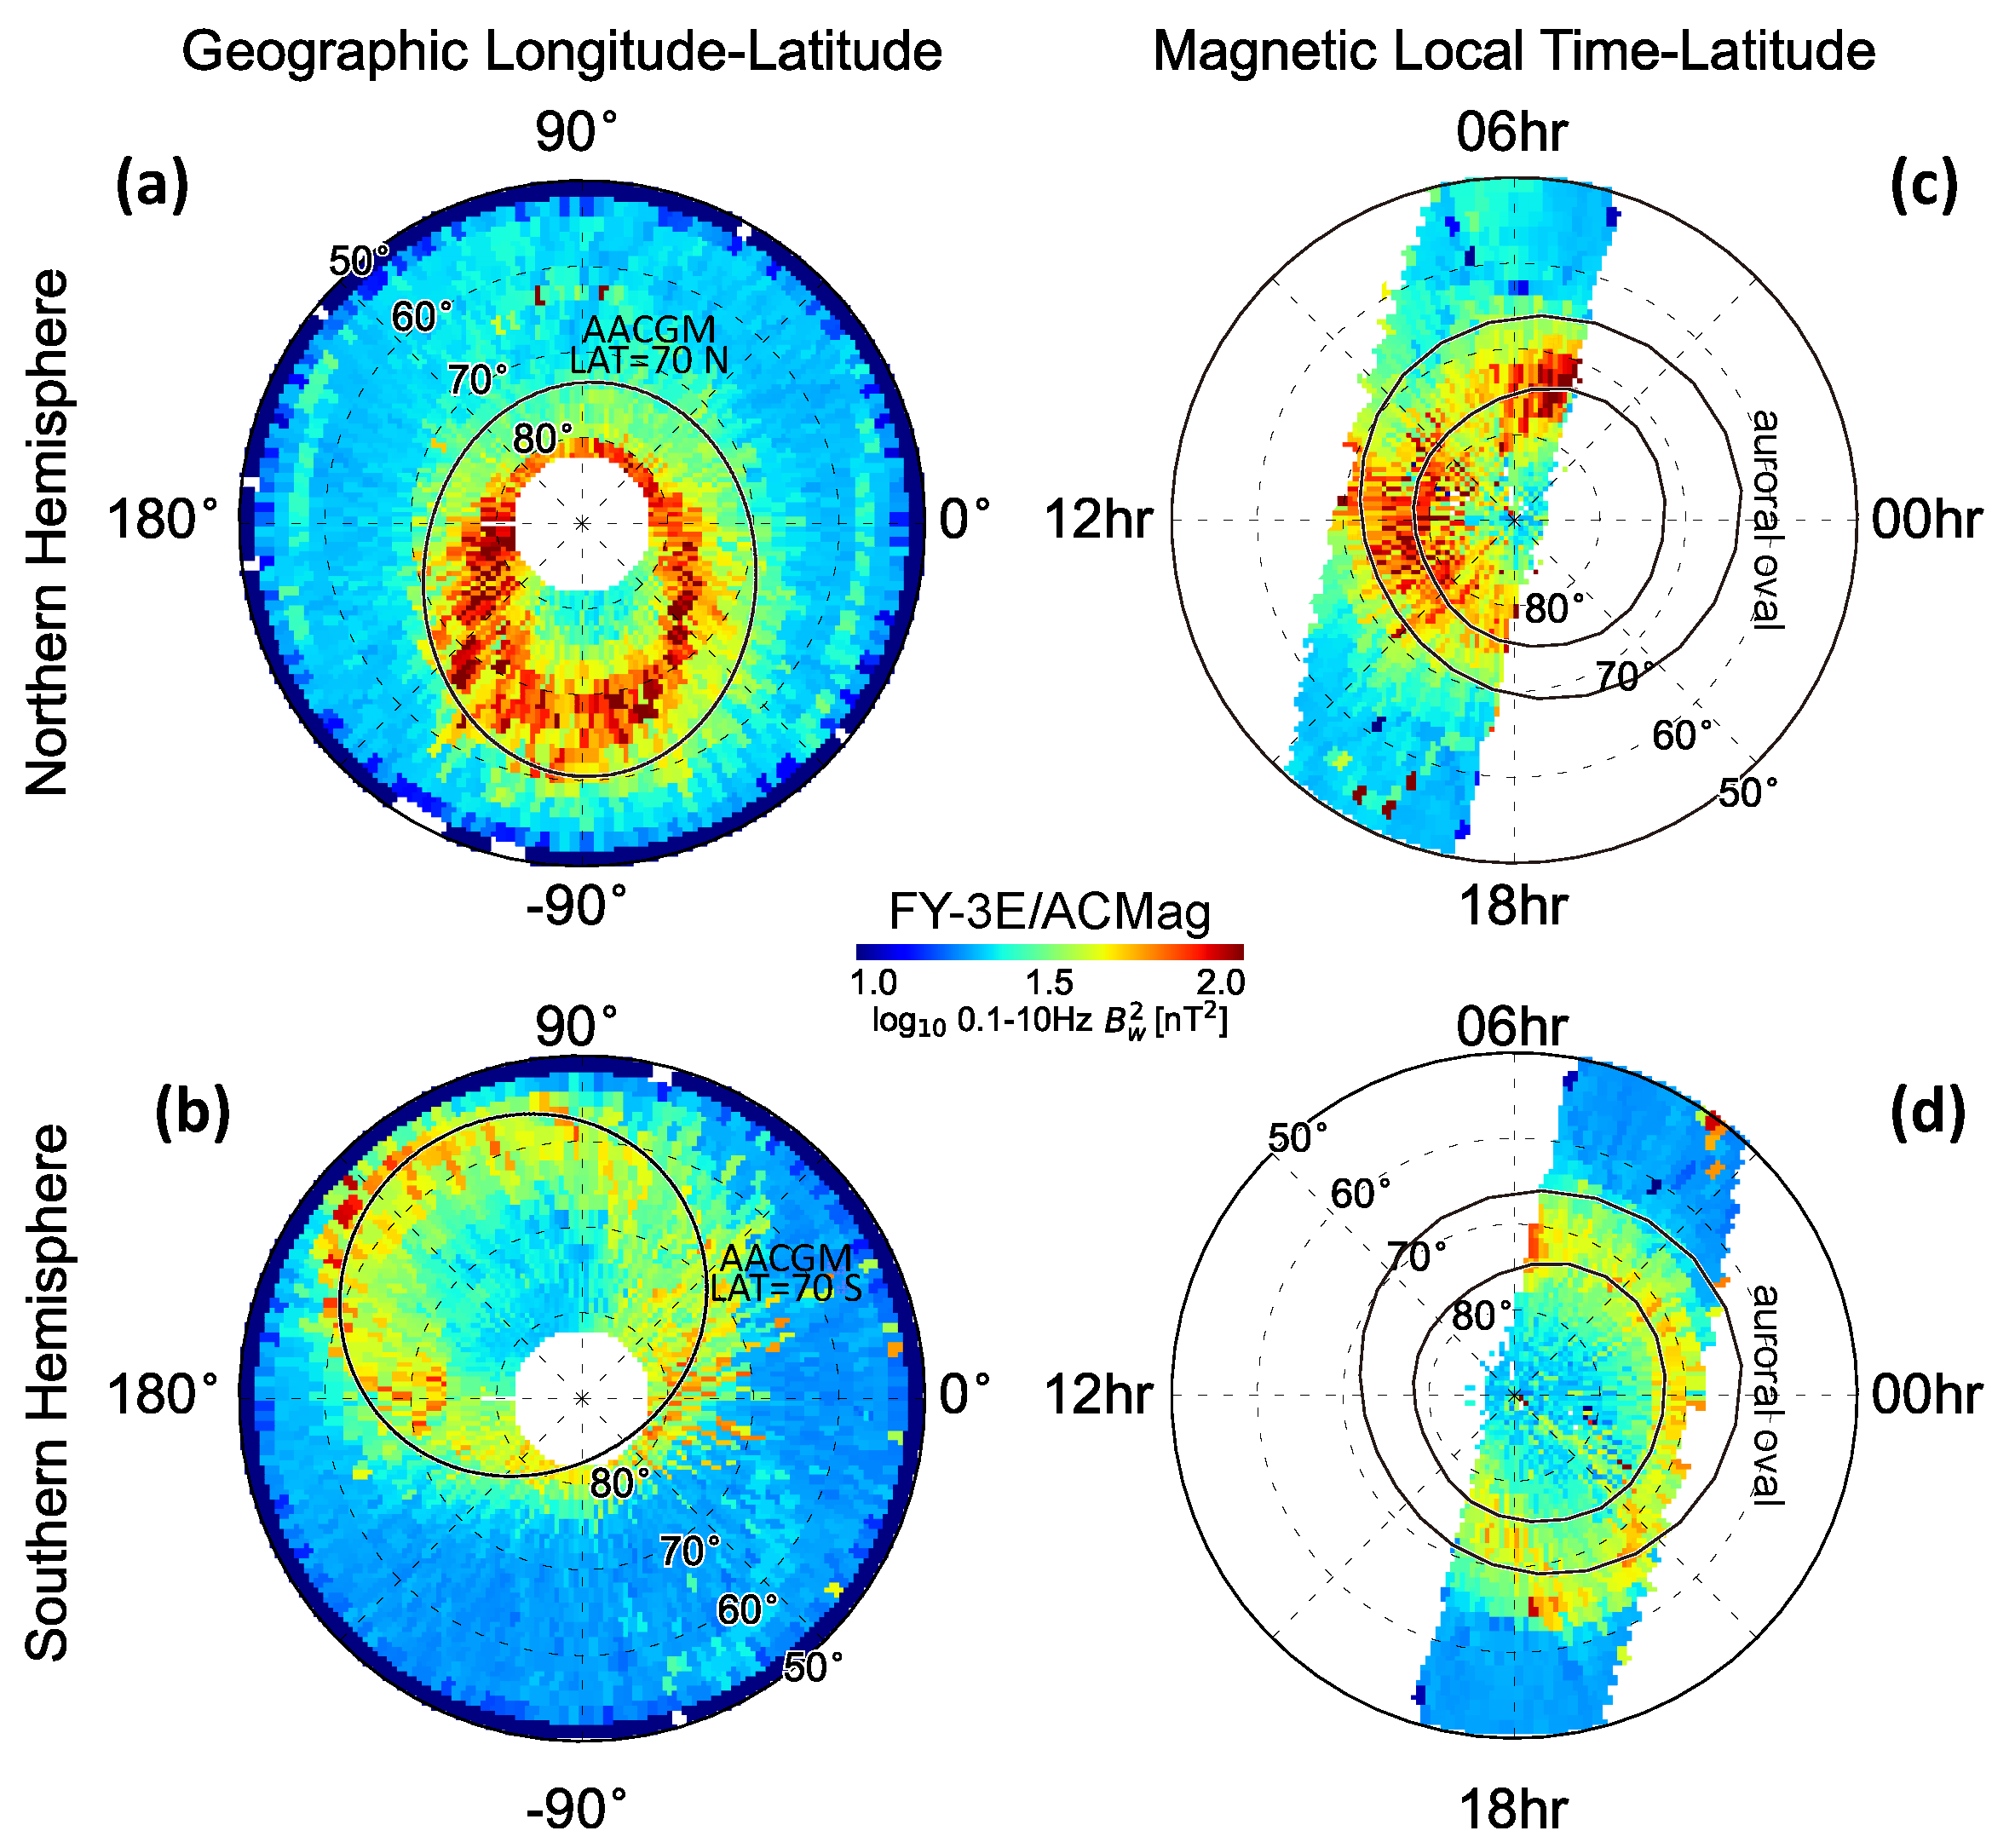
- The auroral-oval waves are stronger in the northern hemisphere than in the southern hemisphere (∼3 times). Moreover, the auroral-oval waves are found to be stronger at the dawnside than at the duskside (∼2 times).
- The auroral-oval waves appear at a higher magnetic latitude in the northern hemisphere than in the southern hemisphere (∼3°), and appear at higher magnetic latitude at the dawnside than at the duskside (∼5°).
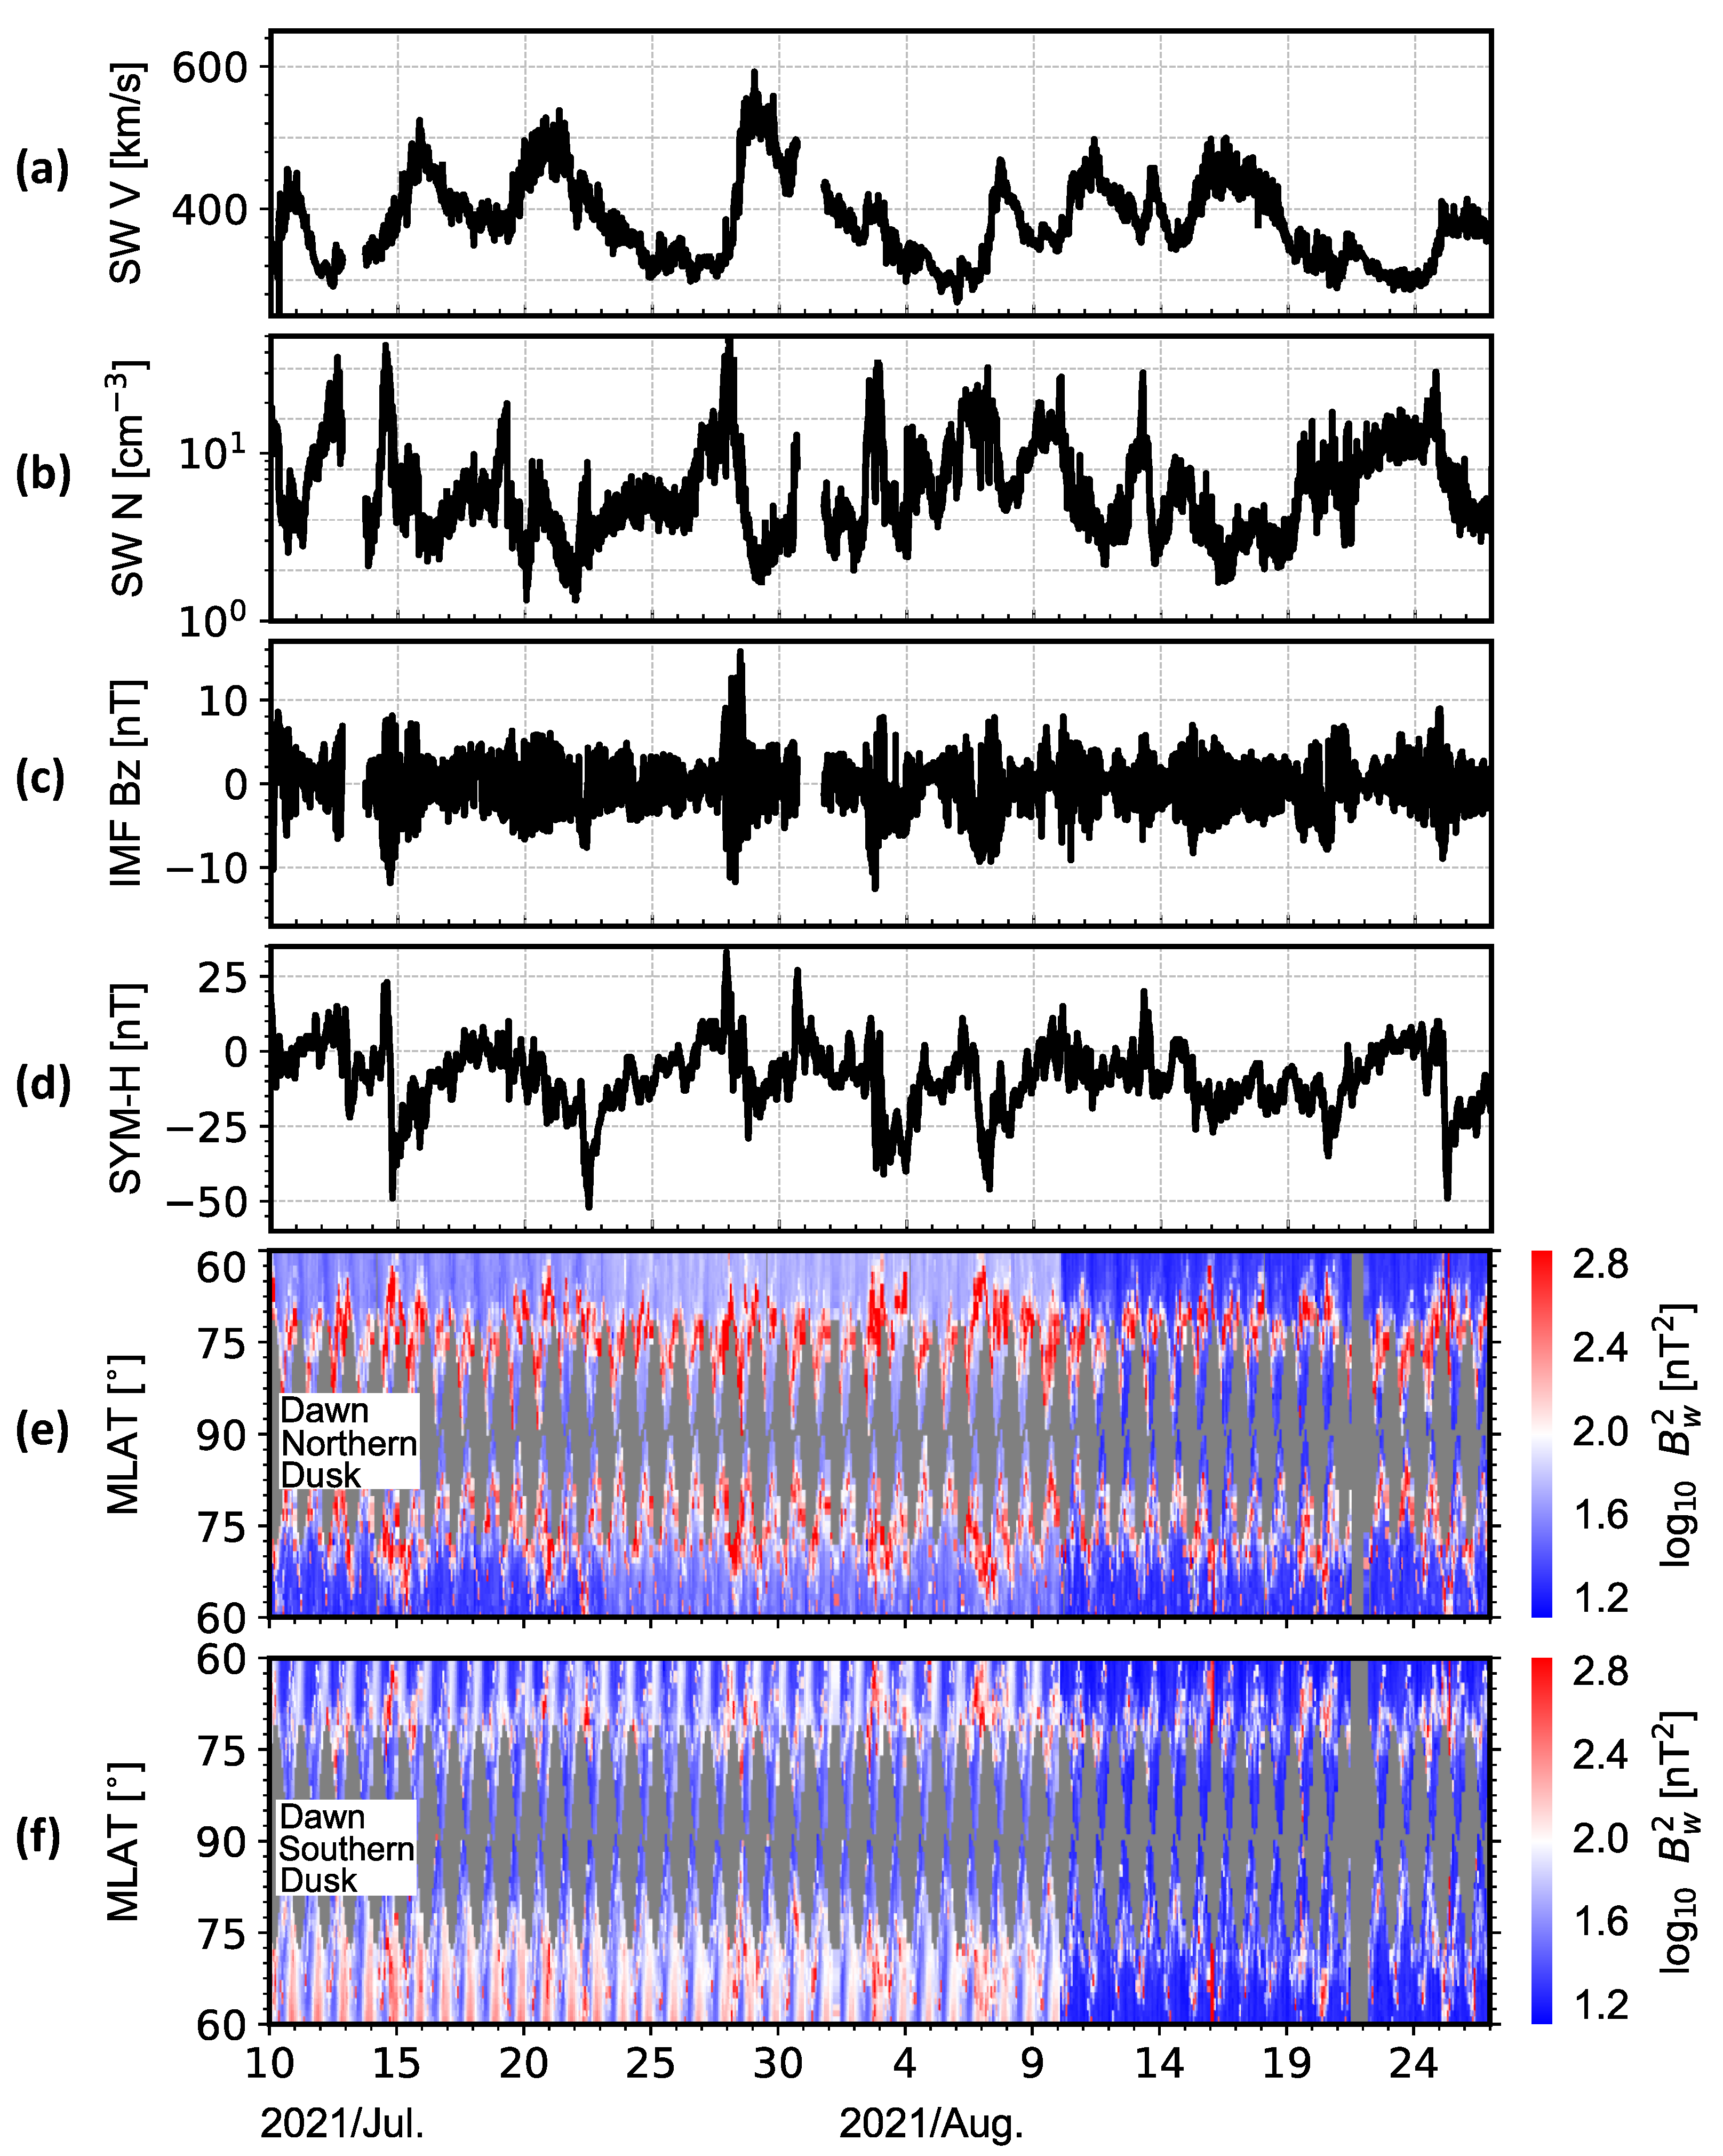
- The power of the auroral-oval waves increases significantly during the CIR-driven storms. In general, the power integrated over 0.1–10 Hz is ∼10 nT during the storms, whereas the quiet-time value is ∼10 nT.
- The auroral-oval waves shift equatorward during CIR-driven storms. The magnetic latitude of the peak of the auroral-oval waves is 65°–70° during storms, and 75°–80° in quiet time.
- The response of the auroral-oval waves to CIR-driven storms is very quick. The corresponding time scale is equal to or even less than the effective revisiting period of the FY-3E satellite, ∼45 min. As a result, as observed by FY-3E/ACMag, the auroral-oval waves grow immediately as the SYM-H index decreases. Furthermore, as the SYM-H index gradually decreases, the auroral-oval waves shift to lower latitudes in a gradual way.
Author Contributions
Funding
Data Availability Statement
Conflicts of Interest
References
- Gonzalez, W.; Joselyn, J.-A.; Kamide, Y.; Kroehl, H.W.; Rostoker, G.; Tsurutani, B.; Vasyliunas, V. What is a geomagnetic storm? J. Geophys. Res. Space Phys. 1994, 99, 5771–5792. [Google Scholar] [CrossRef]
- Akasofu, S.-I. The development of the auroral substorm. Planet. Space Sci. 1964, 12, 273–282. [Google Scholar] [CrossRef]
- Borovsky, J.E. Auroral arc thicknesses as predicted by various theories. J. Geophys. Res. Atmos. 1993, 98, 6101–6138. [Google Scholar] [CrossRef]
- Frey, H.U. Localized aurora beyond the auroral oval. Rev. Geophys. 2007, 45. [Google Scholar] [CrossRef]
- Lysak, R.; Echim, M.; Karlsson, T.; Marghitu, O.; Rankin, R.; Song, Y.; Watanabe, T.-H. Quiet, Discrete Auroral Arcs: Acceleration Mechanisms. Space Sci. Rev. 2020, 216, 1–31. [Google Scholar] [CrossRef]
- Rankin, R.; Gillies, D.; Degeling, A. On the relationship between shear alfven waves, auroral electron acceleration, and field line resonances. Space Sci. Rev. 2021, 217, 1–35. [Google Scholar]
- Zong, Q.-G.; Zhou, X.-Z.; Wang, Y.F.; Li, X.; Song, P.; Baker, D.N.; Fritz, T.A.; Daly, P.W.; Dunlop, M.; Pedersen, A. Energetic electron response to ULF waves induced by interplanetary shocks in the outer radiation belt. J. Geophys. Res. Atmos. 2009, 114, A10204. [Google Scholar] [CrossRef]
- Chaston, C.C.; Peticolas, L.M.; Carlson, C.W.; McFadden, J.P.; Mozer, F.; Wilber, M.; Parks, G.K.; Hull, A.; Ergun, R.E.; Strangeway, R.J.; et al. Energy deposition by alfvén waves into the dayside auroral oval: Cluster and FAST observations. J. Geophys. Res. Atmos. 2005, 110. [Google Scholar] [CrossRef]
- Wahlund, J.-E.; Louarn, P.; Chust, T.; de Feraudy, H.; Roux, A.; Holback, B.; Dovner, P.-O.; Holmgren, G. On ion acoustic turbulence and the nonlinear evolution of kinetic alfvén waves in aurora. Geophys. Res. Lett. 1994, 21, 1831–1834. [Google Scholar] [CrossRef]
- Keiling, A.; Wygant, J.R.; Cattell, C.A.; Mozer, F.S.; Russell, C.T. The Global Morphology of Wave Poynting Flux: Powering the Aurora. Science 2003, 299, 383–386. [Google Scholar] [CrossRef]
- Keiling, A.; Thaller, S.; Wygant, J.; Dombeck, J. Assessing the global alfvén wave power flow into and out of the auroral acceleration region during geomagnetic storms. Sci. Adv. 2019, 5, eaav8411. [Google Scholar] [CrossRef] [PubMed]
- Pakhotin, I.P.; Mann, I.R.; Xie, K.; Burchill, J.K.; Knudsen, D.J. Northern preference for terrestrial electromagnetic energy input from space weather. Nat. Commun. 2021, 12, 1–9. [Google Scholar] [CrossRef] [PubMed]
- Kim, K.-H.; Kim, G.-J.; Kwon, H.-J. Distribution of equatorial alfvén velocity in the magnetosphere: A statistical analysis of THEMIS observations. Earth Planets Space 2018, 70, 174. [Google Scholar] [CrossRef]
- Mann, I.R.; Lee, E.A.; Claudepierre, S.G.; Fennell, J.F.; Degeling, A.; Rae, I.J.; Baker, D.N.; Reeves, G.D.; Spence, H.E.; Ozeke, L.G.; et al. Discovery of the action of a geophysical synchrotron in the Earth’s Van Allen radiation belts. Nat. Commun. 2013, 4, 2795. [Google Scholar] [CrossRef]
- Liu, Z.; Zong, Q.; Zhou, X.; Hao, Y.X.; Yau, A.W.; Zhang, H.; Chen, X.; Fu, S.Y.; Pollock, C.J.; Le, G.; et al. ULF Waves Modulating and Acting as Mass Spectrometer for Dayside Ionospheric Outflow Ions. Geophys. Res. Lett. 2019, 46, 8633–8642. [Google Scholar] [CrossRef]
- Zong, Q.; Rankin, R.; Zhou, X. The interaction of ultra-low-frequency pc3-5 waves with charged particles in Earth’s magnetosphere. Rev. Mod. Plasma Phys. 2017, 1, 10. [Google Scholar] [CrossRef]
- Liu, Z.; Zong, Q.; Zhou, X.; Zhu, Y.; Gu, S. Pitch Angle Structures of Ring Current Ions Induced by Evolving Poloidal Ultra-Low Frequency Waves. Geophys. Res. Lett. 2020, 47, e2020GL087203. [Google Scholar] [CrossRef]
- Kataoka, R.; Chaston, C.C.; Knudsen, D.; Lynch, K.A.; Lysak, R.L.; Song, Y.; Rankin, R.; Murase, K.; Sakanoi, T.; Semeter, J.; et al. Small-Scale Dynamic Aurora. Space Sci. Rev. 2021, 217, 1–32. [Google Scholar] [CrossRef]
- Strangeway, R.J.; Ergun, R.E.; Su, Y.; Carlson, C.W.; Elphic, R.C. Factors controlling ionospheric outflows as observed at intermediate altitudes. J. Geophys. Res. Atmos. 2005, 110. [Google Scholar] [CrossRef]
- Liu, Z.; Zong, Q. Ionospheric Oxygen Outflows Directly Injected Into the Inner Magnetosphere: Van Allen Probes Statistics. J. Geophys. Res. Space Phys. 2022, 127, e2022JA030611. [Google Scholar] [CrossRef]
- Yao, Y.; Chaston, C.C.; Glassmeier, K.; Angelopoulos, V. Electromagnetic waves on ion gyro-radii scales across the magnetopause. Geophys. Res. Lett. 2011, 38, L09102. [Google Scholar] [CrossRef]
- Chaston, C.C.; Bonnell, J.W.; Kletzing, C.A.; Hospodarsky, G.B.; Wygant, J.R.; Smith, C.W. Broadband low-frequency electromagnetic waves in the inner magnetosphere. J. Geophys. Res. Space Phys. 2015, 120, 8603–8615. [Google Scholar] [CrossRef]
- Hu, Z.-J.; Yang, Q.-J.; Liang, J.-M.; Hu, H.-Q.; Zhang, B.-C.; Yang, H.-G. Variation and modeling of ultraviolet auroral oval boundaries associated with interplanetary and geomagnetic parameters. Space Weather 2017, 15, 606–622. [Google Scholar] [CrossRef]
- Borovsky, J.E.; Denton, M. Differences between CME-driven storms and CIR-driven storms. J. Geophys. Res. Atmos. 2006, 111. [Google Scholar] [CrossRef]
- Yu, X.-Q.; Huang, C.; Xiao, C.-J.; Li, J.-W.; Liu, S.; Wang, J.-D.; Li, Y.-P.; Qu, Y.-N.; Wang, Y.-F.; Chen, H.-F.; et al. AC vector magnetometer for space-based applications using low-resource magneto-impedance sensor. Sci. China Technol. Sci. 2023, in press. [Google Scholar]
- Yu, X.-Q.; Li, J.-W.; Xiao, C.-J.; Huang, C.; Liu, S.; Wang, J.-D.; Li, Y.-P.; Qu, Y.; Wang, Y.-F.; Chen, H.-F.; et al. Vector magnetometer for space applications based on a low-resource magnetoresistance. Acta Sci. Nat. Univ. Pekin. 2023. [Google Scholar] [CrossRef]
- Ye, Y.; Zou, H.; Wang, Y.; Qin, J.; Shi, W.; Zou, J.; Zhong, W.; Zong, Q.; Fu, S. A cross-type imaging electron spectrometer. Sci. China Technol. Sci. 2023, 66, 641–653. [Google Scholar] [CrossRef]
- Lühr, H.; Park, J.; Gjerloev, J.W.; Rauberg, J.; Michaelis, I.; Merayo, J.M.G.; Brauer, P. Field-aligned currents’ scale analysis performed with the swarm constellation. Geophys. Res. Lett. 2015, 42, 1–8. [Google Scholar] [CrossRef]
- Pakhotin, I.P.; Mann, I.R.; Lysak, R.L.; Knudsen, D.J.; Gjerloev, J.W.; Rae, I.J.; Forsyth, C.; Murphy, K.R.; Miles, D.M.; Ozeke, L.G.; et al. Diagnosing the Role of alfvén Waves in Magnetosphere-Ionosphere Coupling: Swarm Observations of Large Amplitude Nonstationary Magnetic Perturbations During an Interval of Northward IMF. J. Geophys. Res. Space Phys. 2018, 123, 326–340. [Google Scholar] [CrossRef]
- Pakhotin, I.; Mann, I.; Knudsen, D.; Lysak, R.; Burchill, J. Diagnosing the Role of alfvén Waves in Global Field-Aligned Current System Dynamics During Southward IMF: Swarm Observations. J. Geophys. Res. Space Phys. 2020, 125, e2019JA027277. [Google Scholar] [CrossRef]
- Golovchanskaya, I.V.; Ostapenko, A.A.; Kozelov, B.V. Relationship between the high-latitude electric and magnetic turbulence and the Birkeland field-aligned currents. J. Geophys. Res. Atmos. 2006, 111. [Google Scholar] [CrossRef]
- Consolini, G.; De Michelis, P.; Alberti, T.; Giannattasio, F.; Coco, I.; Tozzi, R.; Chang, T.T.S. On the Multifractal Features of Low-Frequency Magnetic Field Fluctuations in the Field-Aligned Current Ionospheric Polar Regions: Swarm Observations. J. Geophys. Res. Space Phys. 2020, 125, e2019JA027429. [Google Scholar] [CrossRef]
- Iijima, T.; Potemra, T.A. Large-scale characteristics of field-aligned currents associated with substorms. J. Geophys. Res. Atmos. 1978, 83, 599–615. [Google Scholar] [CrossRef]
- Shepherd, S.G. Altitude-adjusted corrected geomagnetic coordinates: Definition and functional approximations. J. Geophys. Res. Space Phys. 2014, 119, 7501–7521. [Google Scholar] [CrossRef]
- Laundal, K.M.; Cnossen, I.; Milan, S.E.; Haaland, S.; Coxon, J.; Pedatella, N.; Förster, M.; Reistad, J.P. North–south asymmetries in earth’s magnetic field. Space Sci. Rev. 2017, 206, 225–257. [Google Scholar] [CrossRef]
- Richardson, I.G. Solar wind stream interaction regions throughout the heliosphere. Living Rev. Sol. Phys. 2018, 15, 1. [Google Scholar] [CrossRef]
- Cane, H.; Richardson, I. Interplanetary coronal mass ejections in the near-earth solar wind during 1996–2002. J. Geophys. Res. Space Phys. 2003, 108. [Google Scholar] [CrossRef]
- Knipp, D.; Kilcommons, L.; Hairston, M.; Coley, W.R. Hemispheric Asymmetries in Poynting Flux Derived From DMSP Spacecraft. Geophys. Res. Lett. 2021, 48, e2021GL094781. [Google Scholar] [CrossRef]
- Akasofu, S.-I. Energy coupling between the solar wind and the magnetosphere. Space Sci. Rev. 1981, 28, 121–190. [Google Scholar] [CrossRef]
- Chaston, C.C.; Bonnell, J.W.; Carlson, C.W.; McFadden, J.P.; Ergun, R.E.; Strangeway, R.J. Properties of small-scale alfvén waves and accelerated electrons from FAST. J. Geophys. Res. Atmos. 2003, 108. [Google Scholar] [CrossRef]
- Watt, C.E.J.; Rankin, R. Electron Trapping in Shear alfvén Waves that Power the Aurora. Phys. Rev. Lett. 2009, 102, 045002. [Google Scholar] [CrossRef] [PubMed]


Disclaimer/Publisher’s Note: The statements, opinions and data contained in all publications are solely those of the individual author(s) and contributor(s) and not of MDPI and/or the editor(s). MDPI and/or the editor(s) disclaim responsibility for any injury to people or property resulting from any ideas, methods, instructions or products referred to in the content. |
© 2023 by the authors. Licensee MDPI, Basel, Switzerland. This article is an open access article distributed under the terms and conditions of the Creative Commons Attribution (CC BY) license (https://creativecommons.org/licenses/by/4.0/).
Share and Cite
Liu, Z.-Y.; Zong, W.-G.; Zong, Q.-G.; Wang, J.-S.; Yu, X.-Q.; Wang, Y.-F.; Zou, H.; Fu, S.-Y.; Yue, C.; Hu, Z.-J.; et al. The Response of Auroral-Oval Waves to CIR-Driven Recurrent Storms: FY-3E/ACMag Observations. Universe 2023, 9, 213. https://doi.org/10.3390/universe9050213
Liu Z-Y, Zong W-G, Zong Q-G, Wang J-S, Yu X-Q, Wang Y-F, Zou H, Fu S-Y, Yue C, Hu Z-J, et al. The Response of Auroral-Oval Waves to CIR-Driven Recurrent Storms: FY-3E/ACMag Observations. Universe. 2023; 9(5):213. https://doi.org/10.3390/universe9050213
Chicago/Turabian StyleLiu, Zhi-Yang, Wei-Guo Zong, Qiu-Gang Zong, Jin-Song Wang, Xiang-Qian Yu, Yong-Fu Wang, Hong Zou, Sui-Yan Fu, Chao Yue, Ze-Jun Hu, and et al. 2023. "The Response of Auroral-Oval Waves to CIR-Driven Recurrent Storms: FY-3E/ACMag Observations" Universe 9, no. 5: 213. https://doi.org/10.3390/universe9050213