
Fermionic Dark Matter: Physics, Astrophysics, and Cosmology
 ,
,  , and
, and
Abstract
:1. Introduction
- (i)
- (ii)
- The case of fully degenerate fermions (i.e., in the zero temperature approximation under the Thomas–Fermi approach) with masses few eV [23,24,25,26], or the case of self-gravitating fermions but distributed in the opposite limit, i.e., in the dilute regime (i.e., in Boltzmannian-like fashion), which, however, do not imply an explicit particle mass dependence when contrasted with halo observables (see, e.g., [27]).
- (iii)
- The more general case of self-gravitating fermions in a semi-degenerate regime (i.e., at finite temperature), which can include both regimes in the same system, i.e., to be highly degenerate in the center and more diluted in the outer region (see [26,28,29,30,31] for a list of generic works). Recently, the phenomenology of this theory regarding the study of DM in real galaxies (using specific boundary conditions from observations) was developed in full general relativity either including the escape of particles [32,33,34,35,36,37] or not [38], and leading to particle masses in the range of few 10–100 keV. The latter model is usually referred to in the literature as the Ruffini–Argüelles–Rueda (RAR) model (it has been sometimes called the relativistic fermionic–King model).
2. The RAR Model: Theoretical Framework
3. Constraints on Fermionic DM from the Milky Way
3.1. The Milky Way Rotation Curves
- (i)
- A central region (–2 pc) of young stars and molecular gas whose dynamics are dictated by a dark and compact object centered at Sgr A*.
- (ii)
- An intermediate spheroidal bulge structure (– pc) composed mostly of older stars, with inner and main mass distributions explained by the exponential spheroid model.
- (iii)
- An extended flat disk (– pc) including star-forming regions, dust, and gas, whose surface mass density is described by an exponential law.
- (iv)
- A spherical halo (– pc) dominated by DM, followed by a decreasing density tail with a slope steeper than .
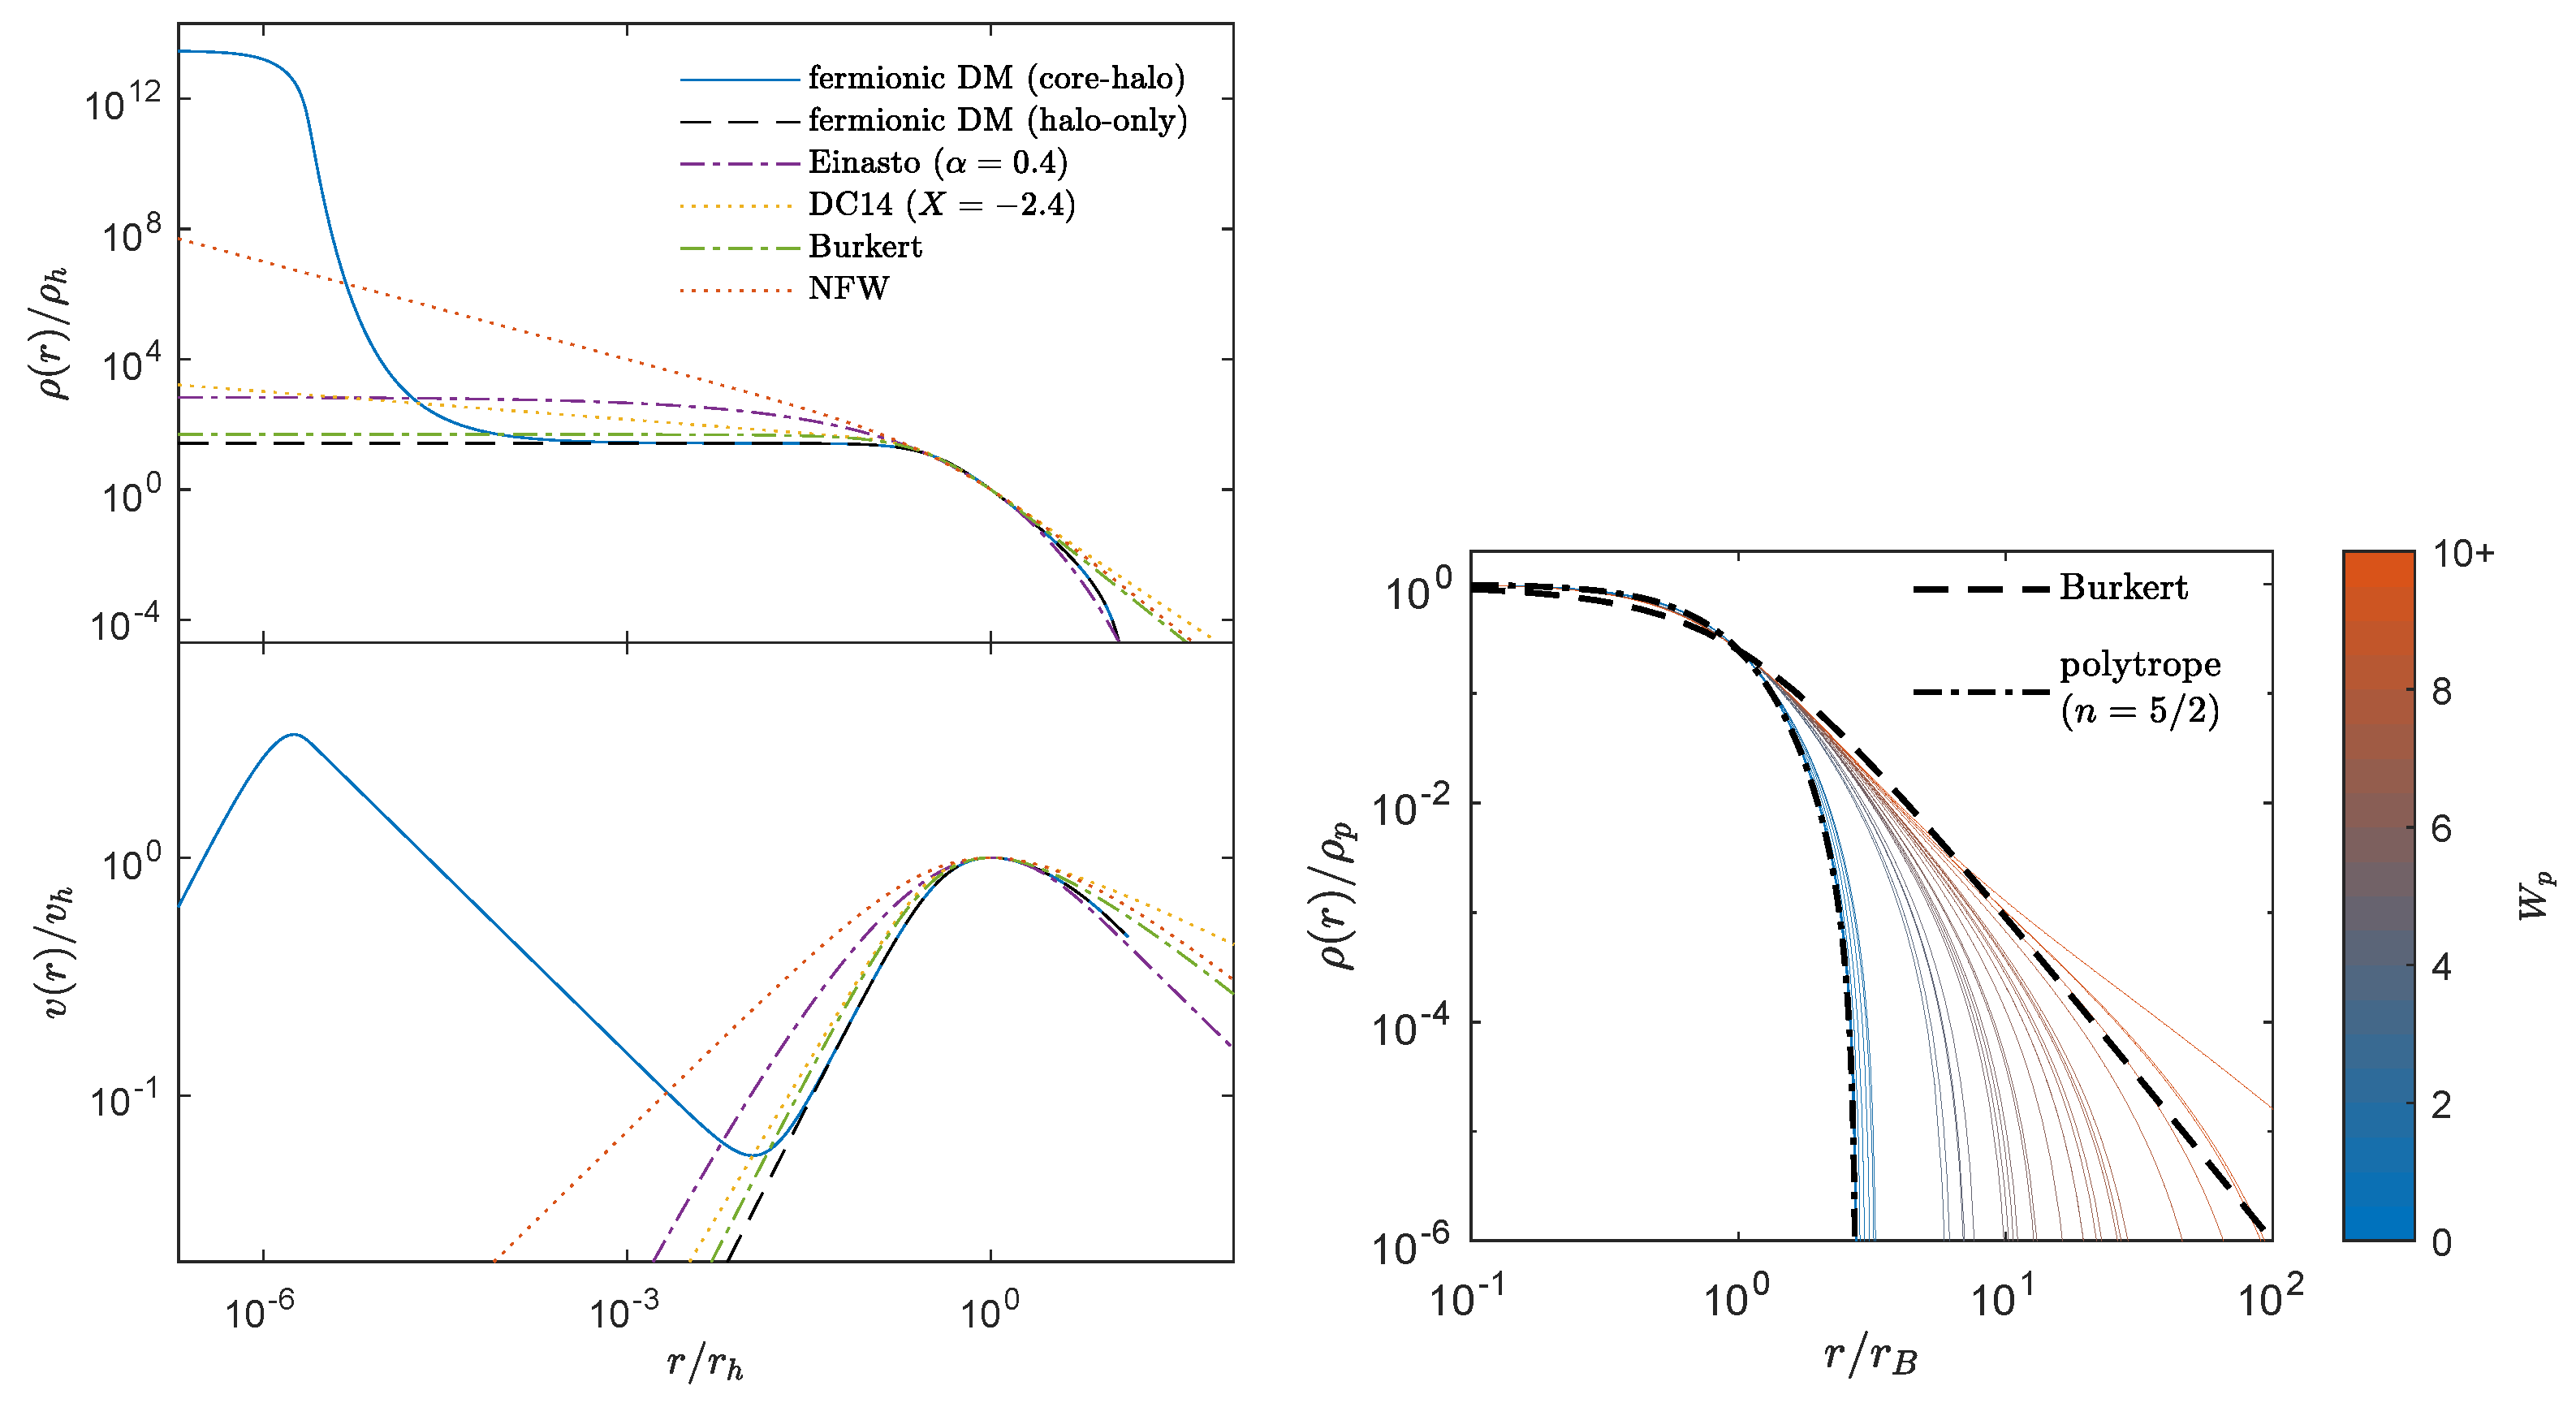
- A DM core with radius (defined at the first maximum of the twice-peaked rotation curve), whose value is shown to be inversely proportional to the particle mass m, in which the density is nearly uniform. This central core is supported against gravity by the fermion degeneracy pressure, and general relativistic effects are appreciable.
- Then, there is an intermediate region characterized by a sharply decreasing density where quantum corrections are still important, followed by an extended and diluted plateau. This region extends until the halo scale length is achieved (defined at the second maximum of the rotation curve).
- Finally, the DM density reaches a Boltzmann regime supported by thermal pressure with negligible general relativistic effects. It shows a behavior with that is due to the phase–space distribution cutoff.2 This leads to a DM halo bounded in radius (i.e., occurs when the particle escape energy approaches zero).
- A linearly increasing circular velocity reaching a first maximum at the quantum core radius .
- A Keplerian power law, , with decreasing behavior representing the transition from quantum degeneracy to the dilute regime. After a minimum, highlighting the plateau, the circular velocity follows a linear trend until reaching the second maximum, which is adopted as the one-halo scale length in the fermionic DM model.
- A decreasing behavior consistent with the power-law density tail due to the cutoff constraint.
3.2. The Orbits of S2 and G2
- (i)
- all the available time-dependent data of the position (orbit) and line-of-sight radial velocity (redshift function z) of S2,
- (ii)
- the combination of the special and general relativistic redshift measured for S2,
- (iii)
- the currently available data on the orbit and z of G2,
- (iv)
- its post-pericenter passage deceleration without introducing a drag force.
3.3. The Orbits of All S-Cluster Stars
3.4. The Precession of the S2 Orbit
- to propose a new paradigm for SMBH formation and growth in a cosmological framework, which is neither based on the baryonic matter nor early Universe physics;
- to study the problem of disk accretion around such DM cores starting with the generalization of the Shakura and Sunyaev disk equations in the presence of a high concentration of regular matter (i.e., instead of a singularity);
- to use fully relativistic ray-tracing techniques to predict the corresponding shadow-like images around these fermion cores and compare them with the shapes and sizes of the ones obtained by the EHT.
4. Fermionic DM in Other Galaxy Types
4.1. The RAR Model in Dwarf, Spiral, and Elliptical Galaxies, and Galaxy Clusters
4.2. Typical dSph Galaxies
4.3. Typical Spiral Galaxies
4.4. Typical Elliptical Galaxies
4.5. Typical Galaxy Clusters
- (i)
- Typical dwarf galaxies can harbor dense and compact DM cores with masses from up to (see Figure 8), offering a natural explanation for the so-called intermediate-mass BHs (IMBH). Since the total mass of the typical dSphs here analyzed is below the critical mass of core collapse (i.e., ), the core can never become critical and thus will never collapse to a BH. Therefore, the RAR model predicts (for a particle mass of keV) that dSph galaxies can never develop a BH at their center, a result that may explain why these galaxies never become active.
- (ii)
- Typical spiral and elliptical galaxies can harbor denser and more compact DM cores (with respect to dSphs) with masses from up to (see Figure 8). Thus, they offer a natural alternative to the supermassive BH hypothesis (see Section 3 for the MW). Since the total mass in spirals and ellipticals is much larger than , the core mass can become critical and eventually collapse towards an SMBH of ∼, which may then grow even larger by accretion.
- (iii)
- Typical bright clusters of galaxies (BCGs) can harbor dense and compact DM cores with masses from up to (see Figure 8). The implications of this prediction for BCGs are still unclear, mainly given the limited spatial resolution achieved by actual observational capabilities below the central kpc. More work is needed (for example, using strong lensing observations) to evaluate whether galaxy clusters show an enhancement in DM density similar to the one predicted by the RAR model.
- (iv)
- By combining the range of DM core masses, inner halo densities, and total halo masses as predicted by the RAR model across all of these systems, it is possible to test whether or not this model can answer different universal scaling relations. This point is studied in the next section (and further detailed in [33,37]).
5. Universal Galaxy Scaling Relations
5.1. The Ferrarese Relation
5.2. The DM Surface Density Relation (DSR)
5.3. The Radial Acceleration and Mass Discrepancy Acceleration Relations
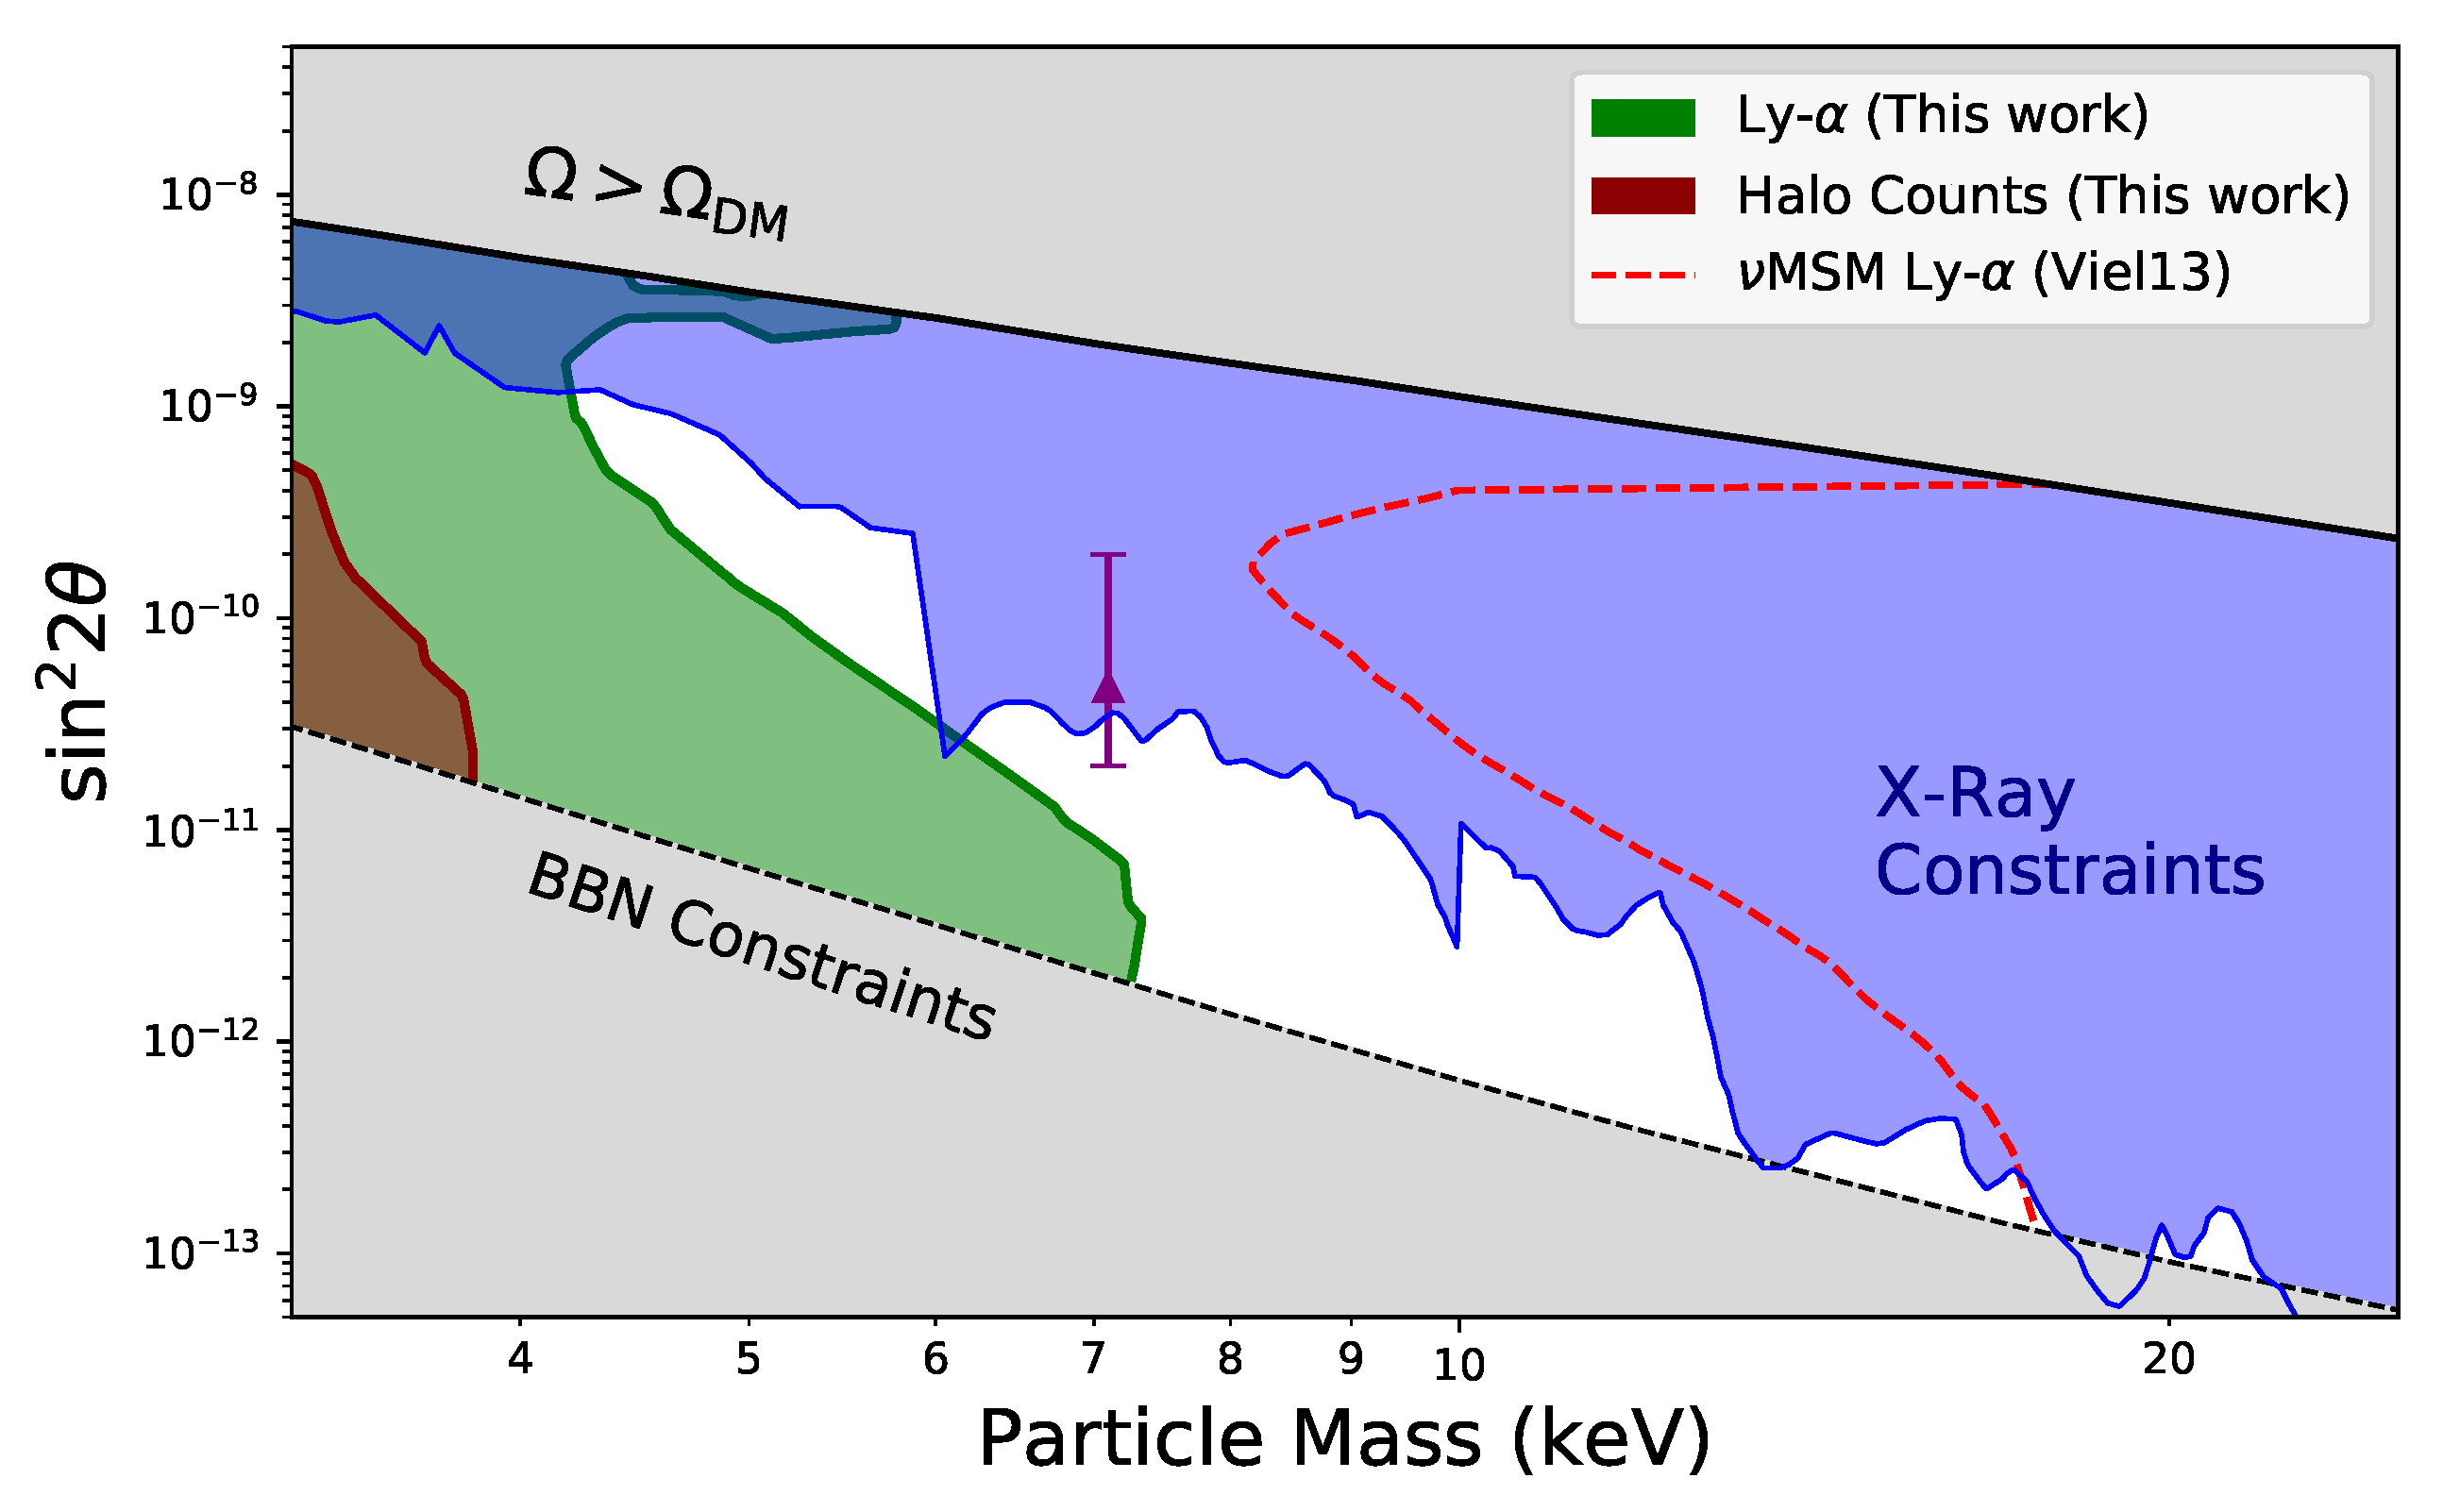
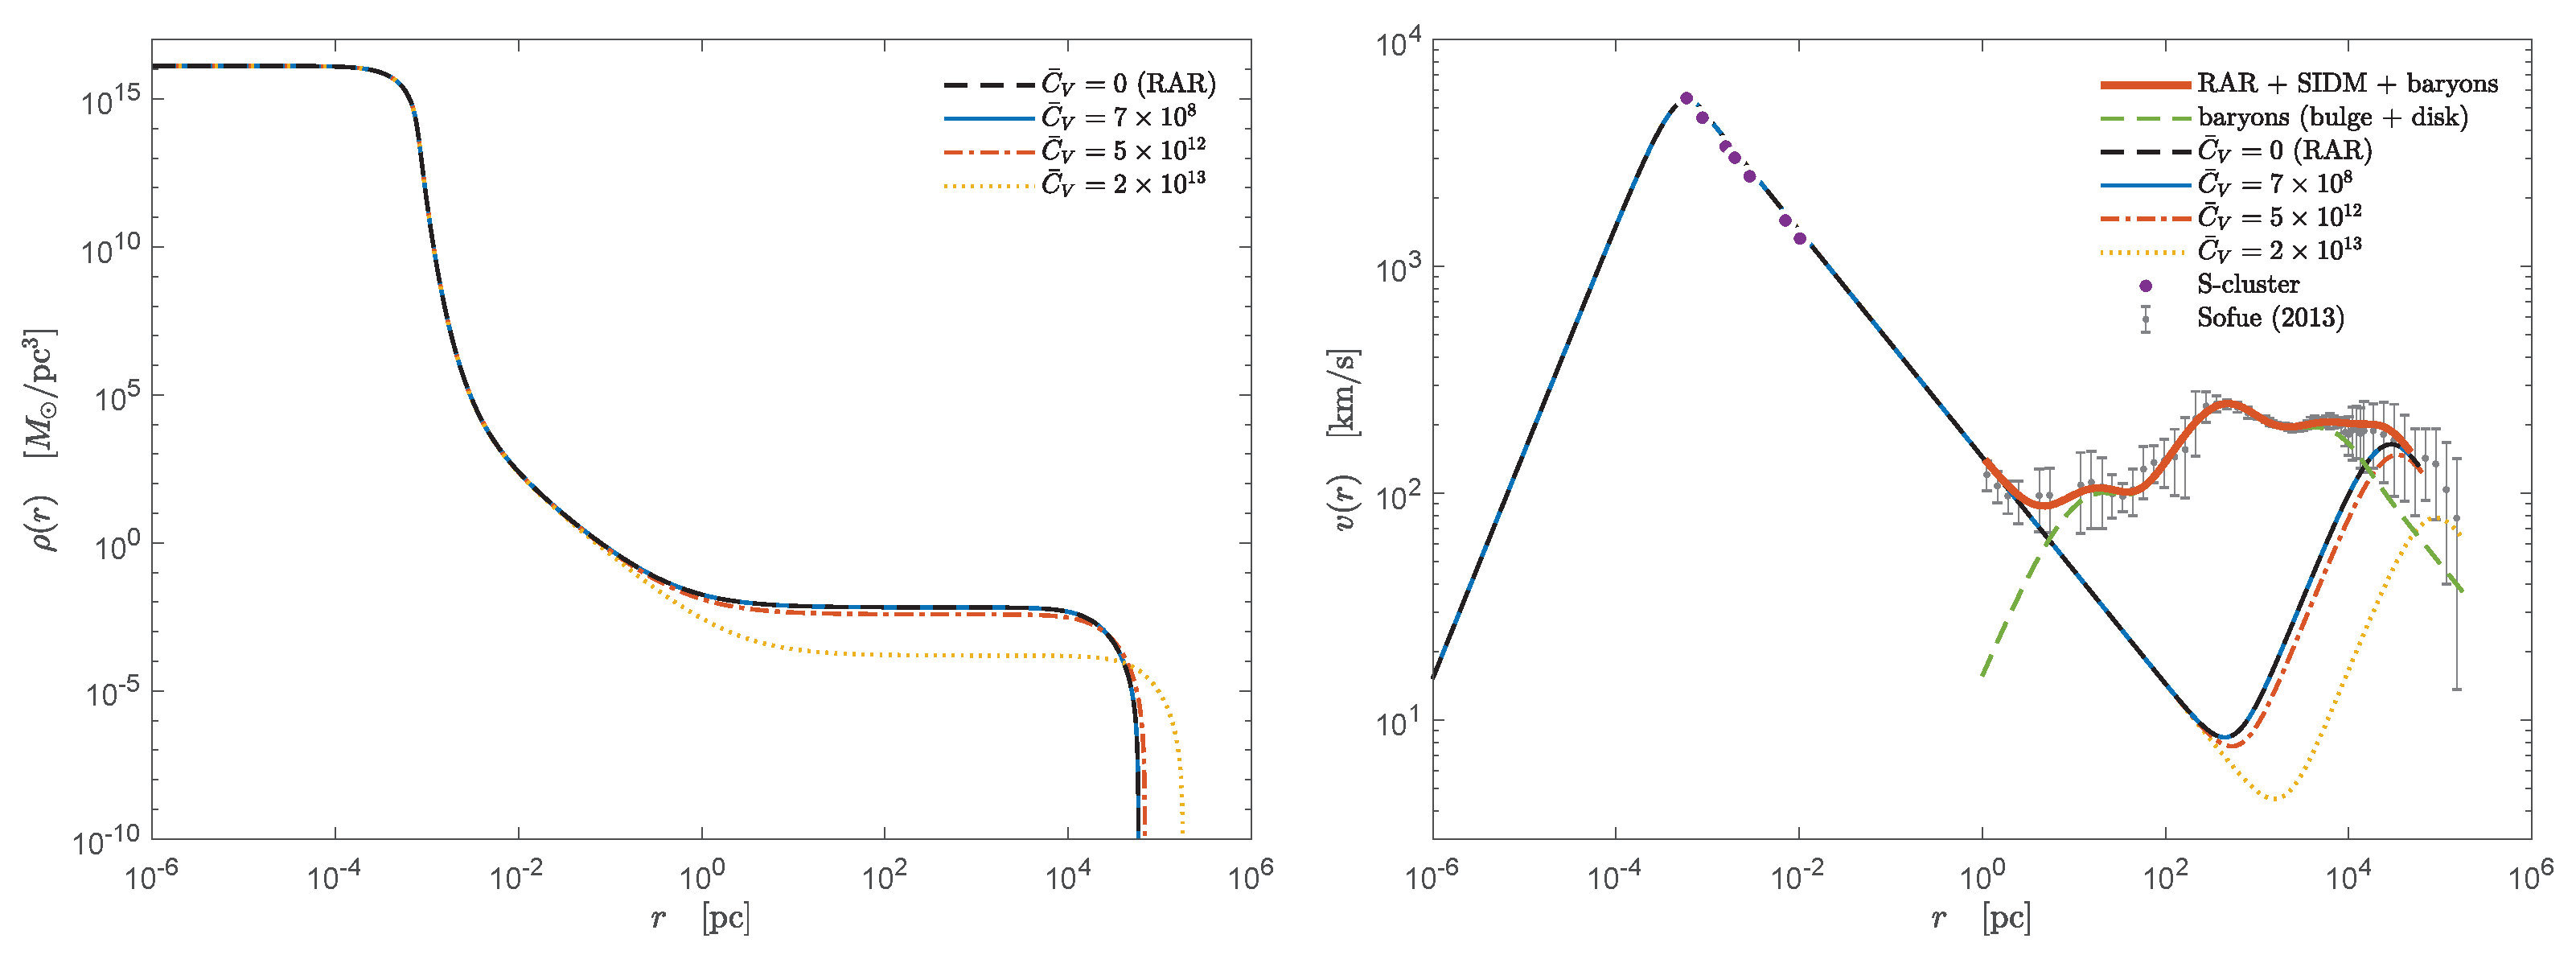
6. Fermionic DM and Particle Physics
Are the Sterile Neutrinos the Fermions of the RAR Model?
7. Fermionic DM and Cosmology
7.1. Formation and Stability of Fermionic DM Halos in a Cosmological Framework
7.2. Interactions in Warm DM: A View from Cosmological Perturbation Theory
8. Additional Fermionic DM Probes
8.1. Gravitational Lensing
8.2. Dynamical Friction
8.3. Gravitational Collapse of DM Cores and SMBH Formation
- (i)
- Channels that advocate for a baryonic matter role (gas and stars). (ia) Population III stars and (ib) direct collapse to a BH (DCBH). Scenarios (ia) produce BH seeds ∼ [104,105], so very high accretion rates are needed to grow them to in a few billion years. Simulations show that BHs of cannot grow to at cosmological redshift due to radiative feedback [101]. DCBH scenarios (ib) produce BH seeds in the range – [106,107,108]. Hydrodynamic N-body simulations show some preference for DCBH scenarios [101,109], although numerical and ad hoc assumptions limit the results’ generality [101].
- (ii)
- Early Universe channels where BH seeds form before galaxy formation. They include primordial BHs [110] and exotic candidates such as topological defects [111]. However, these scenarios are difficult to prove or disprove since these processes are hypothesized to occur in early cosmological epochs not accessed by observations.
9. Conclusions
Funding
Data Availability Statement
Conflicts of Interest
Appendix A. Equations of Motion and Effective Potential
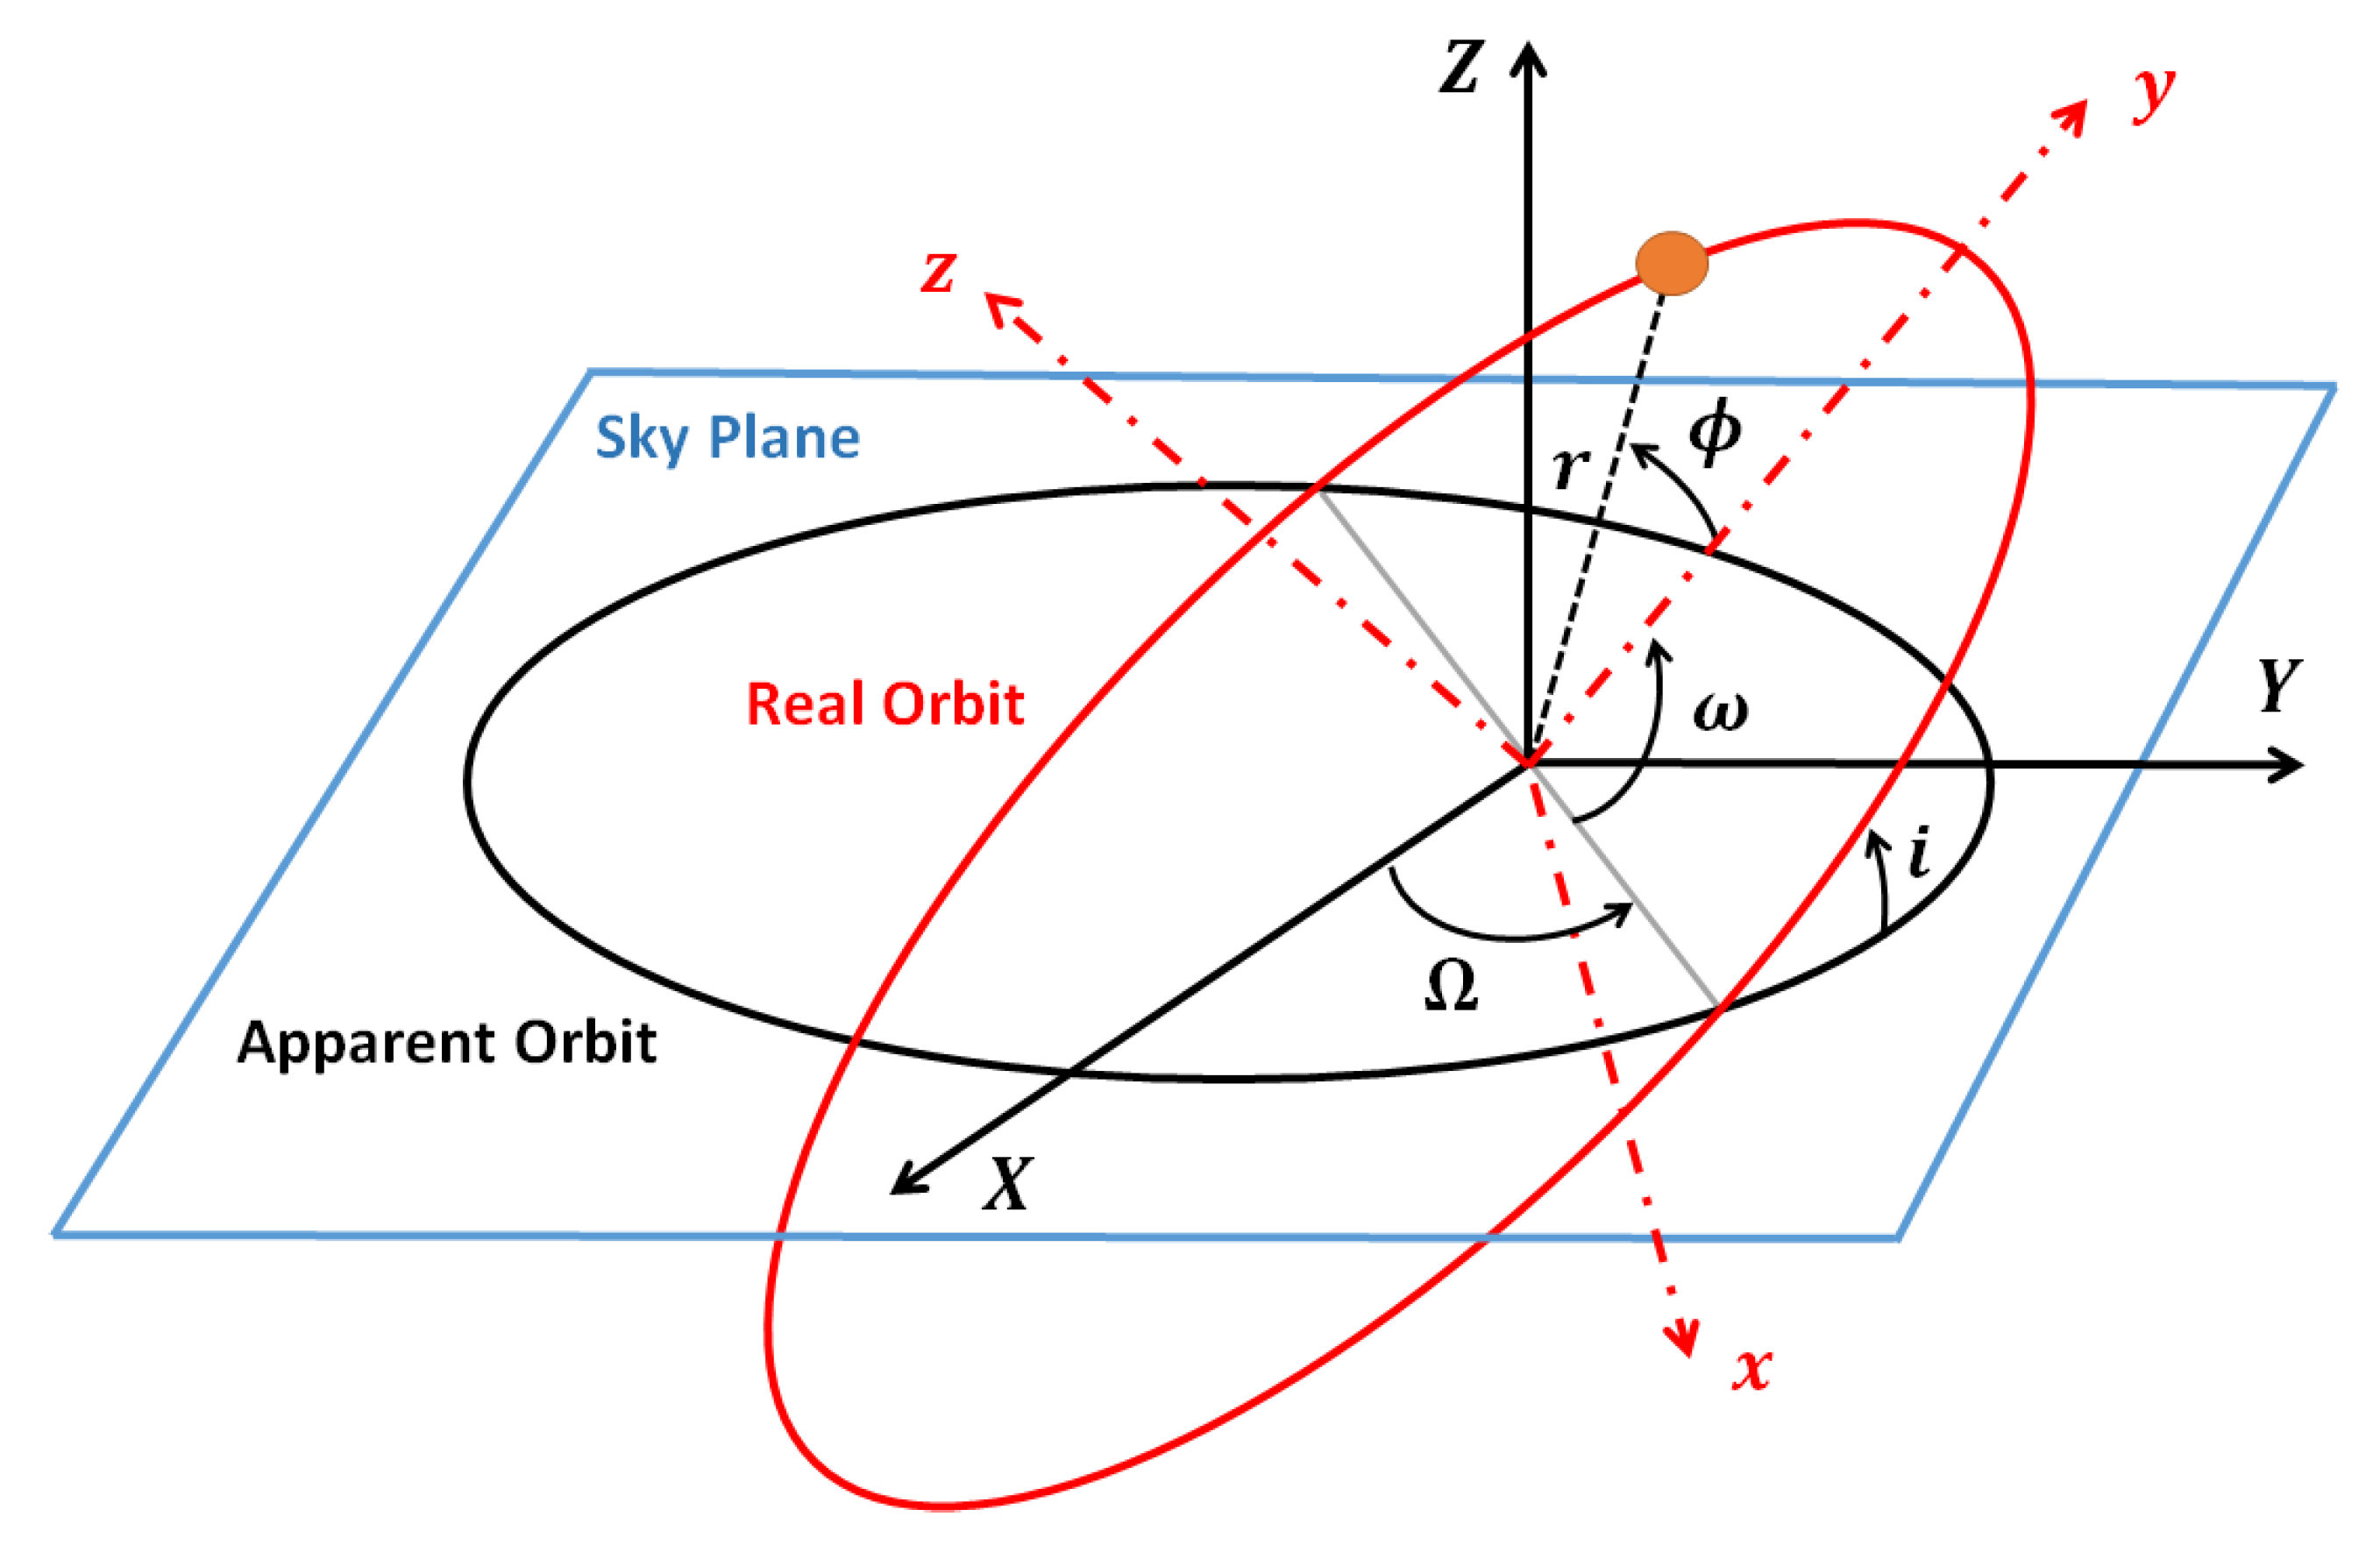
Appendix B. Projection of Orbit onto the Plane of Sky

| 1 | |
| 2 | |
| 3 | This type of correlation has been shown to break for the case of small and bulgeless galaxies in [70]. |
| 4 | The connection between the self-interaction constant () and the cross-section is given by as calculated in [40] within an electroweak-like formalism for an elastic scattering process. |
References
- Bond, J.R.; Efstathiou, G.; Silk, J. Massive Neutrinos and the Large-Scale Structure of the Universe. Phys. Rev. Lett. 1980, 45, 1980–1984. [Google Scholar] [CrossRef]
- Hut, P.; White, S.D.M. Can a neutrino-dominated Universe be rejected? Nature 1984, 310, 637–640. [Google Scholar] [CrossRef]
- Alcock, C.; Allsman, R.A.; Alves, D.R.; Axelrod, T.S.; Becker, A.C.; Bennett, D.P.; Cook, K.H.; Dalal, N.; Drake, A.J.; Freeman, K.C.; et al. The MACHO Project: Microlensing Results from 5.7 Years of Large Magellanic Cloud Observations. Astrophys. J. 2000, 542, 281–307. [Google Scholar] [CrossRef]
- Bertone, G.; Hooper, D.; Silk, J. Particle dark matter: Evidence, candidates and constraints. Phys. Rep. 2005, 405, 279–390. [Google Scholar] [CrossRef]
- Bertone, G.; Tait, T.M.P. A new era in the search for dark matter. Nature 2018, 562, 51–56. [Google Scholar] [CrossRef]
- Bahcall, N.A.; Ostriker, J.P.; Perlmutter, S.; Steinhardt, P.J. The Cosmic Triangle: Revealing the State of the Universe. Science 1999, 284, 1481. [Google Scholar] [CrossRef]
- Ivanov, M.M.; Simonović, M.; Zaldarriaga, M. Cosmological parameters and neutrino masses from the final Planck and full-shape BOSS data. Phys. Rev. D 2020, 101, 083504. [Google Scholar] [CrossRef]
- Marsh, D.J.E. Axion cosmology. Phys. Rep. 2016, 643, 1–79. [Google Scholar] [CrossRef]
- Adhikari, R.; Agostini, M.; Ky, N.A.; Araki, T.; Archidiacono, M.; Bahr, M.; Baur, J.; Behrens, J.; Bezrukov, F.; Bhupal Dev, P.S.; et al. A White Paper on keV sterile neutrino Dark Matter. J. Cosmol. Astropart. Phys. 2017, 2017, 025. [Google Scholar] [CrossRef]
- Schive, H.Y.; Chiueh, T.; Broadhurst, T. Cosmic structure as the quantum interference of a coherent dark wave. Nat. Phys. 2014, 10, 496–499. [Google Scholar] [CrossRef]
- Argüelles, C.R.; Díaz, M.I.; Krut, A.; Yunis, R. On the formation and stability of fermionic dark matter haloes in a cosmological framework. Mon. Not. R. Astron. Soc. 2021, 502, 4227–4246. [Google Scholar] [CrossRef]
- Suárez, A.; Chavanis, P.H. Cosmological evolution of a complex scalar field with repulsive or attractive self-interaction. Phys. Rev. D 2017, 95, 063515. [Google Scholar] [CrossRef]
- Chavanis, P.H. Jeans mass-radius relation of self-gravitating Bose-Einstein condensates and typical parameters of the dark matter particle. Phys. Rev. D 2021, 103, 123551. [Google Scholar] [CrossRef]
- Ruffini, R.; Bonazzola, S. Systems of Self-Gravitating Particles in General Relativity and the Concept of an Equation of State. Phys. Rev. 1969, 187, 1767–1783. [Google Scholar] [CrossRef]
- Baldeschi, M.R.; Gelmini, G.B.; Ruffini, R. On massive fermions and bosons in galactic halos. Phys. Lett. B 1983, 122, 221–224. [Google Scholar] [CrossRef]
- Sin, S.J. Late-time phase transition and the galactic halo as a Bose liquid. Phys. Rev. D 1994, 50, 3650–3654. [Google Scholar] [CrossRef]
- Hu, W.; Barkana, R.; Gruzinov, A. Fuzzy Cold Dark Matter: The Wave Properties of Ultralight Particles. Phys. Rev. Lett. 2000, 85, 1158. [Google Scholar] [CrossRef] [PubMed]
- Matos, T.; Arturo Ureña-López, L. Further analysis of a cosmological model with quintessence and scalar dark matter. Phys. Rev. D 2001, 63, 063506. [Google Scholar] [CrossRef]
- Robles, V.H.; Matos, T. Flat central density profile and constant dark matter surface density in galaxies from scalar field dark matter. Mon. Not. R. Astron. Soc. 2012, 422, 282–289. [Google Scholar] [CrossRef]
- Hui, L.; Ostriker, J.P.; Tremaine, S.; Witten, E. Ultralight scalars as cosmological dark matter. Phys. Rev. D 2017, 95, 043541. [Google Scholar] [CrossRef]
- Bar, N.; Blas, D.; Blum, K.; Sibiryakov, S. Galactic rotation curves versus ultralight dark matter: Implications of the soliton-host halo relation. Phys. Rev. D 2018, 98, 083027. [Google Scholar] [CrossRef]
- Mocz, P.; Fialkov, A.; Vogelsberger, M.; Becerra, F.; Shen, X.; Robles, V.H.; Amin, M.A.; Zavala, J.; Boylan-Kolchin, M.; Bose, S.; et al. Galaxy formation with BECDM - II. Cosmic filaments and first galaxies. Mon. Not. R. Astron. Soc. 2020, 494, 2027–2044. [Google Scholar] [CrossRef]
- Destri, C.; de Vega, H.J.; Sanchez, N.G. Fermionic warm dark matter produces galaxy cores in the observed scales because of quantum mechanics. New Astron. 2013, 22, 39–50. [Google Scholar] [CrossRef]
- Domcke, V.; Urbano, A. Dwarf spheroidal galaxies as degenerate gas of free fermions. J. Cosmol. Astropart. Phys. 2015, 2015, 002. [Google Scholar] [CrossRef]
- Randall, L.; Scholtz, J.; Unwin, J. Cores in Dwarf Galaxies from Fermi Repulsion. Mon. Not. R. Astron. Soc. 2017, 467, 1515–1525. [Google Scholar] [CrossRef]
- Chavanis, P.H. Predictive model of fermionic dark matter halos with a quantum core and an isothermal atmosphere. Phys. Rev. D 2022, 106, 043538. [Google Scholar] [CrossRef]
- de Vega, H.J.; Salucci, P.; Sanchez, N.G. Observational rotation curves and density profiles versus the Thomas-Fermi galaxy structure theory. Mon. Not. R. Astron. Soc. 2014, 442, 2717–2727. [Google Scholar] [CrossRef]
- Gao, J.G.; Merafina, M.; Ruffini, R. The semidegenerate configurations of a selfgravitating system of fermions. Astron. Astrophys. 1990, 235, 1–7. [Google Scholar]
- Chavanis, P.H. On the ‘coarse-grained’ evolution of collisionless stellar systems. Mon. Not. R. Astron. Soc. 1998, 300, 981–991. [Google Scholar] [CrossRef]
- Bilic, N.; Munyaneza, F.; Tupper, G.B.; Viollier, R.D. The dynamics of stars near Sgr A* and dark matter at the center and in the halo of the Galaxy. Prog. Part. Nucl. Phys. 2002, 48, 291–300. [Google Scholar] [CrossRef]
- Chavanis, P.H.; Lemou, M.; Méhats, F. Models of dark matter halos based on statistical mechanics: The fermionic King model. Phys. Rev. D 2015, 92, 123527. [Google Scholar] [CrossRef]
- Argüelles, C.R.; Krut, A.; Rueda, J.A.; Ruffini, R. Novel constraints on fermionic dark matter from galactic observables I: The Milky Way. Phys. Dark Universe 2018, 21, 82. [Google Scholar] [CrossRef]
- Argüelles, C.R.; Krut, A.; Rueda, J.A.; Ruffini, R. Novel constraints on fermionic dark matter from galactic observables II: Galaxy scaling relations. Phys. Dark Universe 2019, 24, 100278. [Google Scholar] [CrossRef]
- Becerra-Vergara, E.A.; Argüelles, C.R.; Krut, A.; Rueda, J.A.; Ruffini, R. Geodesic motion of S2 and G2 as a test of the fermionic dark matter nature of our Galactic core. Astron. Astrophys. 2020, 641, A34. [Google Scholar] [CrossRef]
- Becerra-Vergara, E.A.; Argüelles, C.R.; Krut, A.; Rueda, J.A.; Ruffini, R. Hinting a dark matter nature of Sgr A* via the S-stars. Mon. Not. R. Astron. Soc. Lett. 2021, 505, L64–L68. [Google Scholar] [CrossRef]
- Argüelles, C.R.; Mestre, M.F.; Becerra-Vergara, E.A.; Crespi, V.; Krut, A.; Rueda, J.A.; Ruffini, R. What does lie at the Milky Way centre? Insights from the S2-star orbit precession. Mon. Not. R. Astron. Soc. Lett. 2022, 511, L35–L39. [Google Scholar] [CrossRef]
- Argüelles, C.R.; Krut, A.; Chavanis, P.H.; Rueda, J.A.; Ruffini, R. Galaxy Rotation Curves and Universal Scaling Relations: Comparison between Phenomenological and Fermionic Dark Matter Profiles. Astrophys. J. 2023, 945, 1. [Google Scholar] [CrossRef]
- Ruffini, R.; Argüelles, C.R.; Rueda, J.A. On the core-halo distribution of dark matter in galaxies. Mon. Not. R. Astron. Soc. 2015, 451, 622–628. [Google Scholar] [CrossRef]
- Siutsou, I.; Argüelles, C.R.; Ruffini, R. Dark matter massive fermions and Einasto profiles in galactic haloes. Astron. Rep. 2015, 59, 656–666. [Google Scholar] [CrossRef]
- Argüelles, C.R.; Mavromatos, N.E.; Rueda, J.A.; Ruffini, R. The role of self-interacting right-handed neutrinos in galactic structure. J. Cosmol. Astropart. Phys. 2016, 4, 038. [Google Scholar] [CrossRef]
- Mavromatos, N.E.; Argüelles, C.R.; Ruffini, R.; Rueda, J.A. Self-interacting dark matter. Int. J. Mod. Phys. D 2017, 26, 1730007. [Google Scholar] [CrossRef]
- Tolman, R.C. On the Weight of Heat and Thermal Equilibrium in General Relativity. Phys. Rev. 1930, 35, 904–924. [Google Scholar] [CrossRef]
- Klein, O. On the Thermodynamical Equilibrium of Fluids in Gravitational Fields. Rev. Mod. Phys. 1949, 21, 531–533. [Google Scholar] [CrossRef]
- Merafina, M.; Ruffini, R. Systems of selfgravitating classical particles with a cutoff in their distribution function. Astron. Astrophys. 1989, 221, 4–19. [Google Scholar]
- Sofue, Y. Rotation Curve and Mass Distribution in the Galactic Center - From Black Hole to Entire Galaxy. Publ. Astron. Soc. Jpn. 2013, 65, 118. [Google Scholar] [CrossRef]
- Gillessen, S.; Plewa, P.M.; Eisenhauer, F.; Sari, R.; Waisberg, I.; Habibi, M.; Pfuhl, O.; George, E.; Dexter, J.; von Fellenberg, S.; et al. An Update on Monitoring Stellar Orbits in the Galactic Center. Astrophys. J. 2017, 837, 30. [Google Scholar] [CrossRef]
- Gillessen, S.; Eisenhauer, F.; Fritz, T.K.; Bartko, H.; Dodds-Eden, K.; Pfuhl, O.; Ott, T.; Genzel, R. The Orbit of the Star S2 around SGR A* from Very Large Telescope and Keck Data. Astrophys. J. 2009, 707, L114–L117. [Google Scholar] [CrossRef]
- Argüelles, C.R.; Ruffini, R. Are the most super-massive dark compact objects harbored at the center of dark matter halos? Int. J. Mod. Phys. D 2014, 23, 1442020. [Google Scholar] [CrossRef]
- Argüelles, C.R.; Ruffini, R.; Fraga, B.M.O. Critical configurations for a system of semidegenerate fermions. J. Korean Phys. Soc. 2014, 65, 809–813. [Google Scholar] [CrossRef]
- Argüelles, C.R.; Krut, A.; Rueda, J.A.; Ruffini, R. Can fermionic dark matter mimic supermassive black holes? Int. J. Mod. Phys. D 2019, 28, 1943003. [Google Scholar] [CrossRef]
- Abuter, R. et al. [Gravity Collaboration]. Detection of the gravitational redshift in the orbit of the star S2 near the Galactic centre massive black hole. Astron. Astrophys. 2018, 615, L15. [Google Scholar] [CrossRef]
- Zakharov, A.F. Testing the Galactic Centre potential with S-stars. Mon. Not. R. Astron. Soc. Lett. 2022, 513, L6–L9. [Google Scholar] [CrossRef]
- Abuter, R. et al. [Gravity Collaboration] Detection of orbital motions near the last stable circular orbit of the massive black hole SgrA*. Astron. Astrophys. 2018, 618, L10. [Google Scholar] [CrossRef]
- Matsumoto, T.; Chan, C.H.; Piran, T. The origin of hotspots around Sgr A*: Orbital or pattern motion? Mon. Not. R. Astron. Soc. Lett. 2020, 497, 2385–2392. [Google Scholar] [CrossRef]
- Peißker, F.; Eckart, A.; Parsa, M. S62 on a 9.9 yr Orbit around SgrA*. Astrophys. J. 2020, 889, 61. [Google Scholar] [CrossRef]
- Peißker, F.; Eckart, A.; Zajaček, M.; Ali, B.; Parsa, M. S62 and S4711: Indications of a Population of Faint Fast-moving Stars inside the S2 Orbit—S4711 on a 7.6 yr Orbit around Sgr A*. Astrophys. J. 2020, 899, 50. [Google Scholar] [CrossRef]
- GRAVITY Collaboration; Abuter, R.; Amorim, A.; Bauböck, M.; Berger, J.P.; Bonnet, H.; Brandner, W.; Cardoso, V.; Clénet, Y.; de Zeeuw, P.T.; et al. Detection of the Schwarzschild precession in the orbit of the star S2 near the Galactic centre massive black hole. Astron. Astrophys. 2020, 636, L5. [Google Scholar] [CrossRef]
- Do, T.; Hees, A.; Ghez, A.; Martinez, G.D.; Chu, D.S.; Jia, S.; Sakai, S.; Lu, J.R.; Gautam, A.K.; O’Neil, K.K.; et al. Relativistic redshift of the star S0-2 orbiting the Galactic Center supermassive black hole. Science 2019, 365, 664–668. [Google Scholar] [CrossRef]
- Walker, M.G.; Mateo, M.; Olszewski, E.W.; Peñarrubia, J.; Evans, N.W.; Gilmore, G. A Universal Mass Profile for Dwarf Spheroidal Galaxies? Astrophys. J. 2009, 704, 1274–1287. [Google Scholar] [CrossRef]
- de Blok, W.J.G.; Walter, F.; Brinks, E.; Trachternach, C.; Oh, S.H.; Kennicutt, R.C.J. High-Resolution Rotation Curves and Galaxy Mass Models from THINGS. Astrophys. J. 2008, 136, 2648–2719. [Google Scholar] [CrossRef]
- Hoekstra, H.; Hsieh, B.C.; Yee, H.K.C.; Lin, H.; Gladders, M.D. Virial Masses and the Baryon Fraction in Galaxies. Astrophys. J. 2005, 635, 73–85. [Google Scholar] [CrossRef]
- Donato, F.; Gentile, G.; Salucci, P.; Frigerio Martins, C.; Wilkinson, M.I.; Gilmore, G.; Grebel, E.K.; Koch, A.; Wyse, R. A constant dark matter halo surface density in galaxies. Mon. Not. R. Astron. Soc. 2009, 397, 1169–1176. [Google Scholar] [CrossRef]
- Romanowsky, A.J.; Kochanek, C.S. Dynamics of Stars and Globular Clusters in M87. Astrophys. J. 2001, 553, 722–732. [Google Scholar] [CrossRef]
- Newman, A.B.; Treu, T.; Ellis, R.S.; Sand, D.J. The Density Profiles of Massive, Relaxed Galaxy Clusters. II. Separating Luminous and Dark Matter in Cluster Cores. Astrophys. J. 2013, 765, 25. [Google Scholar] [CrossRef]
- Zhao, H. Analytical models for galactic nuclei. Mon. Not. R. Astron. Soc. 1996, 278, 488–496. [Google Scholar] [CrossRef]
- McGaugh, S.S.; Lelli, F.; Schombert, J.M. Radial Acceleration Relation in Rotationally Supported Galaxies. Phys. Rev. Lett. 2016, 117, 201101. [Google Scholar] [CrossRef]
- McGaugh, S.S. The Mass Discrepancy-Acceleration Relation: Disk Mass and the Dark Matter Distribution. Astrophys. J. 2004, 609, 652–666. [Google Scholar] [CrossRef]
- Ferrarese, L. Beyond the Bulge: A Fundamental Relation between Supermassive Black Holes and Dark Matter Halos. Astrophys. J. 2002, 578, 90–97. [Google Scholar] [CrossRef]
- Bogdán, Á.; Goulding, A.D. Connecting Dark Matter Halos with the Galaxy Center and the Supermassive Black Hole. Astrophys. J. 2015, 800, 124. [Google Scholar] [CrossRef]
- Kormendy, J.; Bender, R. Supermassive black holes do not correlate with dark matter haloes of galaxies. Nature 2011, 469, 377–380. [Google Scholar] [CrossRef]
- Seth, A.C.; van den Bosch, R.; Mieske, S.; Baumgardt, H.; Brok, M.D.; Strader, J.; Neumayer, N.; Chilingarian, I.; Hilker, M.; McDermid, R.; et al. A supermassive black hole in an ultra-compact dwarf galaxy. Nature 2014, 513, 398–400. [Google Scholar] [CrossRef] [PubMed]
- Ahn, C.P.; Seth, A.C.; den Brok, M.; Strader, J.; Baumgardt, H.; van den Bosch, R.; Chilingarian, I.; Frank, M.; Hilker, M.; McDermid, R.; et al. Detection of Supermassive Black Holes in Two Virgo Ultracompact Dwarf Galaxies. Astrophys. J. 2017, 839, 72. [Google Scholar] [CrossRef]
- Afanasiev, A.V.; Chilingarian, I.V.; Mieske, S.; Voggel, K.T.; Picotti, A.; Hilker, M.; Seth, A.; Neumayer, N.; Frank, M.; Romanowsky, A.J.; et al. A 3.5 million Solar masses black hole in the centre of the ultracompact dwarf galaxy fornax UCD3. Mon. Not. R. Astron. Soc. 2018, 477, 4856–4865. [Google Scholar] [CrossRef]
- Lelli, F.; McGaugh, S.S.; Schombert, J.M. SPARC: Mass Models for 175 Disk Galaxies with Spitzer Photometry and Accurate Rotation Curves. Astron. J. 2016, 152, 157. [Google Scholar] [CrossRef]
- Lelli, F.; McGaugh, S.S.; Schombert, J.M.; Pawlowski, M.S. One Law to Rule Them All: The Radial Acceleration Relation of Galaxies. Astrophys. J. 2017, 836, 152. [Google Scholar] [CrossRef]
- Di Paolo, C.; Salucci, P.; Fontaine, J.P. The Radial Acceleration Relation (RAR): Crucial Cases of Dwarf Disks and Low-surface-brightness Galaxies. Astrophys. J. 2019, 873, 106. [Google Scholar] [CrossRef]
- Di Cintio, A.; Brook, C.B.; Dutton, A.A.; Macciò, A.V.; Stinson, G.S.; Knebe, A. A mass-dependent density profile for dark matter haloes including the influence of galaxy formation. Mon. Not. R. Astron. Soc. 2014, 441, 2986–2995. [Google Scholar] [CrossRef]
- Tulin, S.; Yu, H.B. Dark matter self-interactions and small scale structure. Phys. Rep. 2018, 730, 1–57. [Google Scholar] [CrossRef]
- Shaposhnikov, M. The nuMSM, leptonic asymmetries, and properties of singlet fermions. J. High Energy Phys. 2008, 8, 008. [Google Scholar] [CrossRef]
- Yunis, R.; Argüelles, C.R.; Mavromatos, N.E.; Moliné, A.; Krut, A.; Carinci, M.; Rueda, J.A.; Ruffini, R. Galactic center constraints on self-interacting sterile neutrinos from fermionic dark matter (“ino”) models. Phys. Dark Universe 2020, 30, 100699. [Google Scholar] [CrossRef]
- Alberti, G.; Chavanis, P.H. Caloric curves of self-gravitating fermions in general relativity. Eur. Phys. J. B 2020, 93, 208. [Google Scholar] [CrossRef]
- Shao, S.; Gao, L.; Theuns, T.; Frenk, C.S. The phase-space density of fermionic dark matter haloes. Mon. Not. R. Astron. Soc. 2013, 430, 2346–2357. [Google Scholar] [CrossRef]
- Yunis, R.; Argüelles, C.R.; López Nacir, D. Boltzmann hierarchies for self-interacting warm dark matter scenarios. J. Cosmol. Astropart. Phys. 2020, 2020, 041. [Google Scholar] [CrossRef]
- Egana-Ugrinovic, D.; Essig, R.; Gift, D.; LoVerde, M. The cosmological evolution of self-interacting dark matter. J. Cosmol. Astropart. Phys. 2021, 2021, 013. [Google Scholar] [CrossRef]
- Yunis, R.I.; Argüelles, C.R.; Scóccola, C.G.; Nacir, D.L.; Giordano, G. Self Interactions in Warm Dark Matter: A View from Cosmological Perturbation Theory. Astron. Rep. 2021, 65, 1068–1073. [Google Scholar] [CrossRef]
- Dodelson, S.; Widrow, L.M. Sterile neutrinos as dark matter. Phys. Rev. Lett. 1993, 72, 17. [Google Scholar] [CrossRef]
- Yunis, R.; Argüelles, C.R.; Scóccola, C.G.; López Nacir, D.; Giordano, G. Self-interacting dark matter in cosmology: Accurate numerical implementation and observational constraints. J. Cosmol. Astropart. Phys. 2022, 2022, 024. [Google Scholar] [CrossRef]
- Harvey, D.; Massey, R.; Kitching, T.; Taylor, A.; Tittley, E. The nongravitational interactions of dark matter in colliding galaxy clusters. Science 2015, 347, 1462–1465. [Google Scholar] [CrossRef]
- Bergamini, P.; Rosati, P.; Mercurio, A.; Grillo, C.; Caminha, G.B.; Meneghetti, M.; Agnello, A.; Biviano, A.; Calura, F.; Giocoli, C.; et al. Enhanced cluster lensing models with measured galaxy kinematics. Astron. Astrophys. 2019, 631, A130. [Google Scholar] [CrossRef]
- Meneghetti, M.; Davoli, G.; Bergamini, P.; Rosati, P.; Natarajan, P.; Giocoli, C.; Caminha, G.B.; Metcalf, R.B.; Rasia, E.; Borgani, S.; et al. An excess of small-scale gravitational lenses observed in galaxy clusters. Science 2020, 369, 1347–1351. [Google Scholar] [CrossRef]
- Gómez, L.G.; Argüelles, C.R.; Perlick, V.; Rueda, J.A.; Ruffini, R. Strong lensing by fermionic dark matter in galaxies. Phys. Rev. D 2016, 94, 123004. [Google Scholar] [CrossRef]
- Cardoso, V.; Pani, P. Testing the nature of dark compact objects: A status report. Living Rev. Relativ. 2019, 22, 4. [Google Scholar] [CrossRef]
- Vincent, F.H.; Meliani, Z.; Grandclément, P.; Gourgoulhon, E.; Straub, O. Imaging a boson star at the Galactic center. Class. Quantum Gravity 2016, 33, 105015. [Google Scholar] [CrossRef]
- Olivares, H.; Younsi, Z.; Fromm, C.M.; De Laurentis, M.; Porth, O.; Mizuno, Y.; Falcke, H.; Kramer, M.; Rezzolla, L. How to tell an accreting boson star from a black hole. Mon. Not. R. Astron. Soc. 2020, 497, 521–535. [Google Scholar] [CrossRef]
- Pelle, J.; Reula, O.; Carrasco, F.; Bederian, C. Skylight: A new code for general-relativistic ray-tracing and radiative transfer in arbitrary space-times. Mon. Not. R. Astron. Soc. 2022, 515, 1316–1327. [Google Scholar] [CrossRef]
- Pani, P. Binary pulsars as dark-matter probes. Phys. Rev. D 2015, 92, 123530. [Google Scholar] [CrossRef]
- Gómez, L.G.; Rueda, J.A. Dark matter dynamical friction versus gravitational wave emission in the evolution of compact-star binaries. Phys. Rev. D 2017, 96, 063001. [Google Scholar] [CrossRef]
- Chan, M.H.; Lee, C.M. Indirect Evidence for Dark Matter Density Spikes around Stellar-mass Black Holes. Astrophys. J. Lett. 2023, 943, L11. [Google Scholar] [CrossRef]
- Volonteri, M. The Formation and Evolution of Massive Black Holes. Science 2012, 337, 544. [Google Scholar] [CrossRef]
- Woods, T.E.; Agarwal, B.; Bromm, V.; Bunker, A.; Chen, K.J.; Chon, S.; Ferrara, A.; Glover, S.C.O.; Haemmerlé, L.; Haiman, Z.; et al. Titans of the early Universe: The Prato statement on the origin of the first supermassive black holes. Publ. Astron. Soc. Aust. 2019, 36, e027. [Google Scholar] [CrossRef]
- Zhu, Q.; Li, Y.; Li, Y.; Maji, M.; Yajima, H.; Schneider, R.; Hernquist, L. The formation of the first quasars: The black hole seeds, accretion, and feedback models. Mon. Not. R. Astron. Soc. 2022, 514, 5583–5606. [Google Scholar] [CrossRef]
- Volonteri, M.; Habouzit, M.; Colpi, M. The origins of massive black holes. Nat. Rev. Phys. 2021, 3, 732–743. [Google Scholar] [CrossRef]
- Inayoshi, K.; Visbal, E.; Haiman, Z. The Assembly of the First Massive Black Holes. Annu. Rev. Astron. Astrophys. 2020, 58, 27–97. [Google Scholar] [CrossRef]
- Madau, P.; Rees, M.J. Massive Black Holes as Population III Remnants. Astrophys. J. 2001, 551, L27–L30. [Google Scholar] [CrossRef]
- Hosokawa, T.; Hirano, S.; Kuiper, R.; Yorke, H.W.; Omukai, K.; Yoshida, N. Formation of Massive Primordial Stars: Intermittent UV Feedback with Episodic Mass Accretion. Astrophys. J. 2016, 824, 119. [Google Scholar] [CrossRef]
- Begelman, M.C.; Volonteri, M.; Rees, M.J. Formation of supermassive black holes by direct collapse in pre-galactic haloes. Mon. Not. R. Astron. Soc. 2006, 370, 289–298. [Google Scholar] [CrossRef]
- Begelman, M.C.; Rossi, E.M.; Armitage, P.J. Quasi-stars: Accreting black holes inside massive envelopes. Mon. Not. R. Astron. Soc. 2008, 387, 1649–1659. [Google Scholar] [CrossRef]
- Woods, T.E.; Heger, A.; Whalen, D.J.; Haemmerlé, L.; Klessen, R.S. On the Maximum Mass of Accreting Primordial Supermassive Stars. Astrophys. J. Lett. 2017, 842, L6. [Google Scholar] [CrossRef]
- Latif, M.A.; Whalen, D.J.; Khochfar, S.; Herrington, N.P.; Woods, T.E. Turbulent cold flows gave birth to the first quasars. Nature 2022, 607, 48–51. [Google Scholar] [CrossRef]
- Carr, B.; Kühnel, F. Primordial Black Holes as Dark Matter: Recent Developments. Annu. Rev. Nucl. Part. Sci. 2020, 70, 355–394. [Google Scholar] [CrossRef]
- Bramberger, S.F.; Brandenberger, R.H.; Jreidini, P.; Quintin, J. Cosmic string loops as the seeds of super-massive black holes. J. Cosmol. Astropart. Phys. 2015, 2015, 7. [Google Scholar] [CrossRef]
- Argüelles, C.R.; Becerra-Vergara, E.A.; Krut, A.; Yunis, R.; Rueda, J.A.; Ruffini, R. Reshaping our understanding on structure formation with the quantum nature of the dark matter. Int. J. Mod. Phys. D 2022, 31, 2230002. [Google Scholar] [CrossRef]
- Ghez, A.M.; Salim, S.; Weinberg, N.N.; Lu, J.R.; Do, T.; Dunn, J.K.; Matthews, K.; Morris, M.R.; Yelda, S.; Becklin, E.E.; et al. Measuring Distance and Properties of the Milky Way’s Central Supermassive Black Hole with Stellar Orbits. Astrophys. J. 2008, 689, 1044–1062. [Google Scholar] [CrossRef]
- Chu, D.S.; Do, T.; Hees, A.; Ghez, A.; Naoz, S.; Witzel, G.; Sakai, S.; Chappell, S.; Gautam, A.K.; Lu, J.R.; et al. Investigating the Binarity of S0-2: Implications for Its Origins and Robustness as a Probe of the Laws of Gravity around a Supermassive Black Hole. Astrophys. J. 2018, 854, 12. [Google Scholar] [CrossRef]


| Model | |||||||||
|---|---|---|---|---|---|---|---|---|---|
| I | RAR ( keV) | ||||||||
| II | RAR ( keV) | ||||||||
| III | RAR ( keV) | ||||||||
| IV | RAR ( keV) | ||||||||
| V | RAR ( keV) | ||||||||
| VI | RAR ( keV) | ||||||||
| BH | 0 | ||||||||
| Typical dSph | Typical Spiral | Typical Elliptical | Typical Galaxy Cluster | |
|---|---|---|---|---|
| (kpc) | 50 | 90 | 600 | |
Disclaimer/Publisher’s Note: The statements, opinions and data contained in all publications are solely those of the individual author(s) and contributor(s) and not of MDPI and/or the editor(s). MDPI and/or the editor(s) disclaim responsibility for any injury to people or property resulting from any ideas, methods, instructions or products referred to in the content. |
© 2023 by the authors. Licensee MDPI, Basel, Switzerland. This article is an open access article distributed under the terms and conditions of the Creative Commons Attribution (CC BY) license (https://creativecommons.org/licenses/by/4.0/).
Share and Cite
Argüelles, C.R.; Becerra-Vergara, E.A.; Rueda, J.A.; Ruffini, R. Fermionic Dark Matter: Physics, Astrophysics, and Cosmology. Universe 2023, 9, 197. https://doi.org/10.3390/universe9040197
Argüelles CR, Becerra-Vergara EA, Rueda JA, Ruffini R. Fermionic Dark Matter: Physics, Astrophysics, and Cosmology. Universe. 2023; 9(4):197. https://doi.org/10.3390/universe9040197
Chicago/Turabian StyleArgüelles, C. R., E. A. Becerra-Vergara, J. A. Rueda, and R. Ruffini. 2023. "Fermionic Dark Matter: Physics, Astrophysics, and Cosmology" Universe 9, no. 4: 197. https://doi.org/10.3390/universe9040197