Article

Some Aspects of Persistent Homology Analysis on Phase Transition: Examples in an Effective QCD Model with Heavy Quarks

Department of Computer Science and Engineering, Faculty of Information Engineering, Fukuoka Institute of Technology, Fukuoka 811-0295, Japan
*
Author to whom correspondence should be addressed.
Universe 2023, 9(2), 82; https://doi.org/10.3390/universe9020082
Submission received: 23 December 2022 / Revised: 1 February 2023 / Accepted: 2 February 2023 / Published: 3 February 2023
(This article belongs to the Special Issue Collectivity in High-Energy Proton-Proton and Heavy-Ion Collisions)

Abstract

:
Recently, persistent homology analysis has been used to investigate phase structure. In this study, we apply persistent homology analysis to the QCD effective model with heavy quarks at finite imaginary chemical potential; i.e., the Potts model with the suitably tuned external field. Since we try to obtain a deeper understanding of the relationship between persistent homology and phase transition in QCD, we consider the imaginary chemical potential because the clear phase transition, which is closely related to the confinement-deconfinement transition, exists. In the actual analysis, we employ the point-cloud approach to consider persistent homology. In addition, we investigate the fluctuation of persistent diagrams to obtain additional information on the relationship between the spatial topology and the phase transition.

1. Introduction

Elucidating the nature of the phase structure of quantum chromodynamics (QCD) at finite temperature (T) and finite real quark chemical potential ( μ R ) is one of the interesting and important topics in elementary particle, hadron, and nuclear physics. Understanding the QCD phase diagram is necessary to analyze the experimental data obtained in recent and future heavy-ion collisions; for example, see Ref. [1]. In addition, understanding the QCD phase structure is necessary to clarify the detailed properties of compact stars; for example, see Ref. [2]. In this sense, understanding the QCD phase structure is also important for astrophysics.
In the pure gauge limit, where the quarks are static, the Polyakov loop respecting the gauge-invariant holonomy well represents the deconfinement transition; see Ref. [3]. When quarks are static, the spontaneous center ( Z N c ) symmetry breaking, where N c is the number of colors, can describe the confinement-deconfinement phase transition, and then the Polyakov loop can characterize the transition. This means that we can well define the confinement-deconfinement transition using the spontaneous symmetry breaking phenomena in this situation. However, the Polyakov loop cannot be considered as the order parameter when quarks are dynamical since the relation between the Polyakov loop and the free energy for the one-quark excitation is missed in this case. This means that the spontaneous symmetry breaking is no longer useful to understand the confinement-deconfinement transition if dynamical quarks exist in the system. Due to the above fact, the confinement-deconfinement nature of QCD with realistic quark mass is still an open question; for example, see Ref. [4] for the recently considered deconfinement scenario at finite density, which is based on the quarkyonic picture [5], where the spontaneous symmetry breaking phenomena is not important.
There are many approaches to investigate the confinement-deconfinement nature of QCD. One interesting approach is the topological order that is proposed in condensed matter physics [6], which is not based on the spontaneous symmetry breaking. The topological order is based on the topology of the quantum state and can be clarified from the ground state degeneracy at least at T = 0 [7]. In the topological order, the classical order parameters that can be used in the Ginzburg–Landau analysis are not necessary; the ground state degeneracy induced by the compactified spaces plays a crucial role to clarify the topologically ordered and disordered states. This may indicate that the topology is key to understanding the confinement-deconfinement nature of QCD. Unfortunately, the ground state degeneracy is difficult to apply to the system with the thermal fluctuation, and thus it is not straightforward to investigate the confinement-deconfinement transition at finite T by using the topological order: some procedures to determine the ground state degeneracy break down by the thermal fluctuation.
Recently, there have been some attempts to use the spatial topological structure of configurations to clarify the confinement-deconfinement nature of QCD using persistent homology [8,9] for QCD effective models [10,11]. This approach has a relationship with the center cluster structure [12,13,14] and may provide additional information on the confinement-deconfinement nature at finite temperature from the spatial structure of configurations. Furthermore, persistent homology can detect the center vortex [15] clearly appearing in the pure gauge limit [16], and therefore persistent homology may be an interesting concept to understand the confinement-deconfinement nature from a topological point of view. Thus, we can expect that the persistent homology can pick up not only the information of the phase transition associated by the spontaneous symmetry breaking but also the quantum phase transition. There are many studies that use persistent homology to investigate the phase transition appearing in several physical systems [16,17,18,19,20,21,22] not only for the standard phase transition but also for the topological phase transition. In addition, there are other applications, such as investigating the string landscape and the structure of the universe [23,24]. We currently work in the same direction as Refs. [17,18,19,20].
In this study, we try to investigate the behavior of the persistent homology when the system has a clear phase transition. For this purpose, we employ the Potts model with a suitably tuned external field as a convenient QCD effective model with heavy quarks, which can pick up some features of the confinement-deconfinement nature of QCD. Unfortunately, QCD and also QCD effective models, which can treat the confinement-deconfinement transition, usually have a sign problem at finite real chemical potential. Thus, we use imaginary chemical potential ( μ I ) [25] in this study because there is no sign problem. In particular, we concentrate on the region, θ : = μ I / T = π / 3 , where the Roberge–Weiss (RW) transition appears. The imaginary chemical potential can have some interesting and important properties related to the nature of the confinement-deconfinement transition; see Ref. [26] for a review. For example, the real and imaginary chemical potentials are related via the Fourier transformation and Fugacity expansion, which is the so called canonical approach [27,28,29,30,31]; in the canonical approach, we can avoid the sign problem, but it appears in different shapes and obstruct numerical calculations at finite density. Furthermore, the existence of the RW transition may be related to the deconfinement nature of QCD from the nontrivial degeneracy of free energy, see Refs. [32,33,34]; in these studies, the authors propose the analogy between the nontrivial free-energy degeneracy and the ground-state degeneracy of the confinement-deconfinement transition at finite temperature ( T 0 ), but this classification of the confinement-deconfinement transition is still conjecture. In this study, we try to investigate the confinement-deconfinement transition using spatial topology; the center domain structure plays a crucial role in the nontrivial free-energy degeneracy and thus it is not unnatural to think that the spacial topology has some hints to understand the confinement-deconfinement transition.
This paper is organized as follows. In the next section, we explain the formulation of the QCD-like Potts model. Numerical results are shown in Section 3, and Section 4 is devoted to the summary.

2. Formulation

In this study, we employ the Potts model with a suitably constructed external field. First, we explain the formulation of the QCD-like Potts model. Next, we present a brief explanation of persistent homology analysis.

2.1. QCD-like Potts Model

The energy of the standard Potts model is written as
H Potts = κ x i δ k x k x + i ,
where k x are the degrees of freedom associated by the Z 3 symmetry at each site x , i is the three-dimensional unit vector and κ represents the coupling constant of the nearest neighbor interaction. In this study, we allocate k = 1 , 0 and 1 for the Z 3 valued spin degrees of freedom. For a review of the Potts model, see Ref. [35] as an example.
To construct the Potts model as the QCD effective model with heavy quarks, we introduce the external magnetic field [36,37,38] as
H = H Potts x h Φ x + h + Φ ¯ x ,
where the Polyakov loop ( Φ x ) and its conjugate ( Φ ¯ x ) at each site x are defined as
Φ x = e 2 π i k x / 3 , Φ ¯ x = e 2 π i k x / 3 ,
and the external fields ( h ) are set as
h = e β ( M μ ) ,
with the inverse temperature β = 1 / T , the quark mass M and the chemical potential μ = μ R + i μ I , here μ R and μ I , are real values. In the μ = μ R case, H becomes complex and then this system has the sign problem even if the partition function is real. However, if μ is pure imaginary as μ = i μ I where μ I , H is real, thus there is no sign problem. In the following, we set μ = i μ I . The term of external field represents the quark contributions for a system with a heavy quark mass. In the following, we call this Potts model the QCD-like Potts model. In the QCD-like Potts model, κ is treated as a temperature-like quantity to control the behavior of the Polyakov loop. Since the present QCD-like Potts model has simple degrees of freedom, it has a clear center domain structure, which is directly represented by k.
The global information of the system can be seen from the spatially averaged Polyakov loop defined as
Φ : = 1 N x Φ x ,
where N is the total number of sites and means the configuration averaged value. At finite imaginary chemical potential, the modified version of Equation (5)
Ψ : = 1 N x e i θ Φ x ,
is a more convenient quantity, where θ = μ I / T which is the convenient imaginary dimensionless chemical potential, because it has RW periodicity, unlike the pure Polyakov loop [39]; this Ψ is the so-called modified Polyakov loop. This quantity represents the modified Z N c symmetry appearing in the partition function at finite imaginary chemical potential. Unfortunately, these quantities cannot respond to the local structure of the system because spatial averaging is imposed. Therefore, we may need some other quantities that represent the local structure of the system. To overcome this point, we consider persistent homology in this study. It should be noted that behavior of the system energy and the specific heat have important information on the phase transition. Our purpose in this study is investigating the relation between the phase transition and the system topology and thus we do not discuss the energy and specific heat in this paper.

2.2. Persistent Homology

One of the ways to investigate the topology of the spatial structure that appears in the data space is through persistent homology analysis. For our purposes, we can consider two different ways to investigate the spatial structure of the configuration space. The first is the standard persistent homology analysis of the ratio of birth-and-death times of holes based on the point-cloud data. Second is that we treat the spin configuration as the pixel data and apply the persistent homology analysis via super-level filtration. Since persistent homology is a complicated mathematical concept, we here just briefly explain it; for details, see Ref. [40].

2.2.1. Point-Cloud Data

In the approach with point-cloud data, we first divide the spin configuration into different data sets, namely the data set with spins k = 1 , 0, and 1; this means that if sites have spin k = i where i = 1 , 0 , 1 , such sites are “on” and the others are set to “OFF” in the corresponding data set: In the actual calculation, we analyze the data set with k = 0 , which corresponds to the trivial center sector; this treatment is proposed in Ref. [10]. After this procedure, we obtain the spatial structure which respects the spin degrees of freedom; this mapping is based on the center domain structure. Then, we can consider the following procedure.
  • Consider balls whose center is set to the “ON” sites for each data point (point-cloud). This procedure creates the point-cloud data, which are input data for the persistent homology analysis;
  • The radius r of each ball increases with increasing time (filtration). This procedure introduces the hole structure for the point-cloud data;
  • When time passes sufficiently, the balls begin to overlap. Then, the hole created by the overlapped balls appears. We call this time as birth time, t B ;
  • After the overlapping, the hole vanishes with increasing time. We call this time as death time, t D . Therefore, we have t B < t D .
Unfortunately, the above strict filtration is numerically difficult and thus the alpha complex is usually employed to represent it. In this study, we used this approach to evaluate persistent homology. It should be noted that this approach is suitable for the present QCD-like Potts model because the model has a simple spin structure, but it may miss some information when we apply it to QCD.

2.2.2. Pixel Data

In the approach with pixel data, we consider a procedure similar to that in the approach with point-cloud data. However, when we consider mapping the configuration to the pixel data, we need a more complicated procedure. This process can be performed as follows.
  • Construct the data set that contains the spatial structure with the actual values of spin k = 1 , 0 and 1. Then, the data set becomes the pixel data; all sites have one of three values, 1 , 0 and 1. We can regard it as a function f ( X ) where X denotes each site.
  • Level sets are performed in the pixel data as
    X h : = { x X | f ( x ) h } ,
    where h denotes the threshold value.
  • Then the threshold values of level sets are decreased, we can define the following process (super-level filtration).
    X h 1 X h 2 X h 3 ,
    with
    h 1 h 2 h 3 ,
    and then the birth time appears after the death time, t D < t B .
Super-level filtration means that the appearance and disappearance of islands (holes) are considered by lowering the threshold from larger to smaller, and thus the birth time is larger than the death time because the threshold values of them are directly related to the time; for example, see the tutorial of HomCloud for the grayscale data [41]. Unfortunately, we only have the discrete Z 3 -valued data in this model; it has a simple spatial structure to use the pixel data approach. Therefore, we did not adopt this approach in this study; this section is included for reference only. However, this approach is promising when we apply persistent homology analysis to QCD because we will encounter continuous values instead of Z N c values. By using the procedure, we can treat the continuous value of the Polyakov-loop properly, unlike the point-cloud data approach, since the point-cloud data approach is based on the mapping of the continuous value to the three discrete regions. Therefore, some information may be lost in the point-cloud approach for QCD. Then, we should consider the pixel data instead of the above point-cloud data.

2.2.3. Observables

To see the global information of the system via the persistent homology analysis, we consider the expectation value of the averaged ratio of the t B and t D defined as
R ave = 1 N h n R n = 1 N h n t n , D t n , B ,
where in the summation runs for all holes, n assigns each hole and N h means the total number of holes for each configuration. Since all information of created holes in the filtration are considered in Equation (10), information coming from several trivial holes is taken into account. Usually, such trivial holes are not considered to be important in the persistent homology analysis. However, such a trivial hole is a necessary building block to reproduce the behavior of the global feature of the order parameter as shown in Ref. [11] which investigates the isospin chemical potential region. In contrast, the expectation value of the maximum value of the ratio,
R max = max t D t B ,
can rather be responsible for the local information of the system because it is usually expected that data appearing from the diagonal line of persistent diagram can have the nontrivial spatial structure. Since Equation (11) represents information on the most nontrivial hole, its behavior is interesting. By using Equations (10) and (11), we may have information on the relation between the phase transition and the persistent diagram. It should be noted that there is the possibility that we may have some more good quantities for clarifying the phase transition. Thus, we consider different quantities, as shown below, in this study.
In addition to R ave and R max , we investigate the fluctuation of data on persistent diagrams. Value is defined as
r ave = 1 N h n ( R n R ave ) 2 .
Since this represents the fluctuations of data about the birth and death times on persistent diagrams, it respects the spreading behavior of data. For the distribution of standard order parameter in configuration space, the fluctuation can pick up the phase transition. For example, there are two or more relevant domains when the first-order transition happens; in this case, the deviation of each configuration from the mean value can be large because of the separation. Additionally, in the case of the second-order transition, there is the flat region in the Ginzburg–Landau potential and thus configurations can be spread. Then, each configuration has a large deviation from the mean value. Of course, it is not trivial that there are some relations between each data of the birth-to-death time ratio and its mean value. Clarifying the relationship is one of the main objectives of this study.
To consider fluctuation, we can consider another way, as follows. After evaluating the persistent diagram, we have several sets of birth and death times for each configuration. Then, we can regard the data sets as the new point-cloud data and perform persistent homology analysis on them. After the procedure, we have a new persistent diagram; this can be called the persistent diagram of the persistent diagram (PH-PH diagram). In this approach, several trivial holes and nontrivial holes create the hole structure and thus the PH-PH diagram can pick up the fluctuation. A persistent diagram is a two-dimensional diagram in which the vertical and horizontal lines are the birth and death times, and thus the homology of the 0th or the 1st order is good to investigate. The other way uses the block-spin like transformation, which corresponds to the coarse graining of the system. When the fluctuation is large, holes with several scales exist in the system. In this case, data on the persistent diagram is expected to persist against coarse graining. Thus, it is interesting to investigate the behavior of the persistent diagram against the coarse graining. We will discuss these approaches elsewhere.

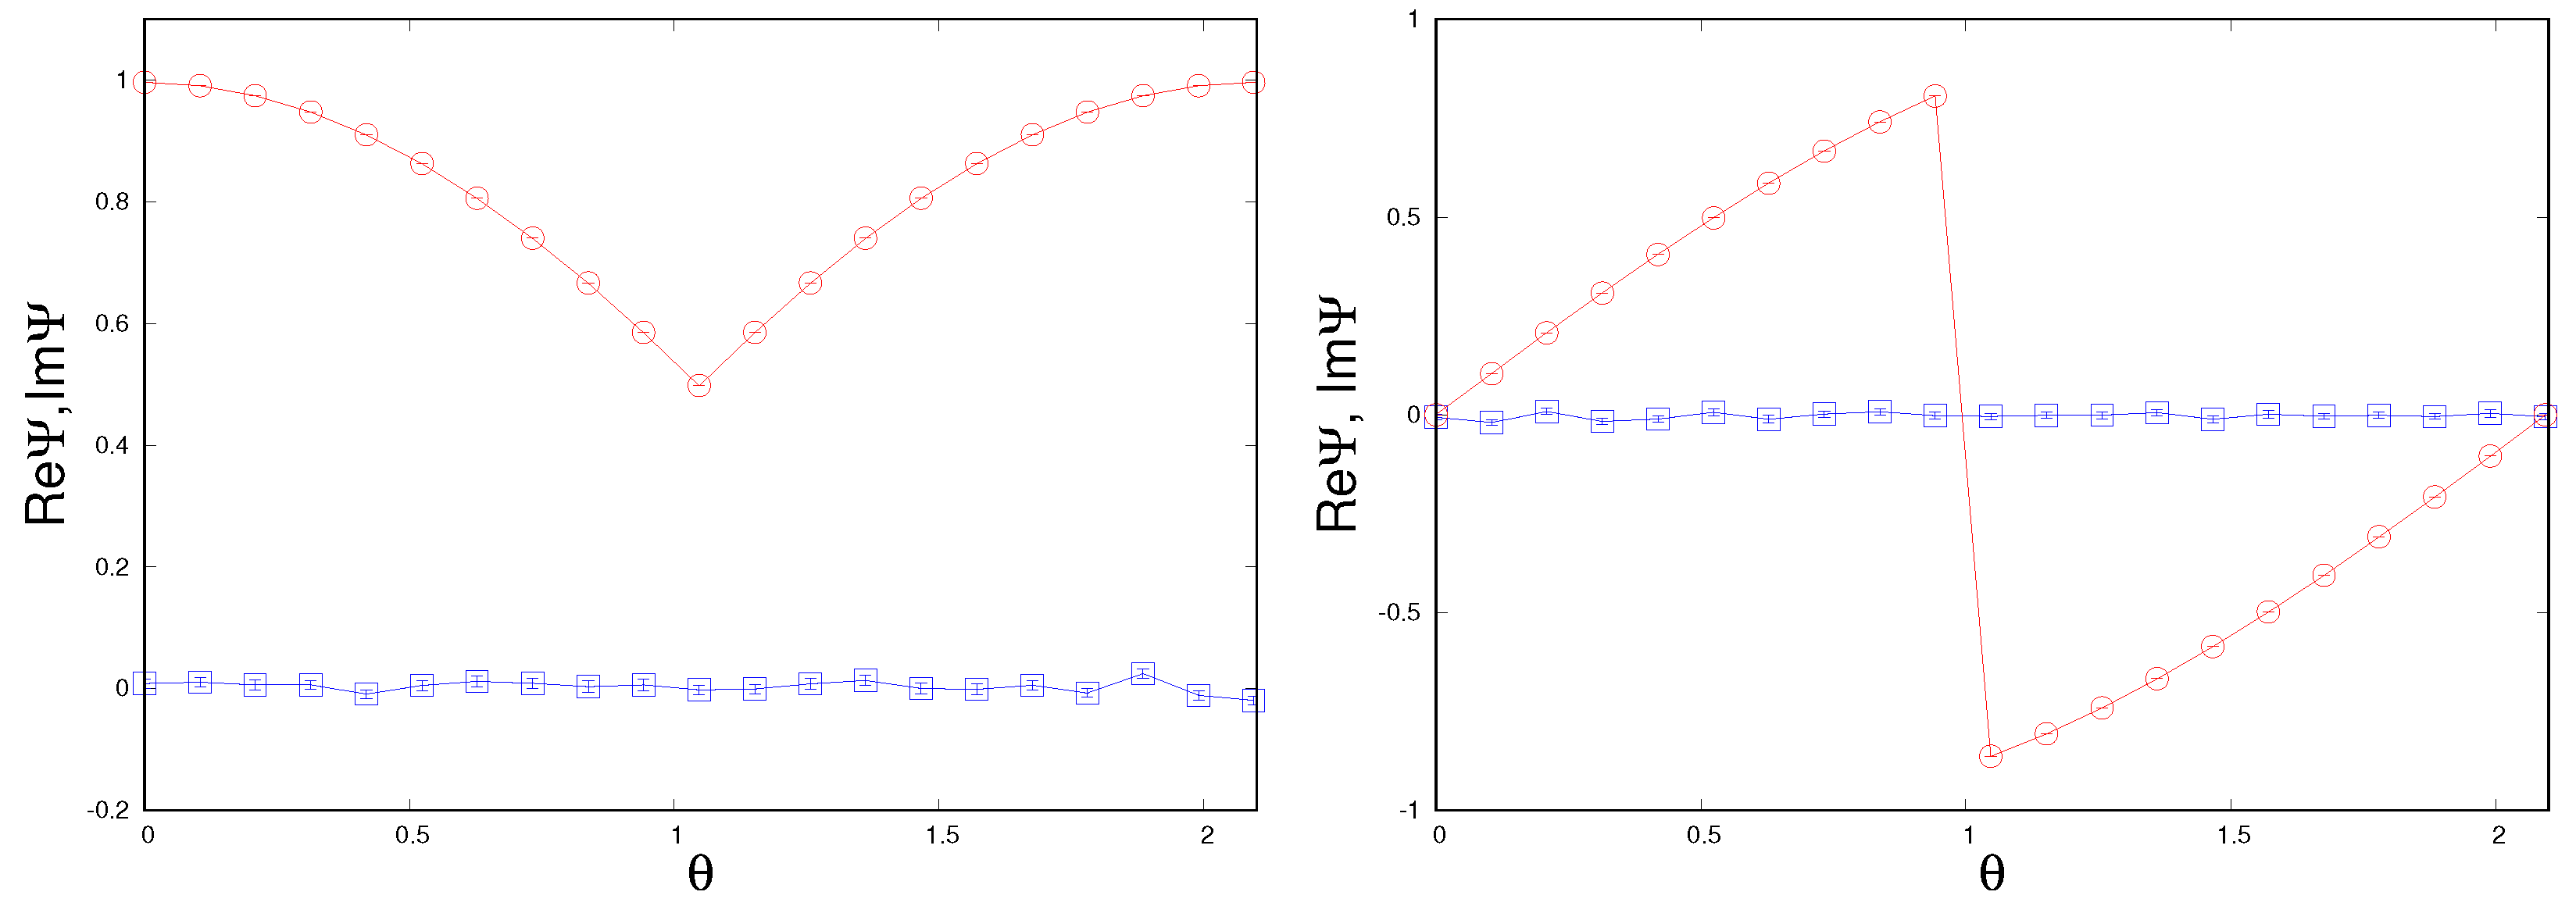
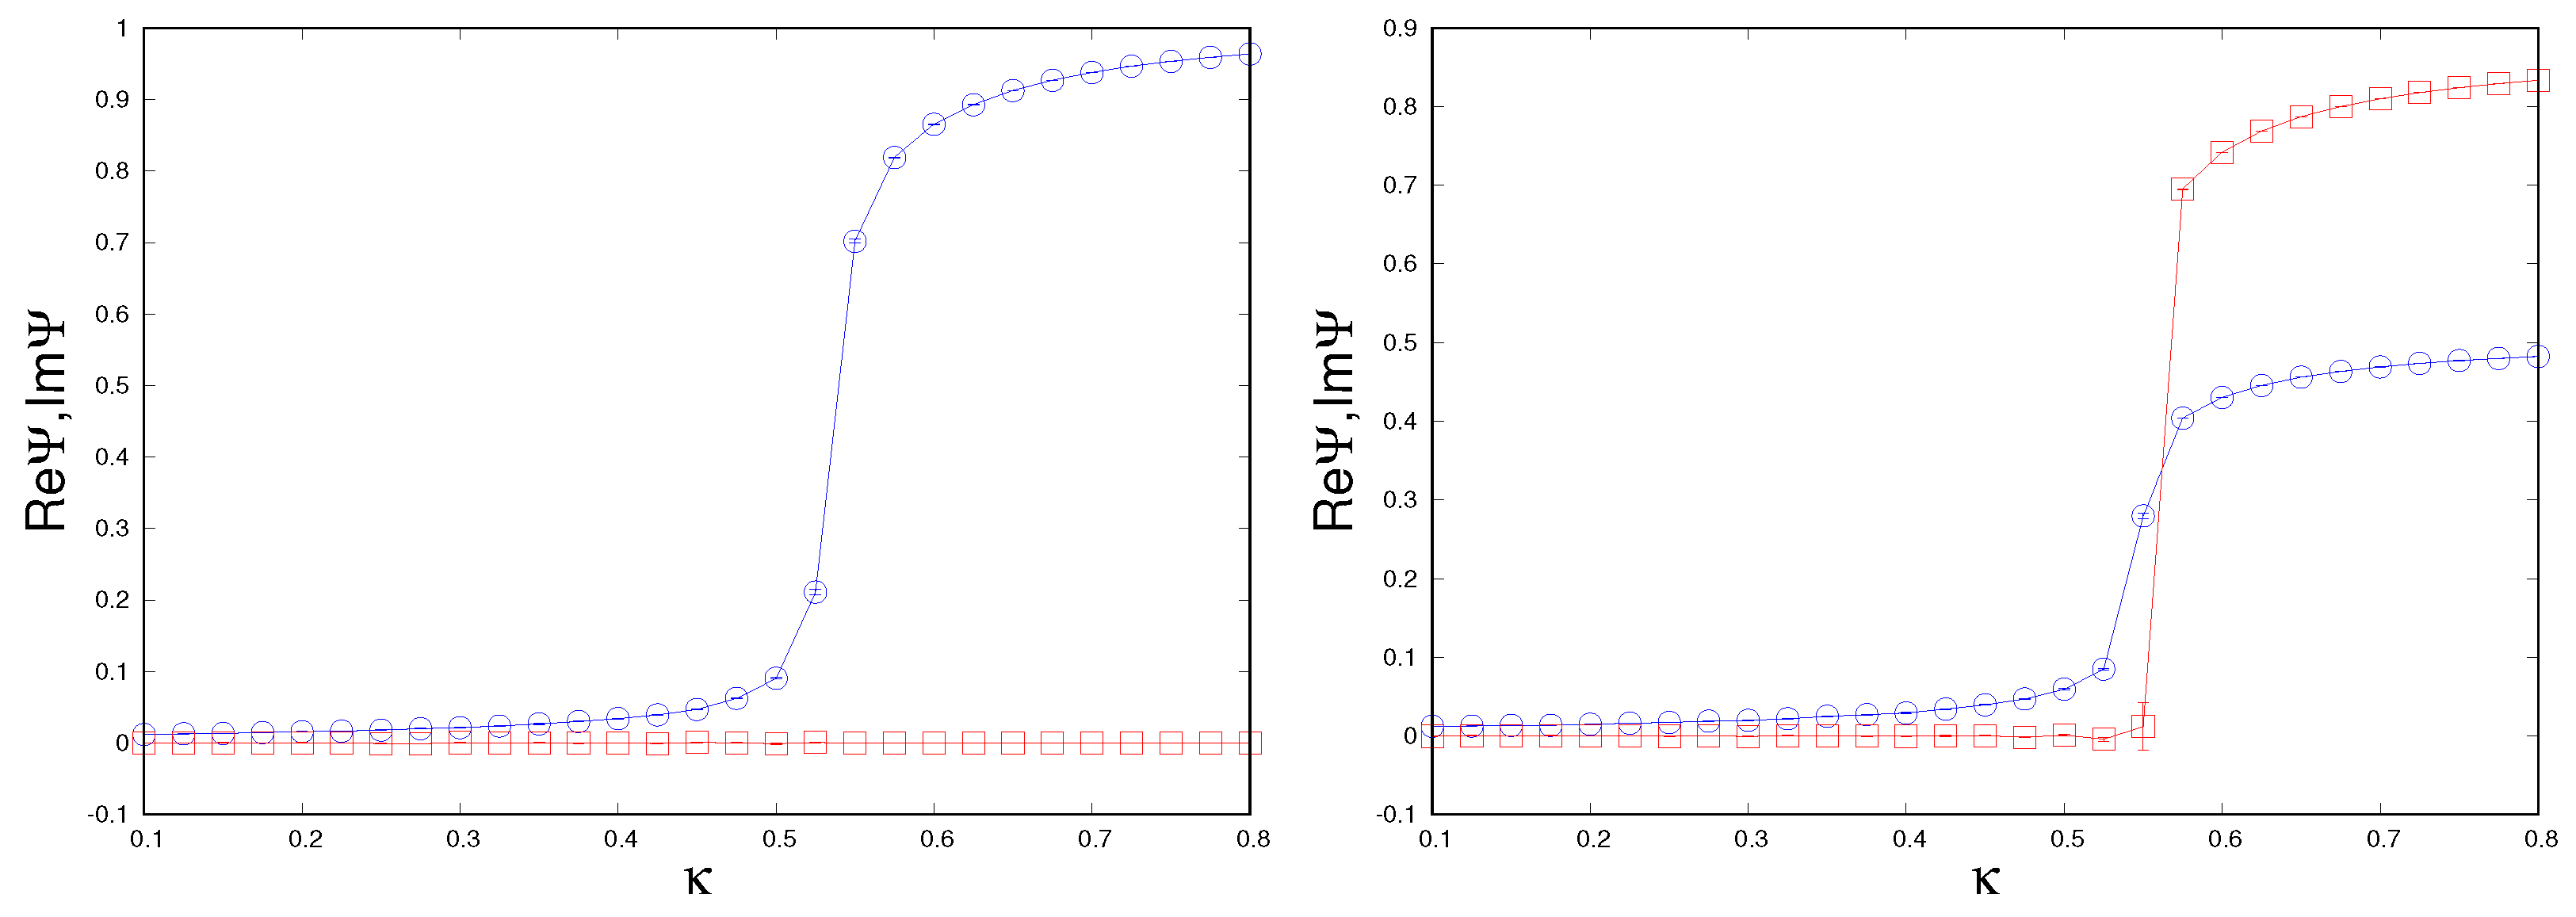
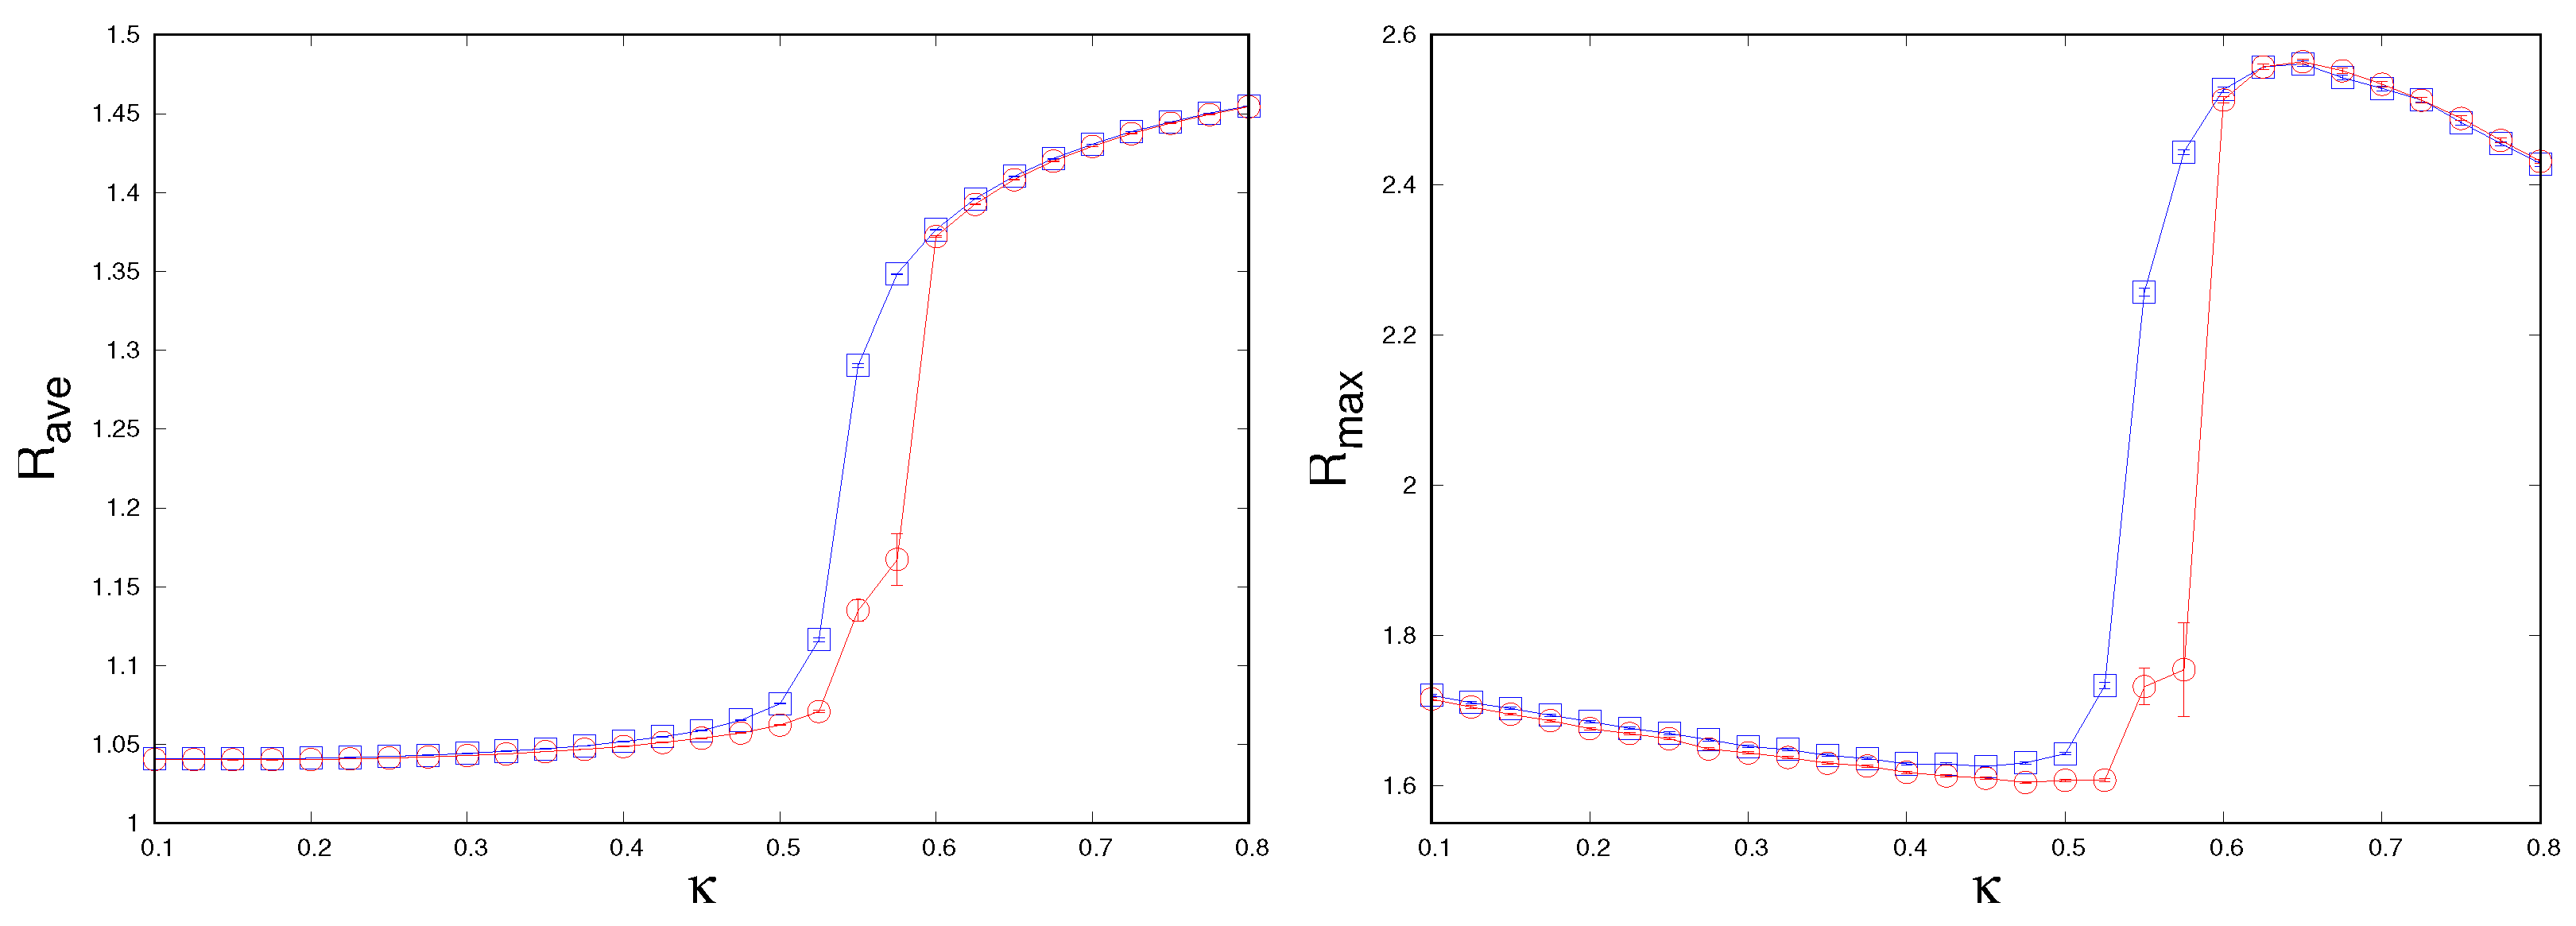
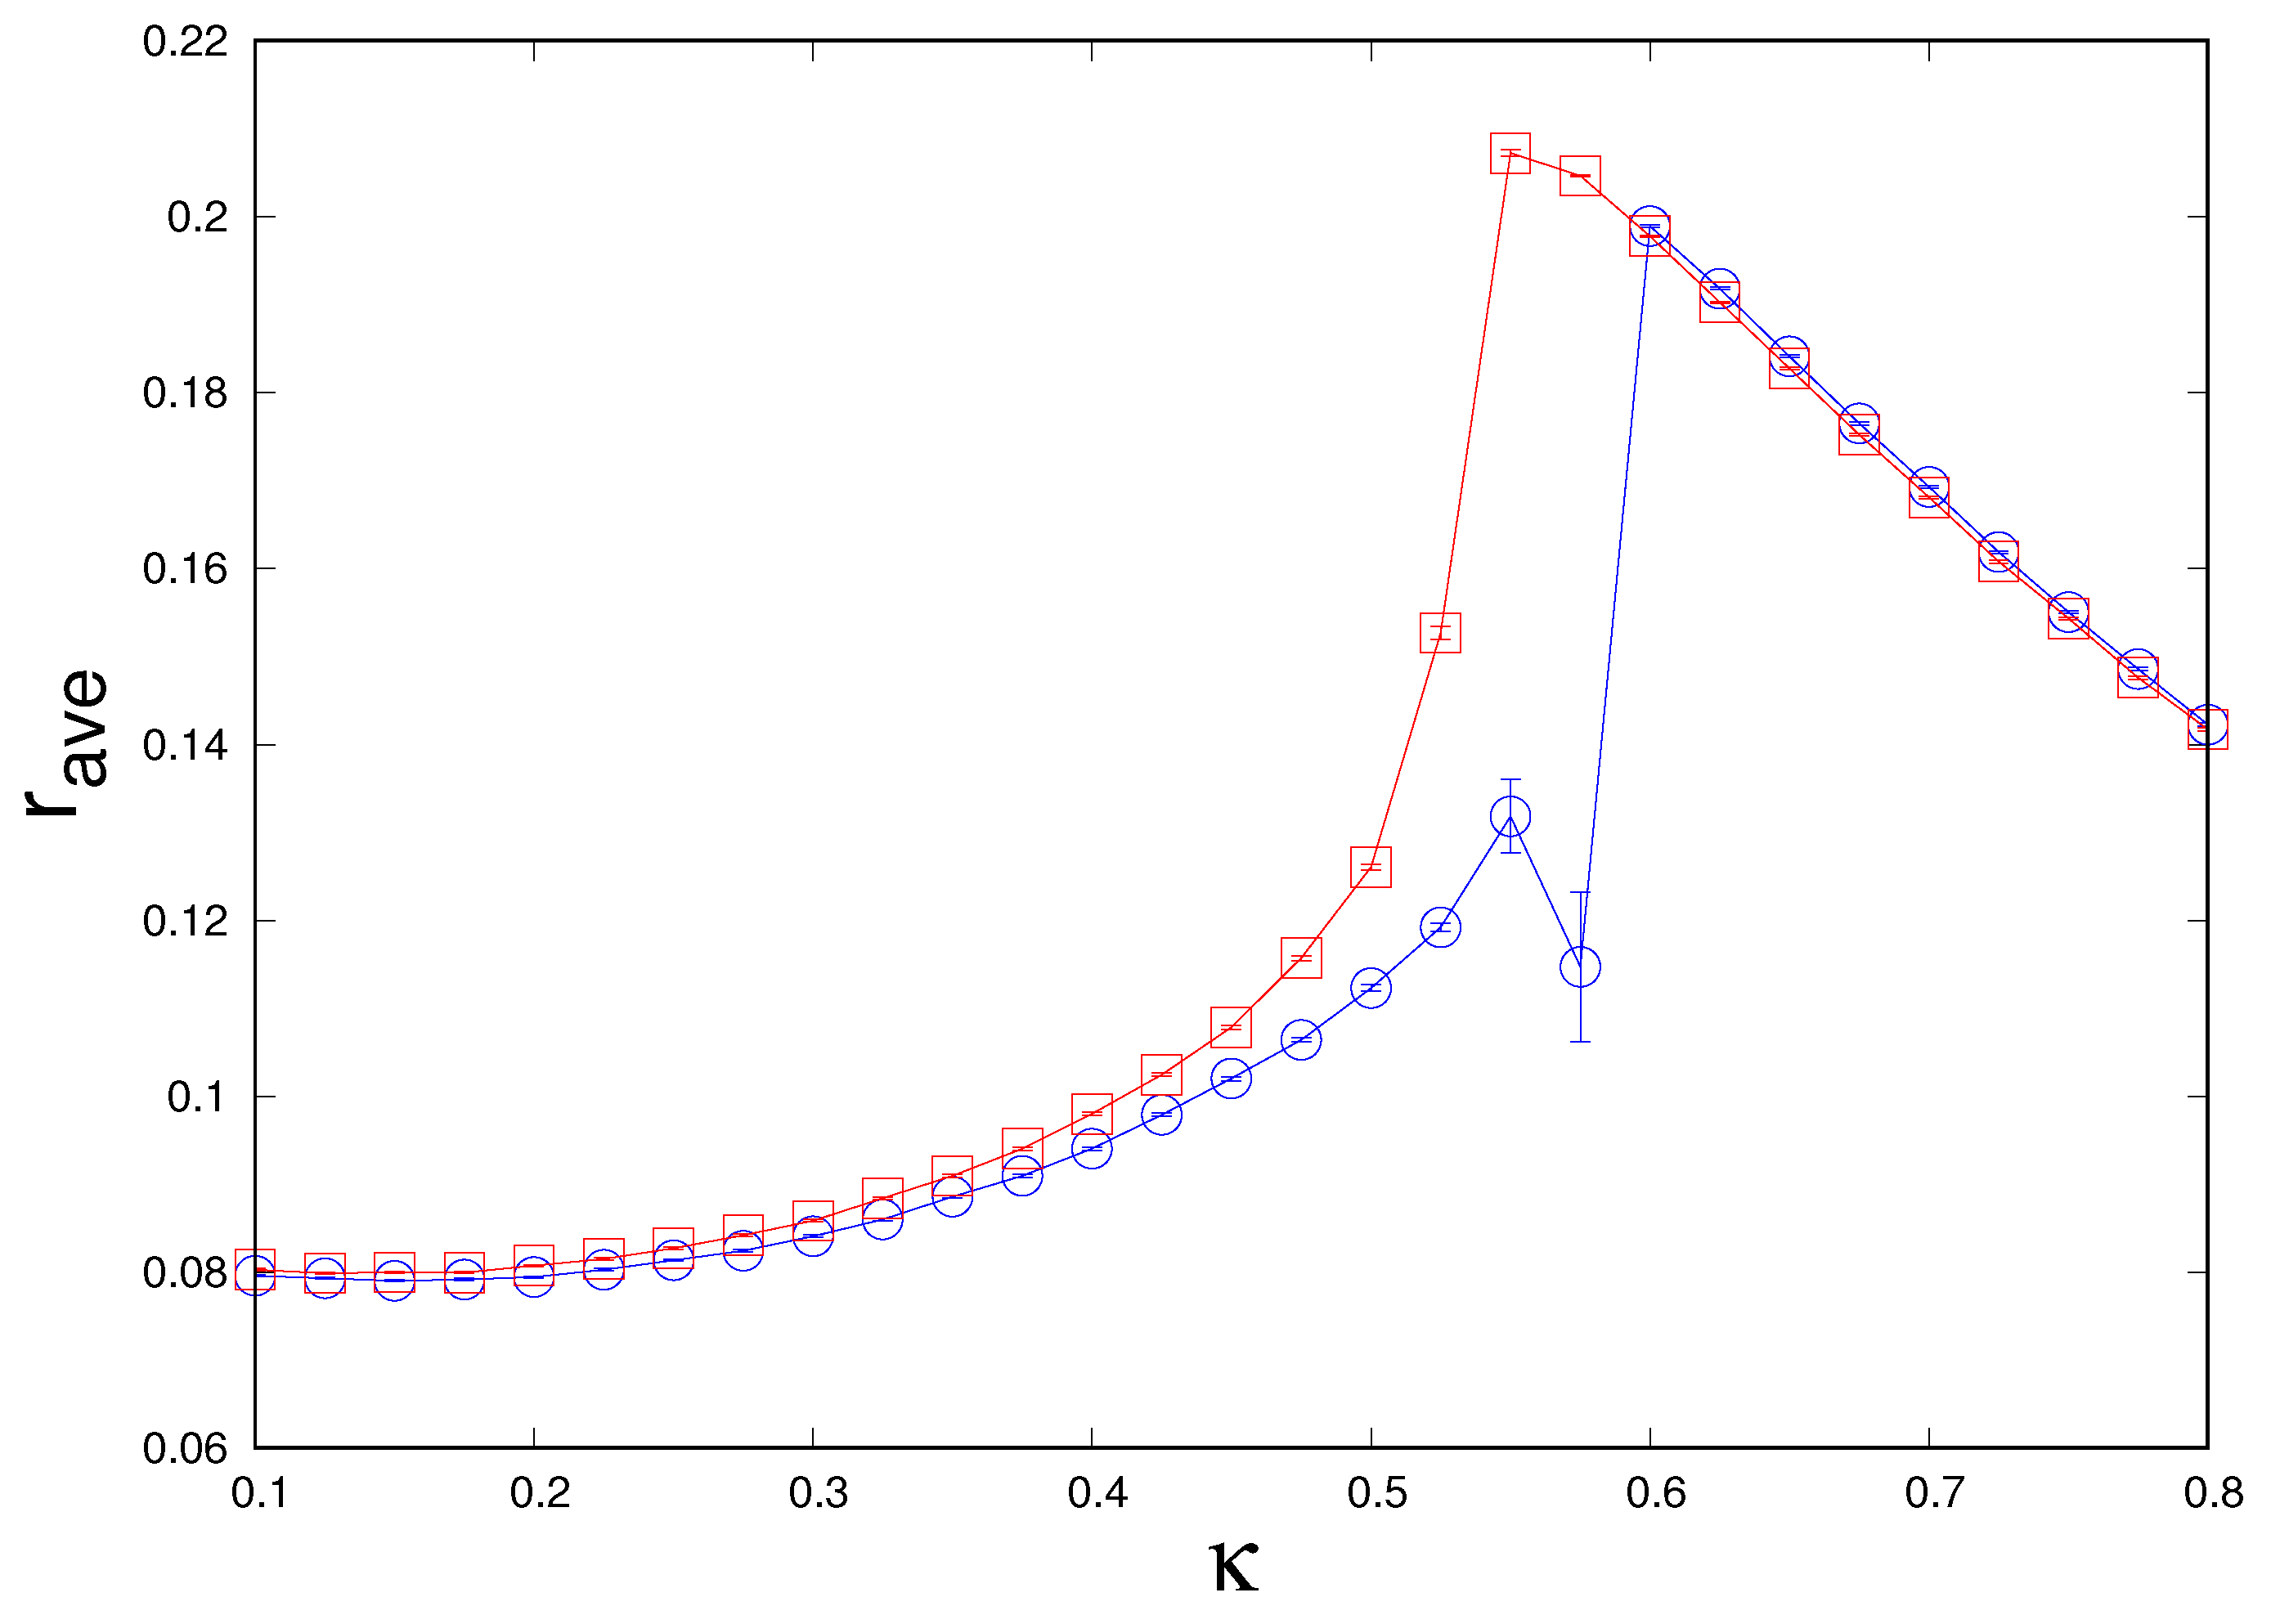
3. Numerical Results

In all the calculations in this study, we set M = 5 and T = 1 . The number of spins in the system is 10 3 . We generate 10 4 configurations for each computation using the Metropolis method [42], and statistical errors of expectation values are estimated using the Jackknife method; see Ref. [43] as an example. The one-spin flipped probability distribution in the Metropolis method is set to P = exp ( β Δ H ) where Δ H is the energy difference for the one-spin flipping process. Persistent homology is estimated using HomCloud [40,41], and we analyze the 1st order homology. Systematic studies with changing M and T will be included in our future work.
First, we check the validity of the present QCD-like Potts model by considering the θ - and the κ -dependence of Ψ because the qualitative behavior of Ψ is well known. The θ -dependence of the modified Polyakov loop ( Ψ ) is shown in Figure 1.
In the large κ region, which corresponds to a high-temperature situation, there is a gap in Im Ψ . On the contrary, we cannot see the gap of Im Ψ in the small κ region, which corresponds to a low-temperature situation. These behaviors match the QCD results at finite imaginary chemical potential; for example, see Refs. [44,45,46,47,48] for lattice QCD data. This indicates that the QCD-like Potts model can pick up some features of the confinement-deconfinement transition of QCD, approximately.
The κ -dependence of Ψ is shown in Figure 2. The left and right panels show the results at θ = 0 and π / 3 , respectively. These panels basically indicate the temperature dependence of Ψ ; small κ almost corresponds to the low T situation and large κ does the high T situation.
Since the numerical calculation at the points where phase transition occurs is difficult, here we shift θ to π / 3 ϵ from π / 3 with ϵ = 10 3 . At θ = π / 3 , we can expect the phase transition, which is the so-called Roberge–Weiss (RW) transition from the model-independent analysis of QCD [25]. We can see the sharp change at κ 0.55 with θ = π / 3 ϵ in our numerical data; this indicates the first-order transition, and the transition point is called the RW endpoint. In contrast, we cannot see such behavior at low temperature. In fact, when the quark mass is sufficiently large, the phase transition (RW endpoint) is usually the first order reported from the lattice QCD simulation; see Ref. [48] as an example. Our numerical data are matched with the fact.
Next, we perform persistent homology analysis on configurations at θ = 0 and near θ = π / 3 . So far, there are no studies that investigate the imaginary chemical potential region using persistent homology even with QCD effective models. Here, we analyze 2nd-order homology, since the configurations are obtained in the three-dimensional space, and then we can have two-dimensional holes. Figure 3 shows the averaged ratio ( R ave ) and the maximum ratio ( R max ) as a function of κ .
We can see that R ave behaves similarly to Ψ . However, R ave shows a little bit of sensitive behavior around κ ∼0.55 compared to Ψ . This indicates that R ave may have more information for the phase transition than Ψ . On the contrary, R max shows the valley and peak structures before and after κ ∼0.55, respectively. Compared with the results at θ = 0 and π / 3 ϵ , there is a difference between them around the phase transition point. This result may be related to the phase separation induced by the first-order transition because the quantitative behavior of the phenomenon is affected by the strength of the first-order transition. These behaviors of R ave and R max were already reported at finite isospin chemical potential in Ref. [11]; the valley structure was found for the first-order transition, but the plateau appears instead of the valley structure when the second-order phase transition occurs. We may say that such behavior is common for the phase transition at least in the QCD-like Potts model, and thus they can be expected to appear in QCD.
Finally, we consider the fluctuation on persistent diagrams: it is a first attempt for persistent homology analysis. Figure 4 shows the fluctuation ( r ave ) as a function of κ at θ = 0 and near θ = π / 3 .
We can see that there is a nontrivial behavior around κ = 0.55 . In addition, the fluctuation starts to strongly increase around the point, and afterwards it starts to decrease. This behavior means that the distribution of data on persistent diagrams is spread out near the phase-transition point, but it is not spread so much below and above the phase-transition point. This means that a similar tendency of the order parameters, which are related with the spontaneous symmetry breaking, are also observed for data of the birth-to-death ratio on persistent diagram. From these results, we can say that not only the averaged and maximum ratios of the birth-and-death times but also the spreading behavior of the data in persistent diagrams relates to the phase transition; we can see the behavior through r ave . It is interesting that we apply this approach to more complicated theories such as the two-dimensional XY model and realistic QCD, which have fruitful phase structures compared to the present QCD-like Potts model, since the quantities shed light on the different faces of the phase transition compared with the standard persistent homology analysis.

4. Summary and Outlook

In this study, we apply the persistent homology analysis to the QCD effective model with heavy quark at finite imaginary chemical potential; e.g., the Potts model with the suitably tuned external field. The quark mass (M) and the chemical potential ( μ ) are introduced to the external field. This model can pick up some properties of the confinement-deconfinement transition appearing in QCD. The imaginary chemical potential ( μ = i μ I ) is considered a laboratory for investigating the phase transition that is closely related to the confinement-deconfinement transition through persistent homology. In fact, this model can reproduce the Roberge–Weiss periodicity and transition, which are important properties of QCD at finite imaginary chemical potential, and thus it can be used as a laboratory for QCD at finite imaginary chemical potential.
To investigate the phase transition from the topological point of view, we consider the averaged ratio and the maximum ratio of birth-and-death times to investigate the global and local topological structures of configurations. In the analysis, we employ point-cloud data to analyze persistent homology; we employ HomCloud on Python to evaluate the persistent homology and configurations are generated using Metropolis method. Furthermore, we consider the fluctuations of persistent diagrams to obtain a deeper understanding of the relationship between the persistent homology and the phase transition. Usually, the fluctuation of order parameters is important and interesting for the phase transition. Therefore, the fluctuation of the persistent diagram may be interesting and is expected to have interesting information on the phase transition.
From the standard persistent homology analysis that analyzes the configurations based on 2nd-order homology, we found that the averaged ratio of birth-and-death times shows the same tendency as the modified Polyakov loop, and the maximum ratio of birth-and-death times shows the valley and peak structures near the phase transition. These results show the same trend as the results obtained from the QCD-like Potts model at finite isospin chemical potential [11]. Therefore, also in the imaginary chemical potential region, the averaged ratio of birth-and-death times represent the global information of the system, and the maximum ratio of birth-and-death times have more information for the system than the averaged one. Therefore, we may conclude that these tendencies are general for the confinement-deconfinement transition, at least in the QCD-like Potts model. From the fluctuation of persistent diagrams, we have the result that the fluctuation actually relates to the phase transition: the spreading behavior of data on persistent diagrams is accentuated around the phase transition point.
In the near future, we will apply the present approach to the two-dimensional XY model and realistic QCD; they have continuous values in the configuration space, and also spatial topology plays a more important role than the present model. Furthermore, it is clarified in this study that the distribution of data on the persistent diagrams plays an important role in the phase transition, and thus it is interesting to apply machine learning for phase recognition based on persistent homology; see Refs. [49,50,51,52,53] for some applications of machine learning for the phase transition as an example. We will discuss this in the near future. In addition, we can consider persistent homology analysis on persistent diagram to investigate the fluctuation. This analysis may pick up new information of the phase transition. We will discuss this elsewhere.

Author Contributions

Conceptualization, K.K.; methodology, all; analysis, H.A.; writing—original draft preparation, K.K.; writing—review and editing, all. All authors have read and agreed to the published version of the manuscript.

Funding

This work is supported in part by the Grants-in-Aid for Scientific Research from JSPS (No. 19H01898 and 22H05112).

Institutional Review Board Statement

Not applicable.

Informed Consent Statement

Not applicable.

Data Availability Statement

Not applicable.

Acknowledgments

K.K. thanks T. Hirakida and H. Kouno for useful discussions on the persistent homology analysis for QCD.

Conflicts of Interest

The authors declare no conflict of interest.

References

  1. Fukushima, K.; Mohanty, B.; Xu, N. Little-Bang and Femto-Nova in Nucleus-Nucleus Collisions. AAPPS Bull. 2021, 31, 1. [Google Scholar] [CrossRef]
  2. Baym, G.; Hatsuda, T.; Kojo, T.; Powell, P.D.; Song, Y.; Takatsuka, T. From hadrons to quarks in neutron stars: A review. Rept. Prog. Phys. 2018, 81, 056902. [Google Scholar] [CrossRef]
  3. McLerran, L.D.; Svetitsky, B. Quark Liberation at High Temperature: A Monte Carlo Study of SU(2) Gauge Theory. Phys. Rev. 1981, D24, 450. [Google Scholar] [CrossRef]
  4. Fukushima, K.; Kojo, T.; Weise, W. Hard-core deconfinement and soft-surface delocalization from nuclear to quark matter. Phys. Rev. D 2020, 102, 096017. [Google Scholar] [CrossRef]
  5. McLerran, L.; Pisarski, R.D. Phases of cold, dense quarks at large N(c). Nucl. Phys. A 2007, 796, 83–100. [Google Scholar] [CrossRef]
  6. Wen, X.G. Topological Order in Rigid States. Int. J. Mod. Phys. 1990, B4, 239. [Google Scholar] [CrossRef]
  7. Sato, M. Topological discrete algebra, ground state degeneracy, and quark confinement in QCD. Phys. Rev. 2008, D77, 045013. [Google Scholar] [CrossRef]
  8. Edelsbrunner, H.; Letscher, D.; Zomorodian, A. Topological persistence and simplification. In Proceedings of the 41st annual Symposium on Foundations of Computer Science, Redondo Beach, CA, USA, 12–14 November 2000; pp. 454–463. [Google Scholar]
  9. Zomorodian, A.; Carlsson, G. Computing persistent homology. Discret. Comput. Geom. 2005, 33, 249–274. [Google Scholar] [CrossRef]
  10. Hirakida, T.; Kashiwa, K.; Sugano, J.; Takahashi, J.; Kouno, H.; Yahiro, M. Persistent homology analysis of deconfinement transition in effective Polyakov-line model. Int. J. Mod. Phys. 2020, 35, 2050049. [Google Scholar] [CrossRef]
  11. Kashiwa, K.; Hirakida, T.; Kouno, H. Persistent Homology Analysis for Dense QCD Effective Model with Heavy Quarks. Symmetry 2022, 14, 1783. [Google Scholar] [CrossRef]
  12. Gattringer, C. Coherent center domains in SU(3) gluodynamics and their percolation at Tc. Phys. Lett. B 2010, 690, 179–182. [Google Scholar] [CrossRef]
  13. Borsanyi, S.; Danzer, J.; Fodor, Z.; Gattringer, C.; Schmidt, A. Coherent center domains from local Polyakov loops. J. Phys. Conf. Ser. 2011, 312, 012005. [Google Scholar] [CrossRef]
  14. Endrodi, G.; Gattringer, C.; Schadler, H.P. Fractality and other properties of center domains at finite temperature: SU(3) lattice gauge theory. Phys. Rev. D 2014, 89, 054509. [Google Scholar] [CrossRef]
  15. de Forcrand, P.; D’Elia, M. On the relevance of center vortices to QCD. Phys. Rev. Lett. 1999, 82, 4582–4585. [Google Scholar] [CrossRef]
  16. Sale, N.; Lucini, B.; Giansiracusa, J. Probing center vortices and deconfinement in SU(2) lattice gauge theory with persistent homology. arXiv 2022, arXiv:2207.13392. [Google Scholar]
  17. Donato, I.; Gori, M.; Pettini, M.; Petri, G.; De Nigris, S.; Franzosi, R.; Vaccarino, F. Persistent homology analysis of phase transitions. Phys. Rev. E 2016, 93, 052138. [Google Scholar] [CrossRef]
  18. Olsthoorn, B.; Hellsvik, J.; Balatsky, A.V. Finding hidden order in spin models with persistent homology. Phys. Rev. Res. 2020, 2, 043308. [Google Scholar] [CrossRef]
  19. Cole, A.; Loges, G.J.; Shiu, G. Quantitative and interpretable order parameters for phase transitions from persistent homology. arXiv 2020, arXiv:2009.14231. [Google Scholar] [CrossRef]
  20. Tran, Q.H.; Chen, M.; Hasegawa, Y. Topological persistence machine of phase transitions. Phys. Rev. E 2021, 103, 052127. [Google Scholar] [CrossRef]
  21. Sale, N.; Giansiracusa, J.; Lucini, B. Quantitative analysis of phase transitions in two-dimensional XY models using persistent homology. Phys. Rev. E 2022, 105, 024121. [Google Scholar] [CrossRef]
  22. Spitz, D.; Urban, J.M.; Pawlowski, J.M. Confinement in non-Abelian lattice gauge theory via persistent homology. arXiv 2022, arXiv:2208.03955. [Google Scholar]
  23. Elbers, W.; van de Weygaert, R. Persistent topology of the reionization bubble network—I. Formalism and phenomenology. Mon. Not. R. Astron. Soc. 2019, 486, 1523–1538. [Google Scholar] [CrossRef]
  24. Cole, A.; Shiu, G. Topological Data Analysis for the String Landscape. JHEP 2019, 3, 054. [Google Scholar] [CrossRef]
  25. Roberge, A.; Weiss, N. Gauge Theories With Imaginary Chemical Potential and the Phases of QCD. Nucl. Phys. 1986, B275, 734. [Google Scholar] [CrossRef]
  26. Kashiwa, K. Imaginary Chemical Potential, NJL-Type Model and Confinement–Deconfinement Transition. Symmetry 2019, 11, 562. [Google Scholar] [CrossRef]
  27. Hasenfratz, A.; Toussaint, D. Canonical ensembles and nonzero density quantum chromodynamics. Nucl. Phys. 1992, B371, 539–549. [Google Scholar] [CrossRef]
  28. Alexandru, A.; Faber, M.; Horvath, I.; Liu, K.F. Lattice QCD at finite density via a new canonical approach. Phys. Rev. 2005, D72, 114513. [Google Scholar] [CrossRef]
  29. Kratochvila, S.; de Forcrand, P. QCD at zero baryon density and the Polyakov loop paradox. Phys. Rev. 2006, D73, 114512. [Google Scholar] [CrossRef]
  30. De Forcrand, P.; Kratochvila, S. Finite density QCD with a canonical approach. Nucl. Phys. Proc. Suppl. 2006, 153, 62–67. [Google Scholar] [CrossRef]
  31. Li, A.; Alexandru, A.; Liu, K.F.; Meng, X. Finite density phase transition of QCD with Nf=4 and Nf=2 using canonical ensemble method. Phys. Rev. 2010, D82, 054502. [Google Scholar] [CrossRef]
  32. Kashiwa, K.; Ohnishi, A. Topological feature and phase structure of QCD at complex chemical potential. Phys. Lett. 2015, B750, 282–286. [Google Scholar] [CrossRef]
  33. Kashiwa, K.; Ohnishi, A. Quark number holonomy and confinement-deconfinement transition. Phys. Rev. 2016, D93, 116002. [Google Scholar] [CrossRef] [Green Version]
  34. Kashiwa, K.; Ohnishi, A. Topological deconfinement transition in QCD at finite isospin density. Phys. Lett. 2017, B772, 669–674. [Google Scholar] [CrossRef]
  35. Wu, F.Y. The potts model. Rev. Mod. Phys. 1982, 54, 235. [Google Scholar] [CrossRef]
  36. Alford, M.G.; Chandrasekharan, S.; Cox, J.; Wiese, U.J. Solution of the complex action problem in the Potts model for dense QCD. Nucl. Phys. 2001, B602, 61–86. [Google Scholar] [CrossRef]
  37. Kim, S.; de Forcrand, P.; Kratochvila, S.; Takaishi, T. The 3-state Potts model as a heavy quark finite density laboratory. PoS 2006, LAT2005, 166. [Google Scholar]
  38. Kashiwa, K.; Kouno, H. Information theoretical view of QCD effective model with heavy quarks. Phys. Rev. D 2021, 103, 014014. [Google Scholar] [CrossRef]
  39. Sakai, Y.; Kashiwa, K.; Kouno, H.; Yahiro, M. Polyakov loop extended NJL model with imaginary chemical potential. Phys. Rev. 2008, D77, 051901. [Google Scholar] [CrossRef]
  40. Obayashi, I.; Nakamura, T.; Hiraoka, Y. Persistent Homology Analysis for Materials Research and Persistent Homology Software: HomCloud. J. Phys. Soc. Jpn. 2022, 91, 091013. [Google Scholar] [CrossRef]
  41. HomCloud. Available online: http://www.wpi-aimr.tohoku.ac.jp/hiraoka_labo/homcloud-english.html (accessed on 1 February 2023).
  42. Metropolis, N.; Rosenbluth, A.W.; Rosenbluth, M.N.; Teller, A.H.; Teller, E. Equation of state calculations by fast computing machines. J. Chem. Phys. 1953, 21, 1087–1092. [Google Scholar] [CrossRef]
  43. Wu, C.F.J. Jackknife, bootstrap and other resampling methods in regression analysis. Ann. Stat. 1986, 14, 1261–1295. [Google Scholar] [CrossRef]
  44. D’Elia, M.; Lombardo, M.P. Finite density QCD via imaginary chemical potential. Phys. Rev. 2003, D67, 014505. [Google Scholar] [CrossRef]
  45. de Forcrand, P.; Philipsen, O. The QCD phase diagram for small densities from imaginary chemical potential. Nucl. Phys. 2002, B642, 290–306. [Google Scholar] [CrossRef] [Green Version]
  46. D’Elia, M.; Lombardo, M.P. QCD thermodynamics from an imaginary mu(B): Results on the four flavor lattice model. Phys. Rev. 2004, D70, 074509. [Google Scholar] [CrossRef]
  47. Chen, H.S.; Luo, X.Q. Phase diagram of QCD at finite temperature and chemical potential from lattice simulations with dynamical Wilson quarks. Phys. Rev. 2005, D72, 034504. [Google Scholar] [CrossRef]
  48. D’Elia, M.; Sanfilippo, F. The Order of the Roberge-Weiss endpoint (finite size transition) in QCD. Phys. Rev. 2009, D80, 111501. [Google Scholar] [CrossRef]
  49. Tanaka, A.; Tomiya, A. Detection of phase transition via convolutional neural network. J. Phys. Soc. Jap. 2017, 86, 063001. [Google Scholar] [CrossRef]
  50. Carrasquilla, J.; Melko, R.G. Machine learning phases of matter. Nat. Phys. 2017, 13, 431–434. [Google Scholar] [CrossRef]
  51. Aoki, K.I.; Fujita, T.; Kobayashi, T. What does deep learning of statistical system learn? J. Jpn. Soc. Artif. Intell. 2018, 33, 420. [Google Scholar]
  52. Kashiwa, K.; Kikuchi, Y.; Tomiya, A. Phase transition encoded in neural network. PTEP 2019, 2019, 083A04. [Google Scholar] [CrossRef]
  53. Aoki, K.I.; Fujita, T.; Kobayashi, T. Logical Reasoning for Revealing the Critical Temperature through Deep Learning of Configuration Ensemble of Statistical Systems. J. Phys. Soc. Jap. 2019, 88, 054002. [Google Scholar] [CrossRef] [Green Version]
Figure 1. The θ -dependence of Ψ at θ = 0 and π / 3 ϵ , where we set to ϵ = 10 3 . The (left) and (right) panels show the real and imaginary parts of Ψ , respectively. The circle and square symbols are the results of the high- and low-temperature situations, respectively. Lines in all panels in this paper are the eye guides.
Universe 09 00082 g001
Figure 2. The κ -dependence of Ψ . The (left) and (right) panels show the results at θ = 0 and π / 3 ϵ , respectively. The circle and square symbols are the results of the real and imaginary parts of Ψ , respectively.
Universe 09 00082 g002
Figure 3. The κ -dependence of the ratio of the birth-and-death times calculated from configurations. The (left) and (right) panels show the results of R ave and R max , respectively. The square and circle symbols are the results at θ = 0 and π / 3 ϵ , respectively.
Universe 09 00082 g003
Figure 4. The κ -dependence of fluctuation calculated from persistent diagrams. The square and circle symbols are the results at θ = 0 and π / 3 ϵ , respectively.
Universe 09 00082 g004
Disclaimer/Publisher’s Note: The statements, opinions and data contained in all publications are solely those of the individual author(s) and contributor(s) and not of MDPI and/or the editor(s). MDPI and/or the editor(s) disclaim responsibility for any injury to people or property resulting from any ideas, methods, instructions or products referred to in the content.

