Review

Yutu-2 Radar Observations at the Chang’E-4 Landing Site: The Shallow Geological Structure and Its Dielectric Properties

1
Institute of Advance Study, Shenzhen University, Shenzhen 518060, China
2
Institute of Moon-Base Exploration and Observation, Shenzhen University, Shenzhen 518060, China
*
Author to whom correspondence should be addressed.
Universe 2023, 9(11), 461; https://doi.org/10.3390/universe9110461
Submission received: 11 September 2023 / Revised: 12 October 2023 / Accepted: 24 October 2023 / Published: 27 October 2023

Abstract

:
China has successfully carried out five lunar exploration missions since 2007. These missions indicate that China has successfully implemented a three-step lunar exploration program of “orbiting, landing, and returning”. Among them, the Lunar Penetrating Radar (LPR) carried by the Yutu-2 rover in the Chang’E-4 (CE-4) mission is the only one still operating on the far side of the Moon. Up to now, the Yutu-2 radar has measured a large amount of scientific data, and its observations are of great significance to human cognition of the geological evolution of the lunar surface and the exploration of possible lunar in situ resources. This paper reviews the scientific results obtained by previous researchers based on the radar exploration data of Yutu-2, focusing mainly on three aspects, e.g., the geological structure of the shallow surface at the CE-4 landing site, the dielectric properties of the shallow subsurface materials and the special geological features. Finally, the prospects of Yutu-2 radar research priorities and future exploration, and the application trend of Moon-based ground-penetrating radar are given.

1. Introduction

The Moon is the closest extraterrestrial body to the Earth, and it has always been one of the preferred targets for human astronomical and space exploration activities [1,2,3]. The Moon has not only had a significant impact on human production and life but has also had a profound influence on the cultural development and civilization progress of humans [4]. The desire of human beings to explore the Moon has never stopped, and the exploration activities of the Moon can be roughly divided into the following stages: naked-eye observation, observation of the Moon using telescopes, space exploration of the Moon, and the development and use of lunar resources [1].
The first artificial satellite launched by the Soviet Union in 1957, named Sputnik 1, marked the beginning of the space era for human beings [5]. After that, people conducted a series of missions to explore the Moon. These missions include the Pioneer, Ranger, Apollo, and Luna in the 20th century.Furthermore, they also includes the latest missions like CLEMENTINE, LUNAR PROSPECTOR, NASA’s Lunar Reconnaissance Orbiter (LRO), and the Chang’E series of missions from China [6]. Among them, CE-4 achieved the first soft landing of a human probe on the far side of the Moon [7,8,9]. As of now, Yutu-2 is still working on the far side of the Moon, acquiring a large amount of exploration data, which provides valuable first-hand information for scientific research on the Moon [10]. The CE-4 spacecraft is the backup of Chang’E-3 (CE-3), and the Yutu-2 rover mainly carried on it is the same as the Yutu rover carried by CE [11]. The Yutu-2 rover carries mainly four scientific payload devices, e.g., the panoramic camera, the Lunar Penetrating Radar (LPR), the Visible and Near-Infrared Imaging Spectrometer (VNIS), and the Advanced Small Analyzer for Neutrals (ASAN) [11]. Using those devices we can complete tasks like investigating the geomorphology, mineral compositions, chronology, and subsurface structure of the Moon [9,12]. Among them, the LPR consists of a transmitting and receiving split antenna, with the transmitting antenna emitting ultra-wideband carrier-free pulses into the lunar surface. The reflected signals are received by the receiving antenna from the probe [13,14]. Then the radar observation data after preprocessing and other operations, are released to the public scientific community.
The radar carried by Yutu-2 actually is a ground penetrating radar (GPR) [13,15]. Planetary GPR are applied both for satellites to map sub-glacial water bodies on Mars [16,17], and for in situ measurements of the planet’s subsurface [8]. The LPR consists of two channels. The center frequency of the low-frequency channel is 60 MHz, whose vertical resolution is meter-level, and the detection depth of it is greater than 100 m [13,18], aiming to detect the subsurface structure on the lunar rover’s traveling route [14]. The center frequency of the high-frequency radar is 500 MHz, and the vertical resolution in the lunar regolith is better than 0.3 m, which is used to detect the subsurface structure and thickness of the lunar regolith [14]. The range resolution of the high-frequency radar in the simulated lunar regolith of the ground experiment can reach ∼0.17 m, and the detection depth in the glacier is greater than 50 m [18]. On 3 January 2019, the CE-4 mission lander and rover successfully landed on the floor of the Von Kármán Crater (177.588° E, 45.457° S) in the South Pole-Aitken Basin [19,20], shown in Figure 1. The landing site was chosen for several reasons:
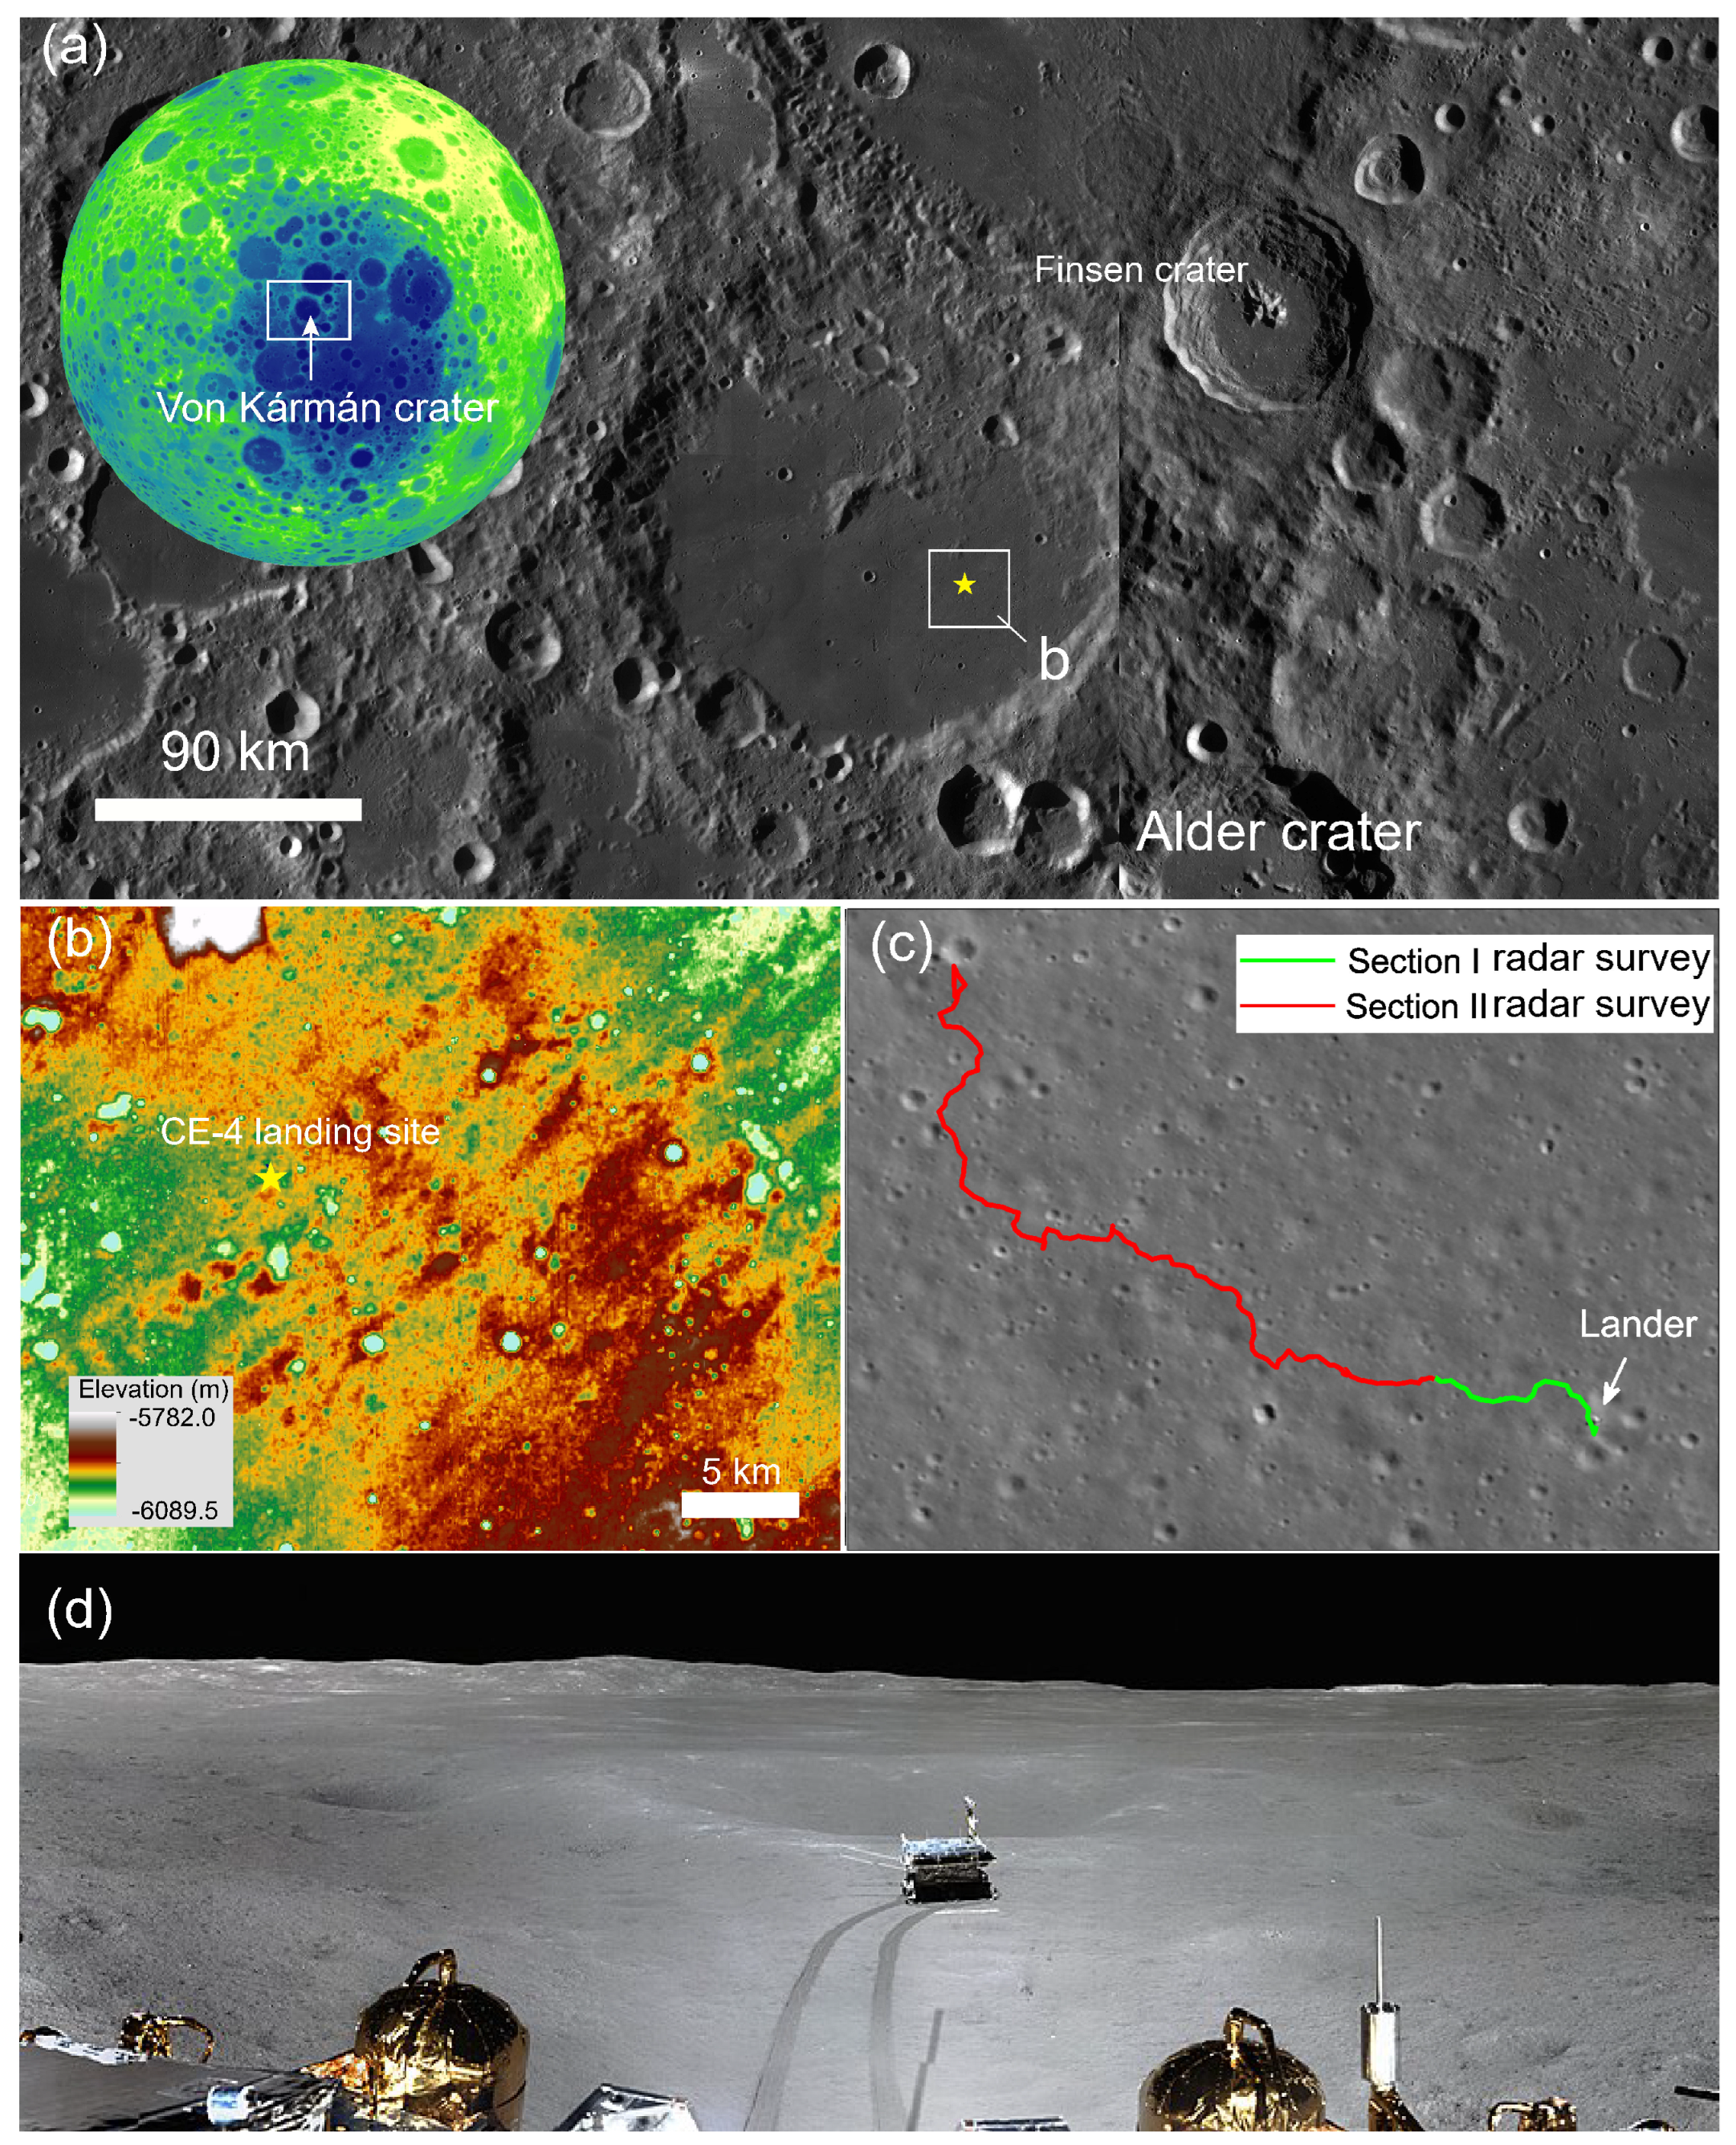
  • Smooth terrain on the bottom of Von Kármán crater: The relatively flat bottom of the Von Kármán crater is crucial for the safe landing of the lander and rover [21]. The lander requires a relatively flat area to reduce risks and ensure a successful and stable landing.
  • Rich geological features: The Von Kármán crater’s bottom exhibits a wealth of geological features. These features provide a unique opportunity for scientists to gain a deeper understanding of the geology and evolutionary history beneath the lunar surface [22]. Most importantly, previous studies discovered water and hydroxyl signatures in rocks on the Moon [23,24].
  • Formation of the Von Kármán crater: The process of the Von Kármán crater’s formation may have involved excavating material from the Moon’s interior [25], including substances from the lunar mantle, such as olivine and pyroxene [26]. These materials may have been ejected to the surface during the crater’s formation, offering valuable insights into the Moon’s early formation.
By studying the Von Kármán crater, scientists can obtain essential insights into the Moon’s evolution, geological history, and internal structure. This contributes to a better understanding of the Moon’s origin and evolution, as well as its reflection on the early history of the solar system. Therefore, the CE-4 mission holds significant importance for lunar scientific research and exploration. By the end of May 2022, the CE-4 lander and the Yutu-2 rover had completed 42 days of scientific exploration, with a cumulative driving distance of 1171.8 m. As of 6 June 2023, the Yutu-2 rover had already sent back precious and scientific data for 53 lunar days. The findings observed by the Radar from the Yutu-2 rover have given us a new understanding of the characteristics of the far-side region of the Moon.
Our paper focuses on an overview of the previous studies on the geological structure of the shallow surface layer in the landing area of CE-4, the dielectric properties of the shallow surface materials, and the special geological structures. The paper also gives an outlook on the application prospect of a Moon-based GPR.
Figure 1. Geologic background of the CE–4 landing area on the Moon (modified from Ding et al. [15] and Feng et al. [27]); (a) location of the landing area; (b) digital elevation model of the landing area; (c) traveling route of the Yutu–2 rover on the lunar surface; (d) operating scene of Yutu–2 rover on the surface of the Moon.
Universe 09 00461 g001

2. Shallow Geological Structures of CE-4 Landing Site

Yutu-2 is the first rover to land on the far side of the Moon, and the LPR is capable of transmitting radar electromagnetic rader waves to the lunar surface [8]. When electromagnetic waves propagate through the ground of the Moon, they are reflected at the interfaces of different materials because different materials have different dielectric constants [13]. Therefore, the echo signals received by the receiving antenna of Yutu-2 are essentially the reflection signals generated at the interfaces when the electromagnetic waves pass through different media. After the raw data received by the LPR are processed using normalization and DC (direct component) removal and other processes [28,29]. By plotting these data on a 2-D plan view (B-scan), the location of the boundary of materials and the difference between the materials on two sides of the boundary can be observed in a more intuitive way, providing information support for the subsequent geological interpretation. The radar frequencies of the two channels are different, and so are the resolutions of them. Channel 1 is a low-frequency radar, and its effective penetration depth is roughly several hundred meters. Channel 2 is a high-frequency radar, and its effective penetration depth is roughly several tens of meters [11,13]. Therefore, when interpreting the shallow surface structure of the CE-4 landing zone, it is usually divided into high and low-frequency radar observations for respective interpretation.

2.1. High-Frequency LPR Radar Observation

According to the research of Xiao et al. [30], the effective detection depth of the high-frequency radar carried by Yutu-2 is about 40 m. The signal beyond 40 m is close to the noise level and, thus, useless [30]. Therefore, the observation data of the high-frequency radar can be used to discuss the stratification of geological structures from the surface to a 40 m depth. According to researchers, the geological subsurface observed by the radar of 40 m can be roughly divided into three geological units (Figure 2), as in the following description:
The first layer is the shallow, fine-grained lunar regolith at a depth of 0–12 m below the surface [8]. According to the radar data after tomographic reconstruction, most of the echo reflectivity in this layer is small, and the distribution of materials is relatively uniform. Therefore, it can be speculated that the material in this layer is mainly fine-grained lunar regolith particles less than 1 cm in diameter [8]. According to the morphological method of the impact crater, the location of the low calcium pyroxene of the Von Kármán crater is about 8–13 m below the surface [31], which is consistent with the study of Li et al. [8]. Meanwhile, Li et al. [8] believes that the materials in this layer are developed from the ejecta of craters like the Finsen, Von Kármán L, and L’ craters [8]. Yuan et al. [32] made a more detailed division in the division in this layer. Yuan et al. [32] believes there is also a geological boundary 2.5 m below the lunar surface. Their research shows that the material between 0 and 2.5 m is from the von Kármán L and L ’crater ejecta (each crater contributes about 1 m in depth), while the materials between 2.5 m to about 12 m are from contemporary craters such as the Finsen [32]. Furthermore, it is supported by the results obtained with optical and multispectral imagery [33].
This layer was further subdivided into multiple geologic structures for a more refined study [34]. Giannakis et al. [34] suggests that ejecta from the Von Kármán L and L’ craters cover the entirety of the layer, while ejecta from the Finsen crater are further down. Based on data from Lu et al. [35] and the chemical composition analysis from Huang et al. [36], Giannakis et al. [34] divided the subsurface 0–12 m in the detection area of the Yutu-2 rover into four more detailed sublayers (Figure 2c). Among them, the material in the first two layers and the latter two layers originated from the ejecta of the Von Kármán L and the L’ craters, respectively.
Figure 2. (a) Radargram obtained within the first two lunar days (adopted from Li et al. [8]). (b) Geological stratification diagram of the shallow surface layer in the detection area observed with the high-frequency radar, adopted from Zhang et al. [37]. (c) Geological stratification from 0 to 12 m (HCP and LCP for high–calcium pyroxene and low–calcium pyroxene, respectively), adopted from Giannakis et al. [34].
Universe 09 00461 g002
The second layer is a mixture layer ranging from 12 m to 24 m. The layer is characterized by a number of large rock fragments sandwiched between two layers of fine–grained lunar regolith. The Finsen crater is an Eratosthenian crater of about 3.2 Ga [38,39,40], older than the von Kármán L and L’ impact crates. The Yutu-2 detection route is located within the secondary crater chain ejecta range of the Finsen crater, so the large numbers of rocks in this layer are interpreted as ejecta deposits from the Finsen crater. However, the formation of ejecting sediment beyond the ejecting blanket of the source impact crater is not only through carpeting but is also accompanied by a series of transformation processes such as shearing, mixing, and excavation [41]. It makes the source of the material layer not necessarily homologous. The tiny–sized rock fragments inside the ejecta may have similar physical properties to the fine-grained lunar regolith. Therefore, it can be inferred that the material composition of the second layer consists of about three parts:
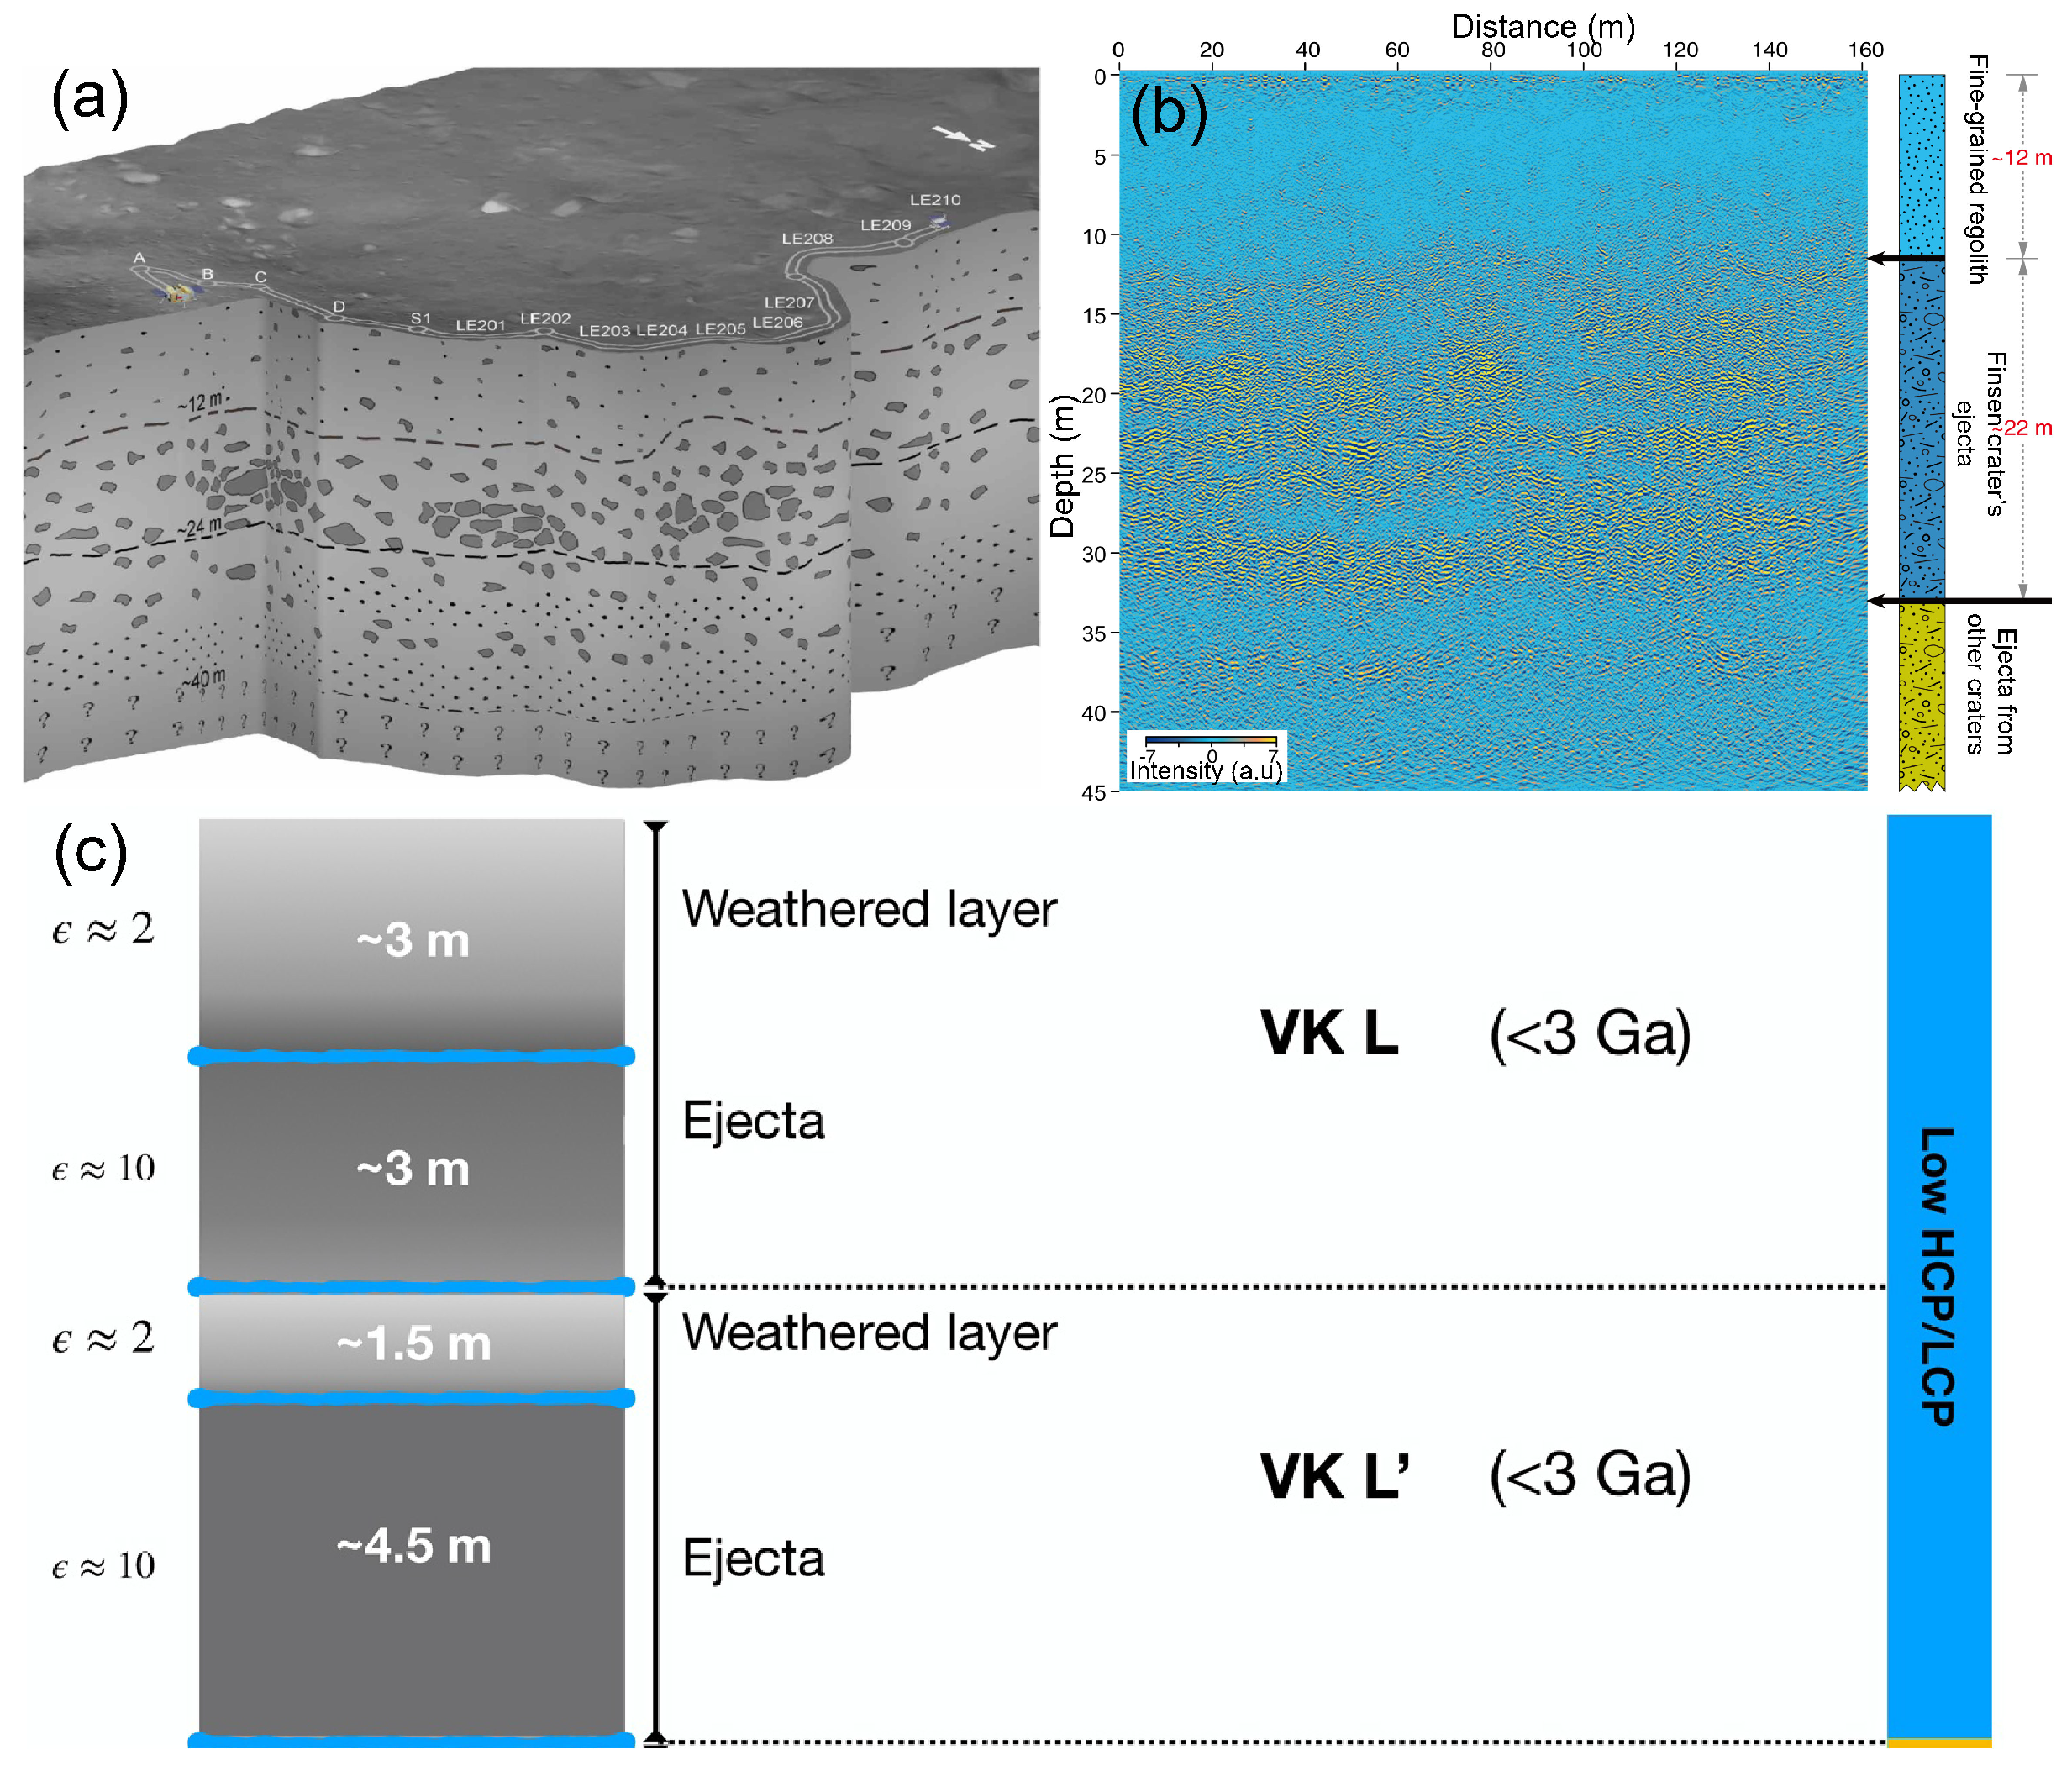
  • The unmodified or moved ejecta material from the impact crater.
  • Local substances modified by impacts from the ejecta.
  • The fine-grained lunar regolith that is naturally formed after an impact event [8].
Using the model of the relation between the crater diameter and the distance of the crater to the CE-4 site, we can estimate an ejecta thickness of 7.2 to 15.5 m [36]. Therefore, the layer can be further divided into two layers: 12–16 m and 16–24 m. The former came from the ejecta, the excavated material of the Finsen crater, and the paleo-regolith formed after the impact, while the latter was formed before the Finsen event.
The third layer is a 24–40 m thickness of accumulated ejecta. This layer is characterized by the alternating layers. These substances were made by ejecta from Alder [36], Leibnitz [38,42] and other older craters [43] before the Finsen event. Furthermore, it has a layer between 35 m and 40 m that is interpreted as the bedrock of basalt indicated by crater geomorphological evidence [36,44]. The signal noise and strong uncertainty are high below 40 m, so it is difficult to determine the accurate depth of Imbrium basalt and the more downward material composition [8,37].
In summary, although it can have a lot of nonuniqueness when interpreting the radar data [45], the echo signals of the Yutu-2 high-frequency radar are relatively clear and clearly stratified, making the stratification of the detected area basically consistent with studies [8,30,34,36,37,46,47]. However, due to different methods of processing the LPR data and different interpretations of the geological background of the landing zone, various researchers have different interpretations of the evolutionary process and the origin of different layers [8,30,47]. Therefore, a more quantitative and accurate determination of the distribution of the dielectric constant of subsurface materials is urgently needed in the future.

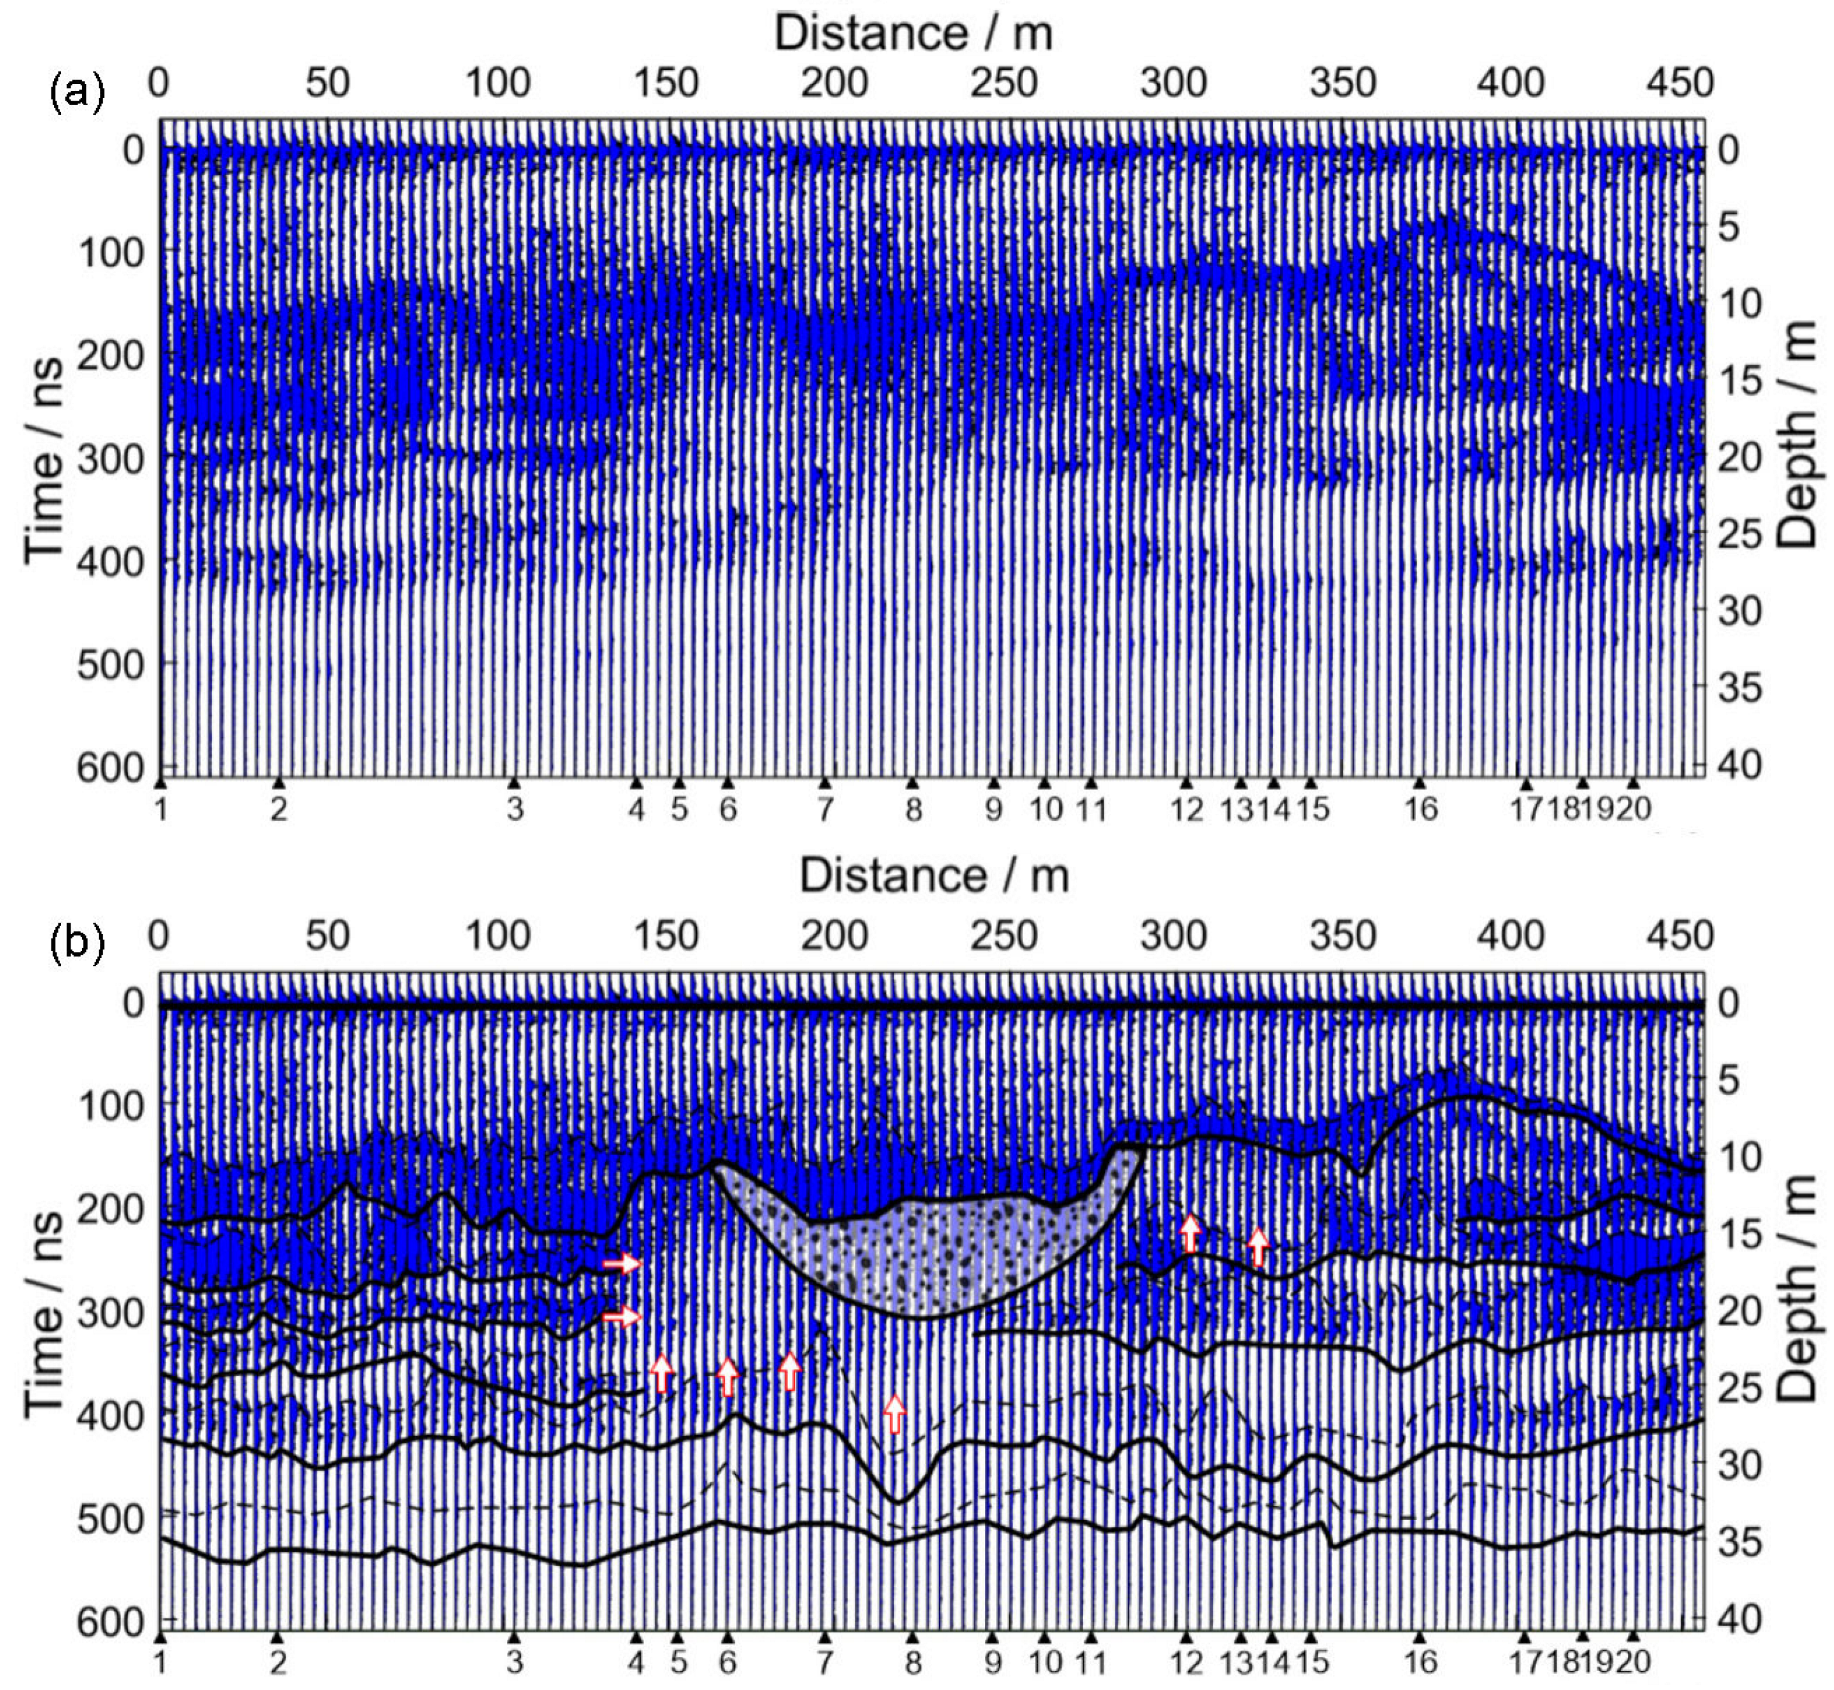
2.2. Low-Frequency LPR Radar Observation

In the interpretation of low-frequency radar observations, different researchers have made various divisions from different aspects [32,37,46,48]. For the rough division explanation, we will mainly use the division pattern of Feng et al. [49]. For a more visual and detailed look at the division, it is shown in the division graph (Figure 3) of Feng et al. [49]. Zhang et al. [37] divided the 450 m below the lunar surface into three layers:
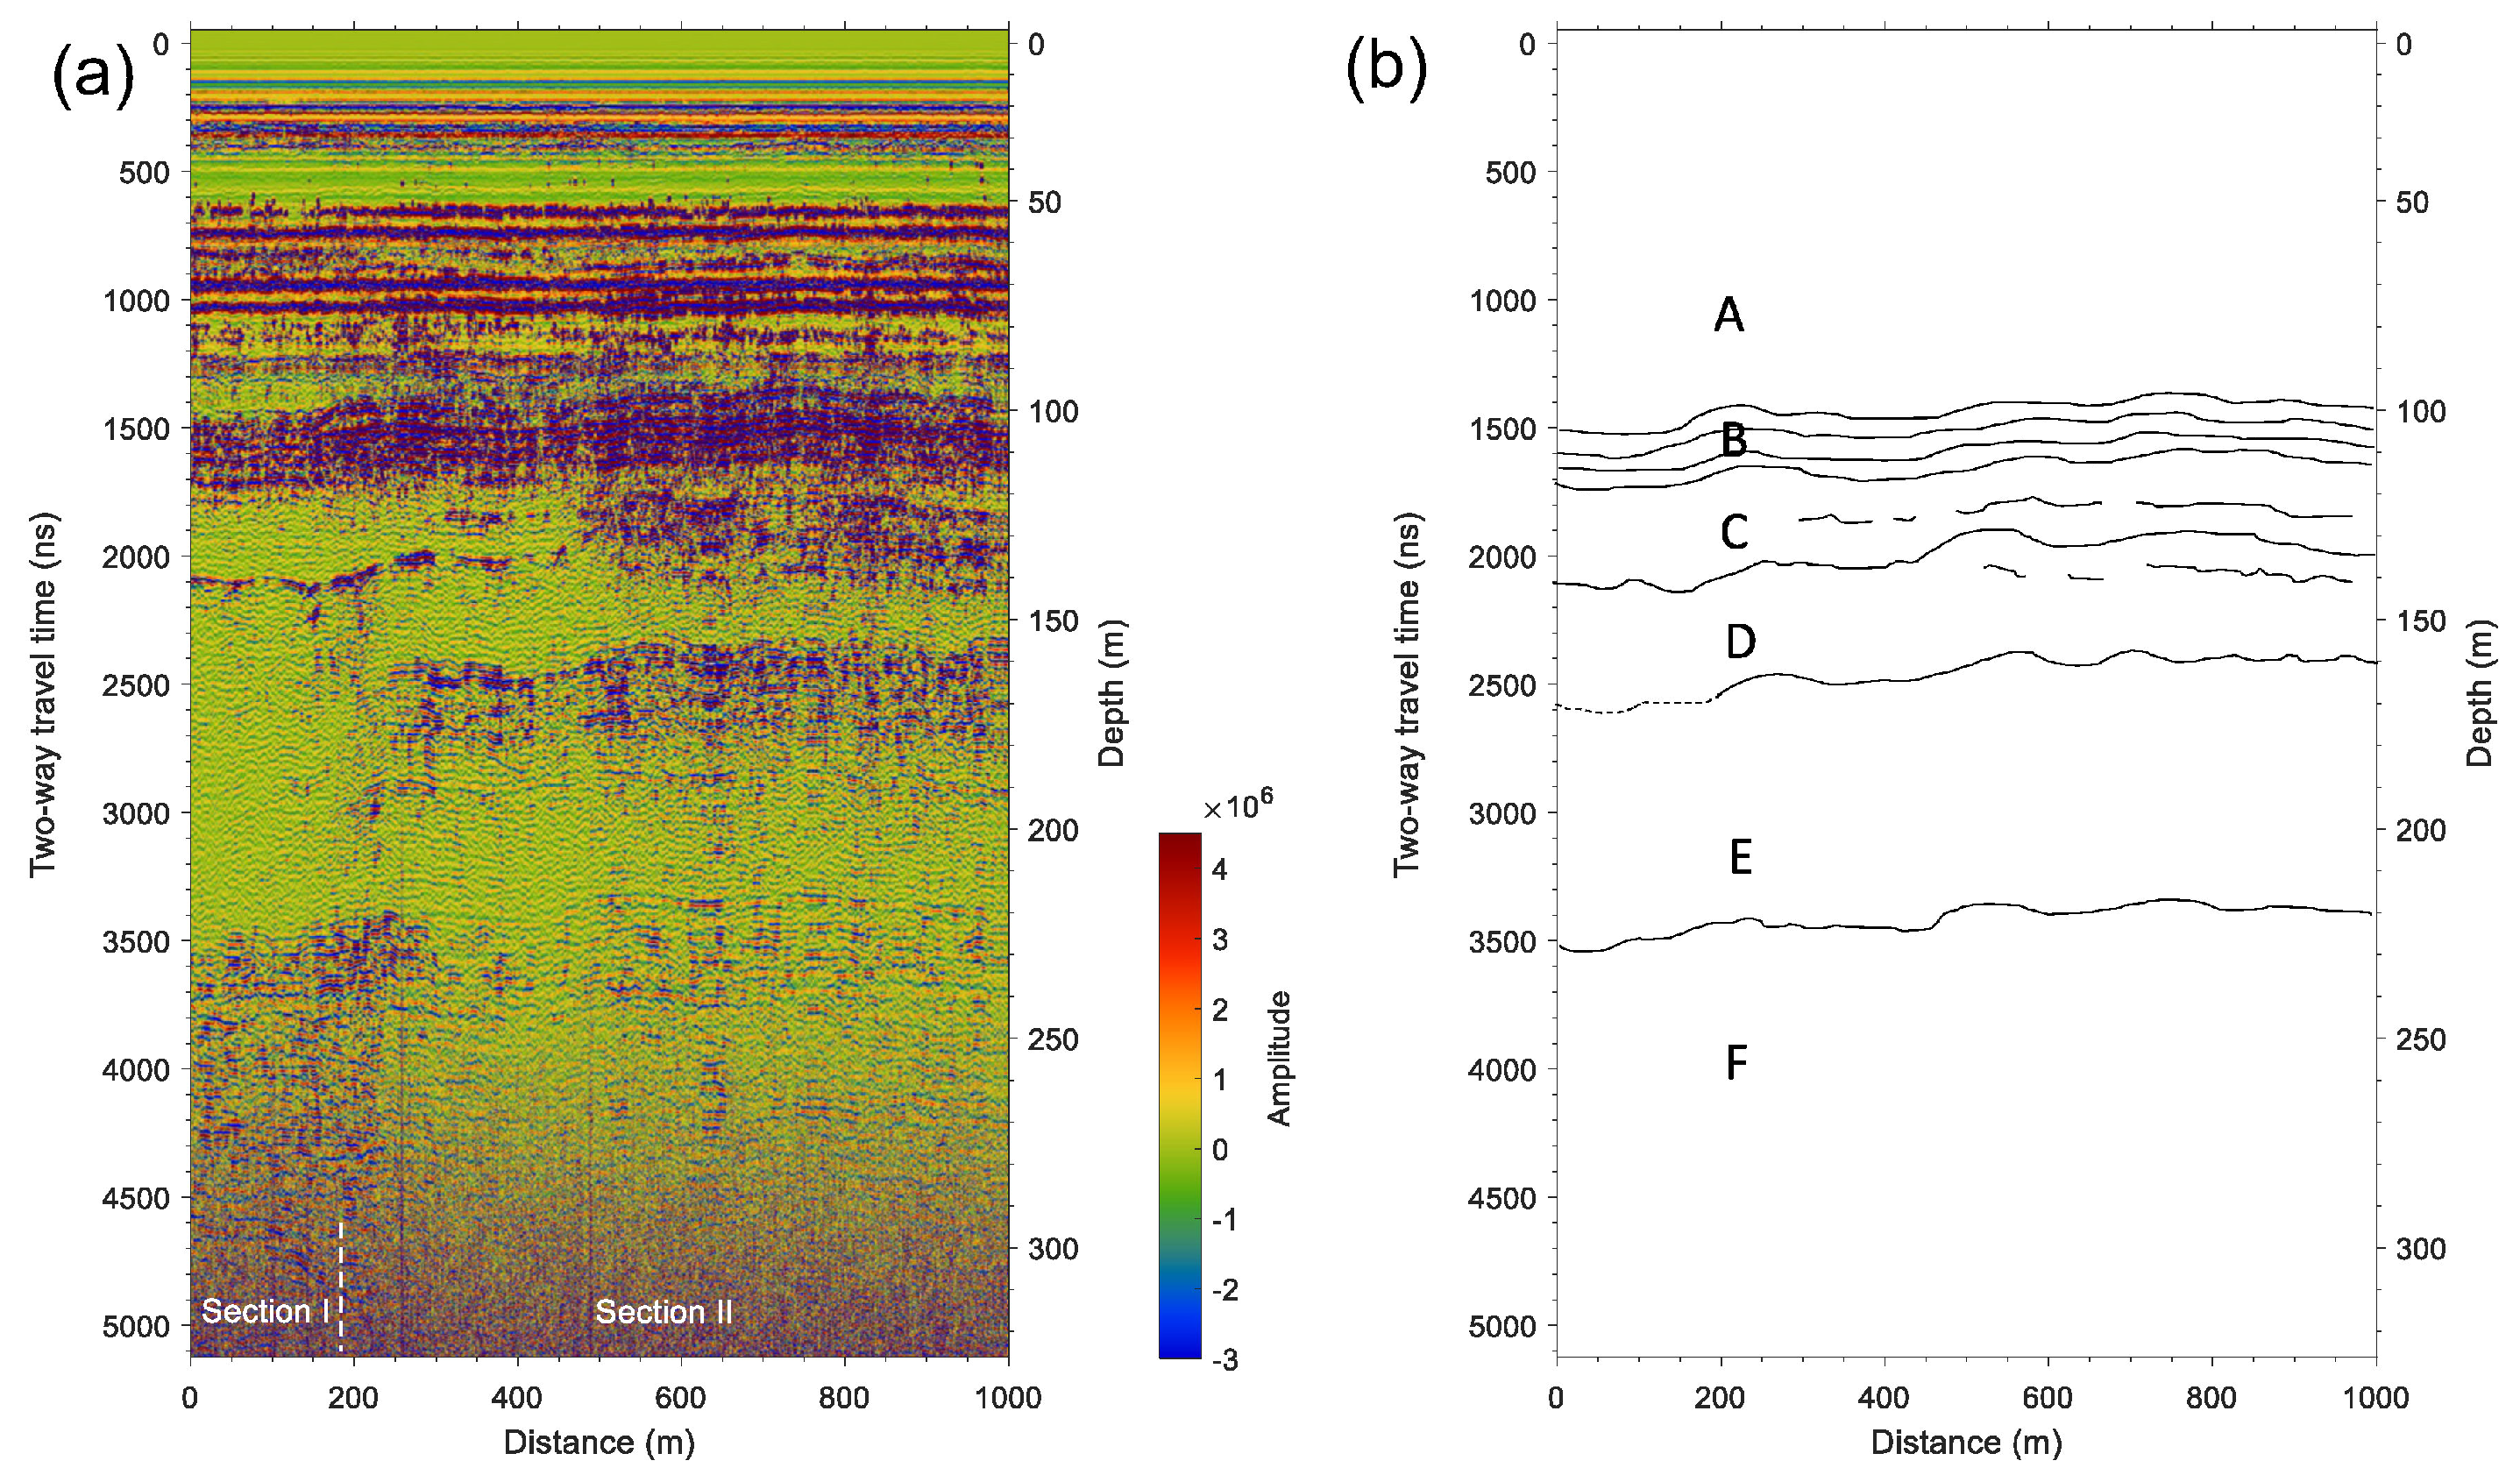
  • The first layer (0~110 m) is the sedimentary layer ejected from other craters.
  • The second layer (110~240 m) is the Imbrium basalt layer.
  • The third layer (240~440 m) is ejecta from the Leibniz crater.
The first layer is the most obvious and uniform layer, but the source of the material is the most controversial. The reason for this may be that this layer contains high-frequency radar observations, but, on the one hand, different researchers have different geological backgrounds. On the another hand, interpreted high-frequency LPR observation obtained with different methods shows different clarity, leading to different opinions when inferring the origin of the material from different details. Therefore, although researchers agree with the division of the layer in general (i.e., the layer’s composition is the sedimentary ejecta from nearby craters), there are different opinions on the source of the material inferred from different details (see Section 2.1). There are researchers who believe that part of the materials originates from the Schrödinger crater [50]. So, there are different opinions on the interpretation of this layer in low-frequency radar data since the explanation of the formation of this layer by researchers is very similar to the explanation of the high-frequency LPR observation results.
The second layer is a low-reflectivity geological unit located from 110 m to 240 m. The reflectivity of this layer is significantly lower than the reflectivity of the first and third layers. The material in this layer is interpreted as the basalt from Imbrium. From the perspective of the volcanic event, according to the studies of Ivanov et al. [51] and Huang et al. [36], the Von Kármán crater was once or repeatedly covered by lava erupted from the Imbrium area, so it is reasonable to infer that the material in this layer is basalt. From the perspective of time, the Leibniz crater occurred about 3.3 Ga ago, and the basalt burst was about 3.1 Ga [35], so it is reasonable that the molten basalt burst covered the ejecta of the Leibniz crater. In terms of thickness, according to the morphology of the crater, the coverage depth of the Imbrium-aged basalt in the CE-4 landing area is about 120 m, which is consistent with the thickness detected by the low-frequency LPR [37,52]. Zhang et al. [46] divided this layer into more layers based on the data of the low-frequency LPR radar. They believe that the material from 110 to 130 m and 158 to 163 m below the Moon’s surface developed in the interval between the impact events of the 50~110 m, 130~158 m and 263~280 m layers, and the formation process is similar to the development process of the lunar regolith detected by the high-frequency LPR.
The third layer is a high-reflectivity geological unit located about 240 m to 440 m below the lunar surface. Through stratigraphic studies, the material in this layer may come from the ejecta of the Leibniz crater (∼245 km diameter) formed before about 3.3 Ga [35,53,54]. Meanwhile, the results of numerical simulations infer that the thickness of the ejecta from the Leibniz crater is roughly 200 m thickness at the CE-4 landing site [37]. It turns out to be a good agreement with the thickness of this layer detected by the low-frequency LPR radar. However, Zhang et al. [46] considered that the material at 163~263 m below the lunar surface is Imbrium-aged basalt, which is an intermediate layer between lava flows. Meanwhile, there is a 17 m thick geological layer around 263~280 m below the lunar surface. It is assumed that this layer is ejecta material from the Alder crater and that the material in the 280~360 m below this is not from the Leibniz crater but is Imbrium-aged basalt. The possible reason for this variability in interpretation lies in the differences in the interpretation of the geological genesis by different researchers. Moreover, the constraints on the physical properties of the different layers below the lunar surface need to be further investigated.

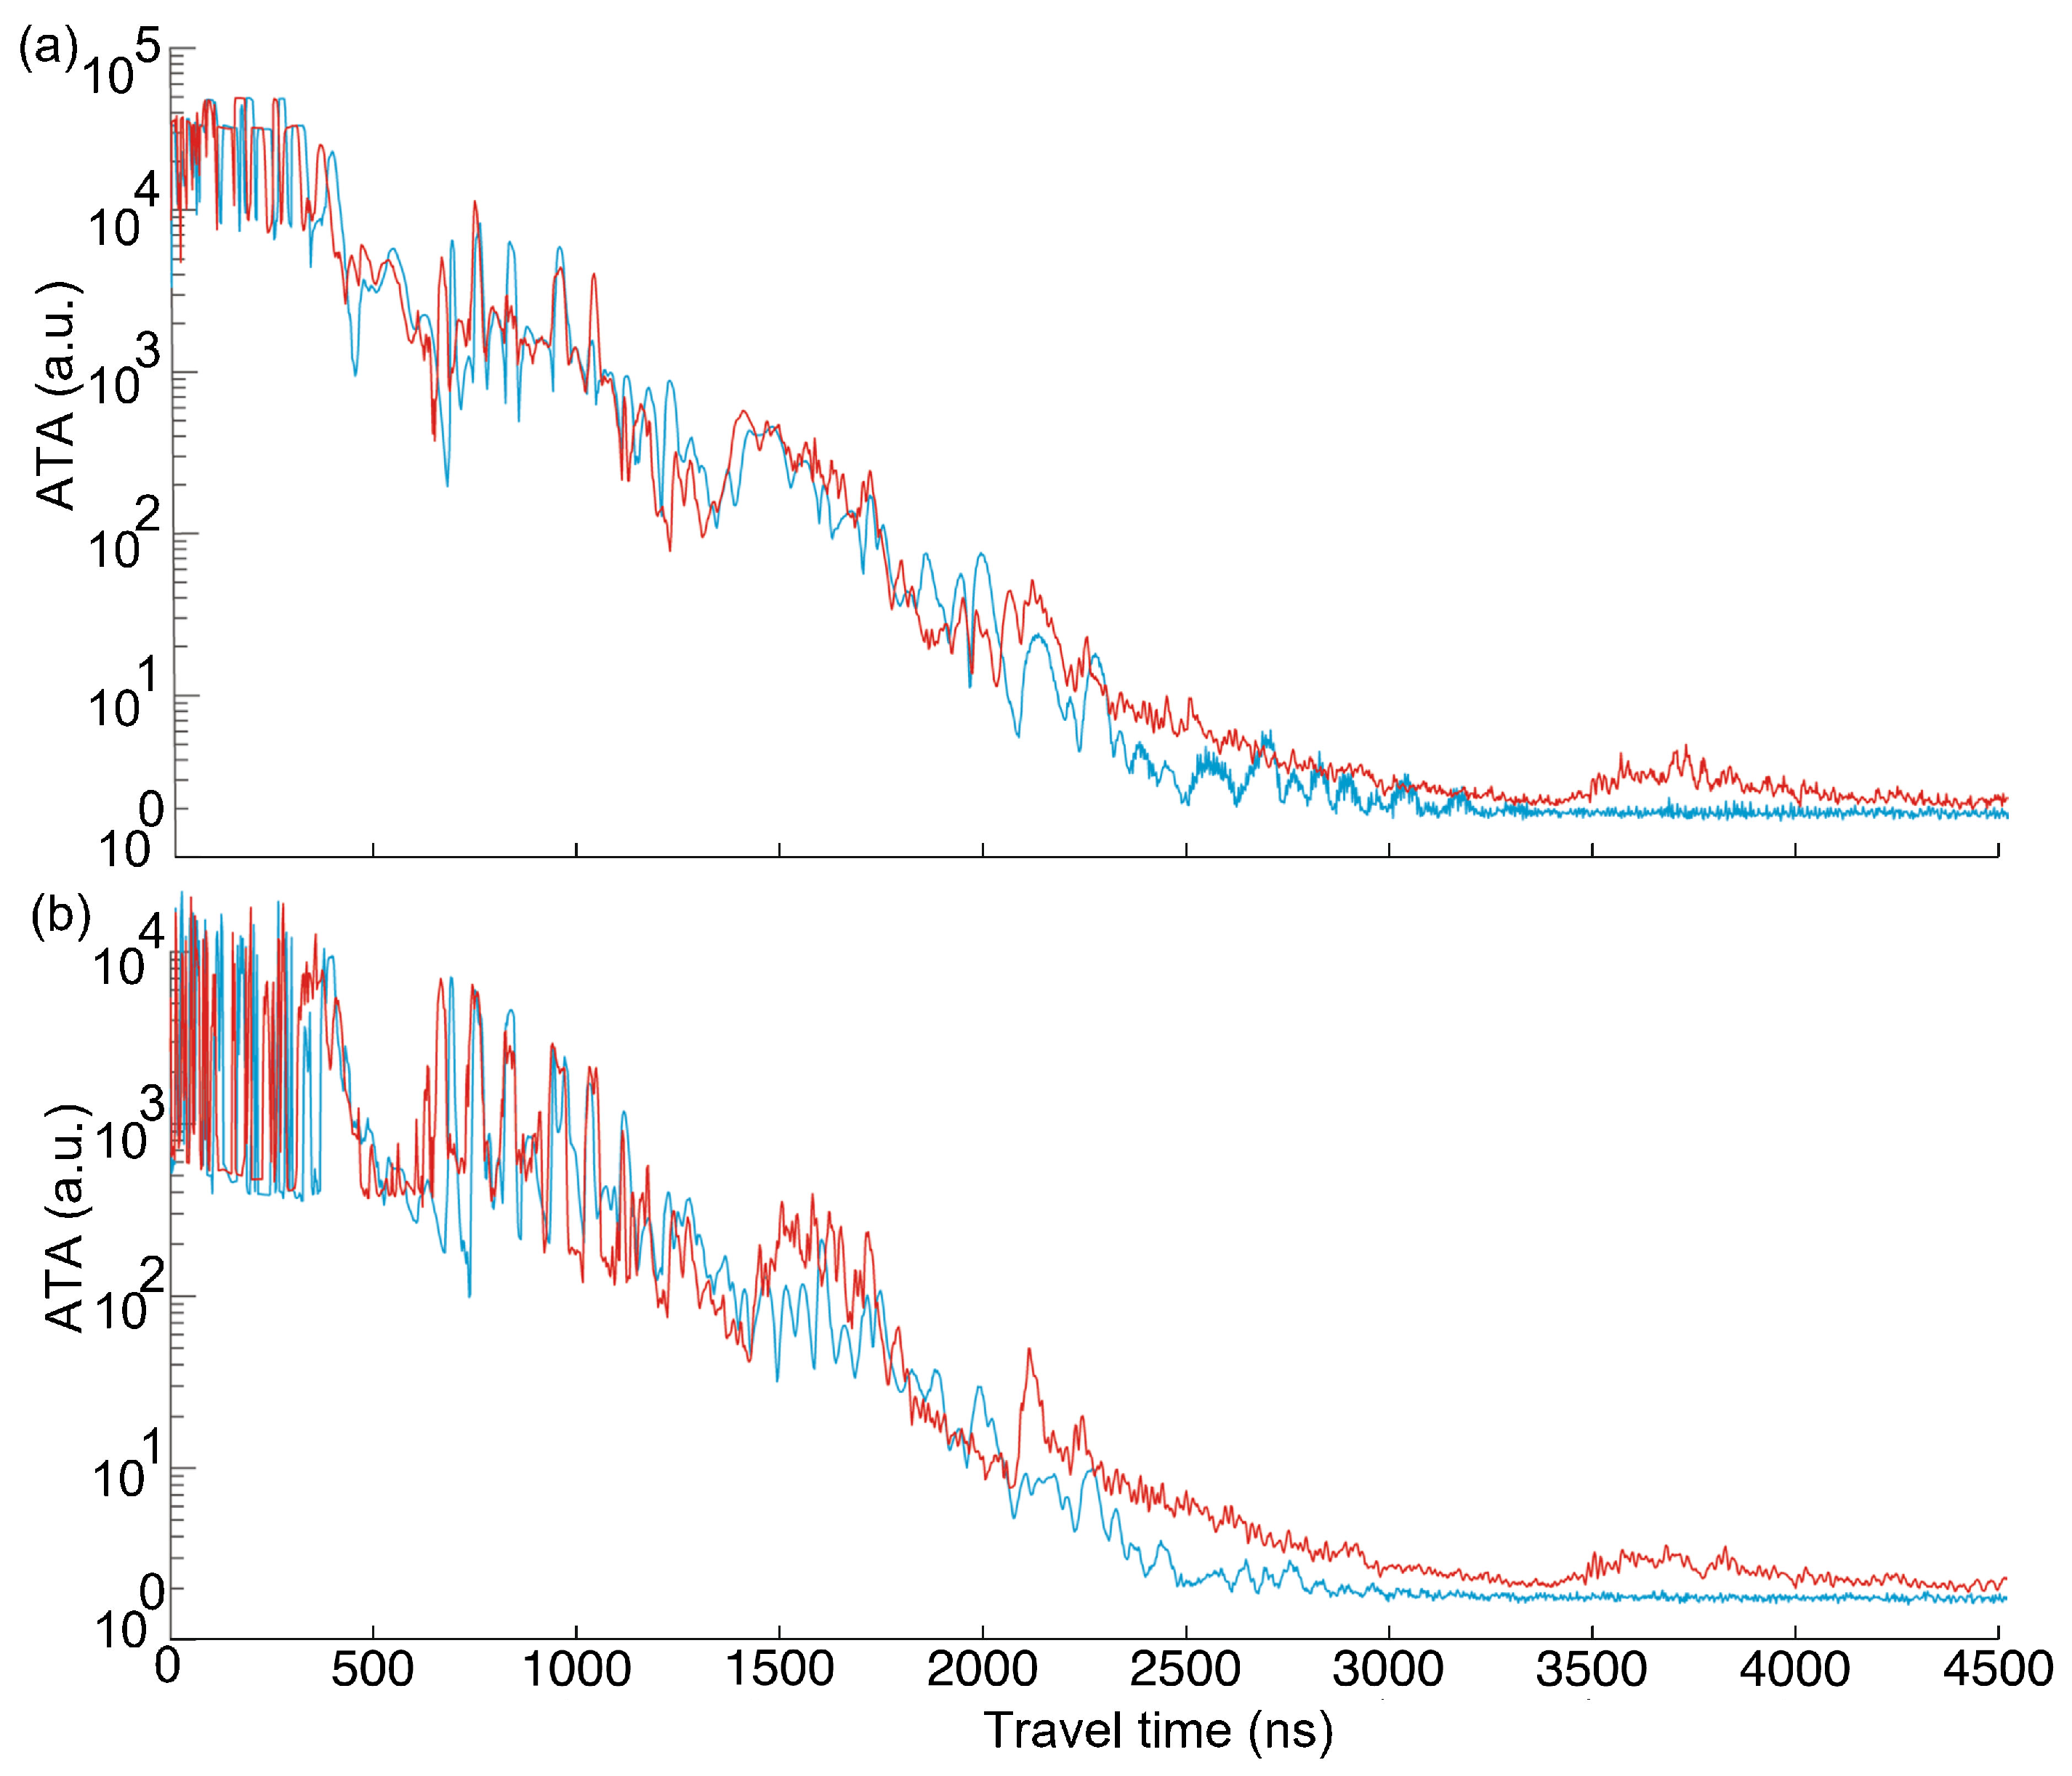
2.3. Effectiveness of Low-Frequency Radar Data

Although high-frequency and low-frequency LPR data have helped us understand the Moon. However, there is a debate about the effectiveness of low-frequency LPR radar data. Pettinelli et al. [55] considered that most of the low-frequency LPR radar data within 3000 ns are almost all invalid signals caused by instruments or other factors except those within 500–1800 ns and 2000–3000 ns. In their paper, Pettinelli et al. [55] made average time amplitude(ATA) diagrams and spectral diagrams of the detection data obtained within 10 m of the low-frequency LPR carried by CE-3 and CE-4 and verified each other to point out problems. In terms of spectrograms, Pettinelli et al. [55] found that the frequency of the signal within the time window of CE-3 and CE-4 within 4500 ns fluctuated from 0 to 100 MHz. However, almost all are 0–30 MHz low-frequency letter-based, with too much deviation from the designed frequency of the low-frequency radar (60 MHz). Moreover, the CE-3 signals within 3000 ns are composed of almost constant low-frequency signals, which means that the signal is noise. In terms of the ATA diagram, Pettinelli et al. [55] highlighted two issues.
The first issue is that although the two different hemispheres of CE-3 and CE-4 landed on the Moon, the ATA diagram within 2000 ns is almost identical, with almost consistent peaks and troughs. Additionally, the data outside 2000 ns are very similar. The physical significance is that in the cross-section diagram made of two signals, both have almost equally smooth horizontal lines at similar depth positions at 2000 ns. The only difference between the two is that the cross-section of the CE-4 signal shows a little non-smooth area at the top surface.
The second issue is that, from the ATA diagram, the two signals have almost the same decay time. Both signals almost all reached the noise level at 3000 ns. In short, the ATA diagrams of the two sets of signals are very similar. In addition, Pettinelli et al. [55] considered through the ATA diagram that the signal near 3700 ns was the only signal above the noise level, but it was also composed of signals at too-low frequencies.
In summary, Pettinelli et al. [55] suggested that the signal in the first 2000 ns of the CE4 radar cross section is mainly composed of the time-invariant coherent noise of too-low frequencies. This noise appears as a horizontal band sequence in the cross-section. The signals after 3000 ns are either noise-level or invalid signals composed of too low-frequencies [55].
Zhang et al. [56] responded to Pettinelli et al. [55]’s query. In response, Zhang et al. [56] acknowledged that the ATA diagram of the signals of CE-3 and CE-4 were similar in the low-frequency signal region due to electromagnetic interference and noise, with the same overall decay time. However, they argue that differences in the ATA curves after 1100 ns are readily discernible. Meanwhile, they emphasize that the system disturbance and noise can be greatly reduced by subtracting the average trace from each curve because they are reproducible and recognizable. The signal after 1100 ns in the ATA plot that they made by subtracting the average trace (Figure 4) also has a significant difference.
Furthermore, Zhang et al. [56] responded to the issue raised by Pettinelli et al. [55] about the same cross-section lines appearing at the same time and location in the cross-section plots made from the two signals. Zhang et al. [56] agreed that this was an issue caused by the background of the system, but that this problem could be solved by choosing the right band-pass filtering. Zhang et al. [56] made plots of the signal processed with either 10–80 MHz or 30–80 MHz band-pass filtering and concluded that the narrow and strong reflections within 1.4–1.8 µs and 2.0–2.2 µs have slopes between traces 1600 and 2600, indicative of subsurface boundaries rather than the invariant system noise. On top of that, there are more time periods where the signals can prove that it is a reflection rather than an over-interpretation.
Overall, Zhang et al. [56] concluded that strong disturbances and noise can be largely reduced by subtracting the data averaged over several lunar days from each trace. The background can be significantly reduced using band-pass filtering, additionally enhancing the echoes from the lunar subsurface stratigraphy, especially for deep reflections after 1100 ns. Zhang et al. [56] were able to respond well to some of the issues raised by Pettinelli et al. [55]. However, other researchers have also given some warning of the pitfalls when interpreting radar data [57]. In terms of importance, the effectiveness of the data from the low-frequency LPR radars is questionable, due to the fact that the noise problem is caused by the instrument itself. This would lead to difficult corroboration between the conclusions of structural layering within 110 m obtained by the high-frequency and low-frequency soundings respectively. On the other hand, the issues solved in the process of validating the radar data will also enable the academic community to understand the concerns of the radar.

3. Dielectric Properties of the Lunar Subsurface Materials

As the first in-situ radar probe to land on the far side of the Moon, we can not only obtain the geological stratification under the lunar surface but also the dielectric properties of the lunar material using the LPR observations. The dielectric properties that can be obtained are mainly the magnitude of the dielectric constant of the material and the loss tangent. Simultaneously, Yutu-2 can use the same radar signal methods as Yutu for dielectric property analysis. Thus, this paper will summarize the dielectric properties of the lunar surface based on the dielectric constant inversion of the matter in CE.

3.1. Dielectric Constant Estimation

There are many methods to calculate the dielectric constant of the substances under the Moon’s surface. This section mainly introduces the calculation principles of the three most commonly used methods: calibration method, the dual antenna delay method, and hyperbolic fitting method. The calibration method is relatively simple, this paper will combine it with the dual antenna delay method. Then this paper will introduce the dielectric constant distribution map at the CE-4 landing site obtained by the researchers according to the relevant methods.

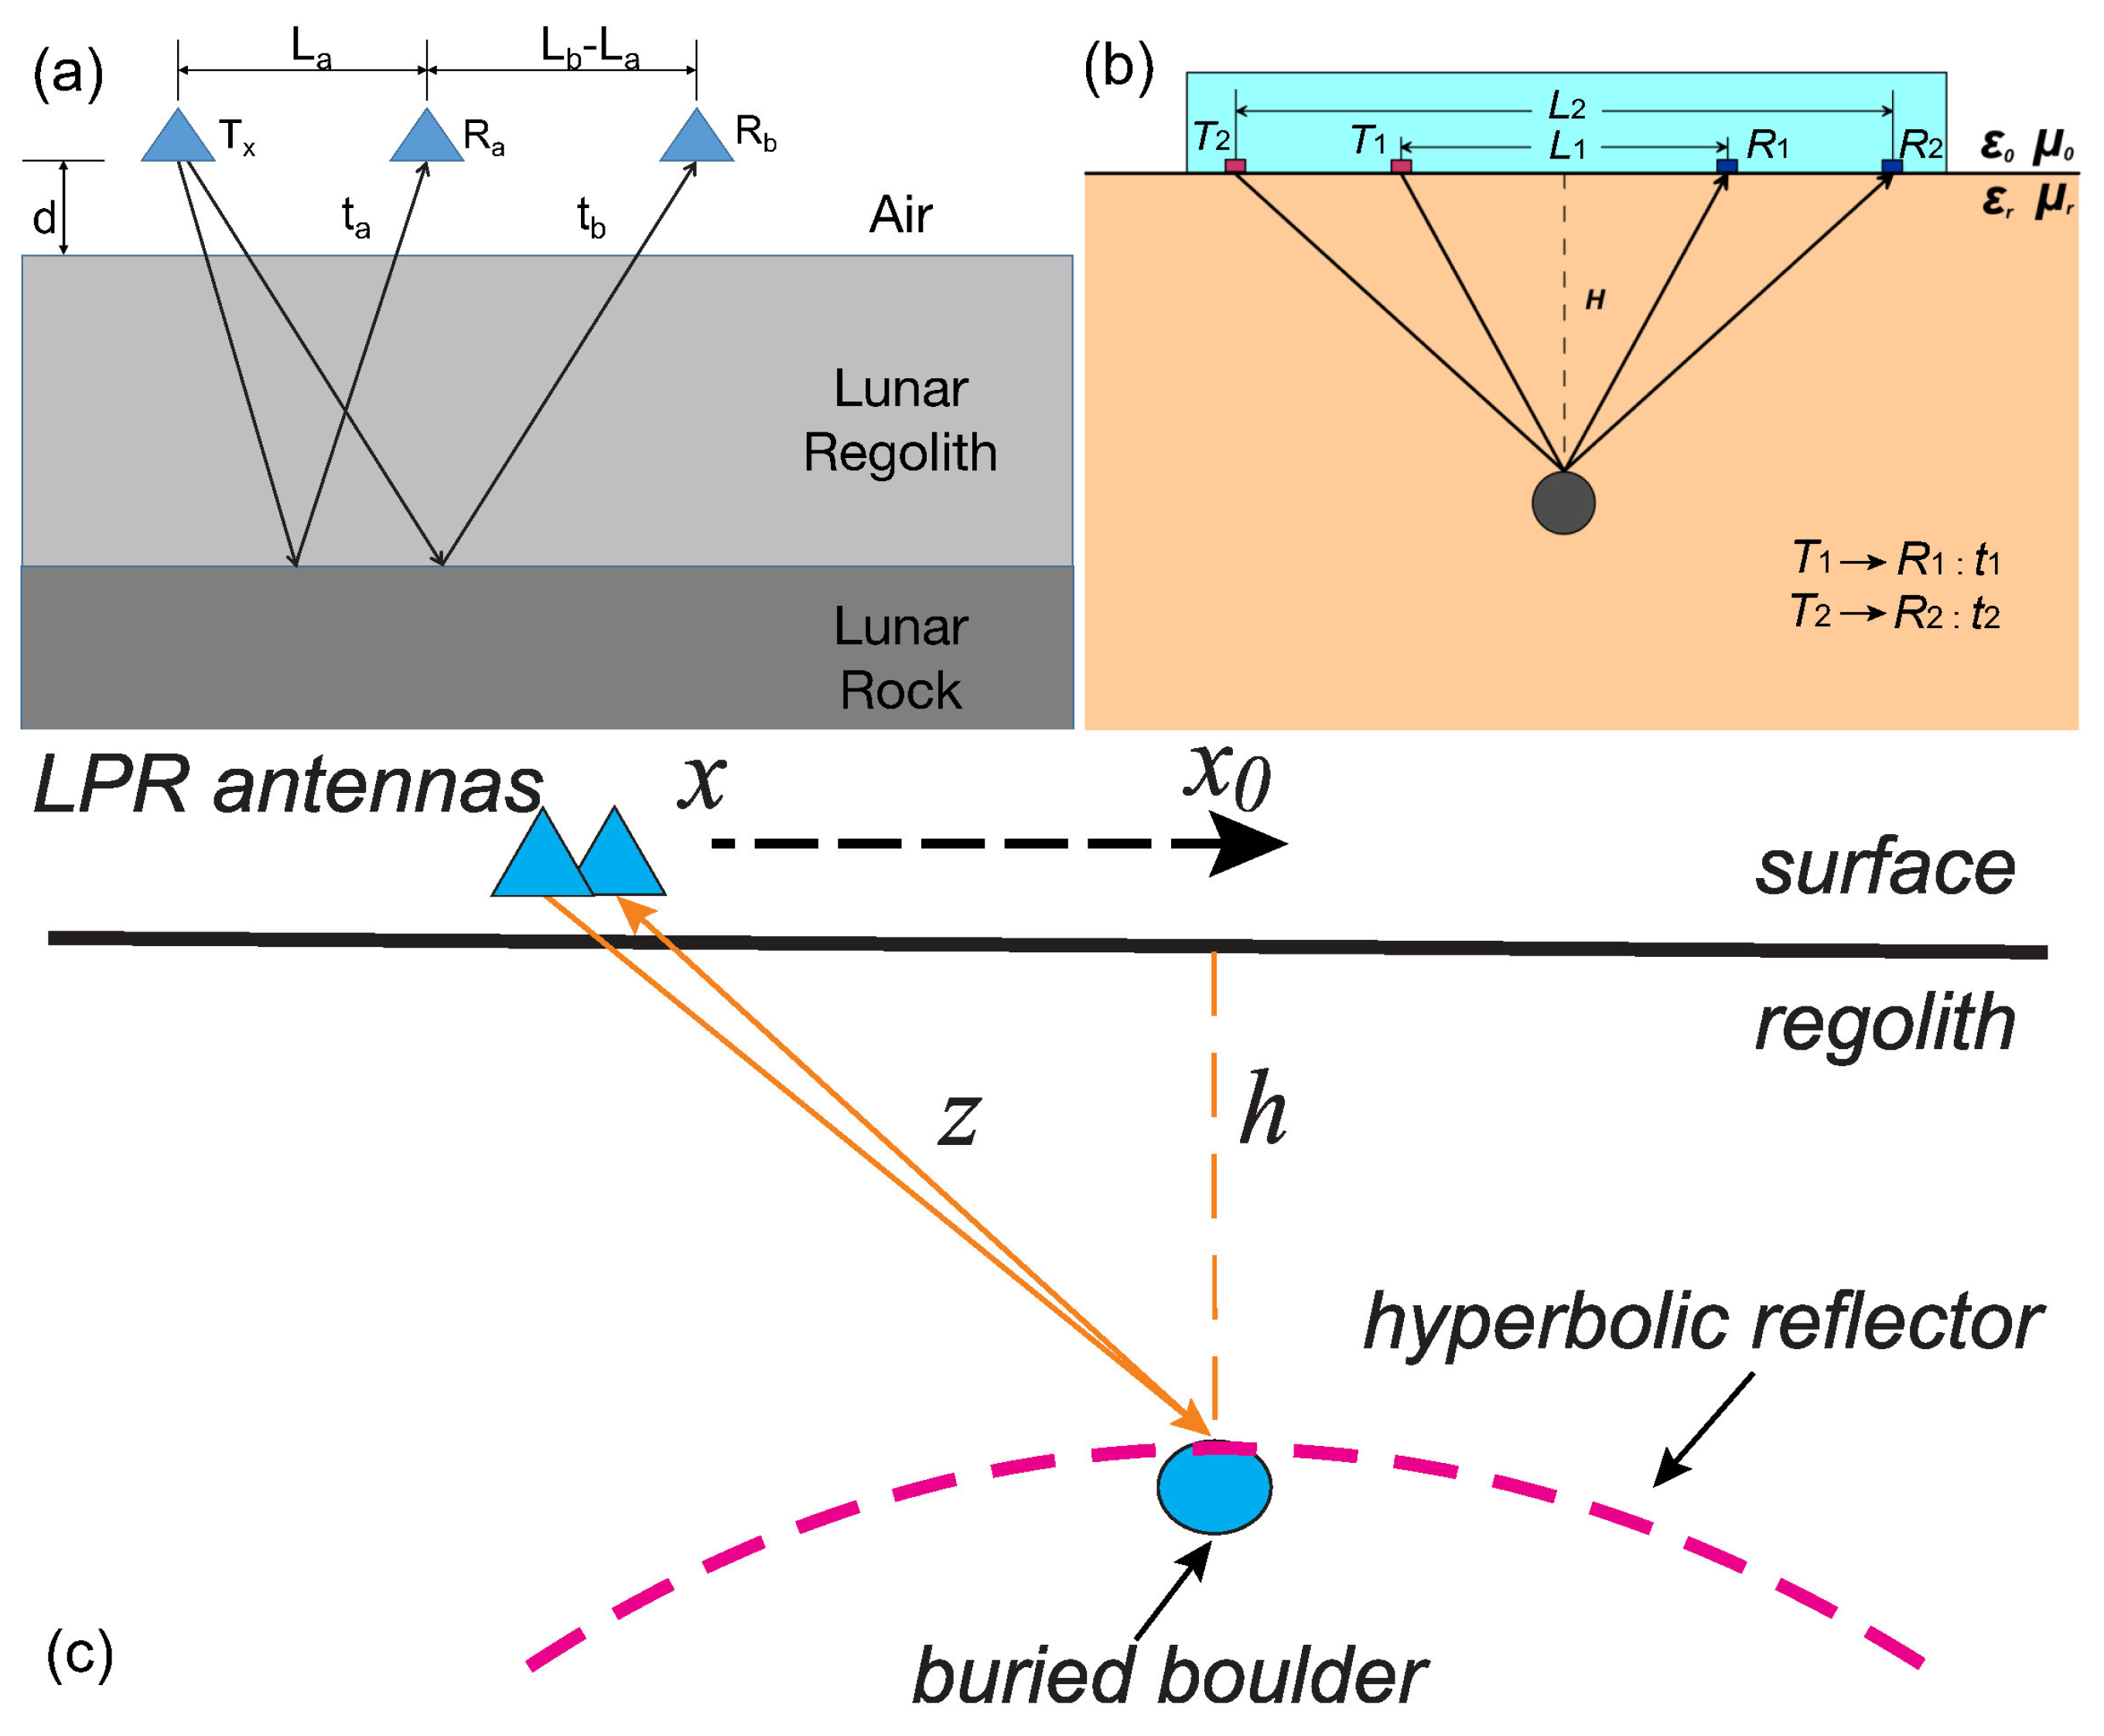
3.1.1. Calibration Method and Dual-Antenna Time Delay Method

There are many methods to calculate the dielectric constant of the substances under the Moon’s surface. Xing and Su [58] gave two methods: the calibration method and the dual-antenna time delay method.
The calibration method is to manually select a calibration substance that determines the relative dielectric constant on the ground, and obtain its reflection intensity after detecting it with radar (Figure 5a). Then, one can detect the lunar regolith and obtain the relative dielectric constant of the lunar regolith detected by using the following formula:
E r _ m E r _ c = ε air ε m ε air + ε m ε air + ε c ε air ε c
In this equation, E r _ m means the reflection intensity of the lunar regolith, and E r _ c means the reflection intensity of the calibration substance. ε c is the relative dielectric constant of the calibration substance. ε air is about one. Since we know four parameters, the relative dielectric constant of the lunar regolith, ε m , can be calculated.
The advantage of this method is its inversion accuracy, despite the influence of the experimental and measurement environment. For this method to work with high precision, it is important to measure the electromagnetic wave reflection signal intensity of the calibrated substance in the same space environment and radar working state. This will make sure that it can fully utilize its advantages in high-precision inversion. However, this method does have limitations. It relies on measuring the intensity of surface reflection signals to determine the dielectric constant of the surface. As a result, it is suitable for measuring the surface dielectric constant of the lunar regolith.
The dual-antenna time delay method measures the time difference between two receiving antennas that detect the same boundary layer signal. This technique works by taking into account how the dielectric constant of the medium can impact the speed at which electromagnetic waves propagate through it. The propagation characteristics of electromagnetic waves in the medium have the following formula:
t a = 2 c d d + D L a 2 2 + ( d + D ) 2 + 2 ε m c D d + D L a 2 2 + ( d + D ) 2 t b = 2 c d d + D L b 2 2 + ( d + D ) 2 + 2 ε m c D d + D L b 2 2 + ( d + D ) 2
where L a is for the distance (15.4 cm) from the transmitting antenna to the receiving antenna A, L b is for the distance from the transmitting antenna to the receiving antenna B (31.7 cm), and d is the distance from the antenna to the lunar surface (30 cm). t a is the time at which the receiving antenna A receives the signal, and t b is the time at which the receiving antenna B receives the signal. Therefore, parameters L a , L b , d, t a , and t b are known, c is the speed of light; and the dielectric constant ϵ m can be found. A geometric schematic is shown in Figure 5a.
The advantage of the calibration method is that it allows the thickness and the dielectric constant of the deep lunar regolith to be calculated, but it is limited in its applicability to a uniform and layered model. In the case of complex stratification, the accuracy of the measurement will be affected by multiple echoes [58]. Zhang et al. [59] improved the method and speculated on the dielectric constant of the lunar regolith in the CE-3 landing area. On the basis of Xing and Su [58], Zhang et al. [59] considered the refraction generated by electromagnetic waves entering the lunar regolith from the vacuum environment (Figure 5b), and used Snell’s theorem to solve the problem and obtained improved equations, which can be expressed as:
l 1 2 L 1 2 l 1 2 + H 2 = ε r μ r L 1 2 l 1 l 1 2 + h 2
l 2 2 L 2 2 l 2 2 + H 2 = ε r μ r L 2 2 l 2 l 2 2 + h 2
t 1 = 2 l 1 2 + h 2 c + L 1 2 l 1 2 + H 2 c ε r μ r
t 2 = 2 l 2 2 + h 2 c + L 2 2 l 2 2 + H 2 c ε r l r
where L 1 , L 2 , t 1 , t 2 , h, and c are known, μ r ≈ 1, thus, ϵ can be obtained with the Equations (3)–(6), ϵ r , l 1 , l 2 , and H are the four unknown parameters. The navigation point is a number representing the rest position of the Yutu-2 rover. If a navigation point starts with ‘1XX’, it represents the first XX place denoted in the first lunar day on the Moon [60]. Based on the radar data from navigation point N103 (third point on the first lunar day) to N209 (ninth point on the second lunar day), Zhang et al. [59] estimated that the dielectric constant of the material was ∼3.05 with a standard deviation of ∼0.60. The inversion of the internal dielectric constant of the lunar regolith in the CE-4 landing area based on dual-channel data has not been reported. In the future, based on this method, it will be possible to effectively reverse the distribution of the dielectric constant of mature lunar regolith along the Yutu-2 rover traveling route. This can provide direct observational evidence for the study of the distribution of dielectric constants in the mature lunar regolith and the influence of small impact craters on the lunar surface [61].

3.1.2. Hyperbolic Fitting Method

The hyperbolic fitting method is widely used to calculate the dielectric constant at a certain depth below the lunar surface at both the CE-3 and CE-4 landing sites [8,47,62,63]. The frequencies of the LPRs onboard Yutu-2 are 60 MHz and 500 MHz [13,18] respectively. According to the wavelength multiplied by the frequency equal to the speed of light in vacuum, we can get that the wavelength of the LPR pulse is 5 m and 0.6 m respectively. Since LPR is essentially a GPR [13]. If the size of the detected object is greater than or equal to the wavelength, it can be treated as a point scattering source [28]. Since the scattering source will generate echoes during the movement of the LPR, after the relative position of the receiving antenna and the detected object changes, the echoes reflected from the radargram are together to form an approximate hyperbolic shape [64,65], and the most vertex of the hyperbolic corresponds to the highest point of the reflected source object [66].
Figure 5c displays the relative position of the LPR and the scattering source from which we infer relationships:
t 2 2 h v 2 x x 0 2 h 2 = 1
where v is the average propagation speed of the radar in the medium, and t is the two-way traveling time of the radar echo. The radar to propagate vertically to the scatter source and receive the echo is the semi-real axis, and the vertical distance h from the scatter source to the lunar regolith is the semi-virtual axis. From the received signal and the produced radar map, we can know h, t, x x 0 , and thus we can get the average propagation speed v. If we ignore the distance h of the LPR antenna from the lunar regolith surface, it leads to an error of about 13% according to the model with a random distribution of dielectric constants calculated by Ding et al. [61]. This error is close to that of the conventional method [67].
The relation between the propagation speed of the electromagnetic wave in the medium v and the dielectric constant of the material ϵ bulk is [68]:
ε bulk = c v 2
By analyzing the relationship between the dielectric constant ϵ bulk of the Apollo sample and the object density ρ bulk , the following empirical formula can be obtained:
ε bulk = 1.919 ρ bulk
Here the bulk density is directly related to the porosity (n) if the grain density ( ρ grain ) is known [69]. Carrier and Olhoeft [70] derived the following Equation (10) which numerically indicates how is related to porosity (n) of lunar regolith and the Equation (11) which shows how ρ grain is related to the depth d according to the Apollo 15, Apollo 16, and Apollo 17 core samples. Normally, the grain density of lunar regolith is assumed to be 3.1 g/cm 3 [71].
n = 1 ρ bulk ρ grain
ρ bulk = 1.92 d + 12.2 d + 18
Though the hyperbolic fitting method is widely used, it also has its disadvantages including ignoring the effect of the position and geometry of antennas [72]. It makes different interpretations by minor differences in the extracted geometry [73]. However, compared to the former two methods, it is more accurate. Therefore, further improvement of this method is also possible and needed.

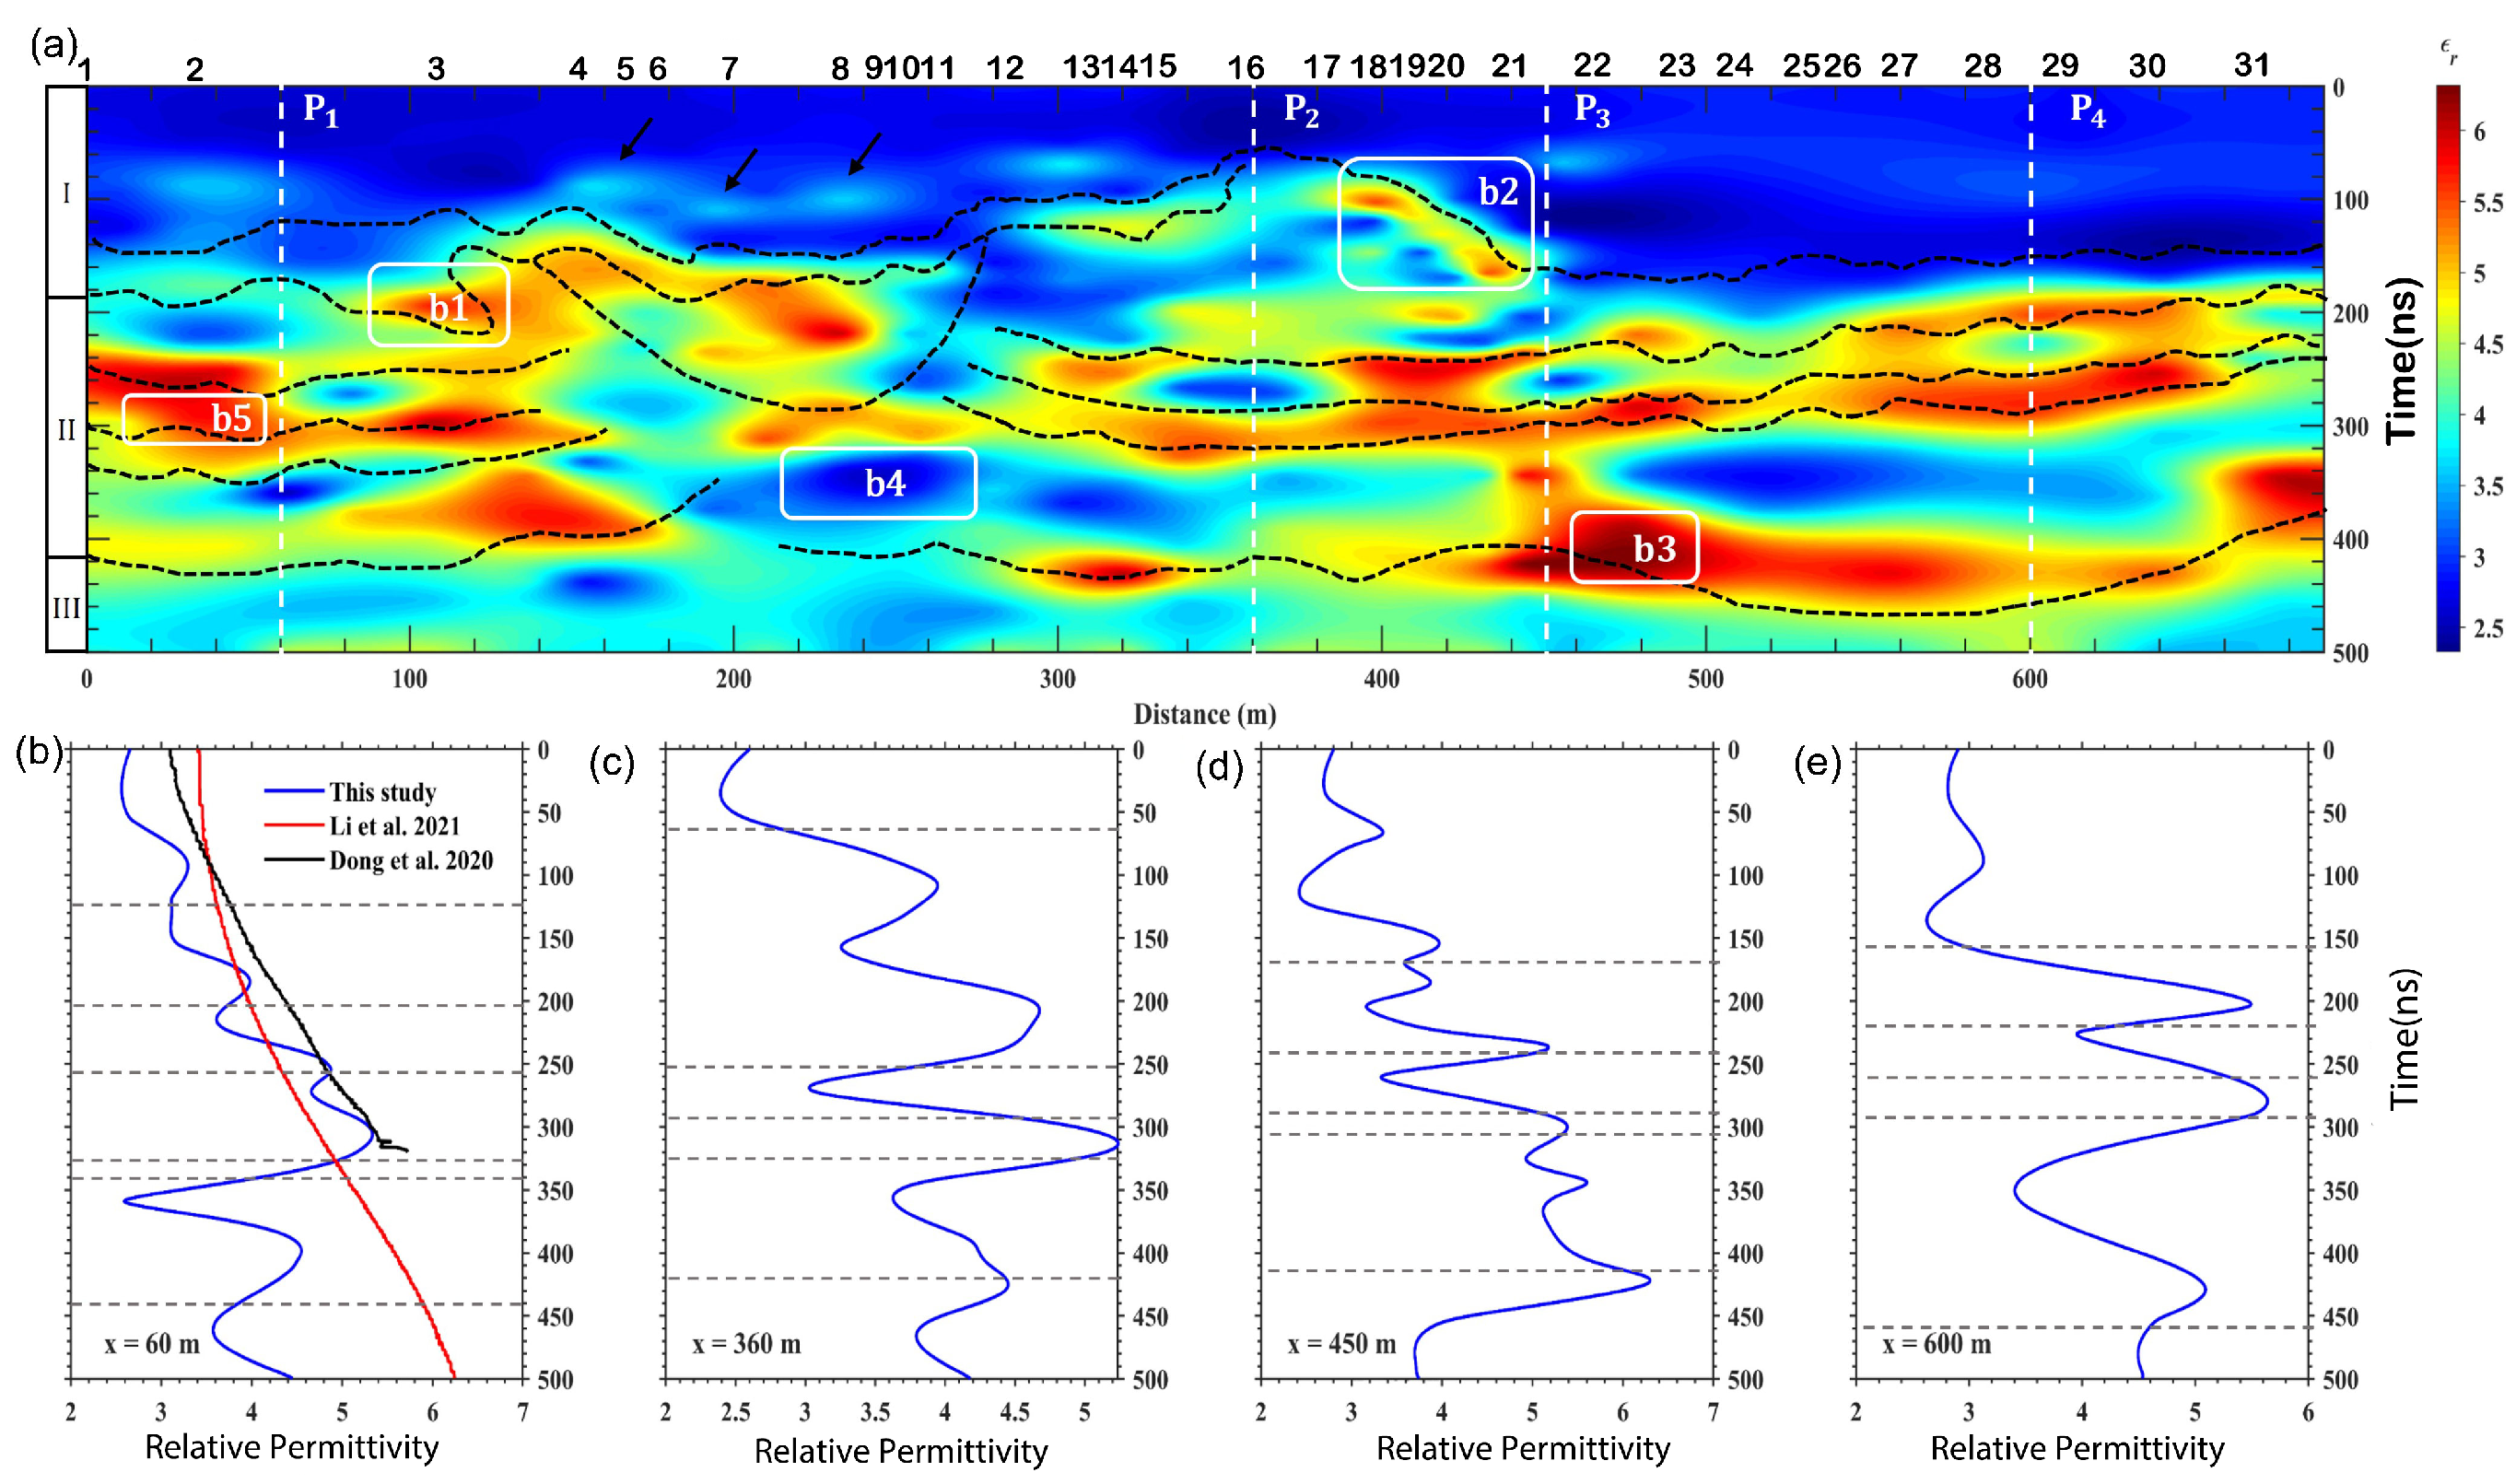
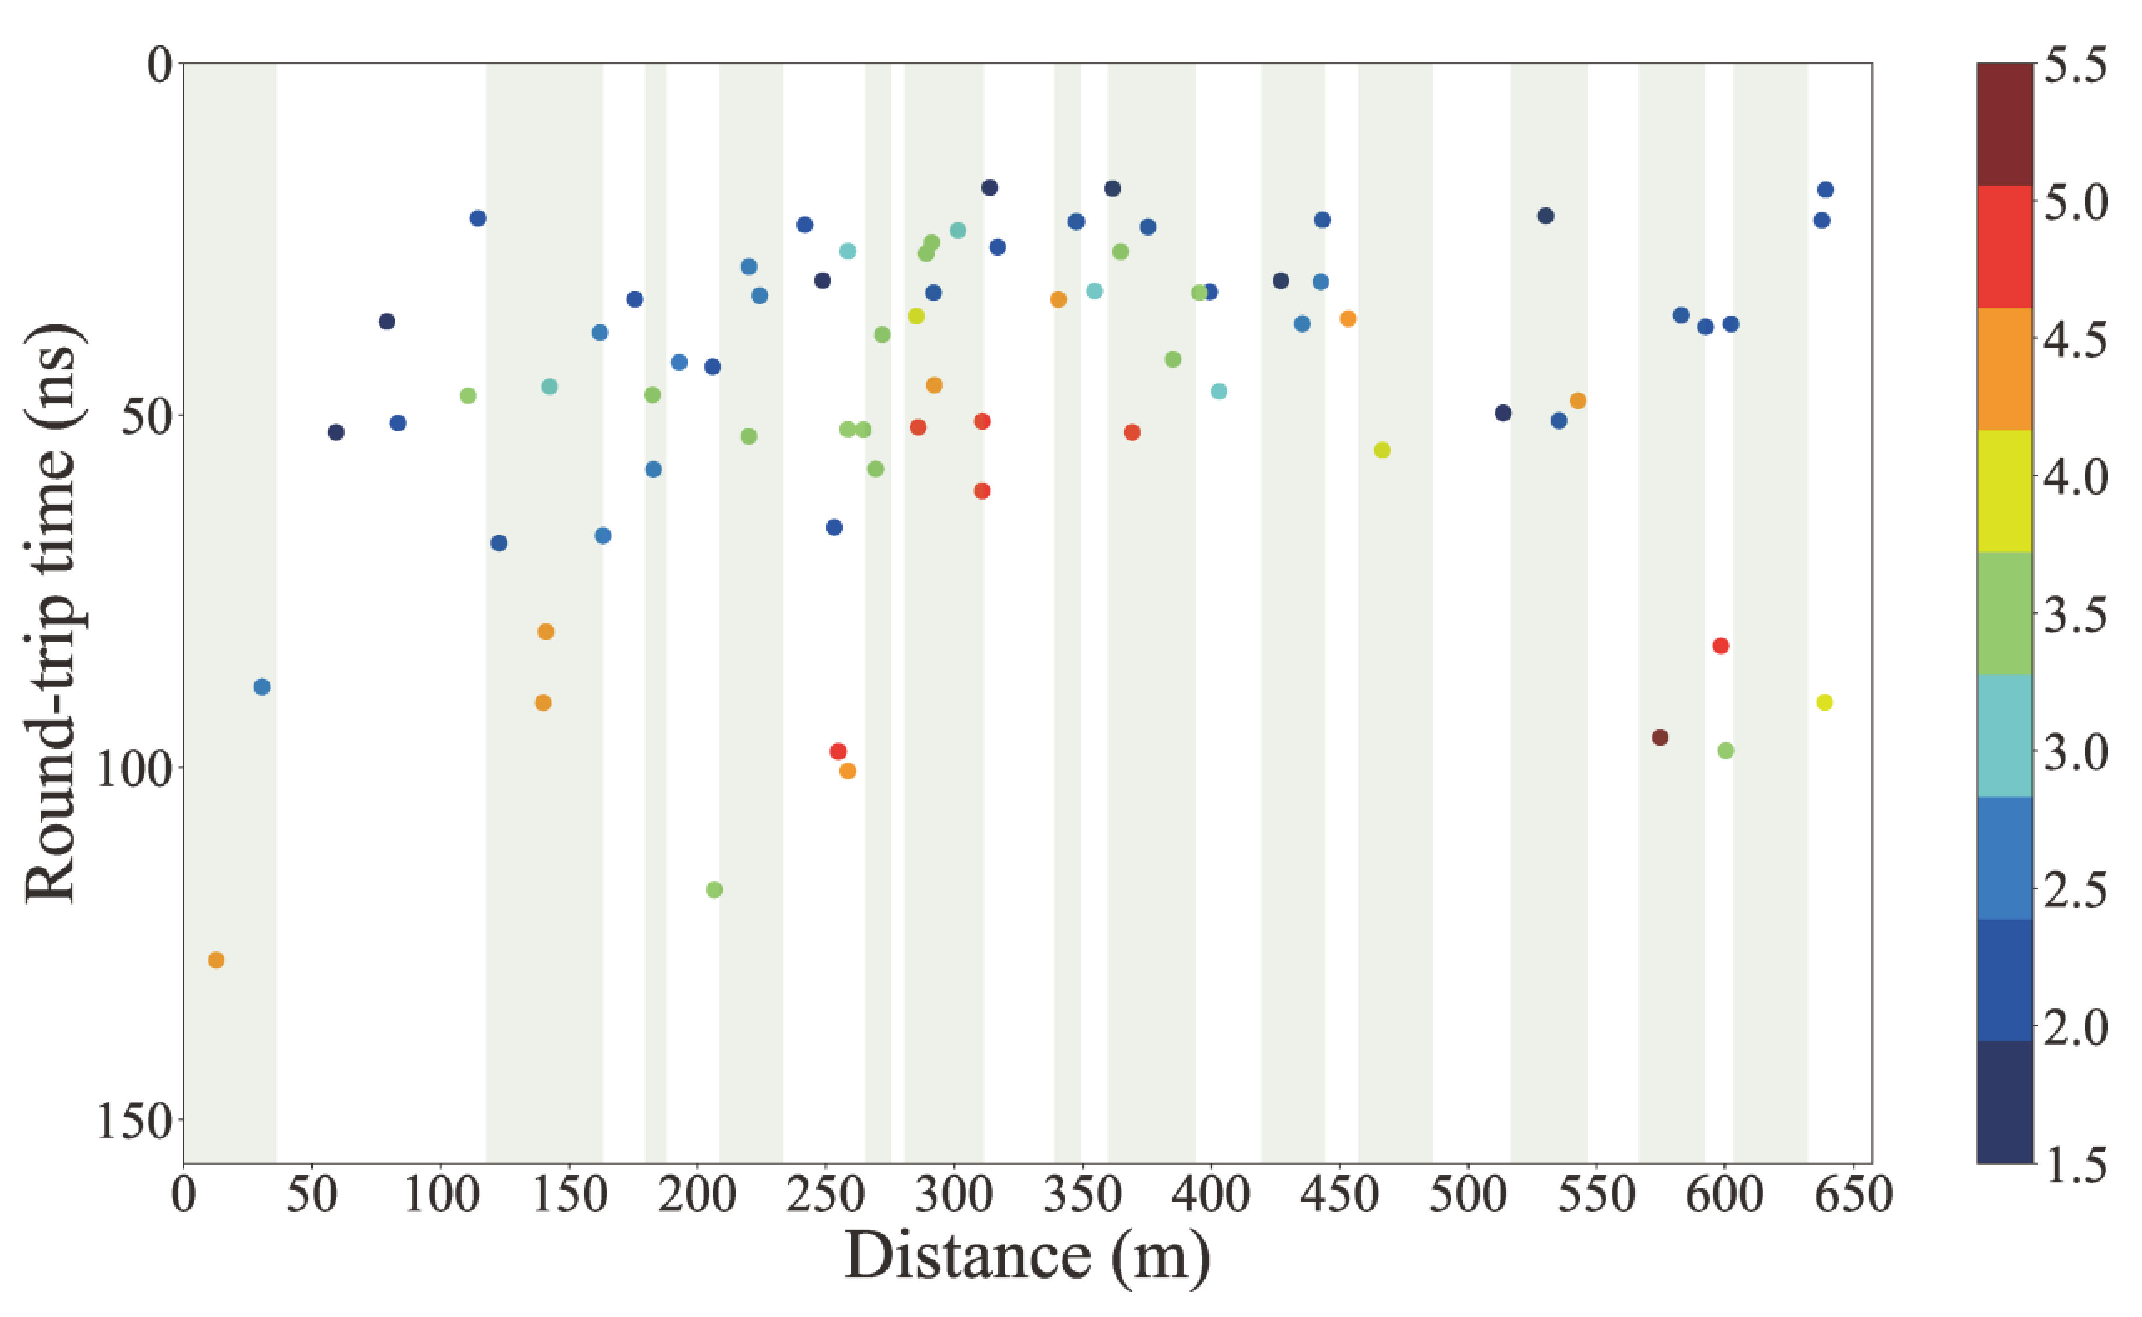
3.1.3. Distribution of Dielectric Constant at the CE-4 Landing Site

With the method introduced above, we can calculate the dielectric constant distribution at the CE-4 landing site. The Figure 6 and Figure 7 below are the dielectric constant distribution of the lunar regolith of the Yutu-2 route calculated by [27,74]. The dielectric constant in layer I (Figure 6a) ranges from 2.3 to 3.7, and its relatively uniform distribution can be described by the average dielectric constant is ∼2.78. This region of bulk density is ∼1.57 g/cm 3 . The results show that the composition is close to the typical lunar regolith [70] and similar to the landing site of Apollo 15 [71].
Lv and Zhang [75] made an estimation of the dielectric constant of the top 12 m thickness below the surface. Their results show that in that region the permittivity is 3.5 to 4.2, with a local perturbation of ∼2.3%, consistent with ∼3% obtained by numerical simulations using self-organization random models [75]. The dielectric constant of layer II is about 2.6 to 6.3, and the flanking regions are significantly more evenly distributed than the middle part [74]. It can be considered that the layer contains two kinds of material: low dielectric constant similar to Layer I or highly weathered ejecting, and rough weathered material with high dielectric constant. The dielectric constant of the first layer ranges from 2.9 to 4.6, and its high dielectric constant regions mostly appear in the part intersecting with the upper layer. Chen et al. [74] believe that the layer is similar to the second layer because the upper layer squeezed the lower layer tighter, resulting in a large dielectric constant.
Figure 6. (a) The high-frequency Yutu-2 LPR derived dielectric constant distribution, adopted from [74]. The depth of the intersection between the P1–P4 boundary and the reflection source boundary (white dotted line) in (a) are (b) x = 60 m, (c) 360 m, (d) 450 m, and (e) 600 m, respectively. (b) The red solid lines and the black solid lines in the lower panel are the dielectric constant distribution results of Li et al. [76] and Dong et al. [77], respectively.
Universe 09 00461 g006
Figure 7. Distribution of dielectric constant obtained by hyperbola fitting method by Feng et al. [27].
Universe 09 00461 g007

3.2. Loss Tangent Calculation

The loss tangent of the lunar subsurface materials is the physical quantity used to describe the properties of the attenuation of the electromagnetic wave. It normally is the ratio of the total loss energy to the total stored energy [78]. There are also many methods to calculate the loss tangent of the lunar subsurface materials. This section mainly introduces the calculation principles of the two methods most commonly used: the energy attenuation method and the frequency shift method. Then, we will introduce the distribution map of loss tangent at the CE-4 landing site obtained by the researchers according to the relevant methods.

3.2.1. Energy Attenuation Method

The energy attenuation method is to calculate the loss tangent by calculating the attenuation coefficient of electromagnetic waves. The signal emitted by LPR radar from being emitted to being received experiences a two-path symmetrical decay in the medium. The attenuation coefficient in the medium is e 2 α R . Here α is the spatial attenuation coefficient of the electromagnetic wave, and R is the radius of the spherical surface formed by the transmitting signal, which is the detection distance of the radar. It is usually converted to η in dB/m with η = 20 lg e α 8.686 α . The relationship between the spatial decay coefficient α and the loss tangent is as follows:
α = ω μ ε 2 1 + tan 2 δ 1
where ω is the angular frequency; μ is the magnetic permittivity of vacuum, which is approximately 4 π × 10 7 N / A 2 ; ε is the dielectric constant of the medium, and tan δ is the loss tangent. Due to the fact that almost all the loss tangents of the lunar regolith are very close to zero, and which are normally ∼0.005 [79], according to the theorem of equivalent infinitesimal replacement, we can simplify the term 1 + tan 2 δ 1 to tan 2 δ 2 . In that way we can ontain:
α = ω 2 ε μ tan δ
Since ε = ε 0 × ε , ω = 2 π f , c = 1 ε 0 μ , where c is the speed of light in the vacuum, we can obtain the following equation, shown as:
tan δ = η / 9.1 × 10 8 ε f
That way we build a connection between the spatial attenuation coefficient ( α ) and the loss tangent ( tan δ ). Grimm et al. [78] gave a method to measure the attenuation using GPR. The relative amplitudes should be corrected for ground losses like geometric spreading and backscatter to calculate the attenuation [78]. So the radar equation introduced by Skolnik [80]:
P r P t = G 2 λ 2 ξ ( 4 π ) 3 R 4 e 4 α R
where R is the radius of the spherical surface formed by the transmitted signal; P r refers to the received power; P t refers to the transmitted power; G represents all the gain and loss related to the system and its antennas; ξ refers to the backscatter cross-section which is related to the composite distribution of the reflector. From the equation, we can see that the attenuation loss is divided into two parts: the scattering loss and absorption, which is the term e 4 α R . Since the parameters G, λ , and π are constant factors. To choose ξ as some integer times of R n , we can end up having a relation between P r P t and R [81]:
P r P t 1 R n
Here, Lai et al. [81] considered three different models of targets: n = 2 for the planar and smooth reflected target; n = 3 for the Fresnel zone case when the GPR return is integrated over the diameter; and n = 4 for rayleigh scatters. After the compensation of the scatter signals, we can estimate the attenuation constant η via the least squares fitting of R.

3.2.2. Frequency Shift Method

The frequency shift method is to derive the loss tangent of the lunar regolith by finding the relationship between the dielectric loss and the central frequency decrease [82,83,84]. The propagation of electromagnetic waves in the medium will produce dielectric losses. These losses will lead to a situation called wavelet dispersion, and wavelet dispersion results in the central frequency of the radar receiving signal being lower than the transmission frequency [82,85]. The frequency shift method calculates the central frequency decay rate of the received signal by linear least squares [83], and the loss tangent is proportional to the decay rate of the frequency [82,83].
The premise of the frequency shift method is that the amplitude of the transmitted signal, the loss in the medium, and the amplitude of the received signal are all considered in a linear system [60,82,86]. It is worth mentioning that although the loss tangent can also be calculated from the time domain signal, the advantage of calculating from the frequency domain is that the frequency domain offset of the radar echo is not affected by the reflected loss and far-field geometrical spreading [86].
Since the propagation of high-frequency LPR in the medium can be regarded as a 2-D plane wave [83], the spectral function Y ( f ) of the received signal at a certain distance d can be expressed as the following equation:
Y ( f ) = X ( f ) · exp ( α d ) · exp ( i β d )
where, α and β are the loss terms and the phase terms in the R ( f ) function, respectively, and where the α term is the same as the attenuation coefficient α mentioned in Section 3.2.1. Therefore, one can transform Equation (12) according to 1 v = ε μ , and according to the principle of equivalent infinitesimal principle. The attenuation coefficient α simplifies to:
α ( f ) = π tan δ v f
Simultaneously, the signal wave emitted by high-frequency LPR also follows a constant Ricker function approximating a Gaussian function [13,84]:
X ( f ) = 2 f 0 π exp 4 f f 0 2 f 0 2
where f 0 is the central frequency of the transmitted signal wave [87]. This function is also the frequency domain function X ( f ) of the emission signal that we need. After substituting the above two equations into Equation (17), it can be obtained as follows:
Y ( f ) = 2 f 0 π exp 4 f f 0 π tan δ f 0 2 d 8 v p 2 f 0 2 exp π tan δ f 0 d 4 v p 2 2 4 exp ( j β d )
The received signal frequency domain function Y ( f ) is also obtained. After calculating the frequency domain functions X ( f ) and Y ( f ) by the following formula, we can get the center frequency of the transmitted signal f t and the received signal f r [82]. The f t is the center frequency of the transmitting signal wave mentioned above. Therefore, combining the above three expressions can obtain the relation among the loss tangent, f t , and f r [82]:
f r = f t π tan δ f t 2 8 τ
From this method, we can calculate the loss tangent of the subsurface material. According to the loss tangent, we can also calculate the TiO 2 + FeO content in the material according to the empirical formula [70]:
tan δ = 10 0.030 × % TiO 2 + % FeO 2.676

3.2.3. Distribution of Loss Tangent at Landing Site

According to the above-introduced method, we can obtain the distribution of the loss tangent at the landing site. Hitherto, few studies have systematically given a distribution of loss tangent in the Yutu-2 landing area. The average loss tangent of the lunar subsurface material calculated by the high-frequency radar observation is ∼0.005 [8,47]. The distribution of loss tangent and penetrating depth is given by Xing et al. [88]. From Figure 8a, we can infer that a smaller dielectric constant results in a smaller loss tangent and greater radar penetration depth. Combined with the traveling path of the Yutu rover (Figure 8b), Ding et al. [60] calculated the loss tangent of the CE-3 landing area to be about 0.011–0.017 using the frequency shift method and gave the corresponding TiO 2 + FeO content in the lunar regolith to be ∼25wt.%, which is consistent with the result of in-situ detection by another instrument onboard Yutu rover.
Although the average value of loss tangents can be obtained through calculation, the distribution of loss tangents has not been made by the Yutu-2 radar observation, which can become the direction of future research. If the TiO 2 + FeO distribution is made, it will be more helpful to study the TiO 2 + FeO content value of specific locations and provide more valuable data for the estimation of in-situ resources on the Moon.

4. Radar Observation of Special Geological Features on the Moon

The Yutu-2 landing site has undergone many geological transformations, including but not limited to volcanic eruptions and impact events. Its geological remnants still exist below the lunar surface. By analyzing the radar echoes received by the high-frequency LPR, not only can the stratification of geological structures tens of meters below the lunar surface be detected, but also some special geological structures can be inferred. In this section, we will summarize four specific geological types that various researchers have derived from the interpretation of radar data, e.g., impact rock fragments, buried craters, subsurface cavities, and volcanic activity.

4.1. Evidence of Fragments from Small Craters

Impact events are the main geological forces shaping the topography of the lunar surface [90]. Various meteorites from space impact the lunar surface at extremely fast speed, and the huge pressure causes it to form large and small impact craters [91]. According to the panoramic camera display, when Yutu-2 moved to the fifth lunar day, it found that the terrain near its trajectory was flat [19], and only a few boulders were near the trajectory [92]. This observation is consistent with orbital data, where the lunar regolith in the landing site region is a highly degraded thick lunar regolith [36].
However, starting from the sixth lunar day, Yutu-2 suddenly observed several fresh small craters near its traveling path. Its diameter is less than 3 m and there are thousands of small fragments less than 10 cm in diameter nearby (Figure 9a). The impact crater has concentric walls and highly reflective material in the middle. Similar fresh craters appeared in the traveling path several lunar days later. The crater and the fragments are quite different from the otherwise degraded craters. The observation is also against the former orbital and in-situ observation. The origin of the rock fragments and surface materials is also believed to be the representatives of Finsen’s ejecta [26,93]. For this abnormal phenomenon, Ding et al. [20] carried out corresponding research.
Ding et al. [20] simulated the high-frequency LPR radar data obtained by the Yutu-2 rover from N904 (fourth point in the ninth lunar day) to N911 (eleventh point in the ninth lunar day), and then compared that with the original data. It was found that the fragmented material around the small crater resembles lunar regolith, not broken rocks [20]. Therefore, the fragmented material mainly originated from the lunar regolith being crushed into rock-like materials after the impact, forming the debris seen in Figure 9 [20]. Moreover, these regolith clumps are believed to have originated from secondary impacts and impacts that fused together regolith ejecta from the existing crater walls and floor [94]. Based on the location of the small crater near the trajectory and the position and direction of the debris in the crater, ref. [20] deduced that the debris originated from the Zhinyu crater about 31 km away from the CE-4 landing site.

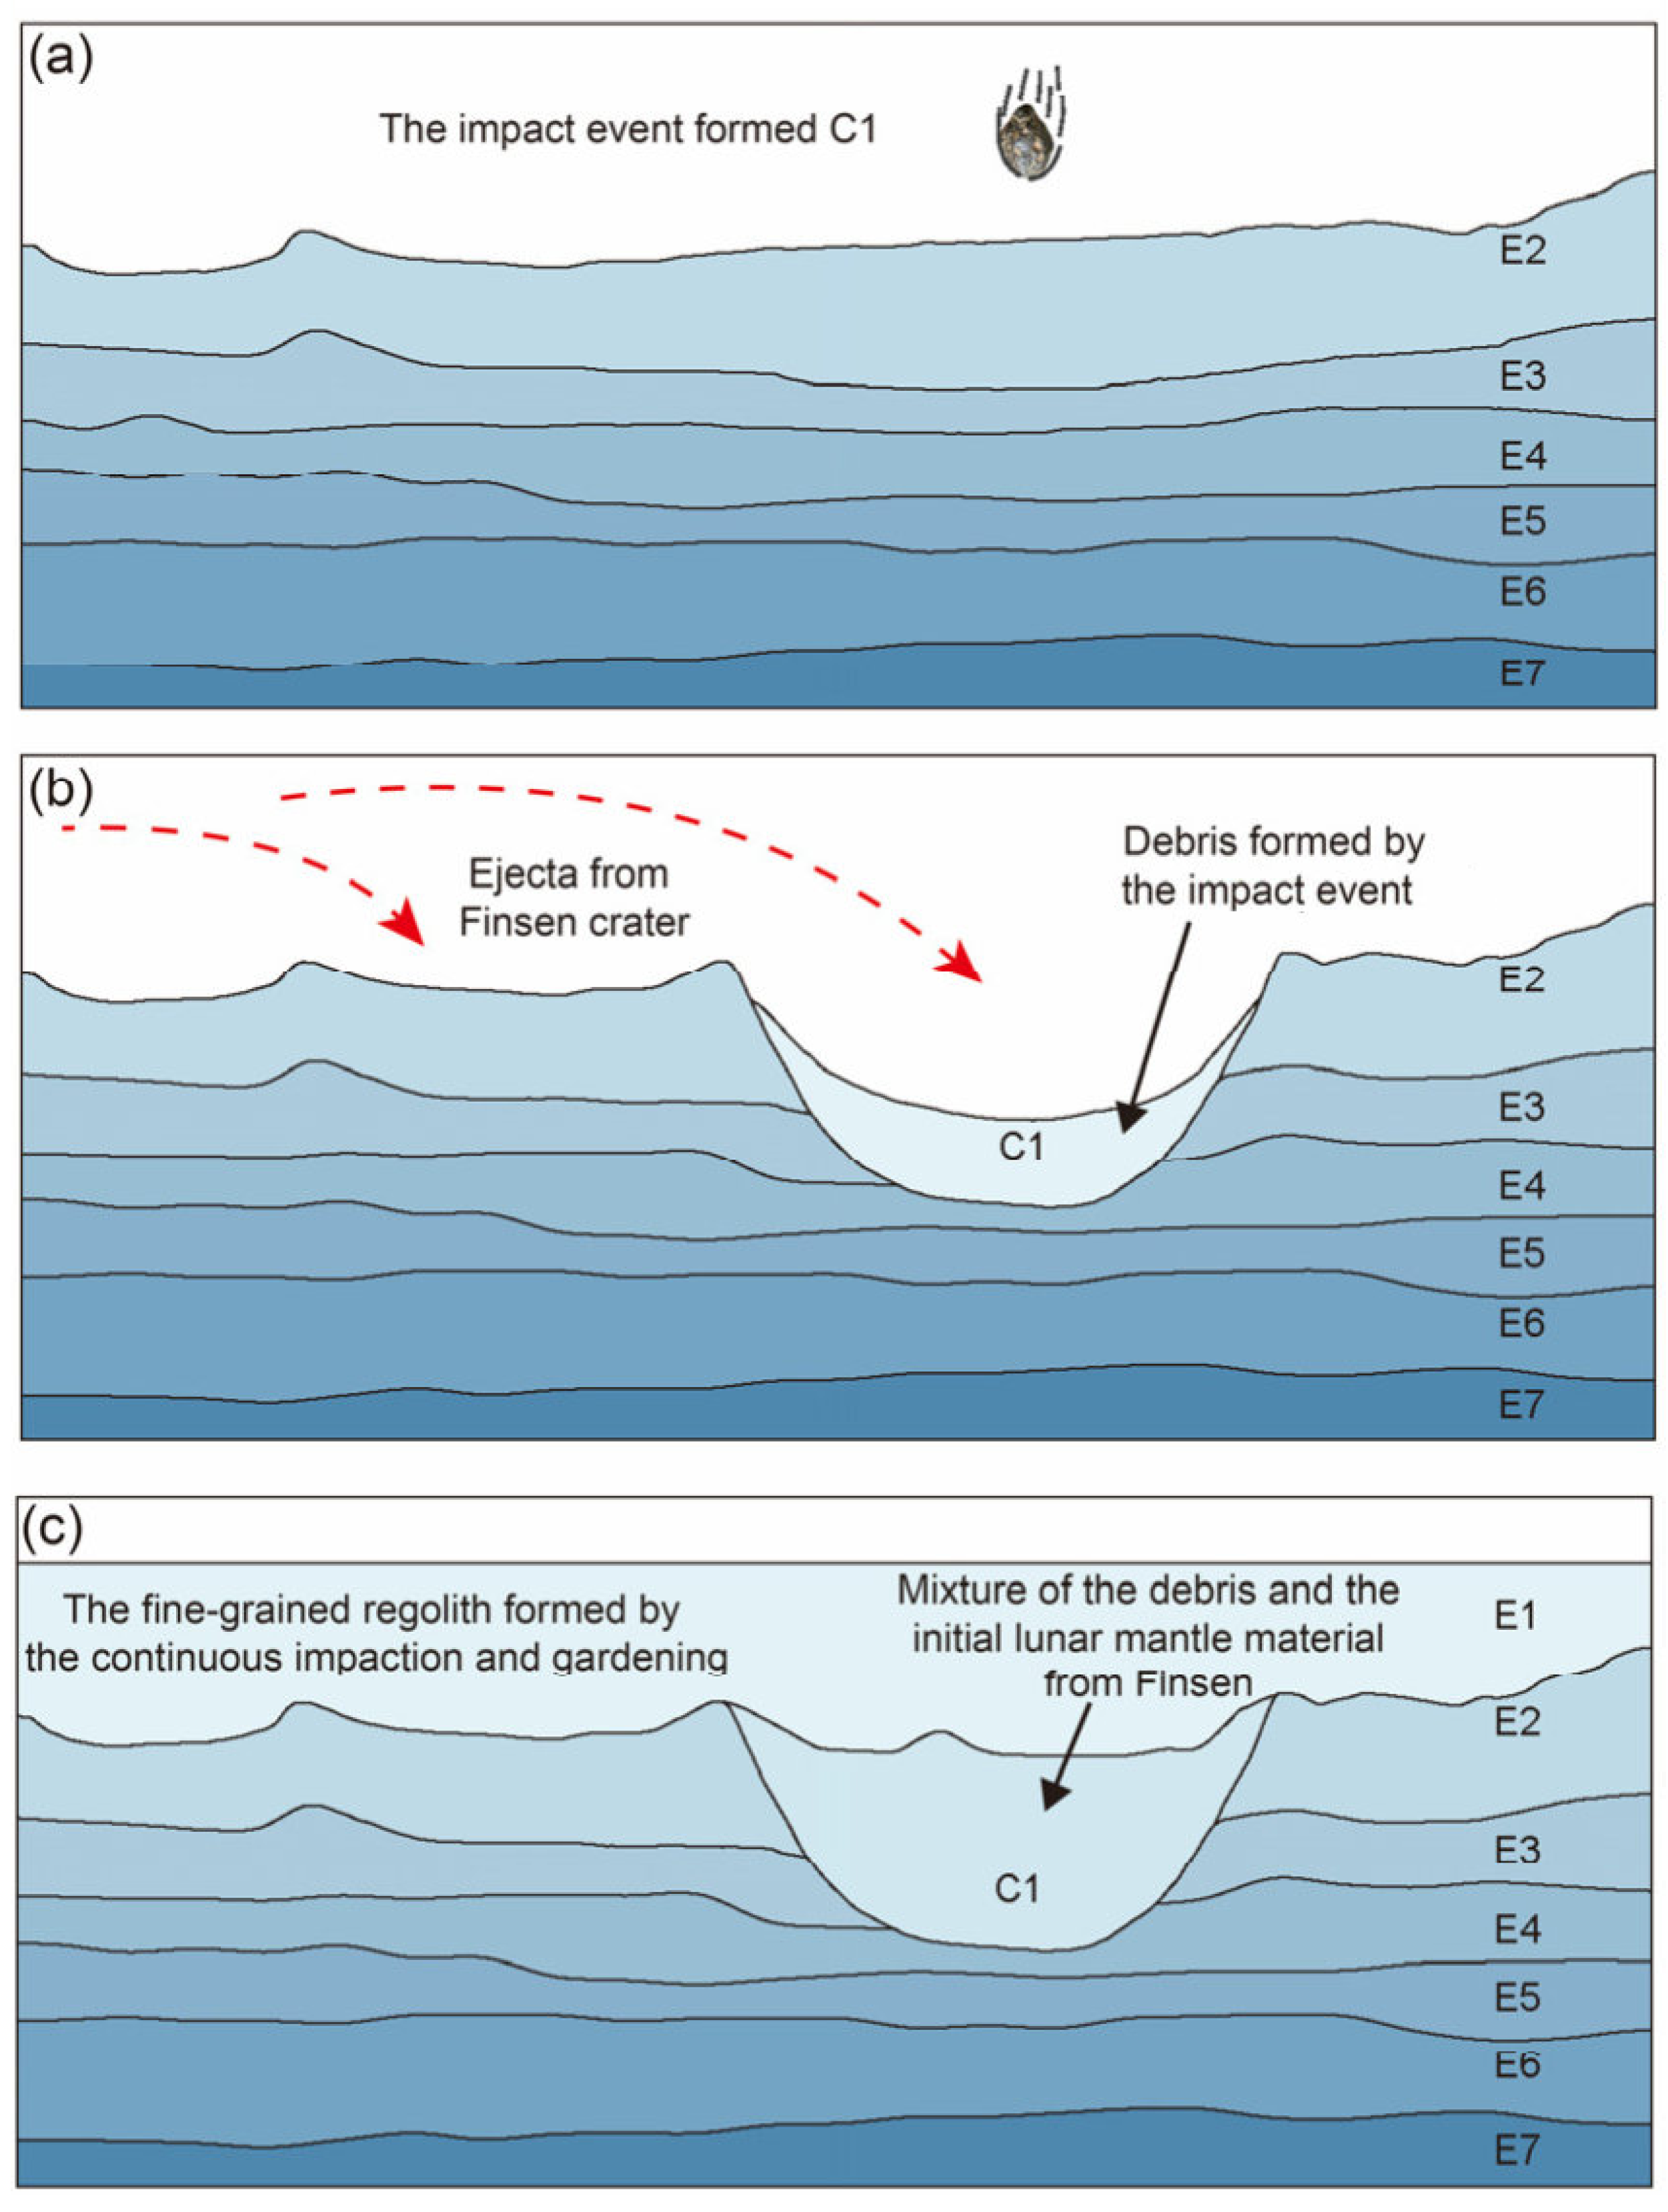
4.2. The Buried Crater Observed by the Yutu-2 Radar

The geological structure of the Moon’s shallow surface did not develop suddenly, nor did it come into existence in a single event. In the second part of this paper, we introduce the division and interpretation of the geological structure under the lunar surface of the landing site by researchers through the interpretation of LPR data. However, the process of interpreting the geological structure 10 m below the surface of the landing site also revealed some special structures. The high-frequency LPR data of Yutu-2 during the first 20 lunar days, it was found that the horizontal uniformity of the material at depths of 10 m to 25 m below the lunar surface changed greatly at 150–300 m distance from the landing site [95]. Zhang et al. [95] produced a map of radar signal reflection during the first 20 lunar days at the landing site, and it is shown in Figure 10.
Zhang et al. [95] produced the subsurface signal energy image for the first 20 lunar days. After the division, it was obvious that there was a crater with a diameter of ∼150 m and a depth of ∼10 m (Figure 10). Zhang et al. [95] interpreted it as an crater from the Imbrium period [95]. Chen et al. [74] calculated the dielectric constant of the material within the buried crater to be in the range of 3.4–5.8. This suggests that the material within the buried crater might be ejecta.
Zhou et al. [96] concluded that the material buried inside the crater had undergone weathering and impact events, and its formation process is given, shown in Figure 11. Zhou et al. [96] divided the lunar regolith structure before the impact event into six layers E2–E7. During the impact event, crater C1 penetrated through layers E2–E3 and reached layer E4. The material on the impact site was compressed and deformed as a result. Debris from the impact crater covered the surface of layer E2–E4 (Figure 11b), forming a new state of material. The material in crater C1 underwent weathering and modification along with the original E2 layer’s lunar regolith. According to previous studies, materials near the surface of the landing site of Yutu-2 are mainly materials from the Finsen crater [20,97]. It can be inferred that after the Finsen impact event, ejecta covered the C1 impact crater and formed the E1 layer of the lunar regolith. In summary, the crater contains three types of materials: the original lunar regolith clumps formed by impact events, the lunar regolith after weathering and modification, and the ejecta material from the Finsen crater.
After counting the high-frequency LPR data of 31 lunar days, Chen et al. [74] concluded that there was another buried crater at navigation points 21–31 (Figure 6), with a diameter of about 200 m and located roughly 17.1 m below the lunar surface. Chen et al. [74] believe that material from this crater also sputtered into the aforementioned crater C1. However, the geological distribution around it is not known, so the study of the crater still needs more observation to analyze.

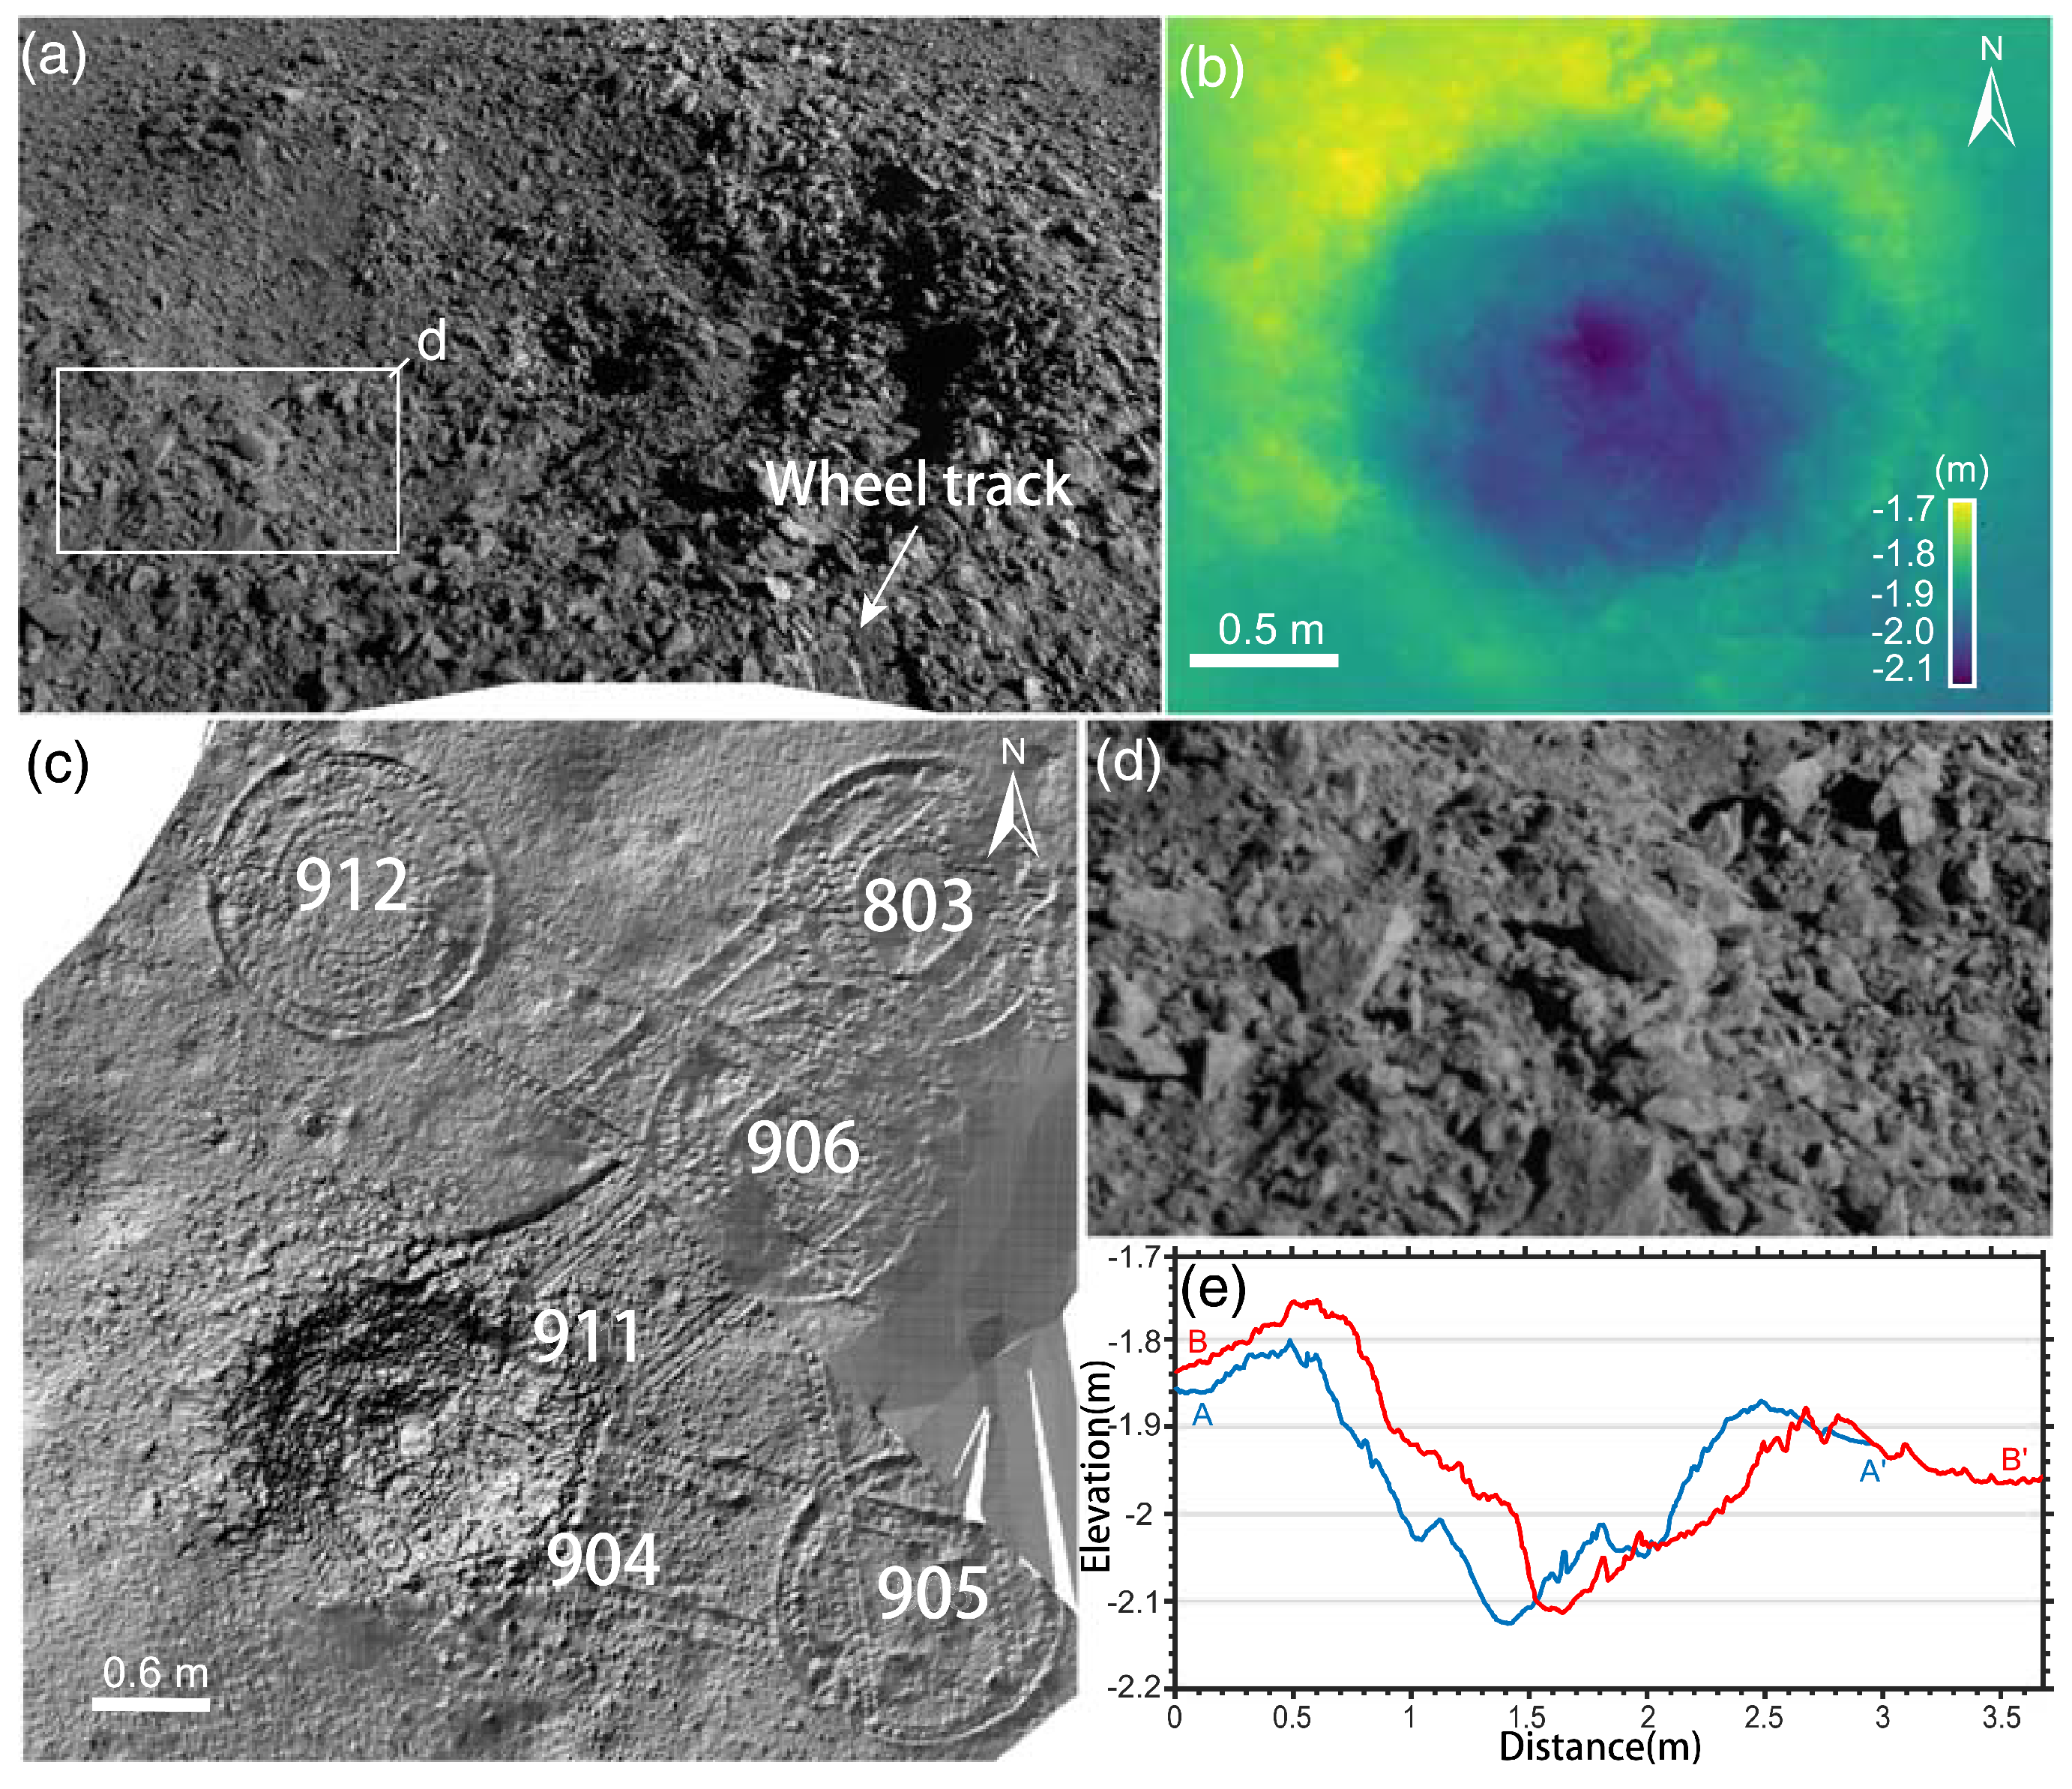
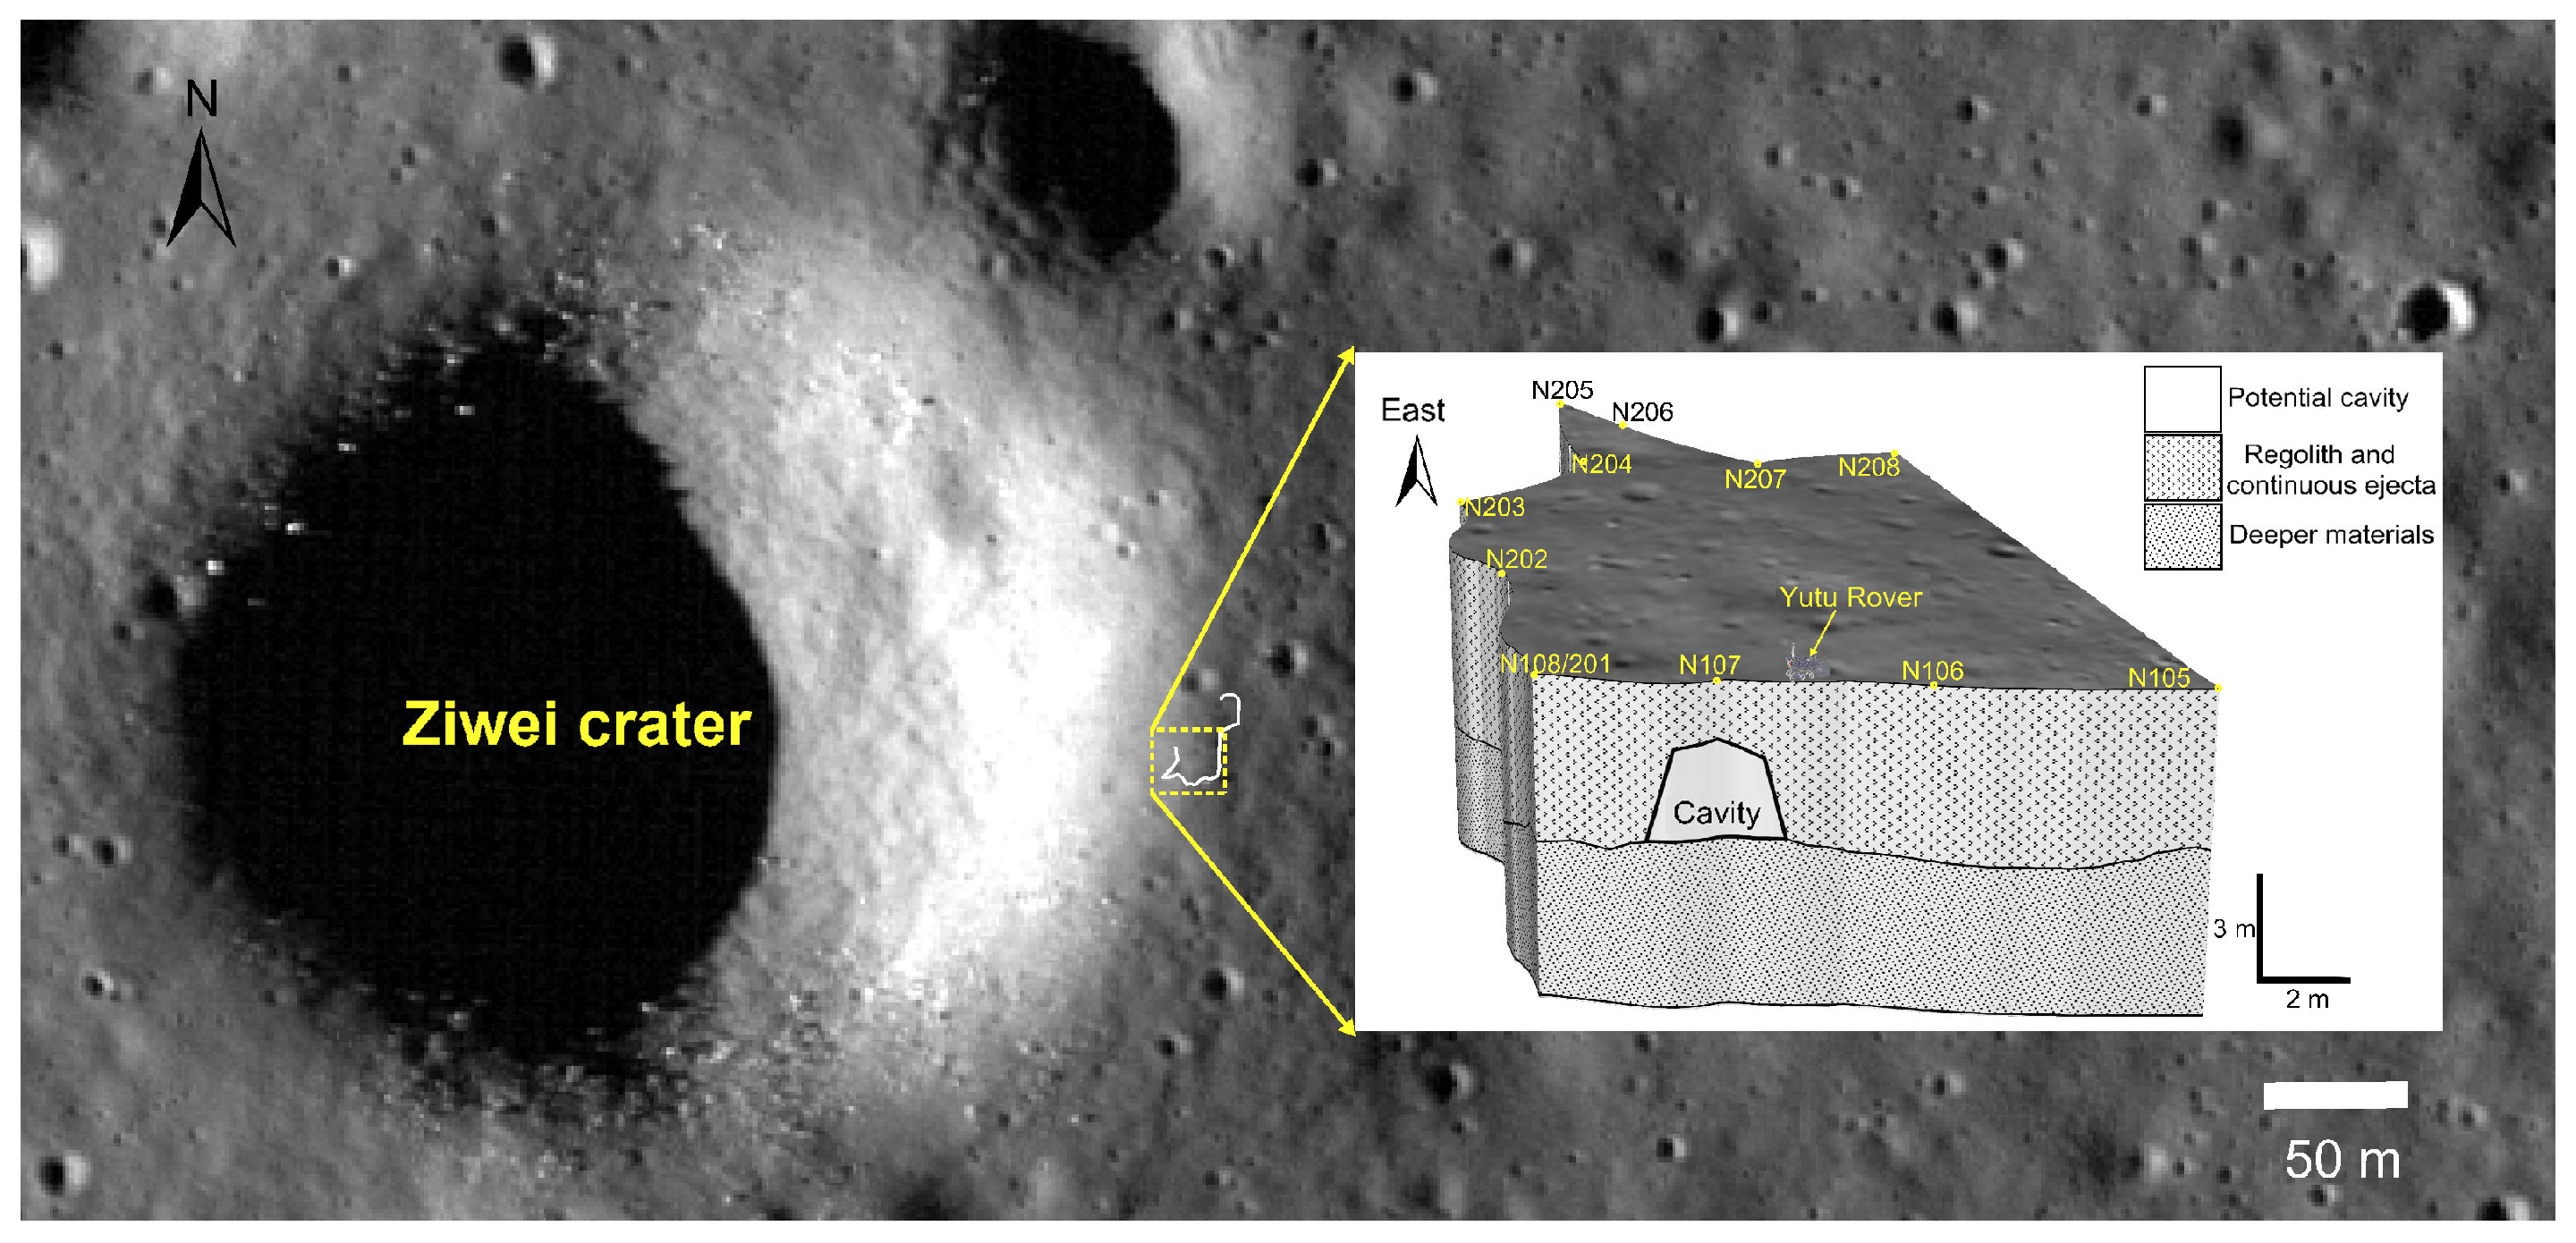
4.3. Subsurface Cavity Detection

In addition to impact events, volcanic eruptions were one of the major early events that altered the Moon’s geological structure. Though it ceased two billion years ago [98], lava flow produced by the volcanic activities covered approximately 17% of the Moon’s surface [99,100]. During a volcanic eruption, the lava that comes into contact with the external environment cools and solidifies quickly. Meanwhile, the lava that takes longer to dissipate heat remains fluid and continues to move forward, creating space for the formation of a cavity. This cavity is commonly referred to as a lava tube [101]. The inside dimensions of these tubes are about tens to hundreds of meters, and their roofs are estimated to be greater than 10 m. It can provide a natural shelter to protect human activities on the Moon from hazards such as radiation or impact [102,103]. Currently, high-frequency LPR can help observe special cavities under the lunar surface. Currently, only the CE mission has detected such a cavity. When analyzing data from the high-frequency LPR conducted by the Yutu rover during the CE mission, Ding et al. [104] observed a phenomenon where signals experienced reflected phase reversal in an area 50 ns beneath the lunar surface. Ding et al. [104] determined electromagnetic wave properties through numerical simulations of their different dielectric and subsurface geological structures. Eventually, Ding et al. [104] determined that it was a subsurface cavity about 3.1 m high, buried in the Ziwei crater’s ejecta (Figure 12). Currently, the Yutu-2 radar has obtained a large amount of data on the far side of the Moon, and the depth of penetration can reach tens to hundreds of meters below the surface of the Moon. This is most likely to detect lava tubes or cavities in the Moon’s shallow surface. Lava tubes beneath the lunar surface are potential natural barriers that can aid in determining the location of future lunar bases [103].

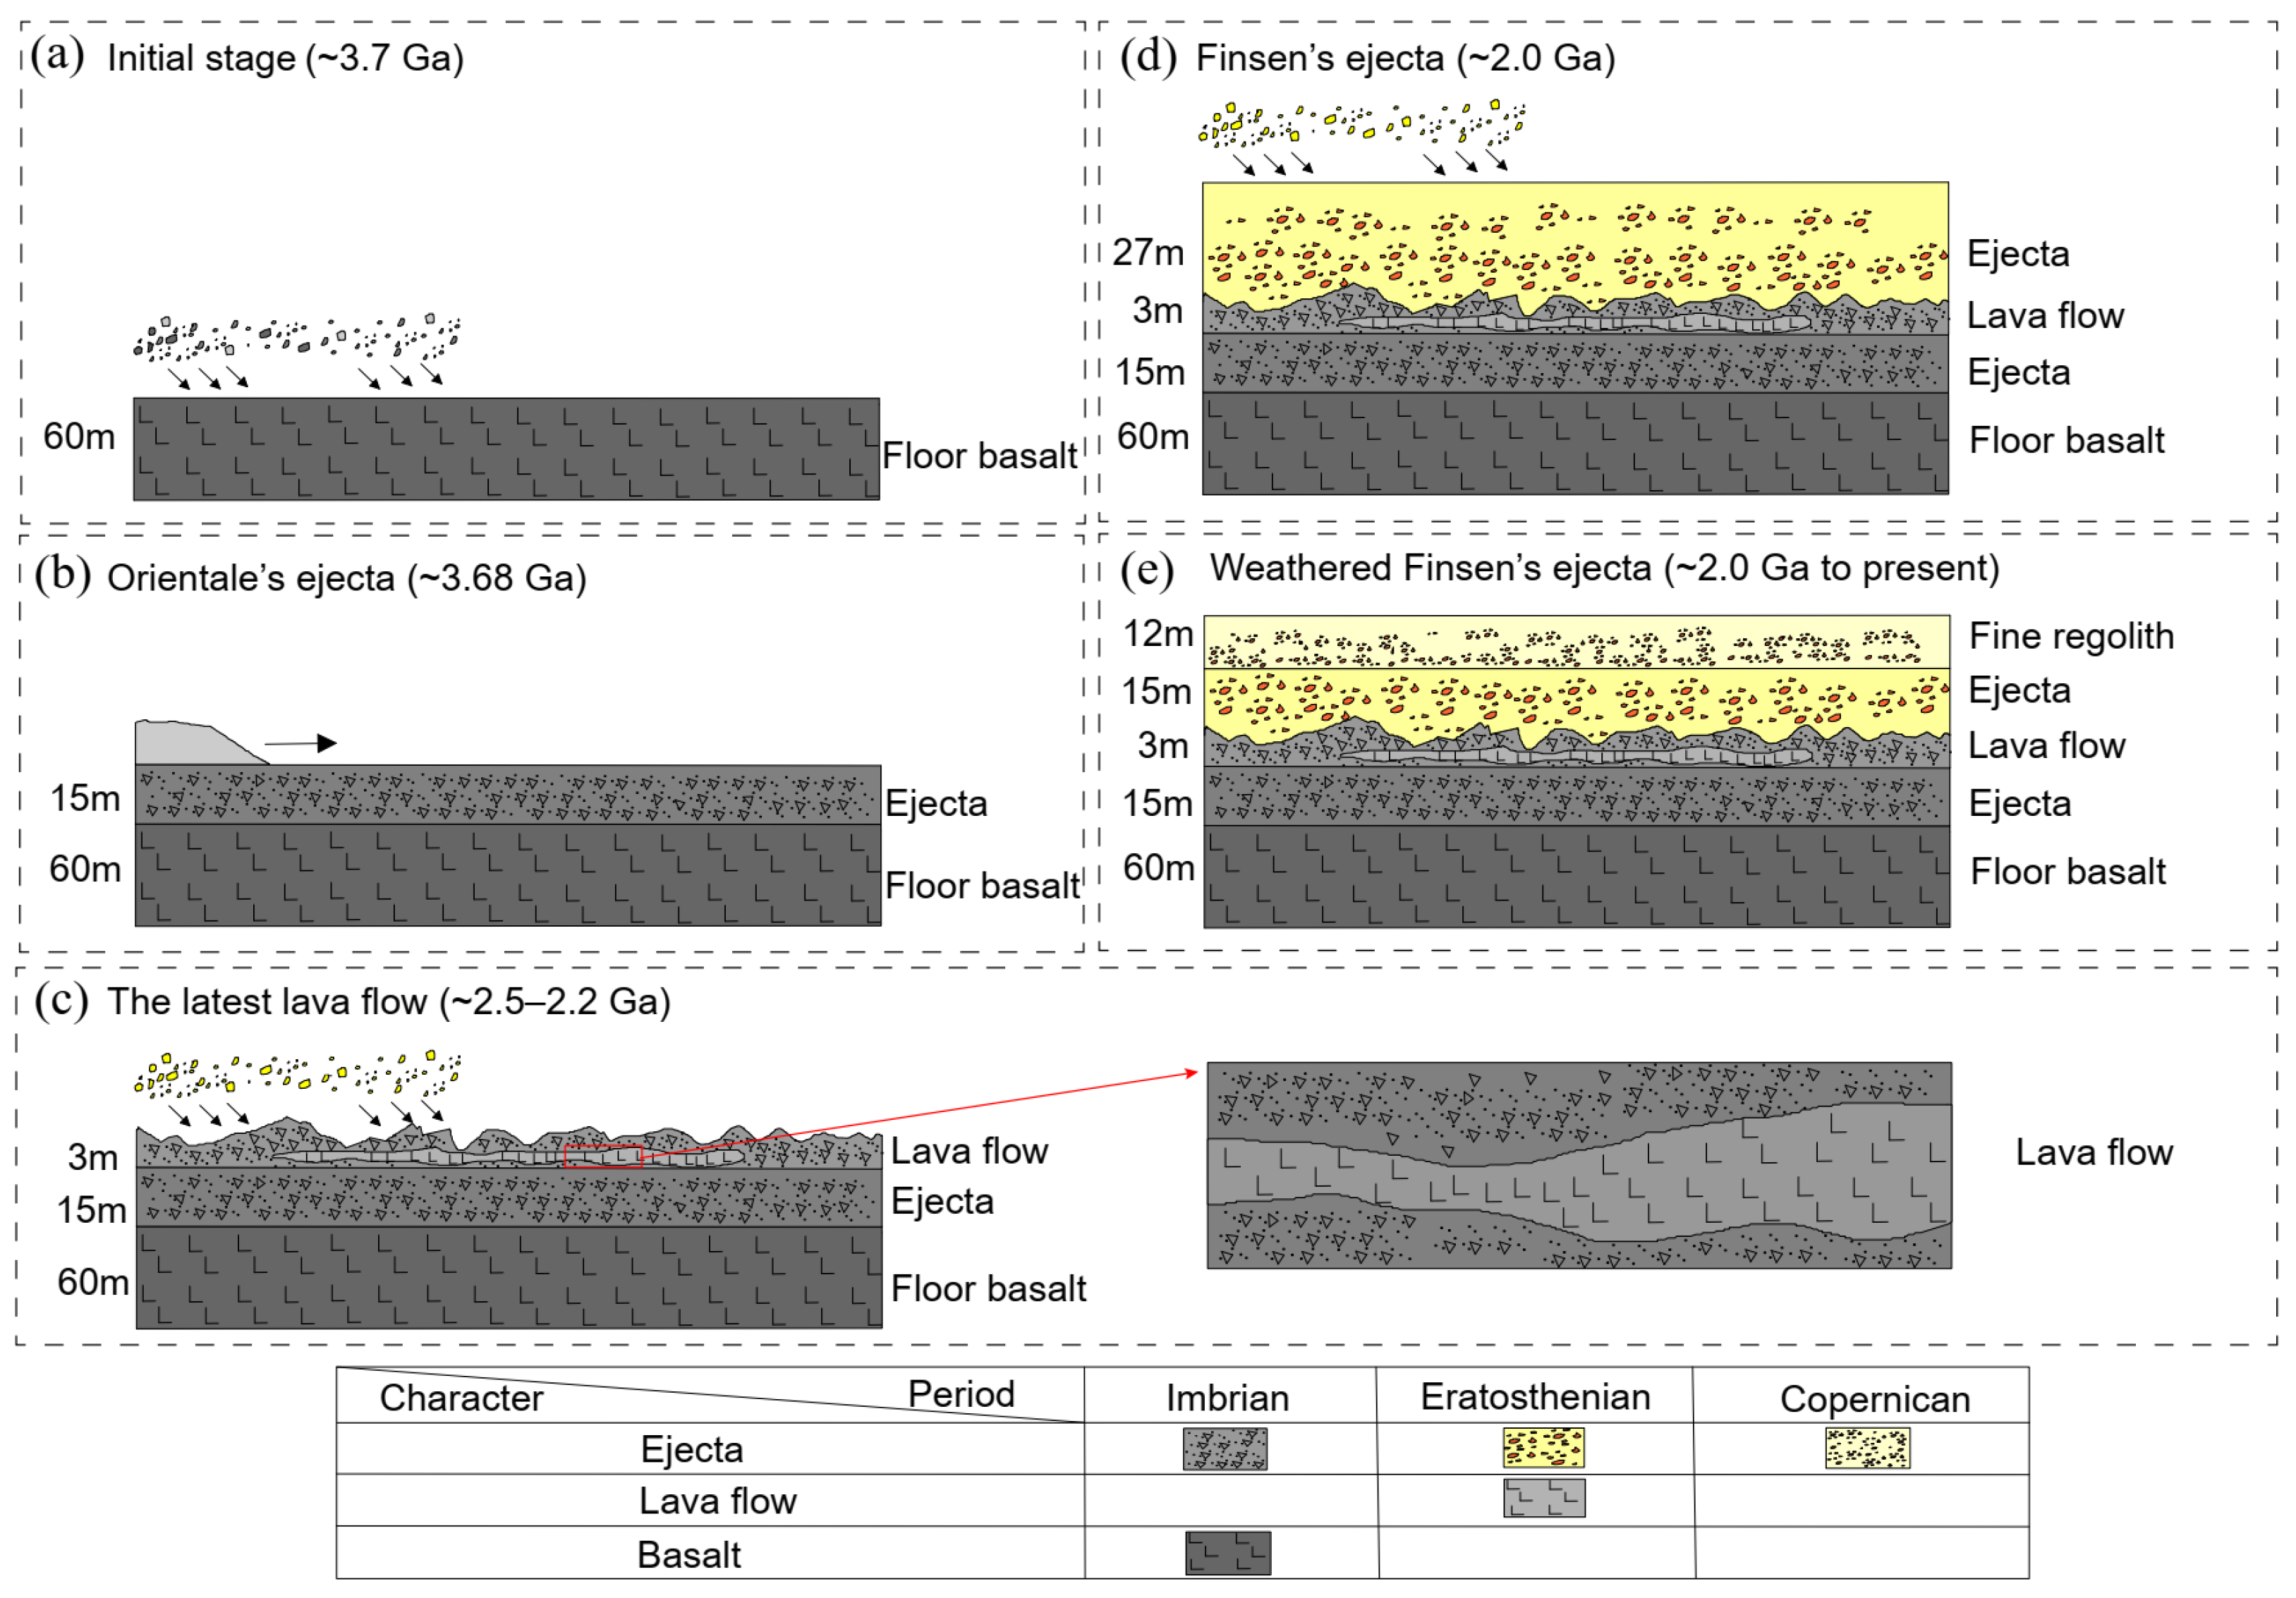
4.4. Volcanic Activity Revealed by High-Frequency LPR at the CE-4 Landing Site

The geological structure observed by high-frequency LPR can provide us with a further understanding of the geological evolution process under the lunar surface. Among them, the study of the evolution of the basalt beneath the lunar surface of the CE-4 landing site can help us understand the history of volcanic activity on the Moon. Based on high-frequency radar data, Li et al. [8] indicated that there was a buried lens structure with clean radar echo and independent of the surrounding area about ∼27 m below the lunar surface, which was interpreted as fine-grained lunar regolith developed from ejecta materials [8]. However Ding et al. [15] calculated that the dielectric constant and loss tangent of the buried lens is ∼10.5 and ∼0.037, respectively, which is inconsistent with those of the lunar regolith. Because the typical dielectric constant of lunar regolith is ∼3 and the loss tangent value is ∼0.005 [90]. Therefore, Ding et al. [15] by comparing the dielectric properties of the mare basalt shows that the buried lens is not fine-grained lunar regolith or ejecta, but more likely basalt [15]. Combined with the surrounding geological environment and the volcanic eruption history of the Moon, Ding et al. [15] suggests that the buried basalt is most likely the remains of the ∼2.5–2.2 Ga Eratosthenian volcano. It has updated the interpretation of the geological structure evolution process at the CE-4 landing site shown in Figure 13.

5. Summary and Future Observation Prospect of Yutu-2 Radar

In summary, the previous analysis of Yutu-2 radar observation mainly focuses on three aspects: shallow surface structure division, dielectric properties, and special geological features. The surface structure is divided into high- and low-frequency radar, with a focus on calculating the relative dielectric constant and loss tangent of the dielectric properties. The special geological layer mainly refers to the buried crater, lava tube, and/or subsurface cavity.
Based on the findings of Ding et al. [105] regarding high-frequency radar, the CE-4 landing area has been divided into three distinct geological units by multiple teams. This classification was made using the structural information gathered by the Yutu-2 radar at a depth of less than 40 m. The three sources can be interpreted in various ways. Some researchers believe that the last layer originates from the ejecta of the Finsen crater, Some researchers consider that the ejecting material at the bottom of the Von Kármán crater came from older craters [43,106]. For signals deeper than 40 m, it is close to the noise level and cannot be used to effectively identify echoes of the subsurface layer.
Currently, the latest published research shows the results of the first 1000 m detection data of Yutu-2, shown in Figure 14 [27]. It can be seen that there are obvious changes in the shallow geological structure and the shallow surface lunar regolith thickness. Therefore, further study of the layered structure of the lunar surface and quantification of the dielectric properties of each layer of the subsurface structure are still future research directions. A continuous layered structure with high reflection intensity can be found between 550 m and 750 m horizontally and around 27 m deep, shown in Figure 14. Further study of this radar signature is necessary and may lead to new research findings.
In terms of low-frequency radar, Zhang et al. [37] divided the subsurface into three basic units according to the amplitude of reflected waves: high reflection, low reflection, and relatively high reflection. Some researchers divided the subsurface structure of the landing area into three or more geological units [37,46,48] However, different researchers have different interpretations of stratification and material sources. The thickness of basalt in the Von Kármán crater is estimated to be 120 m based on the morphological method, which is consistent with the radar observation.
In terms of the dielectric properties below the lunar surface, many models have been summarized by predecessors to estimate the dielectric constant. Dong et al. [62] obtained 823 hyperbolic features and obtained the dielectric constant distribution of ∼50 m below the lunar surface using the CE-4 high-frequency radar. The loss tangent within ∼400 ns of high-frequency radar is ∼0.005, so it can be inferred that the dielectric properties of ejecta materials are more similar to lunar regolith materials [105]. According to the hyperbolic echo shown by Yutu-2 high-frequency radar data, there were scattered rocks in the lunar regolith [47]. Ding et al. [61] estimated that the mean dielectric constant within 4 cm of the surface was ∼3.11.
In terms of special geological structure, a crater formed before the Finsen crater is buried under the lunar surface at the CE-4 landing site [95]. Zhou et al. [96] explained the source and composition of materials in the buried crater. Chen et al. [74] calculated the dielectric constant of the material in the buried crater and further suggested the existence of another buried crater. In addition, they suggested the existence of a subsurface cavity underground in the CE-3 landing area [104], and this detection method may be applied to future lava tube and/or buried cavities detection using the Yutu-2 radar. A buried lens structure was detected about 27 m below the lunar surface at the CE-4 landing site. The nature of the buried lens structure is interpreted as a buried lava flow and the regolith evolution process at the CE-4 landing site is updated [15]. Currently, the Yutu-2 rover is still active on the far side of the Moon, and its exploration mission is not yet complete. In the future, it is expected to detect more special geological structures such as buried craters and volcanic lava tubes. Meanwhile, the study of the crater mentioned in Section 4.2 of this paper is not yet complete, and future data obtained by Yutu-2 will help further study the geological formation and evolution of the landing site.
The GPR carried by CE-3 is the first time that human beings have deployed an in-situ radar to detect the surface of an extraterrestrial body. CE-4, CE-5, and future CE-6 and CE-7 will carry GPR equipment as well. In the Mars exploration, the Perseverance rover and Zhurong rover, as well as the future ExoMars mission to be launched are carrying GPR equipment. It shows that the GPR payload plays an important role in the detection of extraterrestrial bodies. It opens up a new perspective and a new milestone in the detection of extraterrestrial objects using GPR technology.

Author Contributions

Conceptualization, C.D.; methodology, Z.L. and C.D.; software, Z.L. and C.D.; validation, Z.L. and C.D.; formal analysis, Z.L. and C.D.; investigation, Z.L. and C.D.; resources, C.D.; writing—original draft preparation, Z.L. and C.D.; writing—review and editing, C.D.; visualization, C.D.; project administration, C.D.; supervision, C.D. funding acquisition, C.D. All authors have read and agreed to the published version of the manuscript.

Funding

This work is supported by the National Natural Science Foundation of China (Grant No. 42241139 and 42004099), the Opening Fund of the Key Laboratory of Lunar and Deep Space Exploration, Chinese Academy of Sciences (No. LDSE202005), the National Innovation and Entrepreneurship Training Program for College Students (No. 202310590016), the Fund of Shanghai Institute of Aerospace System Engineering (No. PZ_YY_SYF_JY200275), and the Shenzhen Municipal Government Investment Project (No. 2106_440300_04_03_901272).

Data Availability Statement

Data obtained by the panoramic camera and high-frequency Yutu-2 radar are available in the data archive located at http://moon.bao.ac.cn.

Conflicts of Interest

The authors declare no conflict of interest.

References

  1. Ouyang, Z.; Zhou, Y.; Li, C.; Liu, J. The prospect of exploitation and utilization of some lunar resources. Earth Sci. 2002, 27, 498–503. [Google Scholar]
  2. Ding, C.; Feng, J.; Zheng, L.; Dai, S.; Xing, S.; Xiao, Y.; Su, Y. A review of applications of radar-detection techniques in lunar explorations. Astron. Res. Technol.-Publ. Natl. Astron. Obs. China 2015, 12, 228–242. [Google Scholar]
  3. Li, C.; Liu, J.; Ren, X.; Zuo, W.; Tan, X.; Wen, W.; Li, H.; Mu, L.; Su, Y.; Zhang, H.; et al. The Chang’e 3 mission overview. Space Sci. Rev. 2015, 190, 85–101. [Google Scholar] [CrossRef]
  4. Foster, R.G.; Roenneberg, T. Human responses to the geophysical daily, annual and lunar cycles. Curr. Biol. 2008, 18, R784–R794. [Google Scholar] [CrossRef]
  5. Dickson, P. Sputnik: The Shock of the Century; Bloomsbury Publishing USA: New York, NY, USA, 2001. [Google Scholar]
  6. Ouyang, Z. Introduction to Lunar Science; China Aerospace Press: Beijing, China, 2005; pp. 151–251. [Google Scholar]
  7. Wu, W.; Yu, D.; Wang, C.; Liu, J.; Tang, Y.; Zhang, H.; Zhang, Z. Technological breakthroughs and scientific progress of the Chang’e-4 mission. Sci. China Inf. Sci. 2020, 63, 1–14. [Google Scholar] [CrossRef]
  8. Li, C.; Su, Y.; Pettinelli, E.; Xing, S.; Ding, C.; Liu, J.; Ren, X.; Lauro, S.E.; Soldovieri, F.; Zeng, X.; et al. The Moon’s farside shallow subsurface structure unveiled by Chang’E-4 Lunar Penetrating Radar. Sci. Adv. 2020, 6, eaay6898. [Google Scholar] [CrossRef]
  9. Li, C.; Zuo, W.; Wen, W.; Zeng, X.; Gao, X.; Liu, Y.; Fu, Q.; Zhang, Z.; Su, Y.; Ren, X.; et al. Overview of the Chang’e-4 mission: Opening the frontier of scientific exploration of the lunar far side. Space Sci. Rev. 2021, 217, 1–32. [Google Scholar] [CrossRef]
  10. Ding, L.; Zhou, R.; Yuan, Y.; Yang, H.; Li, J.; Yu, T.; Liu, C.; Wang, J.; Li, S.; Gao, H.; et al. A 2-year locomotive exploration and scientific investigation of the lunar farside by the Yutu-2 rover. Sci. Robot. 2022, 7, eabj6660. [Google Scholar] [CrossRef] [PubMed]
  11. Jia, Y.; Zou, Y.; Ping, J.; Xue, C.; Yan, J.; Ning, Y. The scientific objectives and payloads of Chang’E- 4 mission. Planet. Space Sci. 2018, 162, 207–215. [Google Scholar] [CrossRef]
  12. Ling, Z.; Qiao, L.; Liu, C.; Cao, H.; Bi, X.; Lu, X.; Zhang, J.; Fu, X.; Li, B.; Liu, J. Composition, mineralogy and chronology of mare basalts and non-mare materials in Von Kármán crater: Landing site of the Chang’E- 4 mission. Planet. Space Sci. 2019, 179, 104741. [Google Scholar] [CrossRef]
  13. Fang, G.Y.; Zhou, B.; Ji, Y.C.; Zhang, Q.Y.; Shen, S.X.; Li, Y.X.; Guan, H.F.; Tang, C.J.; Gao, Y.Z.; Lu, W.; et al. Lunar Penetrating Radar onboard the Chang’e-3 mission. Res. Astron. Astrophys. 2014, 14, 1607. [Google Scholar] [CrossRef]
  14. Su, Y.; Fang, G.Y.; Feng, J.Q.; Xing, S.G.; Ji, Y.C.; Zhou, B.; Gao, Y.Z.; Li, H.; Dai, S.; Xiao, Y.; et al. Data processing and initial results of Chang’e-3 lunar penetrating radar. Res. Astron. Astrophys. 2014, 14, 1623. [Google Scholar] [CrossRef]
  15. Ding, C.; Li, J.; Hu, R. Moon-based Ground Penetrating Radar Observation of the Latest Volcanic Activity at the Chang’E-4 Landing Site. IEEE Trans. Geosci. Remote Sens. 2023, 61, 4600410. [Google Scholar] [CrossRef]
  16. Lauro, S.E.; Pettinelli, E.; Caprarelli, G.; Guallini, L.; Rossi, A.P.; Mattei, E.; Cosciotti, B.; Cicchetti, A.; Soldovieri, F.; Cartacci, M.; et al. Multiple subglacial water bodies below the south pole of Mars unveiled by new MARSIS data. Nat. Astron. 2021, 5, 63–70. [Google Scholar] [CrossRef]
  17. Orosei, R.; Ding, C.; Fa, W.; Giannopoulos, A.; Hérique, A.; Kofman, W.; Lauro, S.E.; Li, C.; Pettinelli, E.; Su, Y.; et al. The global search for liquid water on Mars from orbit: Current and future perspectives. Life 2020, 10, 120. [Google Scholar] [CrossRef] [PubMed]
  18. Zhang, H.B.; Zheng, L.; Su, Y.; Fang, G.Y.; Zhou, B.; Feng, J.Q.; Xing, S.G.; Dai, S.; Li, J.D.; Ji, Y.C.; et al. Performance evaluation of lunar penetrating radar onboard the rover of CE-3 probe based on results from ground experiments. Res. Astron. Astrophys. 2014, 14, 1633. [Google Scholar] [CrossRef]
  19. Di, K.; Liu, Z.; Liu, B.; Wan, W.; Peng, M.; Wang, Y.; Gou, S.; Yue, Z.; Xin, X.; Jia, M.; et al. Chang’e-4 lander localization based on multi-source data. J. Remote Sens. 2019, 23, 177–184. [Google Scholar]
  20. Ding, C.; Xiao, Z.; Wu, B.; Li, Y.; Prieur, N.C.; Cai, Y.; Su, Y.; Cui, J. Fragments delivered by secondary craters at the Chang’E-4 landing site. Geophys. Res. Lett. 2020, 47, e2020GL087361. [Google Scholar] [CrossRef]
  21. Wu, B.; Li, F.; Hu, H.; Zhao, Y.; Wang, Y.; Xiao, P.; Li, Y.; Liu, W.C.; Chen, L.; Ge, X.; et al. Topographic and geomorphological mapping and analysis of the Chang’E-4 landing site on the far side of the Moon. Photogramm. Eng. Remote Sens. 2020, 86, 247–258. [Google Scholar] [CrossRef]
  22. Tartèse, R.; Anand, M.; Gattacceca, J.; Joy, K.H.; Mortimer, J.I.; Pernet-Fisher, J.F.; Russell, S.; Snape, J.F.; Weiss, B.P. Constraining the evolutionary history of the Moon and the inner solar system: A case for new returned lunar samples. Space Sci. Rev. 2019, 215, 54. [Google Scholar] [CrossRef]
  23. Li, S.; Lucey, P.G.; Milliken, R.E.; Hayne, P.O.; Fisher, E.; Williams, J.P.; Hurley, D.M.; Elphic, R.C. Direct evidence of surface exposed water ice in the lunar polar regions. Proc. Natl. Acad. Sci. USA 2018, 115, 8907–8912. [Google Scholar] [CrossRef]
  24. Robinson, K.L.; Taylor, G.J. Heterogeneous distribution of water in the Moon. Nat. Geosci. 2014, 7, 401–408. [Google Scholar] [CrossRef]
  25. Hagerty, J.J.; Lawrence, D.; Hawke, B. Thorium abundances of basalt ponds in South Pole-Aitken basin: Insights into the composition and evolution of the far side lunar mantle. J. Geophys. Res. Planets 2011, 116, E0600. [Google Scholar] [CrossRef]
  26. Li, C.; Liu, D.; Liu, B.; Ren, X.; Liu, J.; He, Z.; Zuo, W.; Zeng, X.; Xu, R.; Tan, X.; et al. Chang’E-4 initial spectroscopic identification of lunar far-side mantle-derived materials. Nature 2019, 569, 378–382. [Google Scholar] [CrossRef] [PubMed]
  27. Feng, Y.; Chen, S.; Tong, X.; Wang, C.; Li, P.; Xi, M.; Xiao, C. Exploring the Lunar Regolith’s Thickness and Dielectric Properties Using Band-Limited Impedance at Chang’E-4 Landing Site. J. Geophys. Res. Planets 2023, 128, e2022JE007540. [Google Scholar] [CrossRef]
  28. Ding, C.; Li, C.; Xiao, Z.; Su, Y.; Xing, S.; Wang, Y.; Feng, J.; Dai, S.; Xiao, Y.; Yao, M. Layering structures in the porous material beneath the Chang’e-3 landing site. Earth Space Sci. 2020, 7, e2019EA000862. [Google Scholar] [CrossRef]
  29. Feng, J.; Su, Y.; Ding, C.; Xing, S.; Dai, S.; Zou, Y. Dielectric properties estimation of the lunar regolith at CE-3 landing site using lunar penetrating radar data. Icarus 2017, 284, 424–430. [Google Scholar] [CrossRef]
  30. Xiao, Z.; Ding, C.; Xie, M.; Cai, Y.; Cui, J.; Zhang, K.; Wang, J. Ejecta from the Orientale basin at the Chang’E-4 landing site. Geophys. Res. Lett. 2021, 48, e2020GL090935. [Google Scholar] [CrossRef]
  31. Quaide, W.L.; Oberbeck, V.R. Thickness determinations of the lunar surface layer from lunar impact craters. J. Geophys. Res. 1968, 73, 5247–5270. [Google Scholar] [CrossRef]
  32. Yuan, Y.; Zhu, P.; Xiao, L.; Huang, J.; Garnero, E.J.; Deng, J.; Wang, F.; Qian, Y.; Zhao, N.; Wang, W.; et al. Intermittent volcanic activity detected in the Von Kármán crater on the farside of the Moon. Earth Planet. Sci. Lett. 2021, 569, 117062. [Google Scholar] [CrossRef]
  33. Qiao, L.; Ling, Z.; Fu, X.; Li, B. Geological characterization of the Chang’e-4 landing area on the lunar farside. Icarus 2019, 333, 37–51. [Google Scholar] [CrossRef]
  34. Giannakis, I.; Zhou, F.; Warren, C.; Giannopoulos, A. Inferring the shallow layered structure at the Chang’E-4 landing site: A novel interpretation approach using lunar penetrating radar. Geophys. Res. Lett. 2021, 48, e2021GL092866. [Google Scholar] [CrossRef]
  35. Lu, Y.; Wu, Y.; Michael, G.G.; Ma, J.; Cai, W.; Qin, N. Chronological sequence of Chang’E-4 landing zone within Von Kármán crater. Icarus 2021, 354, 114086. [Google Scholar] [CrossRef]
  36. Huang, J.; Xiao, Z.; Flahaut, J.; Martinot, M.; Head, J.; Xiao, X.; Xie, M.; Xiao, L. Geological characteristics of Von Kármán crater, northwestern south pole-Aitken Basin: Chang’E-4 landing site region. J. Geophys. Res. Planets 2018, 123, 1684–1700. [Google Scholar] [CrossRef]
  37. Zhang, J.; Zhou, B.; Lin, Y.; Zhu, M.H.; Song, H.; Dong, Z.; Gao, Y.; Di, K.; Yang, W.; Lin, H.; et al. Lunar regolith and substructure at Chang’E-4 landing site in South Pole–Aitken basin. Nat. Astron. 2021, 5, 25–30. [Google Scholar] [CrossRef]
  38. Losiak, A.; Wilhelms, D.; Byrne, C.; Thaisen, K.; Weider, S.; Kohout, T.; O’Sullivan, K.; Kring, D. A new lunar impact crater database. In Proceedings of the 40th Annual Lunar and Planetary Science Conference, The Woodlands, TX, USA, 23–27 March 2009; p. 1532. [Google Scholar]
  39. Wilhelms, D.E.; McCauley, J.F.; Trask, N.J. The Geologic History of the Moon; Technical Report; U.S. Geological Survey Publications Warehouse: Reston, VA, USA, 1987.
  40. Pasckert, J.H.; Hiesinger, H.; van der Bogert, C.H. Lunar farside volcanism in and around the South Pole–Aitken basin. Icarus 2018, 299, 538–562. [Google Scholar] [CrossRef]
  41. Melosh, H.J. Impact Cratering: A Geologic Process; Oxford University Press: New York, NY, USA; Clarendon Press: Oxford, UK, 1989. [Google Scholar]
  42. Yingst, R.; Chuang, F.; Berman, D.; Mest, S. Geologic mapping of the Planck Quadrangle of the Moon (LQ-29). In Proceedings of the 48th Annual Lunar and Planetary Science Conference, The Woodlands, TX, USA, 20–24 March 2017; p. 1680. [Google Scholar]
  43. Chang, Y.; Xiao, Z.; Wang, Y.; Ding, C.; Cui, J.; Cai, Y. An updated constraint on the local stratigraphy at the Chang’E-4 landing site. Earth Planet. Phys. 2021, 5, 19–31. [Google Scholar] [CrossRef]
  44. Zhao, N.; Zhu, P.; Yang, K.; Yuan, Y.; Guo, S. The preliminary processing and analysis of LPR Channel-2B data from Chang’E-3. Sci. China Phys. Mech. Astron. 2014, 57, 2346–2353. [Google Scholar] [CrossRef]
  45. Baker, V. Planetary geomorphology: Some historical/analytical perspectives. Geomorphology 2015, 240, 8–17. [Google Scholar] [CrossRef]
  46. Zhang, L.; Li, J.; Zeng, Z.; Xu, Y.; Liu, C.; Chen, S. Stratigraphy of the Von Kármán Crater Based on Chang’E-4 Lunar Penetrating Radar Data. Geophys. Res. Lett. 2020, 47, e2020GL088680. [Google Scholar] [CrossRef]
  47. Lai, J.; Xu, Y.; Zhang, X.; Xiao, L.; Yan, Q.; Meng, X.; Zhou, B.; Dong, Z.; Zhao, D. Comparison of dielectric properties and structure of lunar regolith at Chang’e-3 and Chang’e-4 landing sites revealed by ground-penetrating radar. Geophys. Res. Lett. 2019, 46, 12783–12793. [Google Scholar] [CrossRef]
  48. Lai, J.; Xu, Y.; Bugiolacchi, R.; Meng, X.; Xiao, L.; Xie, M.; Liu, B.; Di, K.; Zhang, X.; Zhou, B.; et al. First look by the Yutu-2 rover at the deep subsurface structure at the lunar farside. Nat. Commun. 2020, 11, 3426. [Google Scholar] [CrossRef]
  49. Feng, J.; Siegler, M.A.; Su, Y.; Ding, C.; Giannakis, I. Layered Structures in the Upper Several Hundred Meters of the Moon Along the Chang’E-4 Rover’s First 1000-m Traverse. J. Geophys. Res. Planets 2023, 128, e2022JE007714. [Google Scholar] [CrossRef]
  50. Cao, H.; Xu, Y.; Xu, L.; Zhang, L.; Bugiolacchi, R.; Zhang, F. From Schrödinger to Von Kármán: An Intriguing New Geological Structure Revealed by the Chang’e-4 Lunar Penetrating Radar. Geophys. Res. Lett. 2023, 50, e2022GL101413. [Google Scholar] [CrossRef]
  51. Ivanov, M.; Hiesinger, H.; Van Der Bogert, C.; Orgel, C.; Pasckert, J.; Head, J. Geologic history of the northern portion of the South Pole-Aitken basin on the Moon. J. Geophys. Res. Planets 2018, 123, 2585–2612. [Google Scholar] [CrossRef]
  52. Du, J.; Fa, W.; Wieczorek, M.A.; Xie, M.; Cai, Y.; Zhu, M.H. Thickness of lunar mare basalts: New results based on modeling the degradation of partially buried craters. J. Geophys. Res. Planets 2019, 124, 2430–2459. [Google Scholar] [CrossRef]
  53. Stuartz, A. Geologic Map of the Central Far Side of the Moon; U.S. Geological Survey Publications Warehouse: Reston, VA, USA, 1978.
  54. Fu, X.H.; Qiao, L.; Zhang, J.; Ling, Z.C.; Li, B. The subsurface structure and stratigraphy of the Chang’E-4 landing site: Orbital evidence from small craters on the Von Kármán crater floor. Res. Astron. Astrophys. 2020, 20, 008. [Google Scholar] [CrossRef]
  55. Pettinelli, E.; Lauro, S.E.; Mattei, E.; Cosciotti, B.; Soldovieri, F. Stratigraphy versus artefacts in the Chang’e-4 low-frequency radar. Nat. Astron. 2021, 5, 890–893. [Google Scholar] [CrossRef]
  56. Zhang, J.; Zhou, B.; Lin, Y. Reply to: Stratigraphy versus artefacts in the Chang’e-4 low-frequency radar. Nat. Astron. 2021, 5, 894–897. [Google Scholar] [CrossRef]
  57. Li, C.; Xing, S.; Lauro, S.E.; Su, Y.; Dai, S.; Feng, J.; Cosciotti, B.; Di Paolo, F.; Mattei, E.; Xiao, Y.; et al. Pitfalls in GPR data interpretation: False reflectors detected in lunar radar cross sections by Chang’e-3. IEEE Trans. Geosci. Remote Sens. 2017, 56, 1325–1335. [Google Scholar] [CrossRef]
  58. Xing, S.; Su, Y. Simulation of lunar soil relative dielectric constant inversion method based on lunar radar mechanism. Astron. Res. Technol. 2015, 12, 306–311. [Google Scholar]
  59. Zhang, L.; Zeng, Z.; Li, J.; Huang, L.; Huo, Z.; Wang, K.; Zhang, J. Parameter Estimation of Lunar Regolith from Lunar Penetrating Radar Data. Sensors 2018, 18, 2907. [Google Scholar] [CrossRef] [PubMed]
  60. Ding, C.; Xiao, Z.; Su, Y.; Zhao, J.; Cui, J. Compositional variations along the route of Chang’e-3 Yutu rover revealed by the lunar penetrating radar. Prog. Earth Planet. Sci. 2020, 7, 32. [Google Scholar] [CrossRef]
  61. Ding, C.; Xiao, Z.; Wu, B.; Li, Z.; Su, Y.; Zhou, B.; Liu, K.; Cui, J. Rock Fragments in Shallow Lunar Regolith: Constraints by the Lunar Penetrating Radar Onboard the Chang’E-4 Mission. J. Geophys. Res. Planets 2021, 126, e2021JE006917. [Google Scholar] [CrossRef]
  62. Dong, Z.; Fang, G.; Zhao, D.; Zhou, B.; Gao, Y.; Ji, Y. Dielectric properties of lunar subsurface materials. Geophys. Res. Lett. 2020, 47, e2020GL089264. [Google Scholar] [CrossRef]
  63. Fa, W. Bulk Density of the Lunar Regolith at the Chang’E-3 Landing Site as Estimated From Lunar Penetrating Radar. Earth Space Sci. 2020, 7, e2019EA000801. [Google Scholar] [CrossRef]
  64. Daniels, D.J. Ground Penetrating Radar; John Wiley & Sons, Inc.: Hoboken, NJ, USA, 2004; Volume 1. [Google Scholar]
  65. Ristic, A.V.; Petrovacki, D.; Govedarica, M. A new method to simultaneously estimate the radius of a cylindrical object and the wave propagation velocity from GPR data. Comput. Geosci. 2009, 35, 1620–1630. [Google Scholar] [CrossRef]
  66. Jol, H.M. Ground Penetrating Radar Theory and Applications; Elsevier: Amsterdam, The Netherlands, 2008. [Google Scholar]
  67. Shihab, S.; Al-Nuaimy, W. Radius estimation for cylindrical objects detected by ground penetrating radar. Subsurf. Sens. Technol. Appl. 2005, 6, 151–166. [Google Scholar] [CrossRef]
  68. Ulaby, F.T.; Moore, R.K.; Fung, A.K. Microwave Remote Sensing: Active and Passive. Volume 3-From Theory to Applications; Artech House Inc.: Norwood, MA, USA, 1986. [Google Scholar]
  69. Houston, W.; Mitchell, J.; Carrier, W., III. Lunar soil density and porosity. In Proceedings of the 5th Lunar Science Conference, Houston, TX, USA, 18–22 March 1974; Proceedings (A75-39540 19-91). Pergamon Press, Inc.: New York, NY, USA, 1974; Volume 5, pp. 2361–2364. [Google Scholar]
  70. Carrier, W.; Olhoeft, G.R.; Mendell, W. Physical Properties of the Lunar Surface. In Lunar Sourcebook, A User’s Guide to the Moon; Cambridge University Press: Cambridge, UK, 1991; pp. 475–594. [Google Scholar]
  71. Mitchell, J.; Houston, W.; Scott, R.; Costes, N.; Carrier, W., III; Bromwell, L. Mechanical properties of lunar soil: Density, porosity, cohesion and angle of internal friction. In Proceedings of the Lunar Science Conference, Houston, TX, USA, 10–13 January 1972; Volume 3, p. 3235. [Google Scholar]
  72. Wang, R.; Su, Y.; Ding, C.; Dai, S.; Liu, C.; Zhang, Z.; Hong, T.; Zhang, Q.; Li, C. A novel approach for permittivity estimation of lunar regolith using the lunar penetrating radar onboard Chang’E-4 rover. Remote Sens. 2021, 13, 3679. [Google Scholar] [CrossRef]
  73. Ding, C.; Xiao, Z.; Su, Y.; Cui, J. Hyperbolic reflectors determined from peak echoes of ground penetrating radar. Icarus 2021, 358, 114280. [Google Scholar] [CrossRef]
  74. Chen, R.; Xu, Y.; Xie, M.; Zhang, L.; Niu, S.; Bugiolacchi, R. Sub-surface stratification and dielectric permittivity distribution at the Chang’E-4 landing site revealed by the lunar penetrating radar. Astron. Astrophys. 2022, 664, A35. [Google Scholar] [CrossRef]
  75. Lv, W.; Zhang, J. High-resolution permittivity estimation of ground penetrating radar data by migration with isolated hyperbolic diffractions and local focusing analyses. Front. Astron. Space Sci. 2023, 10, 1188232. [Google Scholar] [CrossRef]
  76. Li, Q.; Yan, D.; Wu, W. Remote sensing image scene classification based on global self-attention module. Remote Sens. 2021, 13, 4542. [Google Scholar] [CrossRef]
  77. Dong, Z.; Feng, X.; Zhou, H.; Liu, C.; Zeng, Z.; Li, J.; Liang, W. Properties analysis of lunar regolith at Chang’E-4 landing site based on 3D velocity spectrum of lunar penetrating radar. Remote Sens. 2020, 12, 629. [Google Scholar] [CrossRef]
  78. Grimm, R.E.; Heggy, E.; Clifford, S.; Dinwiddie, C.; McGinnis, R.; Farrell, D. Absorption and scattering in ground-penetrating radar: Analysis of the Bishop Tuff. J. Geophys. Res. Planets 2006, 111, E06S02. [Google Scholar] [CrossRef]
  79. Strangway, D.; Pearce, G.; Olhoeft, G. Properties of Lunar Samples. In Proceedings of the The Soviet-American Conference on Cosmochemistry of the Moon and Planets, Moscow, Russia, 4–8 June 1974; Scientific and Technical Information Office, National Aeronautics and Space Administration: Washington, DC, USA, 1977; Volume 370, p. 417. [Google Scholar]
  80. Skolnik, M.I. Introduction to Radar Systems; McGraw Hill: New York, NY, USA, 1980. [Google Scholar]
  81. Lai, J.; Cui, F.; Xu, Y.; Liu, C.; Zhang, L. Dielectric properties of lunar materials at the Chang’e-4 landing site. Remote Sens. 2021, 13, 4056. [Google Scholar] [CrossRef]
  82. Quan, Y.; Harris, J.M. Seismic attenuation tomography using the frequency shift method. Geophysics 1997, 62, 895–905. [Google Scholar] [CrossRef]
  83. Irving, J.D.; Knight, R.J. Removal of wavelet dispersion from ground-penetrating radar data. Geophysics 2003, 68, 960–970. [Google Scholar] [CrossRef]
  84. Lauro, S.; Mattei, E.; Cosciotti, B.; Di Paolo, F.; Arcone, S.; Viccaro, M.; Pettinelli, E. Electromagnetic signal penetration in a planetary soil simulant: Estimated attenuation rates using GPR and TDR in volcanic deposits on Mount Etna. J. Geophys. Res. Planets 2017, 122, 1392–1404. [Google Scholar] [CrossRef]
  85. Turner, G.; Siggins, A.F. Constant Q attenuation of subsurface radar pulses. Geophysics 1994, 59, 1192–1200. [Google Scholar] [CrossRef]
  86. Liu, L.; Lane, J.W.; Quan, Y. Radar attenuation tomography using the centroid frequency downshift method. J. Appl. Geophys. 1998, 40, 105–116. [Google Scholar] [CrossRef]
  87. Zhang, C.; Ulrych, T.J. Estimation of quality factors from CMP records. Geophysics 2002, 67, 1542–1547. [Google Scholar] [CrossRef]
  88. Xing, S.G.; Su, Y.; Feng, J.Q.; Dai, S.; Xiao, Y.; Ding, C.Y.; Li, C.L. The penetrating depth analysis of Lunar Penetrating Radar onboard Chang’e-3 rover. Res. Astron. Astrophys. 2017, 17, 046. [Google Scholar] [CrossRef]
  89. Xiao, L.; Zhu, P.; Fang, G.; Xiao, Z.; Zou, Y.; Zhao, J.; Zhao, N.; Yuan, Y.; Qiao, L.; Zhang, X.; et al. A young multilayered terrane of the northern Mare Imbrium revealed by Chang’E-3 mission. Science 2015, 347, 1226–1229. [Google Scholar] [CrossRef] [PubMed]
  90. McKay, D.S.; Heiken, G.; Basu, A.; Blanford, G.; Simon, S.; Reedy, R.; French, B.M.; Papike, J. The lunar regolith. Lunar Sourceb. 1991, 567, 285–356. [Google Scholar]
  91. Solomon, S.C.; Comer, R.P.; Head, J.W. The evolution of impact basins: Viscous relaxation of topographic relief. J. Geophys. Res. Solid Earth 1982, 87, 3975–3992. [Google Scholar] [CrossRef]
  92. Wu, W.; Li, C.; Zuo, W.; Zhang, H.; Liu, J.; Wen, W.; Su, Y.; Ren, X.; Yan, J.; Yu, D.; et al. Lunar farside to be explored by Chang’e-4. Nat. Geosci. 2019, 12, 222–223. [Google Scholar] [CrossRef]
  93. Lin, H.; He, Z.; Yang, W.; Lin, Y.; Xu, R.; Zhang, C.; Zhu, M.H.; Chang, R.; Zhang, J.; Li, C.; et al. Olivine-norite rock detected by the lunar rover Yutu-2 likely crystallized from the SPA-impact melt pool. Natl. Sci. Rev. 2020, 7, 913–920. [Google Scholar] [CrossRef]
  94. Lin, H.; Lin, Y.; Yang, W.; He, Z.; Hu, S.; Wei, Y.; Xu, R.; Zhang, J.; Liu, X.; Yang, J.; et al. New insight into lunar regolith-forming processes by the lunar rover Yutu-2. Geophys. Res. Lett. 2020, 47, e2020GL087949. [Google Scholar] [CrossRef]
  95. Zhang, L.; Xu, Y.; Bugiolacchi, R.; Hu, B.; Liu, C.; Lai, J.; Zeng, Z.; Huo, Z. Rock abundance and evolution of the shallow stratum on Chang’e-4 landing site unveiled by lunar penetrating radar data. Earth Planet. Sci. Lett. 2021, 564, 116912. [Google Scholar] [CrossRef]
  96. Zhou, H.; Feng, X.; Ding, C.; Dong, Z.; Liu, C.; Zhang, Y.; Meng, Z. Yutu-2 radar sounding evidence of a buried crater at Chang’E-4 landing site. IEEE Trans. Geosci. Remote Sens. 2021, 60, 1–19. [Google Scholar] [CrossRef]
  97. Di, K.; Zhu, M.H.; Yue, Z.; Lin, Y.; Wan, W.; Liu, Z.; Gou, S.; Liu, B.; Peng, M.; Wang, Y.; et al. Topographic evolution of Von Kármán crater revealed by the lunar rover Yutu-2. Geophys. Res. Lett. 2019, 46, 12764–12770. [Google Scholar] [CrossRef]
  98. Li, Q.L.; Zhou, Q.; Liu, Y.; Xiao, Z.; Lin, Y.; Li, J.H.; Ma, H.X.; Tang, G.Q.; Guo, S.; Tang, X.; et al. Two-billion-year-old volcanism on the Moon from Chang’e-5 basalts. Nature 2021, 600, 54–58. [Google Scholar] [CrossRef] [PubMed]
  99. Head, J.W., III. Lunar volcanism in space and time. Rev. Geophys. 1976, 14, 265–300. [Google Scholar] [CrossRef]
  100. Head, J.; Adams, J.; McCord, T.; Pieters, C.; Zisk, S. Regional stratigraphy and geologic history of Mare Crisium. In Proceedings of the Mare Crisium: The View from Luna 24, Houston, TX, USA, 1–3 December 1977; pp. 43–74. [Google Scholar]
  101. Sauro, F.; Pozzobon, R.; Massironi, M.; De Berardinis, P.; Santagata, T.; De Waele, J. Lava tubes on Earth, Moon and Mars: A review on their size and morphology revealed by comparative planetology. Earth-Sci. Rev. 2020, 209, 103288. [Google Scholar] [CrossRef]
  102. Horz, F. Lava tubes-potential shelters for habitats. In Lunar Bases and Space Activities of the 21st Century; Lunar and Planetary Institute: Houston, TX, USA, 1985; pp. 405–412. [Google Scholar]
  103. Qiu, X.; Ding, C. Radar Observation of the Lava Tubes on the Moon and Mars. Remote Sens. 2023, 15, 2850. [Google Scholar] [CrossRef]
  104. Ding, C.; Xiao, Z.; Su, Y. A potential subsurface cavity in the continuous ejecta deposits of the Ziwei crater discovered by the Chang’E-3 mission. Earth Planets Space 2021, 73, 1–12. [Google Scholar] [CrossRef]
  105. Ding, C.; Liu, K.; Huang, S.; Su, Y.; Li, J. Application of microwave radar in Chang’e lunar exploration project. Acta Geol. Sin. 2021, 95, 2805–2822. [Google Scholar]
  106. Wilhelms, D.E.; Howard, K.A.; Wilshire, H.G. Geologic Map of the South Side of the Moon; Department of the Interior, US Geological Survey: Reston, VA, USA, 1979.
Figure 3. (a) Image result of low-frequency data. (b) Structure of the first 300 m of the Moon at the landing site [49].
Universe 09 00461 g003
Figure 4. ATA diagram of the low-frequency LPR signal, adopted from Zhang et al. [56]. (a) Comparison of the ATA plots between the low-frequency LPR data. The ATA curves were computed from the raw low-frequency LPR data acquired by CE-3 along its ∼114 m long track (blue line) and by CE-4 (red line). (b) The ATA plots after subtracting the background.
Universe 09 00461 g004
Figure 5. (a) Illustration of the time-delay measurement with a dual-antenna receiver, adopted from Xing and Su [58]. (b) Schematic diagram of time-delay measurement to inverse the dielectric constant of the lunar regolith, adopted from Zhang et al. [59]. (c) Schematic diagram of the hyperbola fitting method, adopted from Ding et al. [28]. Two of the blue triangles represent the receiving and transmitting antenna of the LPR. The blue circle represents the scattering source of the buried rock. Parameter x refers to the detection position of the LPR, and parameter x 0 refers to the horizontal coordinates corresponding to the scattering source. Parameter h refers to the vertical depth corresponding to the scattering source, and parameter z refers to the propagation distance of the radar wave.
Universe 09 00461 g005
Figure 8. The loss tangent of the lunar subsurface material calculated by the frequency shift method, adopted from Ding et al. [60]. (a) The rewritten image of the distribution diagram of loss tangent, detection depth, and dielectric constant is given by Xing et al. [88]. Its corresponding penetration depth is 12.5–15.7 m, which is consistent with the penetration depth estimated by Xiao et al. [89]. (b) The estimated content of TiO 2 + FeO from the navigation points N105 to N208 along the traveling route of Yutu rover.
Universe 09 00461 g008
Figure 9. Small crater captured by the Yutu rover, where the tracks of the wheels have been indicated by white arrows, adopted from Ding et al. [20]. (a) Many fragments within and around the small crater. The crater has concentric walls, and it has high–reflectance materials in the central crater. (b) High–resolution DTM was constructed using the shape–from–shading (SfS) method for the small crater. (c) Shade relief map of the small crater and its surroundings. (d) Enlarged view of the white rectangular box area in panel (a). It can be clearly seen that the edge of the fragments is sharp, similar to ejecta. (e) The topographic graph for the small crater.
Universe 09 00461 g009
Figure 10. High-frequency radar identification of stratigraphic structures, adopted from Zhang et al. [95]. (a) Energy distribution of high-frequency LPR data during the first 20 lunar days. (b) Geological stratification based on energy distribution.
Universe 09 00461 g010
Figure 11. Development of shallow lunar regolith in the landing area of Yutu-2, adopted from Zhou et al. [96]. (a) Formation of crater C1. (b) Finsen crater’s ejecta covers Crater C1. (c) Continuous weathering impacts to form of the present lunar regolith.
Universe 09 00461 g011
Figure 12. Buried cavity within the Ziwei crater, adopted from Ding et al. [104].
Universe 09 00461 g012
Figure 13. The subsurface structure’s evolution process schematic diagram at the CE–4 landing site, adopted from Ding et al. [15]. (a) Basalt flows at the floor of the Von Kármán crater. (b) Ejecta from the Orientale Basin. (c) Buried cavity–lava flow. (d) Finsen crater ejecta. (e) Weathered fine–grained lunar regolith.
Universe 09 00461 g013
Figure 14. The radar image of CE–4 high–frequency LPR data within in first 1000 m, adopted from Feng et al. [49]. In the diagram, the color refers to the strength of the received signal. As what the color bar shows in the lower left corner, the signal is stronger as it becomes closer to red. (a) Radargram of the first 500 m in the horizontal direction. (b) Radargram of 500~1000 m in the horizontal direction.
Universe 09 00461 g014
Disclaimer/Publisher’s Note: The statements, opinions and data contained in all publications are solely those of the individual author(s) and contributor(s) and not of MDPI and/or the editor(s). MDPI and/or the editor(s) disclaim responsibility for any injury to people or property resulting from any ideas, methods, instructions or products referred to in the content.

