1. Introduction
There is great importance and interest in investigating the properties of the short-lived and deconfined state of almost-free quarks and gluons, called quark–gluon plasma (QGP), which can be produced in high-energy nucleus–nucleus collisions. It is believed that the universe was in a state of QGP a few microseconds after the so-called Big Bang, considered to be the starting point in the birth of our universe. The striking evidence about the creation of QGP in high-energy heavy-ion collisions was reported in early works seen in Refs. [
1,
2,
3,
4,
5,
6,
7,
8,
9]. It was found that the produced QGP was characterized by a fluid-like behavior with low viscosity. The modern experiments on high-energy heavy ions as well as proton–proton collisions at the RHIC (Relativistic heavy-ion collider, Brookhaven National Laboratory (BNL), Upton, NY, USA) and LHC (Large hadron collider, CERN, Switzerland) produce and measure tens of millions of collisions for the large HEP (high energy physics) community of scientists from around the world to analyze, and reveal various collective properties of the hot and dense matter, which has a very short lifetime of the order of 10
−23 s. Naturally, the properties of the created QGP and swiftly expanding matter found afterwards are deduced from the analysis of the kinematical characteristics of the final particles reaching the detectors with the help of the theoretical and phenomenological approaches, including those based on thermal and hydrodynamic models, and various models of extensive and non-extensive statistics. The hot and dense matter swiftly expands right after QGP’s creation, and it passes through the subsequent chemical and kinetic freeze-out stages, which fix the content of particle species and the final momenta of these particles, respectively. The large statistics, expressed by the huge number of particles produced in high-energy heavy-ion, and proton–proton collisions in the modern collider experiments, justifies the use of various statistical models and approaches for the HEP data analysis.
The chemical freeze-out parameters, such as the temperature
Tch and the baryochemical potential
μb at the moment of chemical freeze-out are extracted by performing fits of the particle abundancies and their ratios with the thermal, statistical hadronization models [
10,
11,
12,
13,
14,
15]. The kinetic freeze-out parameters, such as the transverse flow velocity and the corresponding temperature at the moment of kinetic freeze-out, are obtained [
10,
16,
17,
18,
19,
20,
21,
22,
23,
24,
25,
26,
27,
28,
29,
30,
31,
32,
33] from fitting the transverse momentum (
) distributions of particles with the help of various theoretical and phenomenological model functions, including the hydro-inspired blast-wave models.
The non-extensive statistical distributions, particularly various forms of non-extensive Tsallis distribution functions, have been widely used to describe the
distributions of particles in high-energy collisions [
34,
35,
36,
37,
38,
39,
40,
41,
42,
43,
44,
45,
46,
47,
48]. Different kinds of Tsallis functions were extremely successful in describing the
spectra of particles in high-energy proton–proton collisions up to the highest
values measured at the RHIC and LHC experiments. The advantage of using the Tsallis distribution function is in its connection, via entropy, to thermodynamics [
43], which is not the case with many other power law distributions. The important parameters of the Tsallis distribution function are the effective temperature (
T) and the non-extensivity parameter
q, which measures the degree of deviation of
distribution from the exponential Boltzmann–Gibbs distribution. The
q parameter is also said to characterize the degree of non-thermalization or non-equilibrium of the system [
47]. Furthermore, the parameters
q and
T of the Tsallis function can be employed to identify the system size scaling and initial conditions [
49]. Due to the effective temperature containing the contribution of both the chaotic thermal motion and transverse radial flow, the transverse flow should be embedded into the Tsallis distribution function in order to disentangle these two effects. For the description of the
spectra of particles in high-energy heavy-ion collisions, different transverse expansion models are embedded into Tsallis statistics. To extract the kinetic freeze-out temperature and transverse flow velocity, different model functions have been used [
10,
16,
17,
18,
19,
20,
21,
22,
23,
24,
25,
26,
27,
28,
29,
30,
31,
32,
33]: the Blast-Wave model with Boltzmann–Gibbs statistics (the BGBW model), the Blast-Wave model with Tsallis statistics (the TBW model), the improved Tsallis distribution with flow effect, Hagedorn formula with the embedded transverse flow, and recently [
18,
33], the Tsallis distribution function with included transverse flow.
The majority of works devoted to the analysis of
spectra of particles produced in high-energy collisions with the help of various theoretical model functions, including Tsallis function and its modified forms, have separately fitted the
distribution of each particle type in a given collision. As mentioned in Refs. [
16,
19,
22,
28,
29], it is not possible to extract the collective properties of a system, such as kinetic freeze-out temperature or transverse flow velocity, from separate fits to the
spectrum of each particle type. Only the theoretical model fits applied simultaneously to
spectra of different particle species by assigning, for example, the transverse flow velocity and temperature as the common (global) fitted parameters for all particle types can yield the meaningful physical parameters of the studied collision system [
16,
19,
22,
28,
29]. The collective parameters of the systems produced in high-energy collisions have been extracted and analyzed successfully by applying simultaneous (combined) model fits with just few parameters in Refs. [
10,
16,
17,
18,
19,
22,
27,
28,
29,
48].
This study continues from our recent papers [
17,
18,
19,
33] devoted to analysis, applying simultaneous theoretical model fits, of the centrality dependencies of transverse momentum spectra of the charged pions, kaons, protons, and antiprotons produced in high-energy proton–proton, Xe + Xe, and Pb + Pb collisions at the LHC, measured by ALICE Collaboration. Since the pions, kaons, and (anti)protons represent the largest predominant part of the final particles coming from high-energy proton–proton and heavy-ion collisions, we believe that the simultaneous analysis of these particle species can reveal the collective properties of the system produced in these collisions. In Refs. [
17,
19] we investigated the dependencies of midrapidity
spectra of the charged pions, kaons, protons, and antiprotons on charged-particle multiplicity density (<
dNch/
dη>) in proton–proton collisions at
= 7 and 13 TeV, respectively. The combined minimum
χ2 fits with the thermodynamically consistent Tsallis function and Hagedorn function with transverse flow could quite well reproduce the
distributions of the particle species in the analyzed groups of <
dNch/
dη> in proton–proton collisions at
= 7 and 13 TeV [
17,
19]. From the analysis of the <
dNch/
dη> dependencies of the extracted kinetic freeze-out temperature,
T0, and average transverse flow velocity,
, it was estimated that the probable onset of the deconfinement phase transition in proton–proton collisions at
= 7 and 13 TeV occurs at <
dNch/
dη> ≈ 6.1 ± 0.3 [
17] and <
dNch/
dη> ≈ 7.1 ± 0.2 [
19], respectively. These estimates proved to be consistent with the calculations of Campanini in Refs. [
50,
51,
52], made using a completely different method for high-energy proton–proton collisions, and theoretical predictions [
52] in case of crossover transition from hadronic gas to the QGP phase starting at (
dNch/
dη) ≈ 6. The <
dNch/
dη> dependence of the effective temperature
T of the Tsallis function with thermodynamical consistence in proton–proton collisions at both
= 7 and 13 TeV was described quite well by the simple power function,
, with the same (≈1/3) exponent parameter [
17,
19].
In Refs. [
18,
33] we studied the dependencies of midrapidity
spectra of the charged pions, kaons, protons, and antiprotons, measured by ALICE Collaboration, on the average number of participant nucleons,
, in Xe+Xe collisions at
= 5.44 TeV and Pb + Pb collisions at
= 5.02 TeV, respectively. The combined minimum
χ2 fits with thermodynamically consistent and non-consistent Tsallis function with embedded transverse flow could describe quite well the
distributions of the studied particle species in various collision centralities, defined by
, in Xe + Xe and Pb + Pb collisions at
= 5.44 TeV and 5.02 TeV, respectively. From the analysis of the
dependencies of the extracted kinetic freeze-out temperature,
T0, and average transverse flow velocity,
, it was deduced that
≈ 44 ± 5 [
18] and
≈ 71 ± 7 [
33] could be the threshold border values of collision centrality for a crossover transition from a dense hadronic state to the QGP phase (or mixed phase of QGP and hadrons) in Xe + Xe and Pb + Pb collisions at
= 5.44 TeV and 5.02 TeV, respectively.
The present work is devoted to the analysis of midrapidity transverse momentum spectra of the charged pions, kaons, protons, and antiprotons at various centralities of Pb + Pb collisions at
= 2.76 TeV, measured by ALICE Collaboration [
16]. We will implement the simultaneous minimum
χ2 model fits of the experimental midrapidity
pt distributions of the analyzed particle species in Pb + Pb collisions at
= 2.76 TeV, using thermodynamically consistent as well as non-consistent Tsallis distribution functions with embedded transverse flow, as it was performed in our recent works [
18,
33] to analyze the midrapidity
spectra of the same particle species in Xe + Xe and Pb + Pb collisions at
= 5.44 TeV and 5.02 TeV, respectively. This will allow us to directly compare these three collision systems in order to find new regularities in the collision centrality and energy dependencies of the extracted system parameters.
2. The Data and Models
In this paper, we analyze the transverse momentum distributions of the charged pions, kaons, protons, and antiprotons produced at midrapidity (|
y| < 0.5) at 10 centrality intervals in Pb + Pb collisions at
= 2.76 TeV, measured by ALICE Collaboration and presented in Ref. [
16]. The
ranges measured by ALICE Collaboration have been as follows: [0.1–3.0] GeV/
c for
+
, [0.2–3.0] GeV/
c for
+
, and [0.3–4.6] GeV/
c for
p +
. The averages of the number of participant nucleons (
) and charged-particle (pseudo-rapidity) multiplicity density (
) calculated [
16,
53] using the Glauber–Monte Carlo model in the analyzed ten centrality groups of Pb + Pb collisions at
= 2.76 TeV are shown in
Table 1.
There are several modifications [
27,
38,
39,
43,
44,
45,
46,
54,
55] of the Tsallis distribution function, which provide comparably equal quality of fits of
distributions of particles produced in high-energy collisions. One of the simple variants [
45] of Tsallis function is represented at midrapidity (mid-
y) (<
y> = 0) as:
where
C is the normalization constant,
Nev—is the total number of the inelastic events,
is the transverse mass (energy), and
—the rest mass of a hadron. The parameter
T is the effective temperature, and
q is the non-extensivity parameter. We call this function in Equation (1) the thermodynamically non-consistent Tsallis distribution or simple (non-consistent) Tsallis function in the present work. The
q is an important parameter, which accounts for the deviation of the
distribution from the exponential Boltzmann–Gibbs distribution. At the limit
q → 1, the Tsallis function reduces to the exponential, or equilibrated, Boltzmann–Gibbs distribution. The closer the parameter
q is to one (1), the more equilibrated and thermalized the system is.
The following version [
38,
43,
44,
45] of the Tsallis distribution derived at zero chemical potential (
μ is approximately zero at the highest (TeV range) collision energies at the LHC) at mid-
y satisfies the thermodynamical expressions for the particle number, temperature, pressure, entropy, and energy densities:
which we call a Tsallis function with thermodynamical consistence or (thermodynamically) consistent Tsallis function (distribution) in the present work. In Ref. [
38] the proof of the thermodynamical consistence of the function in Equation (2) was presented. The fitting constant,
, is thought to be related linearly to the volume (
V) of the system [
38,
43] via the relation
Cq =
gV/(2
π)
3, with
g denoting the degeneracy factor. The degeneracy factor
g is equal to two, three, or four for protons, pions, and kaons, respectively.
The effective temperature parameter T in Equations (1) and (2) contains the contribution of both the chaotic thermal motion and transverse flow. As already mentioned, the transverse flow velocity is incorporated into the Tsallis function in order to disentangle these two effects.
In Refs. [
17,
19,
27,
28,
29,
48] the transverse expansion velocity has been embedded into a QCD-inspired Hagedorn function,
, by substituting
and implementing the Lorentz transformation
to arrive, finally, at the Hagedorn function with (embedded) transverse flow:
Here,
is the normalization constant,
, and
is the average transverse flow velocity;
T0 estimates the kinetic freeze-out temperature, and
is the free parameter. The substitution
, applied to derive Equation (3), denotes simply the Lorentz transformation to a system co-moving with the average flow velocity,
, of particles in the transverse plane assuming the existence of such a flow of particles in this co-moving frame [
27]. The
distributions of particles in proton+proton and heavy-ion collisions at the RHIC and LHC were reproduced quite well [
17,
19,
27,
28,
29,
48] by the combined fits with the Hagedorn function with transverse flow (Equation (3)), and the extracted parameters could be interpreted physically.
To describe midrapidity
distributions of identified charged particles in various centralities of Pb + Pb collisions at
= 2.76 TeV in the present work, we incorporate the transverse flow velocity into the Tsallis function in Equation (1) by implementing, as was performed for the first time in Ref. [
18], the Lorentz transformation
:
which we call the non-consistent or simple Tsallis function with transverse flow in present analysis.
Similarly, we embed the transverse flow into Tsallis distribution with thermodynamical consistence in Equation (2) by substituting
to obtain [
18] the function
which we call a thermodynamically consistent or consistent Tsallis function with transverse flow in present analysis.
The combined (simultaneous) fits by the model functions in Equations (4) and (5) of midrapidity
distributions of the analyzed particle species in each centrality group have been performed with the help of Nonlinear Curve Fitting of the Origin 9.1 Graphing and Data Analysis Software. During the combined fitting procedures, the parameters
T0 and
have been the common (shared) system parameters for the analyzed particle species. The error bars of the experimental data points, shown in the figures, represent the combined statistical and systematic errors (added in quadrature). These combined errors are mostly defined by the systematic ones with negligible statistical uncertainties. The details on the calculation of the systematic errors are given in Ref. [
16]. The combined errors have been used to define the weights (1/(error)
2) of the data points during the minimum
χ2 fitting procedures. The
intervals measured by ALICE Collaboration in Pb + Pb collisions at
= 2.76 TeV are [
16]: [0.1–3.0] GeV/
c for
+
, [0.2–3.0] GeV/
c for
+
, and [0.3–4.6] GeV/
c for
p +
. The region
< 0.5 GeV/
c in pion spectra is excluded from the fitting procedures, as done previously in Refs. [
16,
17,
18,
19,
22,
28,
29,
33,
48], due to the significant contribution to pion production from the decays of baryon resonances in this range. Hence, in the present work we use the following
intervals for combined minimum
χ2 fits with the model functions in Equations (4) and (5): [0.5–3.0] GeV/
c for
+
, [0.2–3.0] GeV/
c for
+
, and [0.3–4.6] GeV/
c for
p +
.
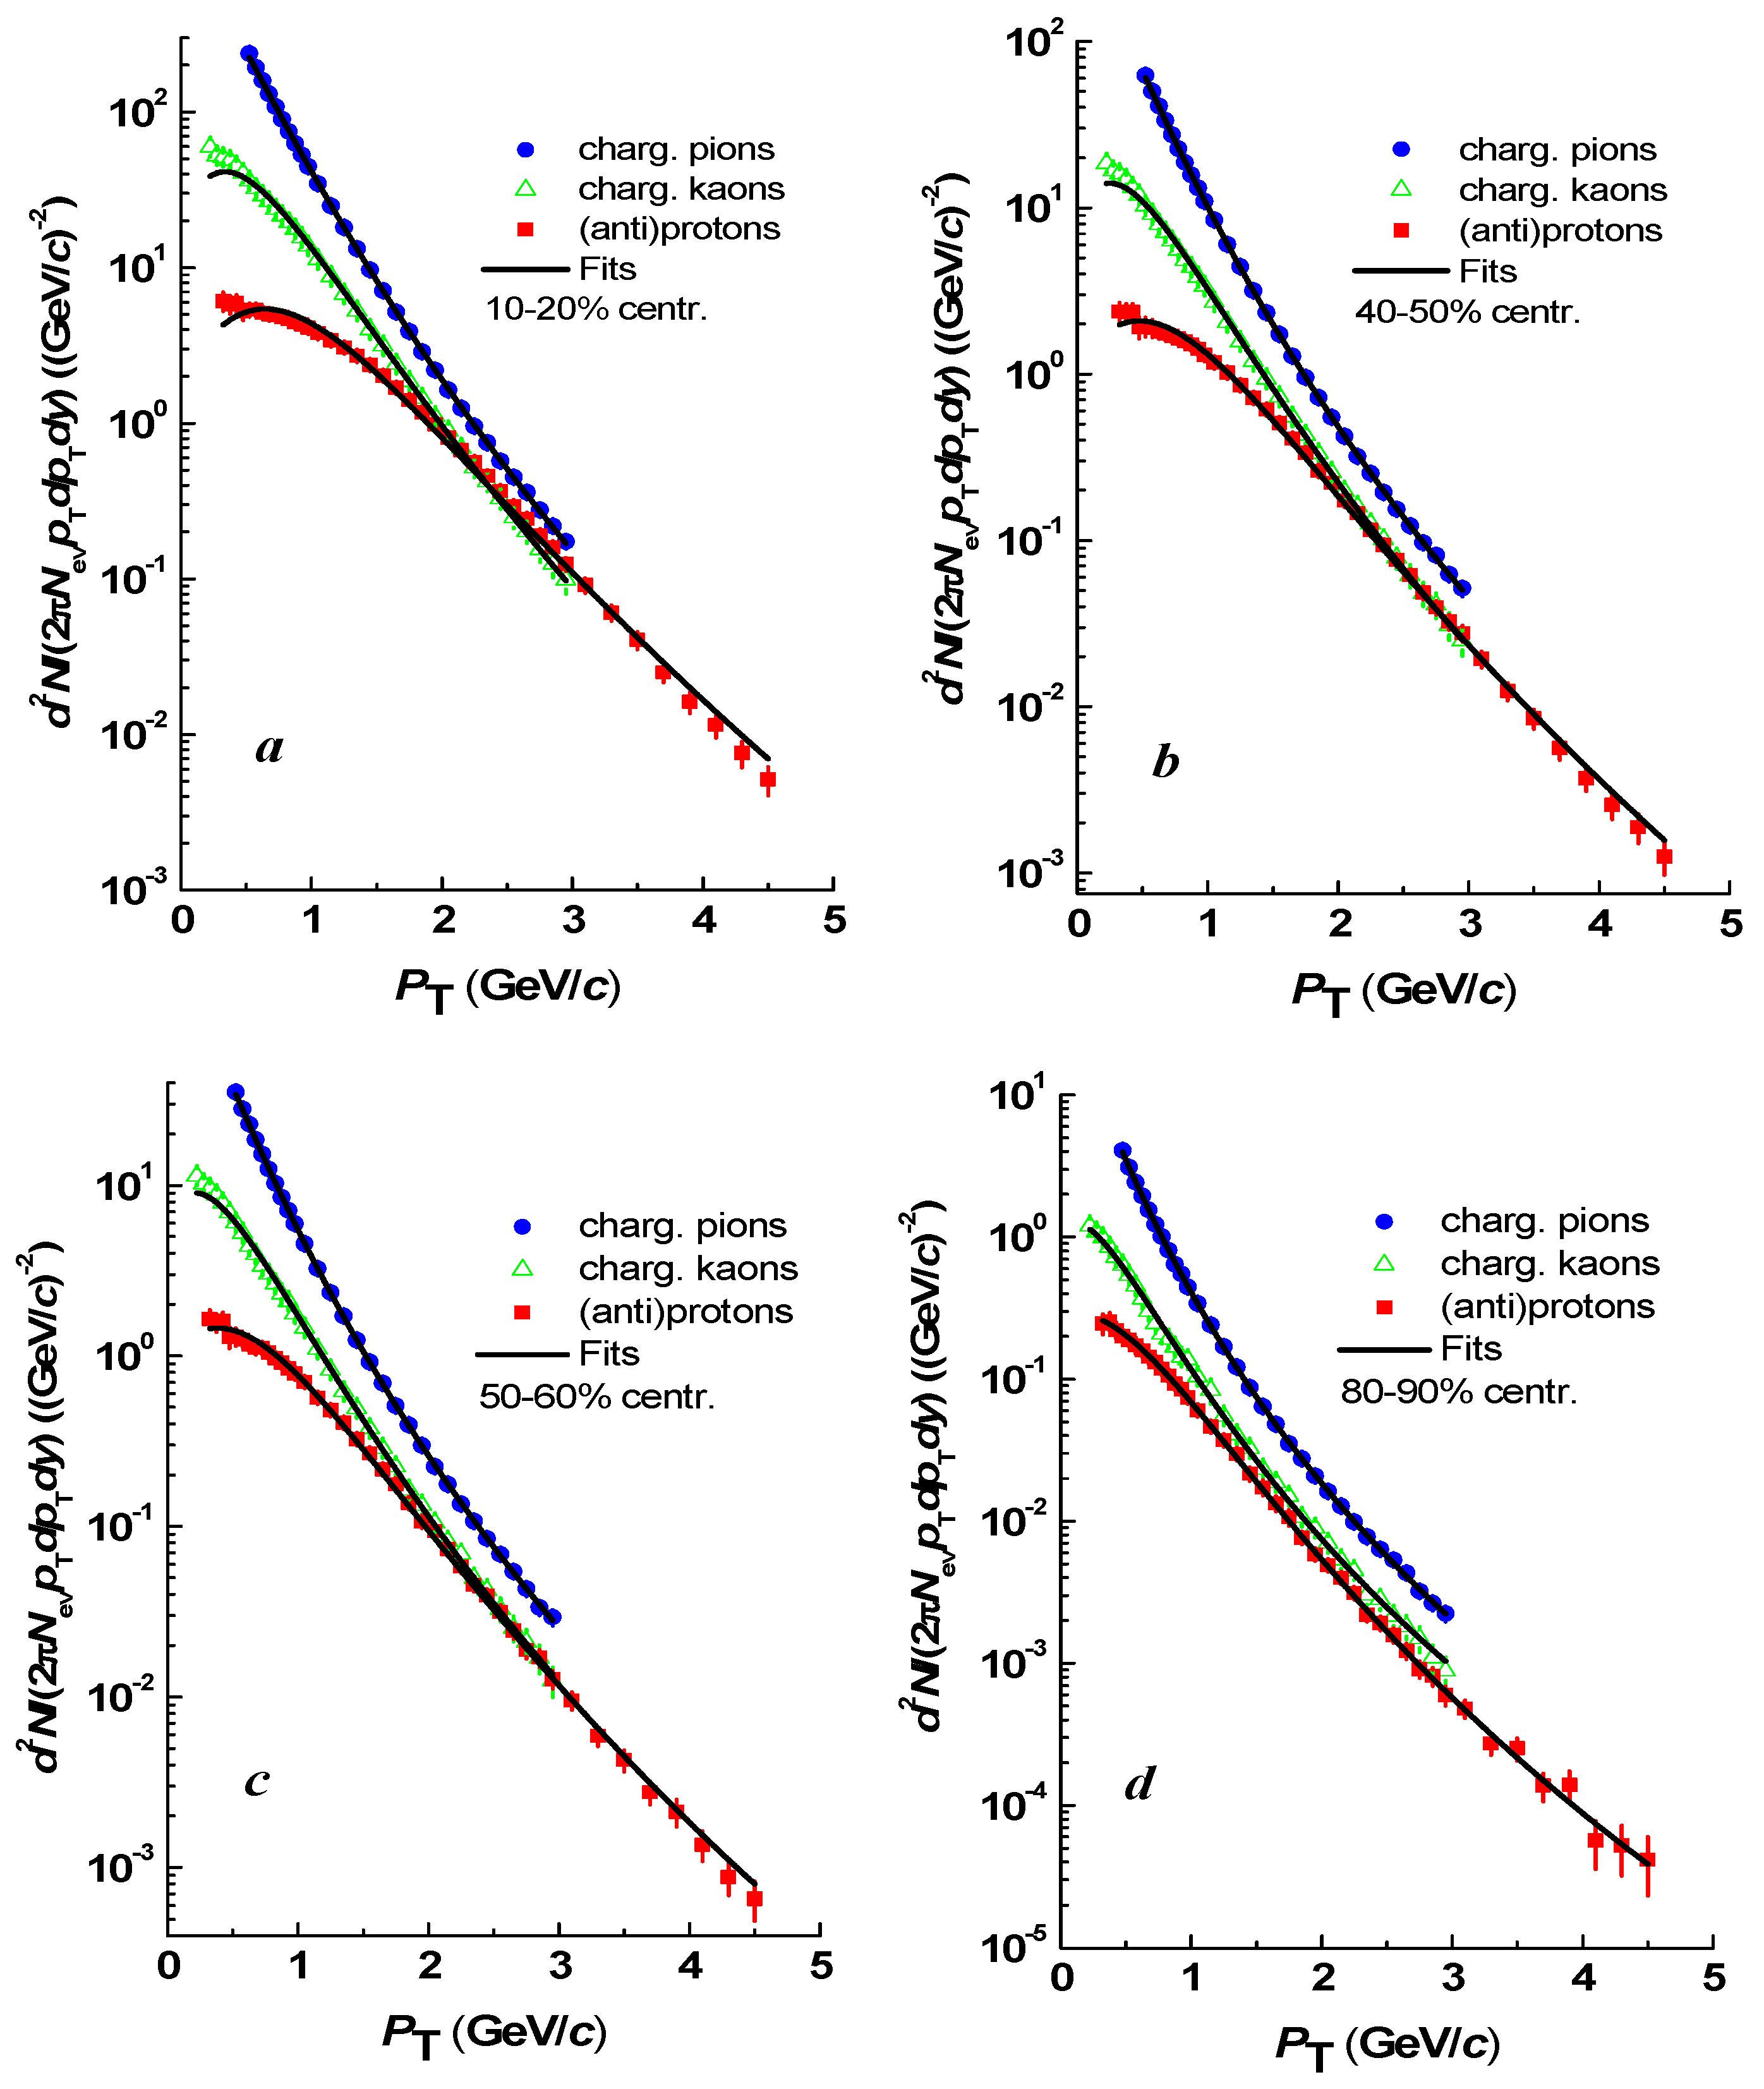
3. Analysis and Results
The results obtained from combined minimum
fitting procedures using thermodynamically consistent and non-consistent Tsallis functions with transverse flow (functions in Equations (5) and (4), respectively) are presented in
Table 2 and
Table 3, respectively. To show the quality of the combined fits with the functions in Equations (5) and (4), the experimental midrapidity transverse momentum distributions of the studied particle species in four centrality classes of Pb + Pb collisions at
= 2.76 TeV, along with the resulting fit curves, are shown in
Figure 1 and
Figure 2, respectively. As seen from
Figure 1 and
Figure 2 and
values in
Table 2 and
Table 3, the combined fits by both thermodynamically consistent and non-consistent Tsallis functions with transverse flow reproduce quite well the experimental midrapidity
pT distributions of the charged pions, kaons, and (anti)protons in 10 centrality groups of Pb + Pb collisions at
= 2.76 TeV.
The
values in
Table 3 are slightly smaller than the corresponding values in
Table 2, implying that, mathematically, the quality of the fits performed by non-consistent Tsallis function with transverse flow (Equation (4)) are slightly better than those performed by thermodynamically consistent Tsallis function with transverse flow (Equation (5)). However, from the physics perspective, it is preferable to use the thermodynamically consistent Tsallis function with transverse flow, because all the thermodynamic relations (those for the pressure, temperature, and particle and entropy densities) resulting from the first and second laws of thermodynamics are satisfied [
38,
43,
44] by the thermodynamically consistent Tsallis function. Therefore, one can consider the temperature parameter
T in the thermodynamically consistent Tsallis function [
38] as being a true thermodynamic quantity.
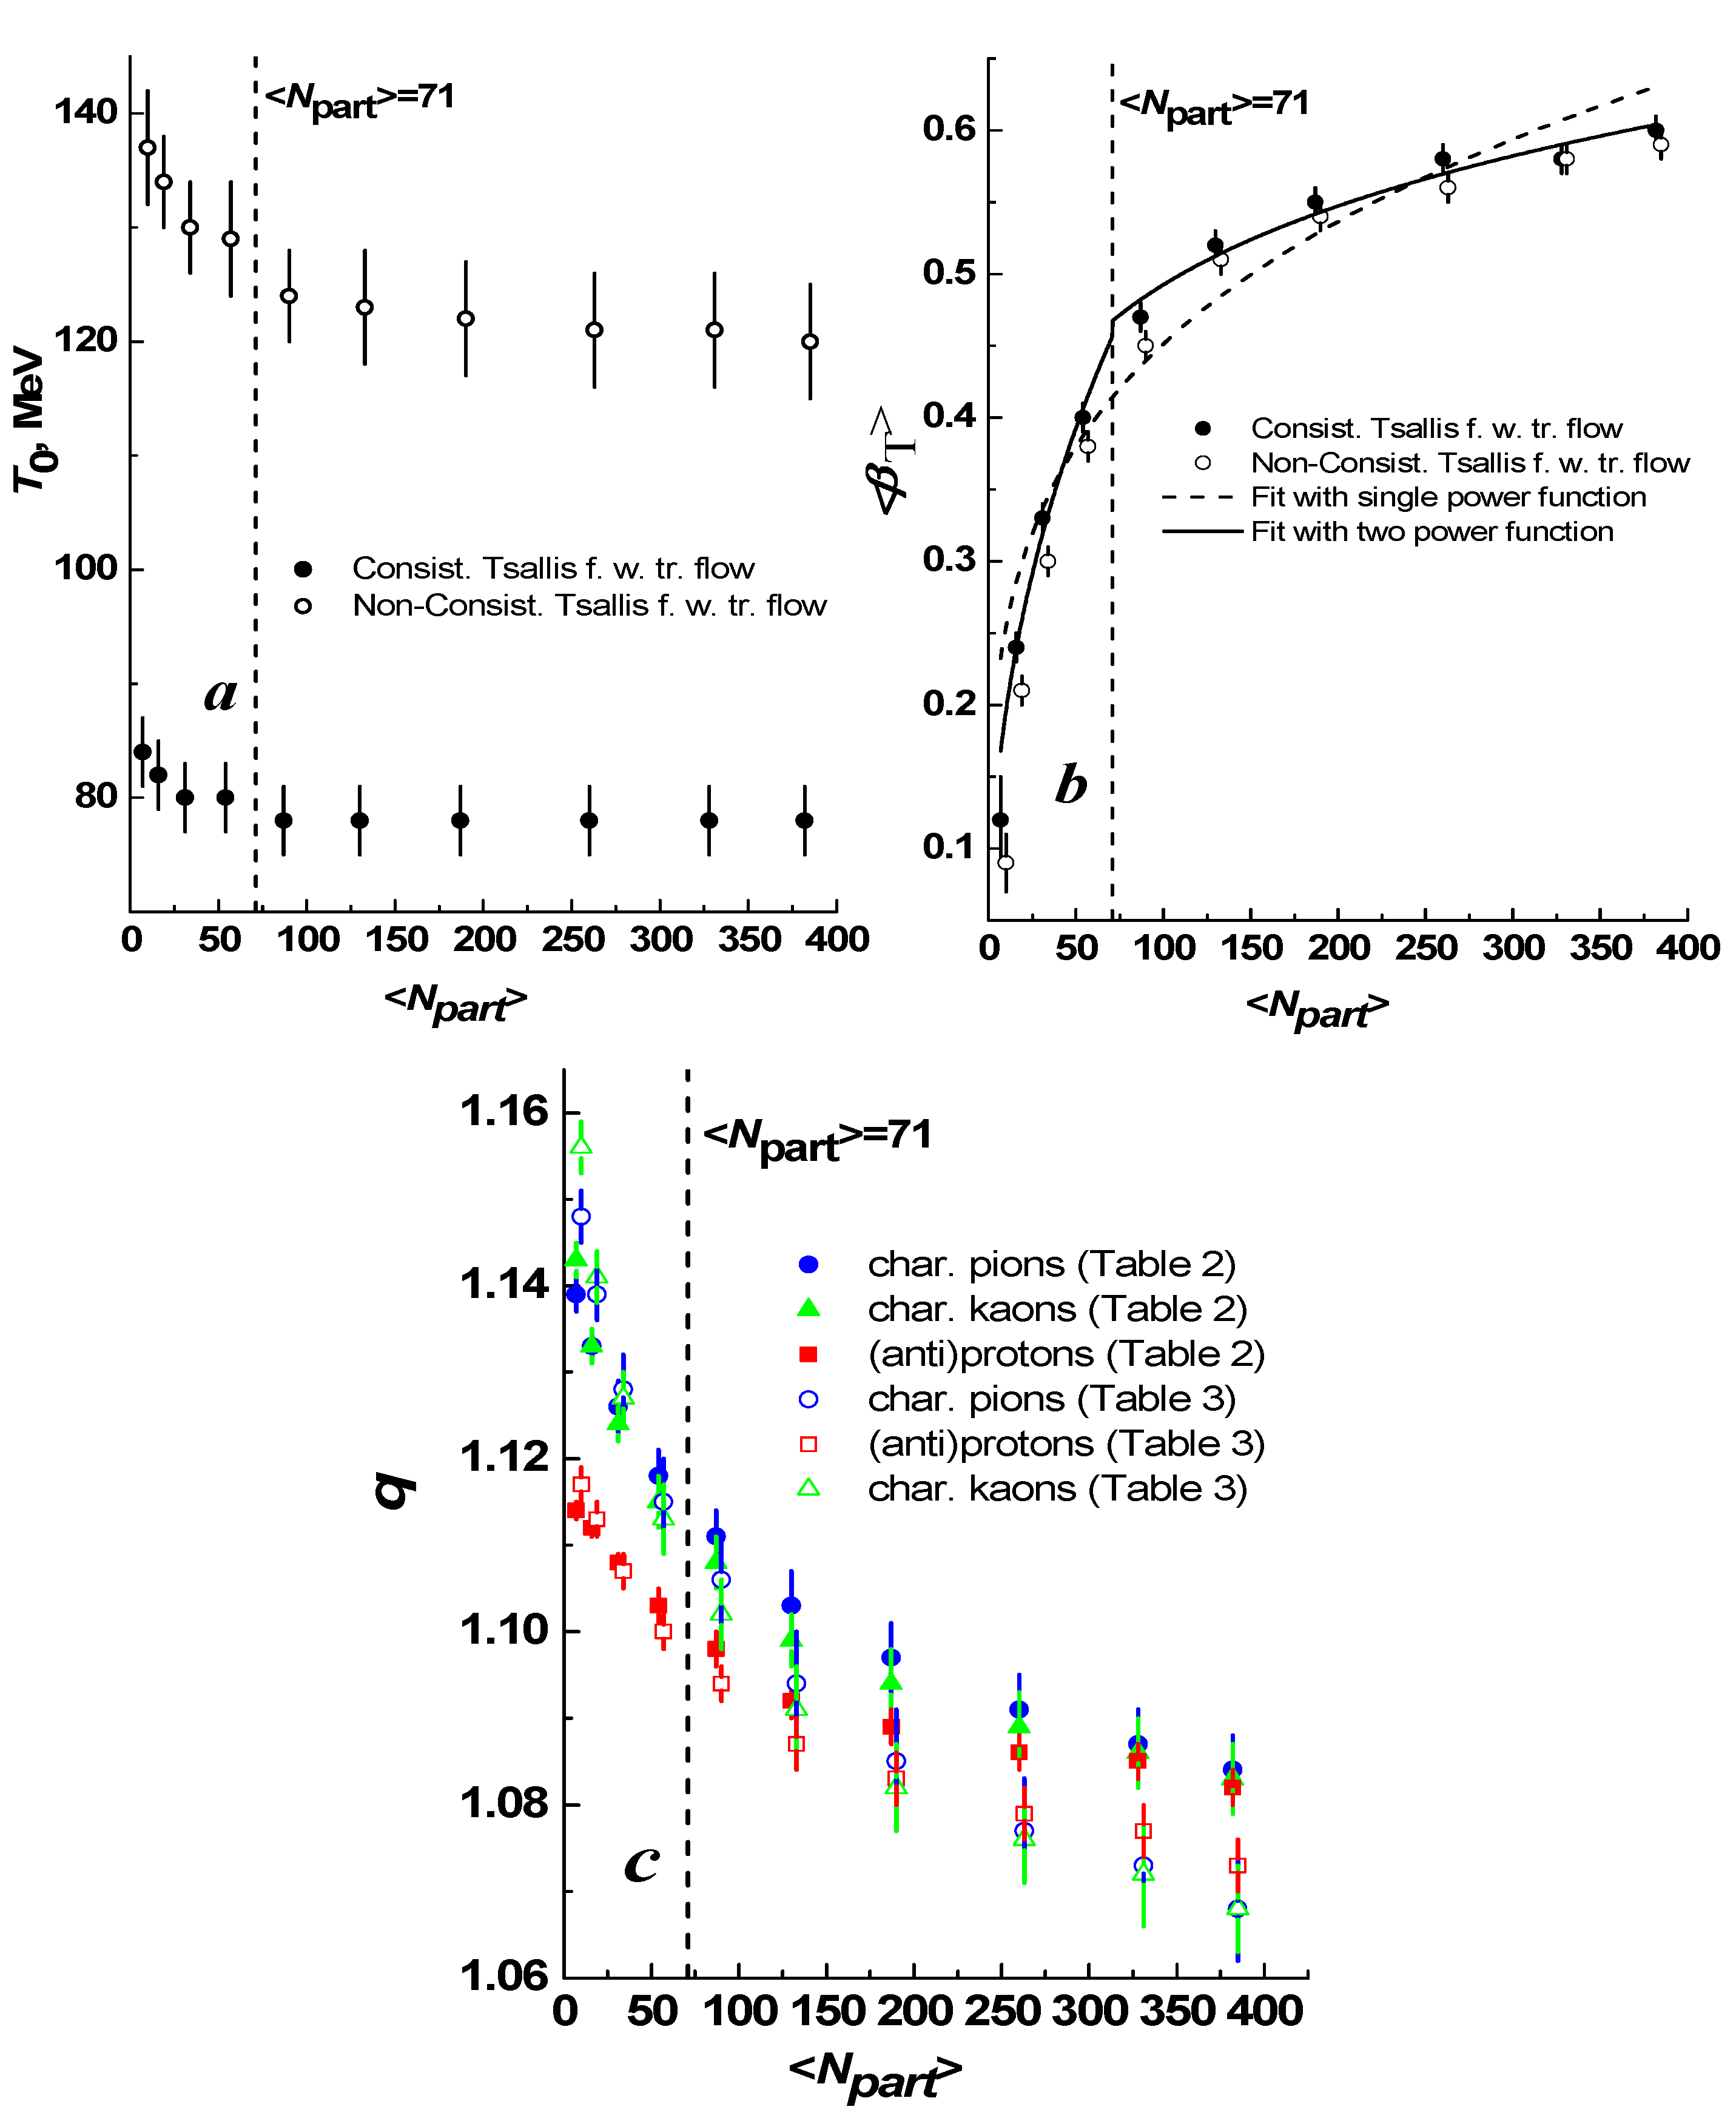
To visualize and analyze the
dependencies of the parameters, the dependencies of
q,
T0, and 〈
βT〉 on the average number of the participant nucleons, obtained from minimum
fits by thermodynamically consistent as well as non-consistent Tsallis function with transverse flow and given in
Table 2 and
Table 3, are shown in
Figure 3.
As seen from
Figure 3a, the shapes of
T0 versus
dependencies are similar in case of fits by both thermodynamically consistent as well as non-consistent Tsallis function with transverse flow. At the same time, the absolute values of
T0 are consistently smaller in case of fits by the function in Equation (5), compared to those by the function in Equation (4), which is obviously due to the extra
factor in Equation (5) as compared to Equation (4). As observed from
Figure 3a, the
T0 values decrease with increasing
in region
< 71 and remain constant in region
> 71. Additionally, as seen from
Figure 3b, the parameter 〈
βT〉 shows significantly differing growth rates with increasing
in these two regions: a relatively higher increase rate in region
< 71 and a smaller one in region
> 71. The border
= 71 ± 5 between these two distinct regions was estimated as the middle value of
between the fourth and fifth points on
Figure 3a, corresponding to the 50–60% and 40–50% centrality groups in
Table 1. The corresponding border value
= 205 ± 15 was calculated as the middle between the
values for 50–60% and 40–50% centrality in
Table 1. Analogously the corresponding border value of transverse flow velocity
= 0.44 ± 0.02 was estimated as the middle between the extracted
values for 50–60% and 40–50% centrality in
Table 2. To quantify the different growth rates of 〈
βT〉 in regions
< 71 and
> 71, we have fitted the 〈
βT〉 versus
dependence in
Figure 3b, obtained from fitting with thermodynamically consistent Tsallis functions with transverse flow,
where
is the Heaviside function (
if
t < 0, and
if
t > 0),
A1 and
A2—fitting (normalization) constants, and
α1 and
α2 are exponent parameters. The parameters of minimum
fits with the functions in Equations (6) and (7) of
versus
dependence in
Figure 3b, obtained using a consistent Tsallis function with transverse flow, are given in
Table 4. As seen in
Table 4 and
Figure 3b, the two-power function in Equation (7) fits the 〈
βT〉 versus
dependence quite well, while the single-power function in Equation (6) fails to fit this dependence.
The obtained significantly different behavior of 〈
βT〉 versus
in regions
< 71 and
> 71 with the temperature parameter becoming constant in region
> 71 could indicate that
= 71 ± 5 (corresponding to
= 205 ± 15) is a border value of collision centrality for a crossover phase transition from the dense hadronic state to that of the QGP state (or mixed state of QGP and hadrons) in Pb + Pb collisions at
= 2.76 TeV. It is important to note that the similar behaviors of 〈
βT〉 versus
as well as
T0 versus 〈
βT〉 dependencies with two distinct regions of
have been obtained recently in Refs. [
18,
33] from similar analyses, using the functions in Equations (4) and (5), of the experimental midrapidity transverse momentum distributions of identified charged particles in Xe + Xe collisions at
= 5.44 TeV and Pb + Pb collisions at
= 5.02 TeV. It is interesting to note that the corresponding border between two distinct
regions with significantly different behaviors of 〈
βT〉 versus
as well as
T0 versus
dependencies was found to be between the 50–60% and 40–50% centrality classes in both Xe + Xe collisions at
= 5.44 TeV [
18] and Pb + Pb collisions at
= 5.02 TeV [
33], coinciding with the corresponding border centrality intervals for Pb + Pb collisions at
= 2.76 TeV in the present work. A comparison of the estimated border values of
,
, and
for probable crossover phase transition from the dense hadronic state to that of the QGP state (or mixed state of QGP and hadrons) in the present work on Pb + Pb collisions at
= 2.76 TeV with those estimated in Refs. [
18,
33] in Xe + Xe collisions at
= 5.44 TeV and Pb + Pb collisions at
= 5.02 TeV, respectively, is presented in
Table 5.
As seen from
Table 5, the estimated border values of
in Pb + Pb collisions at
= 2.76 and 5.02 TeV proved to be significantly larger compared to those in Xe + Xe collisions at
= 5.44 TeV. This can be explained by the significant difference in the mass numbers,
A, of the Pb and Xe nuclei, and hence the larger number of the participant nucleons in the overlap zone of colliding nuclei in case of Pb + Pb compared to Xe + Xe collisions for the border value between the 50–60% and 40–50% centrality classes, coinciding for these three collision types. The coincidence of the border values of
in Pb + Pb collisions at
= 2.76 and 5.02 TeV is obviously due to the same collision system and geometry for the coinciding estimated border between the 50–60% and 40–50% centrality groups in both cases. It should be noted that the ratio (1.61 ± 0.24) of the evaluated border values of
in Pb + Pb collisions at
= 5.02 TeV and Xe + Xe collisions at
= 5.44 TeV was found to coincide [
33] with that (1.59 ± 0.24) of the respective border values of
in these two collisions, and with the ratio of the mass numbers of the corresponding
208Pb and
132Xe nuclei equal to
. The approximate relation
was satisfied [
33] for the border values estimated in Pb + Pb and Xe + Xe collisions
= 5.02 and 5.44 TeV, respectively, with the close values of the center-of-mass collision energy per nucleon pair. The significantly larger estimated border value
= 251 ± 20 in Pb + Pb collisions at
= 5.02 TeV as compared to
= 205 ± 15 in Pb + Pb collisions at
= 2.76 TeV, as seen in
Table 5, is likely due to the significantly higher energy density (hence, larger charged-particle multiplicity density) and more particles produced in cases of significantly larger value of center-of-mass collision energy,
= 5.02 TeV, per nucleon pair.
As seen from
Figure 3c, the non-extensivity parameter
q decreases systematically for all studied particle species with increasing the centrality of Pb + Pb collisions at
= 2.76 TeV (with an increase in
).
Figure 3c also shows that the rate of decrease of
q with increasing
in region
< 71 is noticeably greater than that in range
> 71. It is seen that
q for pions coincides within uncertainties with
q for kaons in the whole range of
, and in region
< 100 the parameter
q for (anti)protons is noticeably smaller than
q for pions and kaons. It agrees well with the relation
q(baryons) <
q(mesons) obtained earlier in high-energy collisions in Refs. [
17,
18,
19,
28,
33,
45,
46,
48,
49]. However, as observed from
Figure 3c, on the whole the gap between parameter
q for mesons and baryons decreases with increasing
, and
q for all studied particle species, i.e., for pions, kaons, and (anti)protons, becomes the same within uncertainties in region
> 160, in good agreement with the similar result obtained in Pb + Pb collisions at
= 5.02 TeV in recent work [
33]. The observed coincidence of the
q parameter for the charged pions and kaons, protons and antiprotons at large
indicates likely that the highly thermalized and equilibrated QGP is produced in central Pb + Pb collisions at
= 2.76 TeV with
> 160 in agreement with the similar result found in central Pb + Pb collisions at
= 5.02 TeV in Ref. [
33]. The similar decrease, with increasing
, of the gap between
q for (anti)protons, on the one hand, and
q for pions and kaons, on the other hand, with parameter
q coinciding for these mesons and baryons at large
was also observed in Xe + Xe collisions at
= 5.44 TeV in Ref. [
18].
Currently, it is important to study the correlations between the extracted parameters. The
T0 versus 〈
βT〉 dependencies, obtained from fits by non-consistent as well as thermodynamically consistent Tsallis function with transverse flow and presented in
Table 2 and
Table 3, are shown in
Figure 4a,b, respectively. The obtained Pearson linear correlation coefficient,
rxy, between two parameters and the one-sigma confidence ellipse (covering a 68% confidence interval) of the covariance of the
T0 and
parameters are also shown in
Figure 4. The corresponding 1-sigma confidence ellipse and calculated
rxy coefficient of a linear correlation between pairs of parameters are also presented in
Figure 4. The Pearson correlation coefficient,
rxy, shows the magnitude of a linear correlation between two parameter sets, and it can vary between −1 and +1 values. The
rxy equal to −1 and +1 corresponds to the full negative linear correlation (anticorrelation) and full positive linear correlation, respectively, whereas
rxy = 0 denotes the absence of a linear correlation between two sets of data. As seen from the orientations and shapes of confidence ellipses and corresponding
rxy values in
Figure 4a,b, the parameters
T0 and 〈
βT〉 are highly anticorrelated. As observed from
Figure 4a,b, the
T0 versus
dependencies differ in regions
< 0.44 and
> 0.44, corresponding to Pb + Pb collisions at
= 2.76 TeV with
< 71 and
> 71, respectively. The
T0 versus 〈
βT〉 dependence (from
Figure 4a) is shown separately for regions
< 0.44 and
> 0.44 in
Figure 5a,b, respectively. As seen from
Figure 5a, the
T0 and 〈
βT〉 parameters are strongly anticorrelated in region
< 0.44. On the other hand, as observed from
Figure 5b, the linear correlation between
T0 and 〈
βT〉 is practically absent in region
> 0.44. The similar result has been obtained recently in Pb + Pb collisions at
= 5.02 TeV [
33] and Xe + Xe collisions at
= 5.44 TeV [
18]. Thus, in addition to significantly different growth rates of
in regions
< 71 ± 5 and
> 71 ± 5, we have observed the considerably different correlations between
T0 and
parameters in corresponding
< 0.44 and
> 0.44 ranges. This further substantiates our assumption that
≈ 71 ± 5 (
≈ 205 ± 15) could be a border value of collision centrality for crossover transition from dense hadronic phase to the QGP state (or mixed state of QGP and hadrons) in Pb + Pb collisions at
= 2.76 TeV.
It is important to also check the correlations between other pairs of the parameters in
Table 2, extracted using a thermodynamically consistent Tsallis function with transverse flow. The
q(pions) versus
q(kaons),
q(pions) versus
q((anti)protons), and
q(kaons) versus
q((anti)protons) dependencies are shown in
Figure 6a–c, respectively. The
q(pions) versus 〈
βT〉,
q((anti)protons) versus 〈
βT〉, and
q(kaons) versus 〈
βT〉 dependencies are illustrated in
Figure 7a–c, respectively. The
q(pions) versus
T0,
q((anti)protons) versus
T0, and
q(kaons) versus
T0 dependencies are displayed in
Figure 8a–c, respectively.
As seen from
Figure 6a–c, the non-extensivity parameter
q for pions and kaons, for pions and (anti) protons, as well as
q for kaons and (anti) protons show the strong positive linear correlation with the Pearson correlation coefficient being very close to +1 for each pair of particle species.
Figure 7a–c show that the non-extensivity parameter
q is strongly negatively correlated (anticorrelated) with the average transverse flow velocity, 〈
βT〉, for all studied particle species, with the Pearson correlation coefficient being close to −1 in each case. On the other hand, as seen from
Figure 8a–c, quite a large positive linear correlation (
rxy ≈ +0.9) exists between the
q and temperature parameter
T0 in all three cases.
4. Summary and Conclusions
We have successfully analyzed the midrapidity transverse momentum distributions of the charged pions, kaons, protons, and antiprotons in 10 groups of centrality of Pb + Pb collisions at = 2.76 TeV, measured by the ALICE Collaboration, using both thermodynamically consistent and non-consistent Tsallis distribution function with embedded transverse flow. We have performed the combined minimum χ2 fits by the above model functions of the experimental midrapidity spectra of the analyzed particle species in each centrality class of Pb + Pb collisions to extract the global parameters T0 and of the system as well as non-extensivity parameter q for each particle type and study their dependencies on collision centrality (〈Npart〉).
We have observed significantly different behavior (growth rates) of 〈βT〉 in regions < 71 and > 71 with the temperature parameter becoming constant in region > 71. This could indicate that = 71 ± 5 (corresponds to = 205 ± 15) is an estimated border value of collision centrality for crossover phase transition from the dense hadronic state to that of QGP state (or mixed state of QGP and hadrons) in Pb + Pb collisions at = 2.76 TeV.
The respective border between the two distinct
regions with different behaviors of 〈
βT〉 versus
as well as
T0 versus
dependencies was found to be between the 50–60% and 40–50% centrality classes in Pb + Pb collisions at
= 2.76 TeV, coinciding with the corresponding border found to be also between 50–60% and 40–50% centrality in recent works [
18,
33] in both Xe + Xe collisions at
= 5.44 TeV and Pb + Pb collisions at
= 5.02 TeV. The coincidence of the border values of
in Pb + Pb collisions at
= 2.76 and 5.02 TeV has been observed, which is due to the same collision system and geometry. The estimated border values of
in Pb + Pb collisions at
= 2.76 and 5.02 TeV have been significantly larger compared to that in Xe + Xe collisions at
= 5.44 TeV. The significantly larger estimated border value
= 251 ± 20 in Pb + Pb collisions at
= 5.02 TeV as compared to
= 205 ± 15 in Pb + Pb collisions at
= 2.76 TeV could be explained by the significantly greater energy density (hence, larger charged-particle multiplicity density) and more particles produced in case of significantly larger value of center-of-mass collision energy,
= 5.02 TeV, per nucleon pair.
The non-extensivity parameter q has decreased systematically for all studied particle species with the increasing centrality of Pb + Pb collisions at = 2.76 TeV in agreement with the similar tendency observed in recent works in Xe + Xe collisions at = 5.44 TeV as well as Pb + Pb collisions at = 5.02 TeV. The gap between q(mesons) and q(baryons) has decreased with an increase in . We have observed coincidence of the q parameter for the analyzed mesons and baryons in more central collisions with large , suggesting that the highly thermalized and equilibrated QGP is produced in central Pb + Pb collisions at = 2.76 TeV with > 160.
The T0 and 〈βT〉 parameters are strongly anticorrelated in region < 0.44, and the linear correlation between T0 and 〈βT〉 is practically absent in region > 0.44. Hence, besides significantly different growth rates of in regions < 71 ± 5 and > 71 ± 5, we have obtained considerably different correlations between T0 and parameters in the corresponding < 0.44 and > 0.44 ranges. This further supports our finding that ≈ 71 ± 5 (≈ 205 ± 15) could be a border value of collision centrality for crossover transition from dense hadronic phase to the QGP state (or mixed state of QGP and hadrons) in Pb + Pb collisions at = 2.76 TeV.
The strong positive linear correlation between non-extensivity parameter q for pions and kaons, between q for pions and (anti) protons, and between q for kaons and (anti)protons has been obtained with the corresponding Pearson correlation coefficient, rxy, being very close to +1 for each pair of particle species. On the other hand, the parameter q for all studied particle species has proved to be strongly negatively correlated (anticorrelated) with the average transverse flow velocity, 〈βT〉, with rxy being close to −1 in each case. Quite a large positive linear correlation (rxy ≈ +0.9) has been observed between the q for the studied particle species and temperature parameter, T0.

 ,
, 


