Effects of Water Availability in the Soil on Tropane Alkaloid Production in Cultivated Datura stramonium

 , and
, and 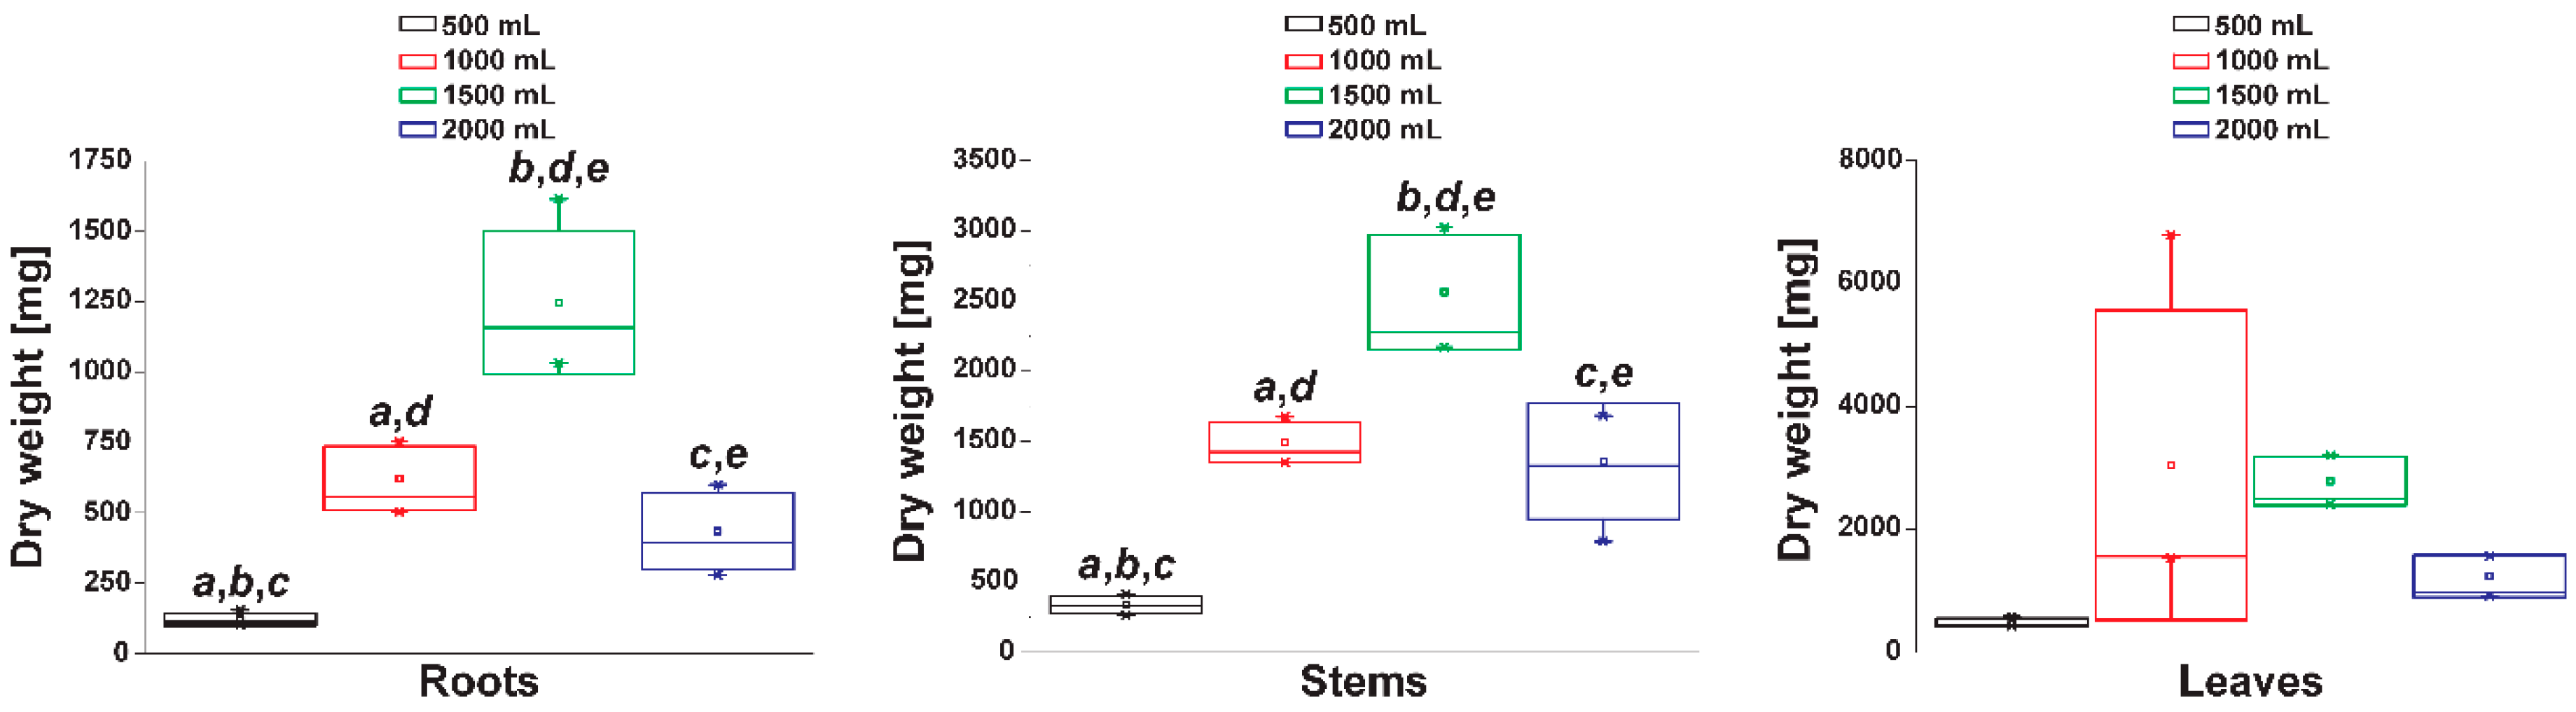
Abstract
:1. Introduction
2. Results
2.1. Water Availability in Roots Depending on Irrigation
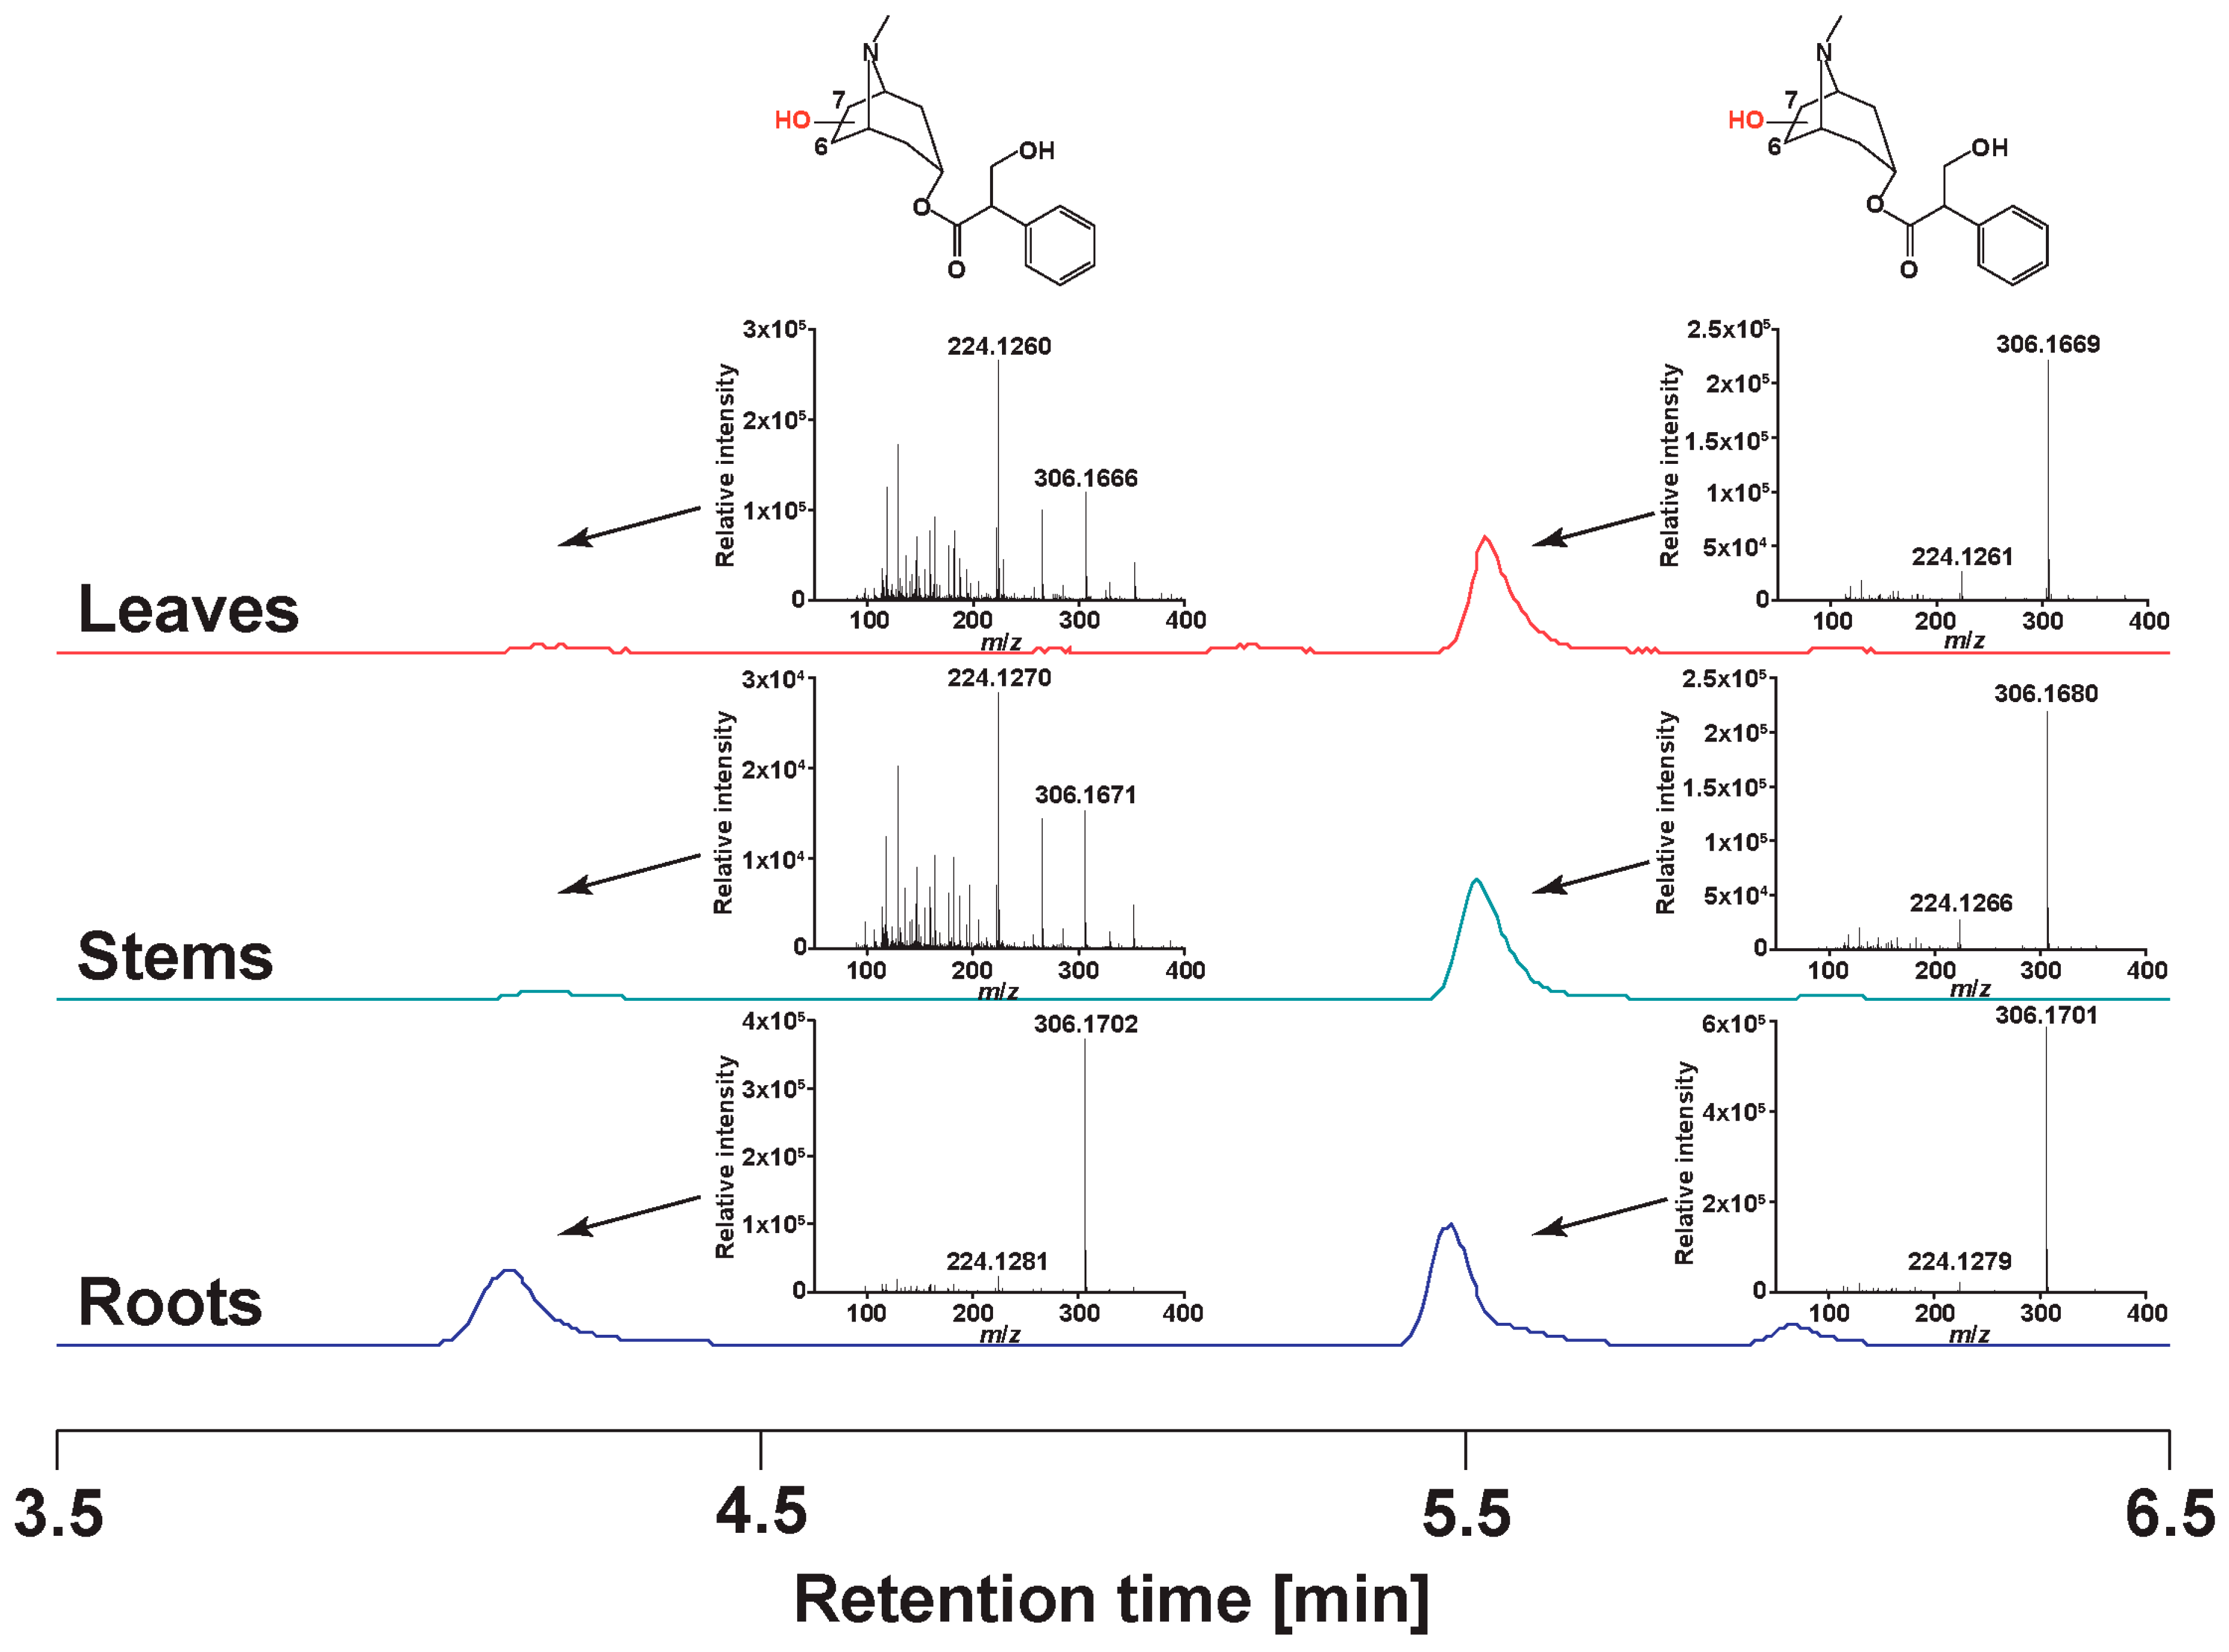
2.2. Profile of Tropane Alkaloids
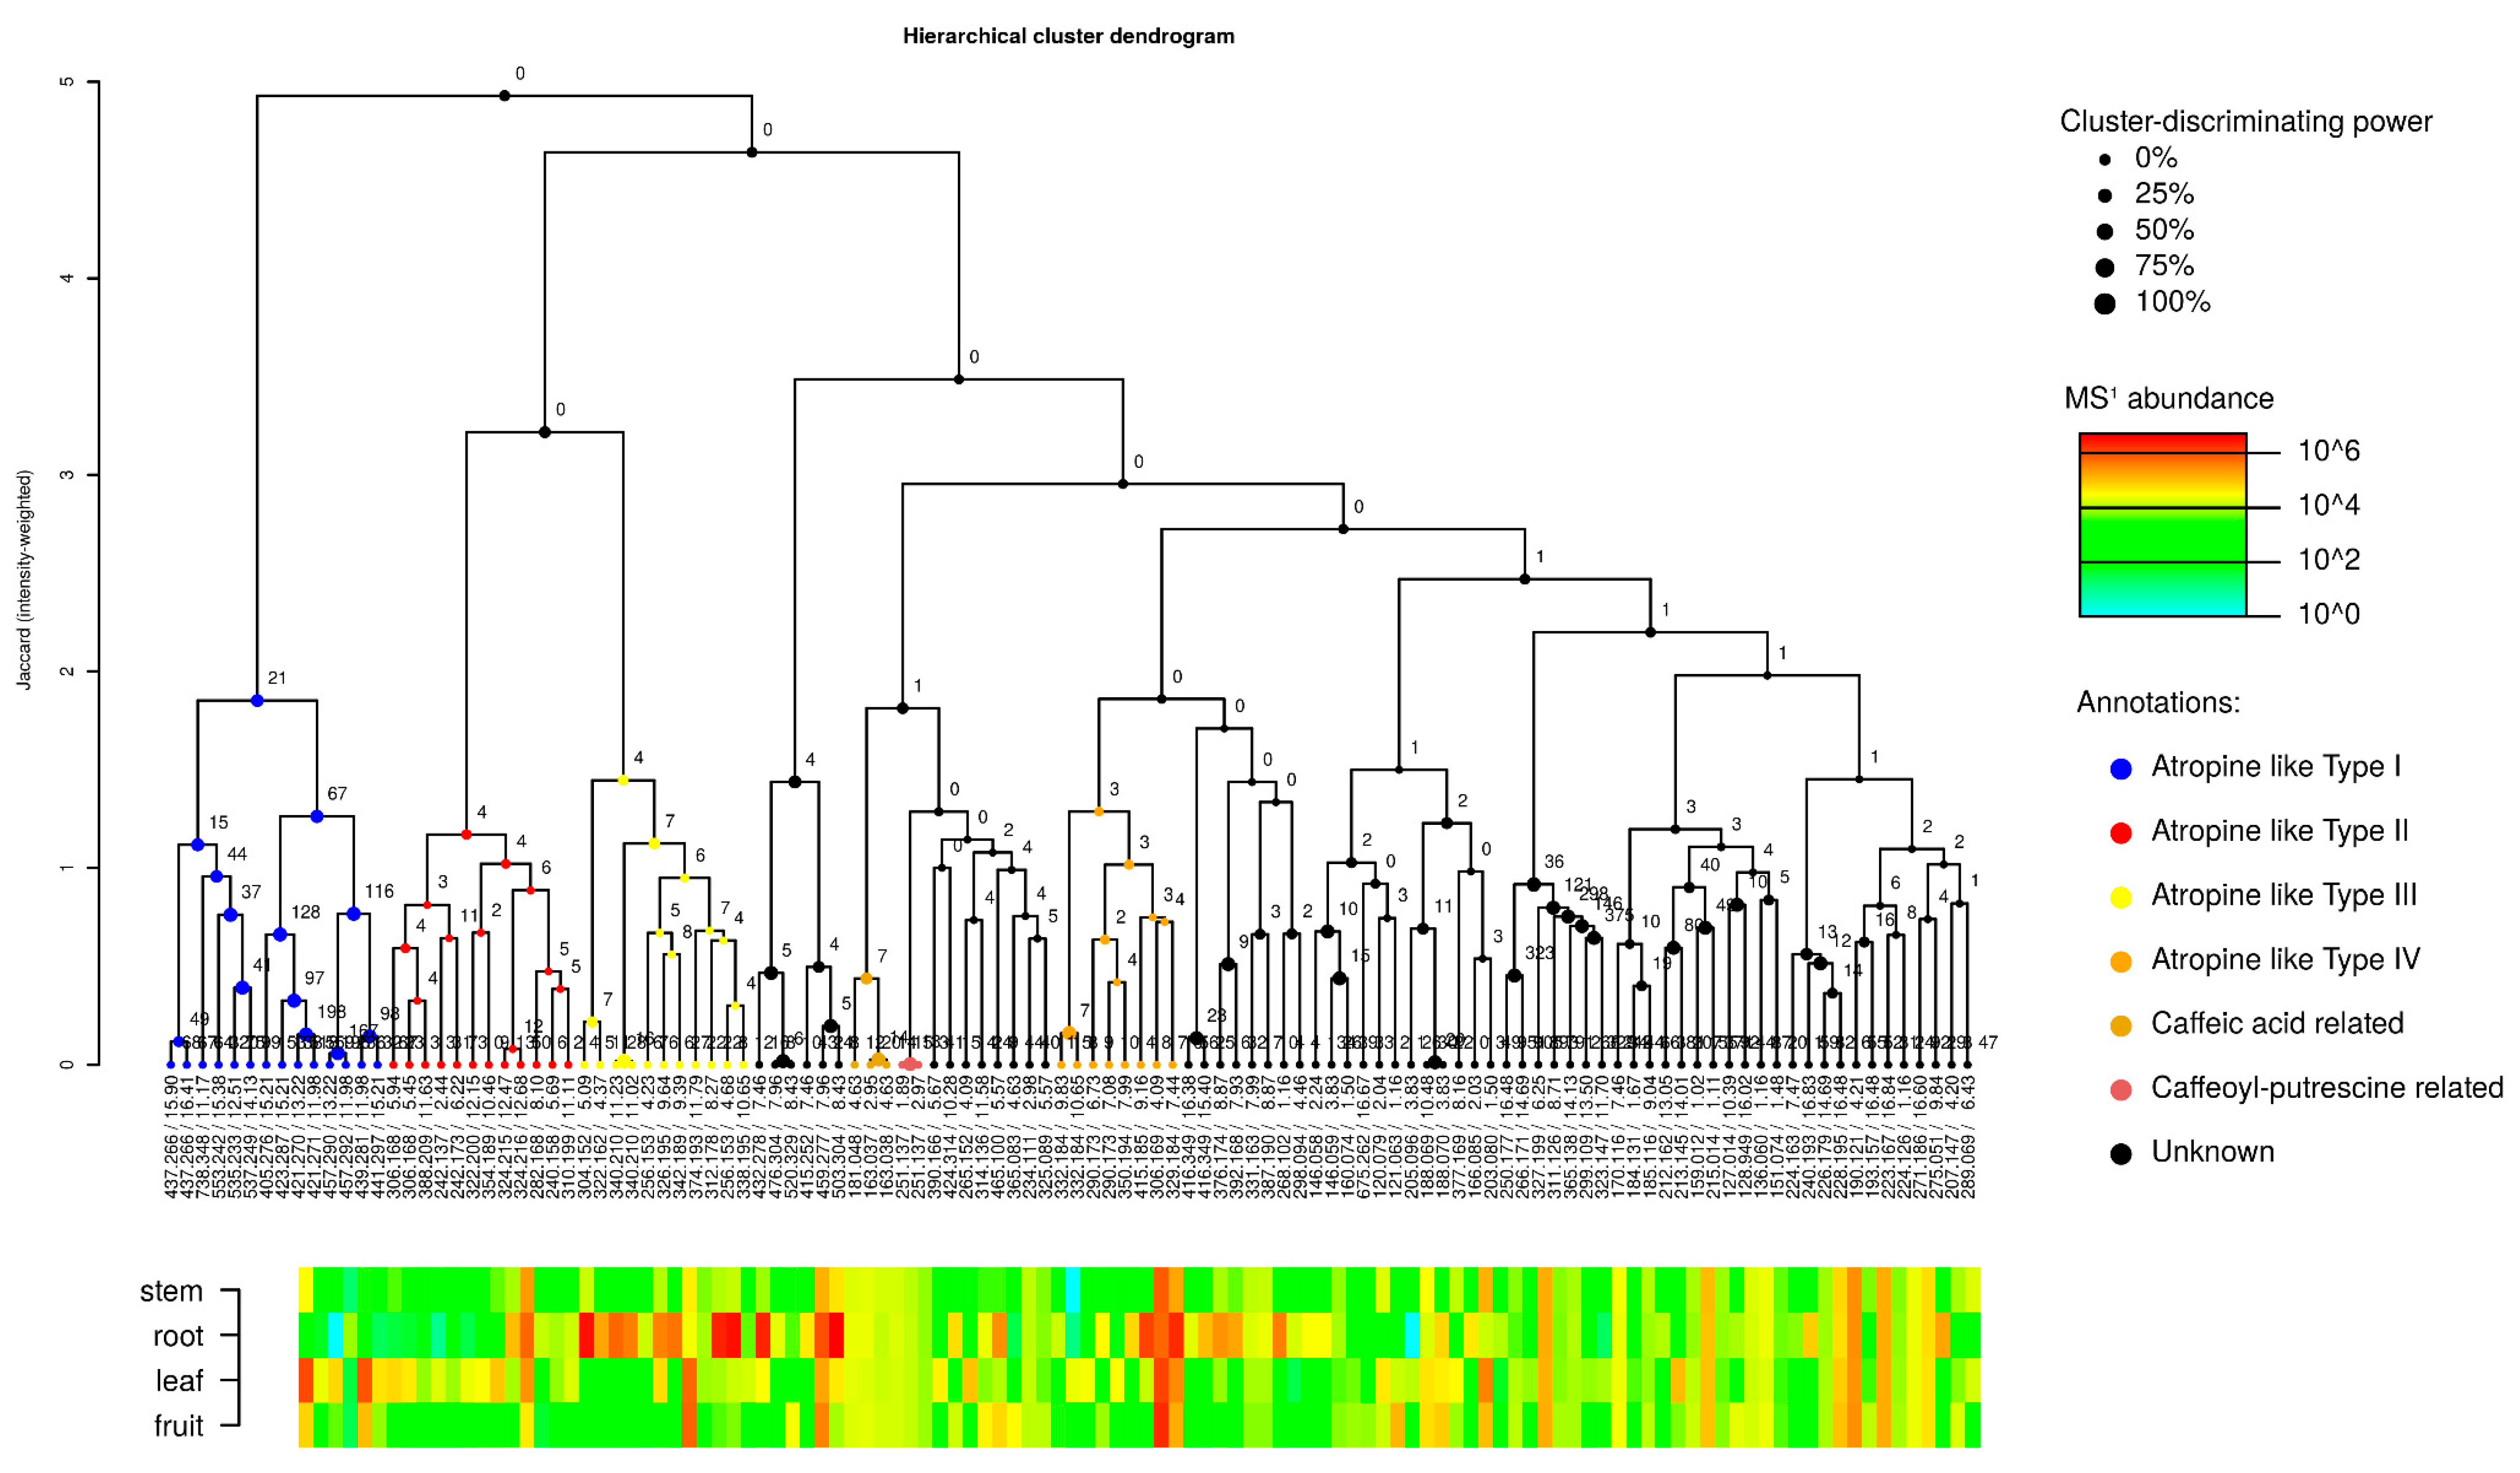
2.2.1. Metabolite Family Hypotheses
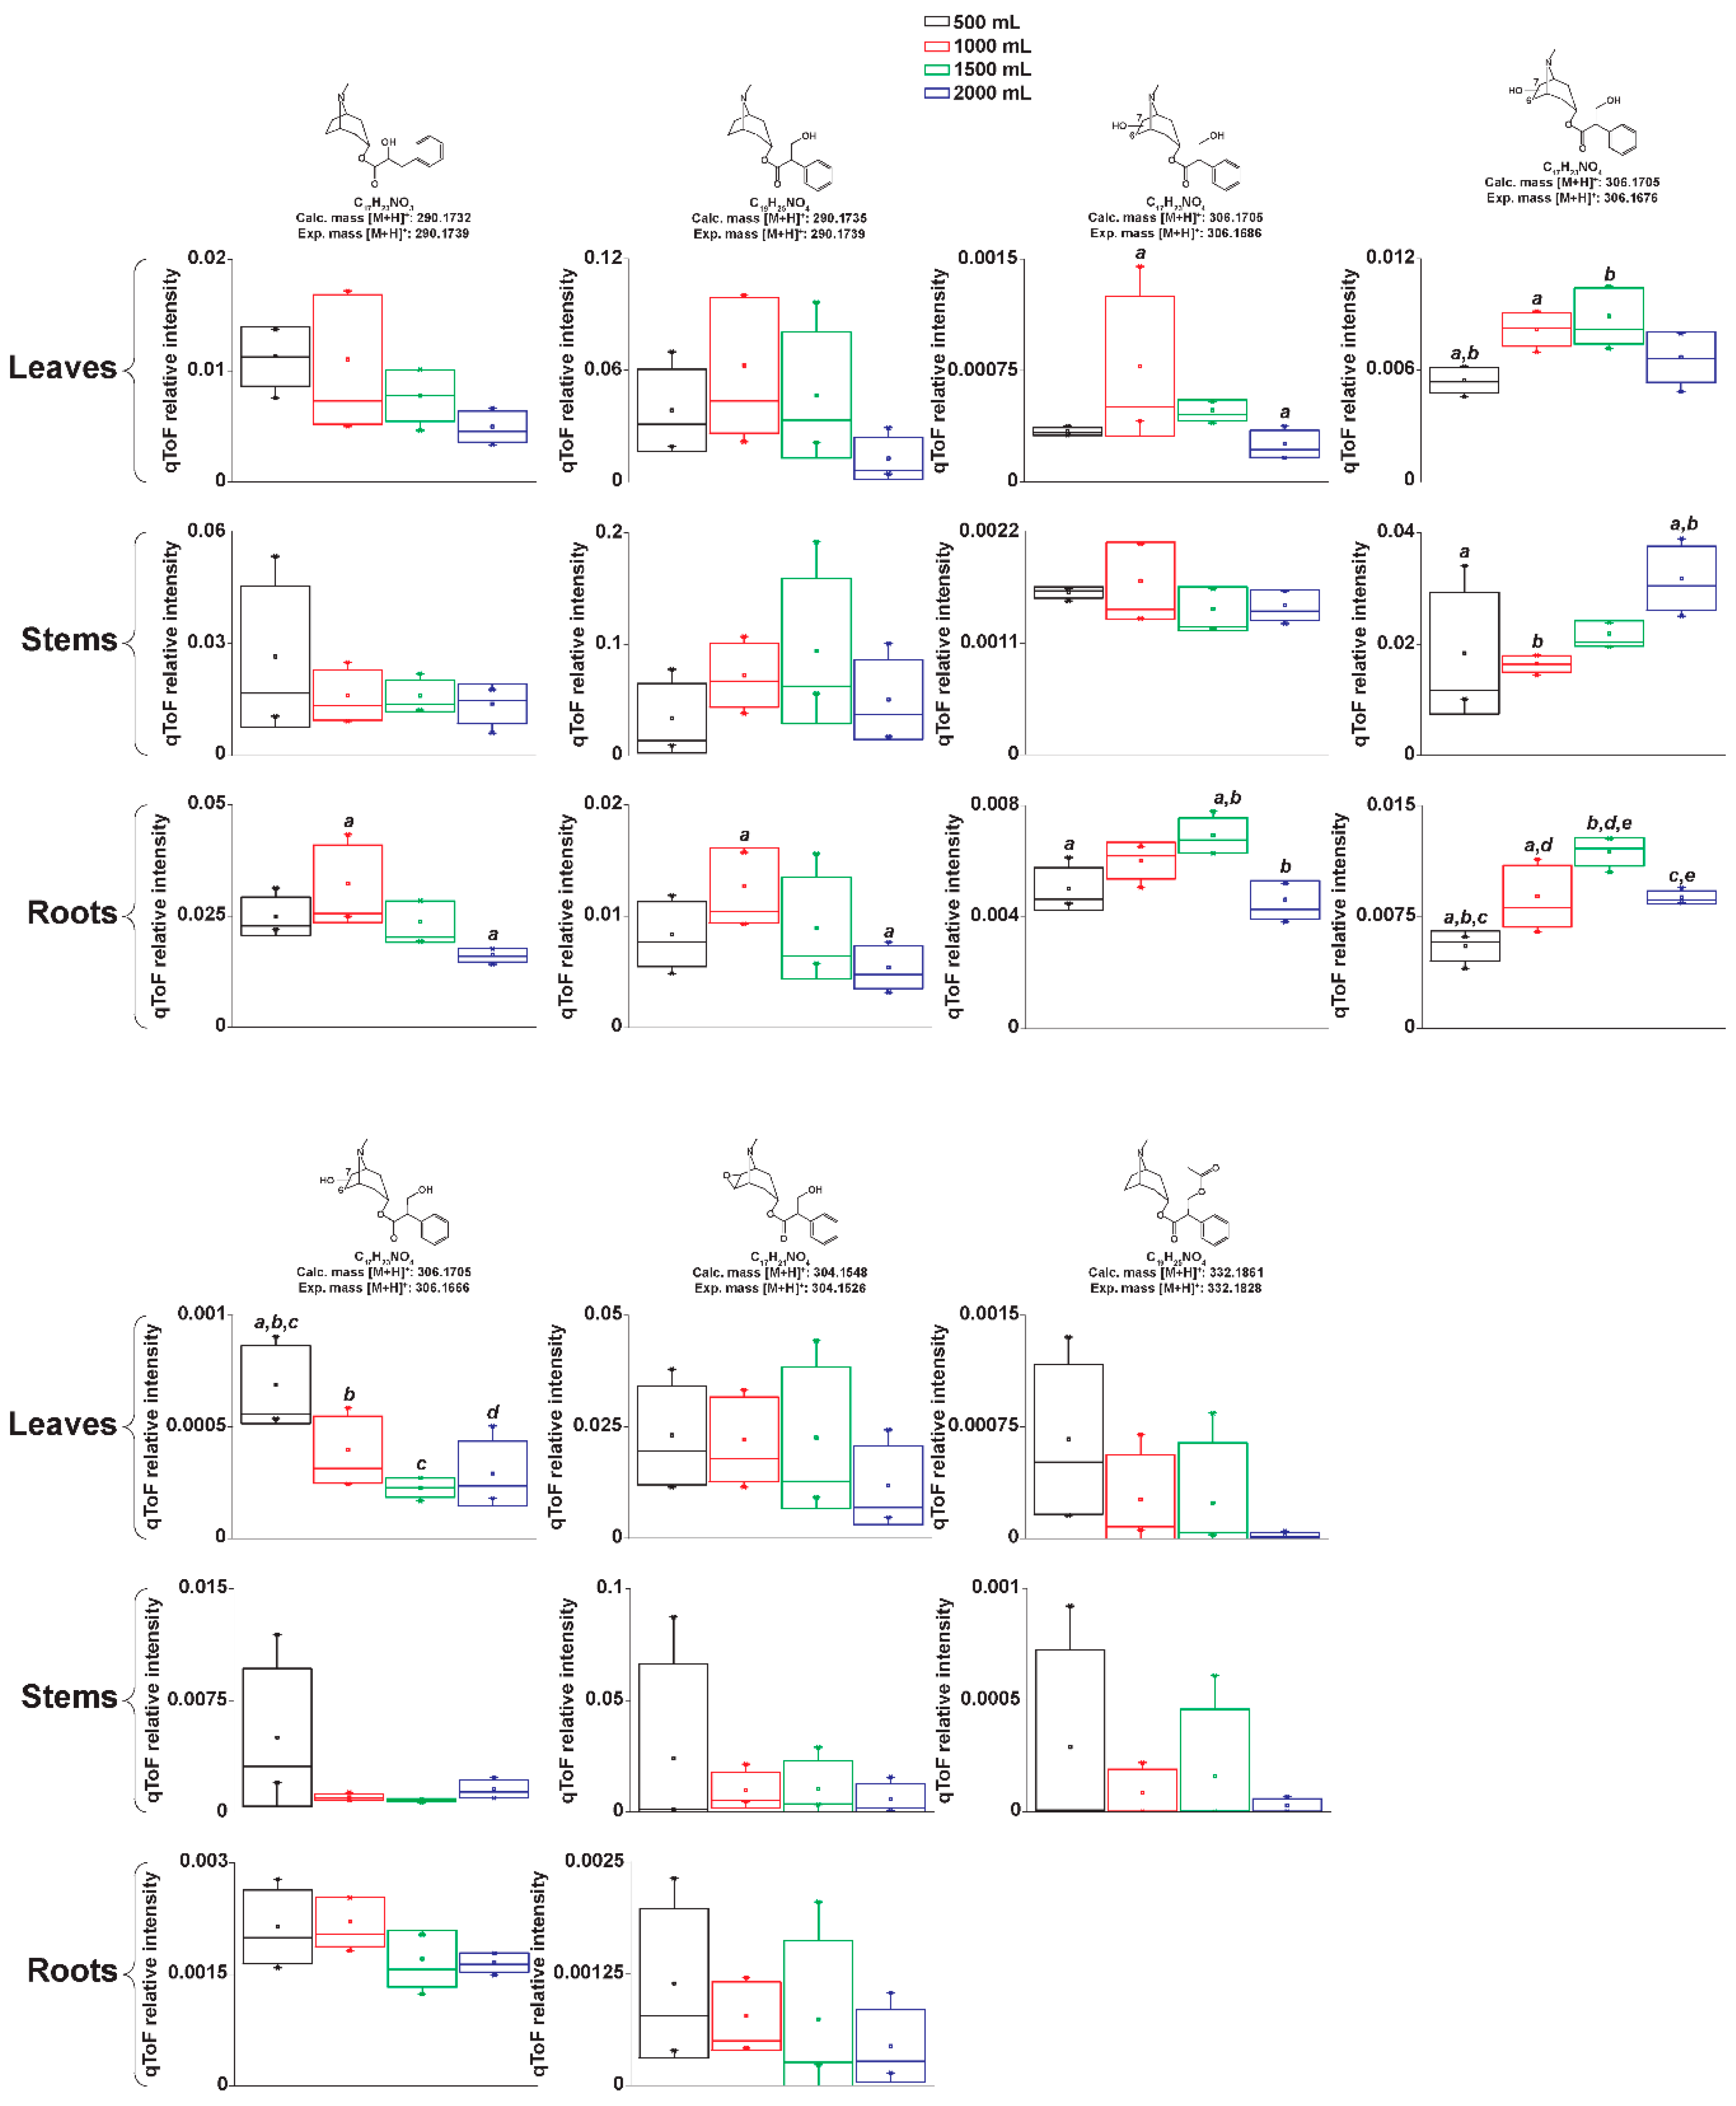
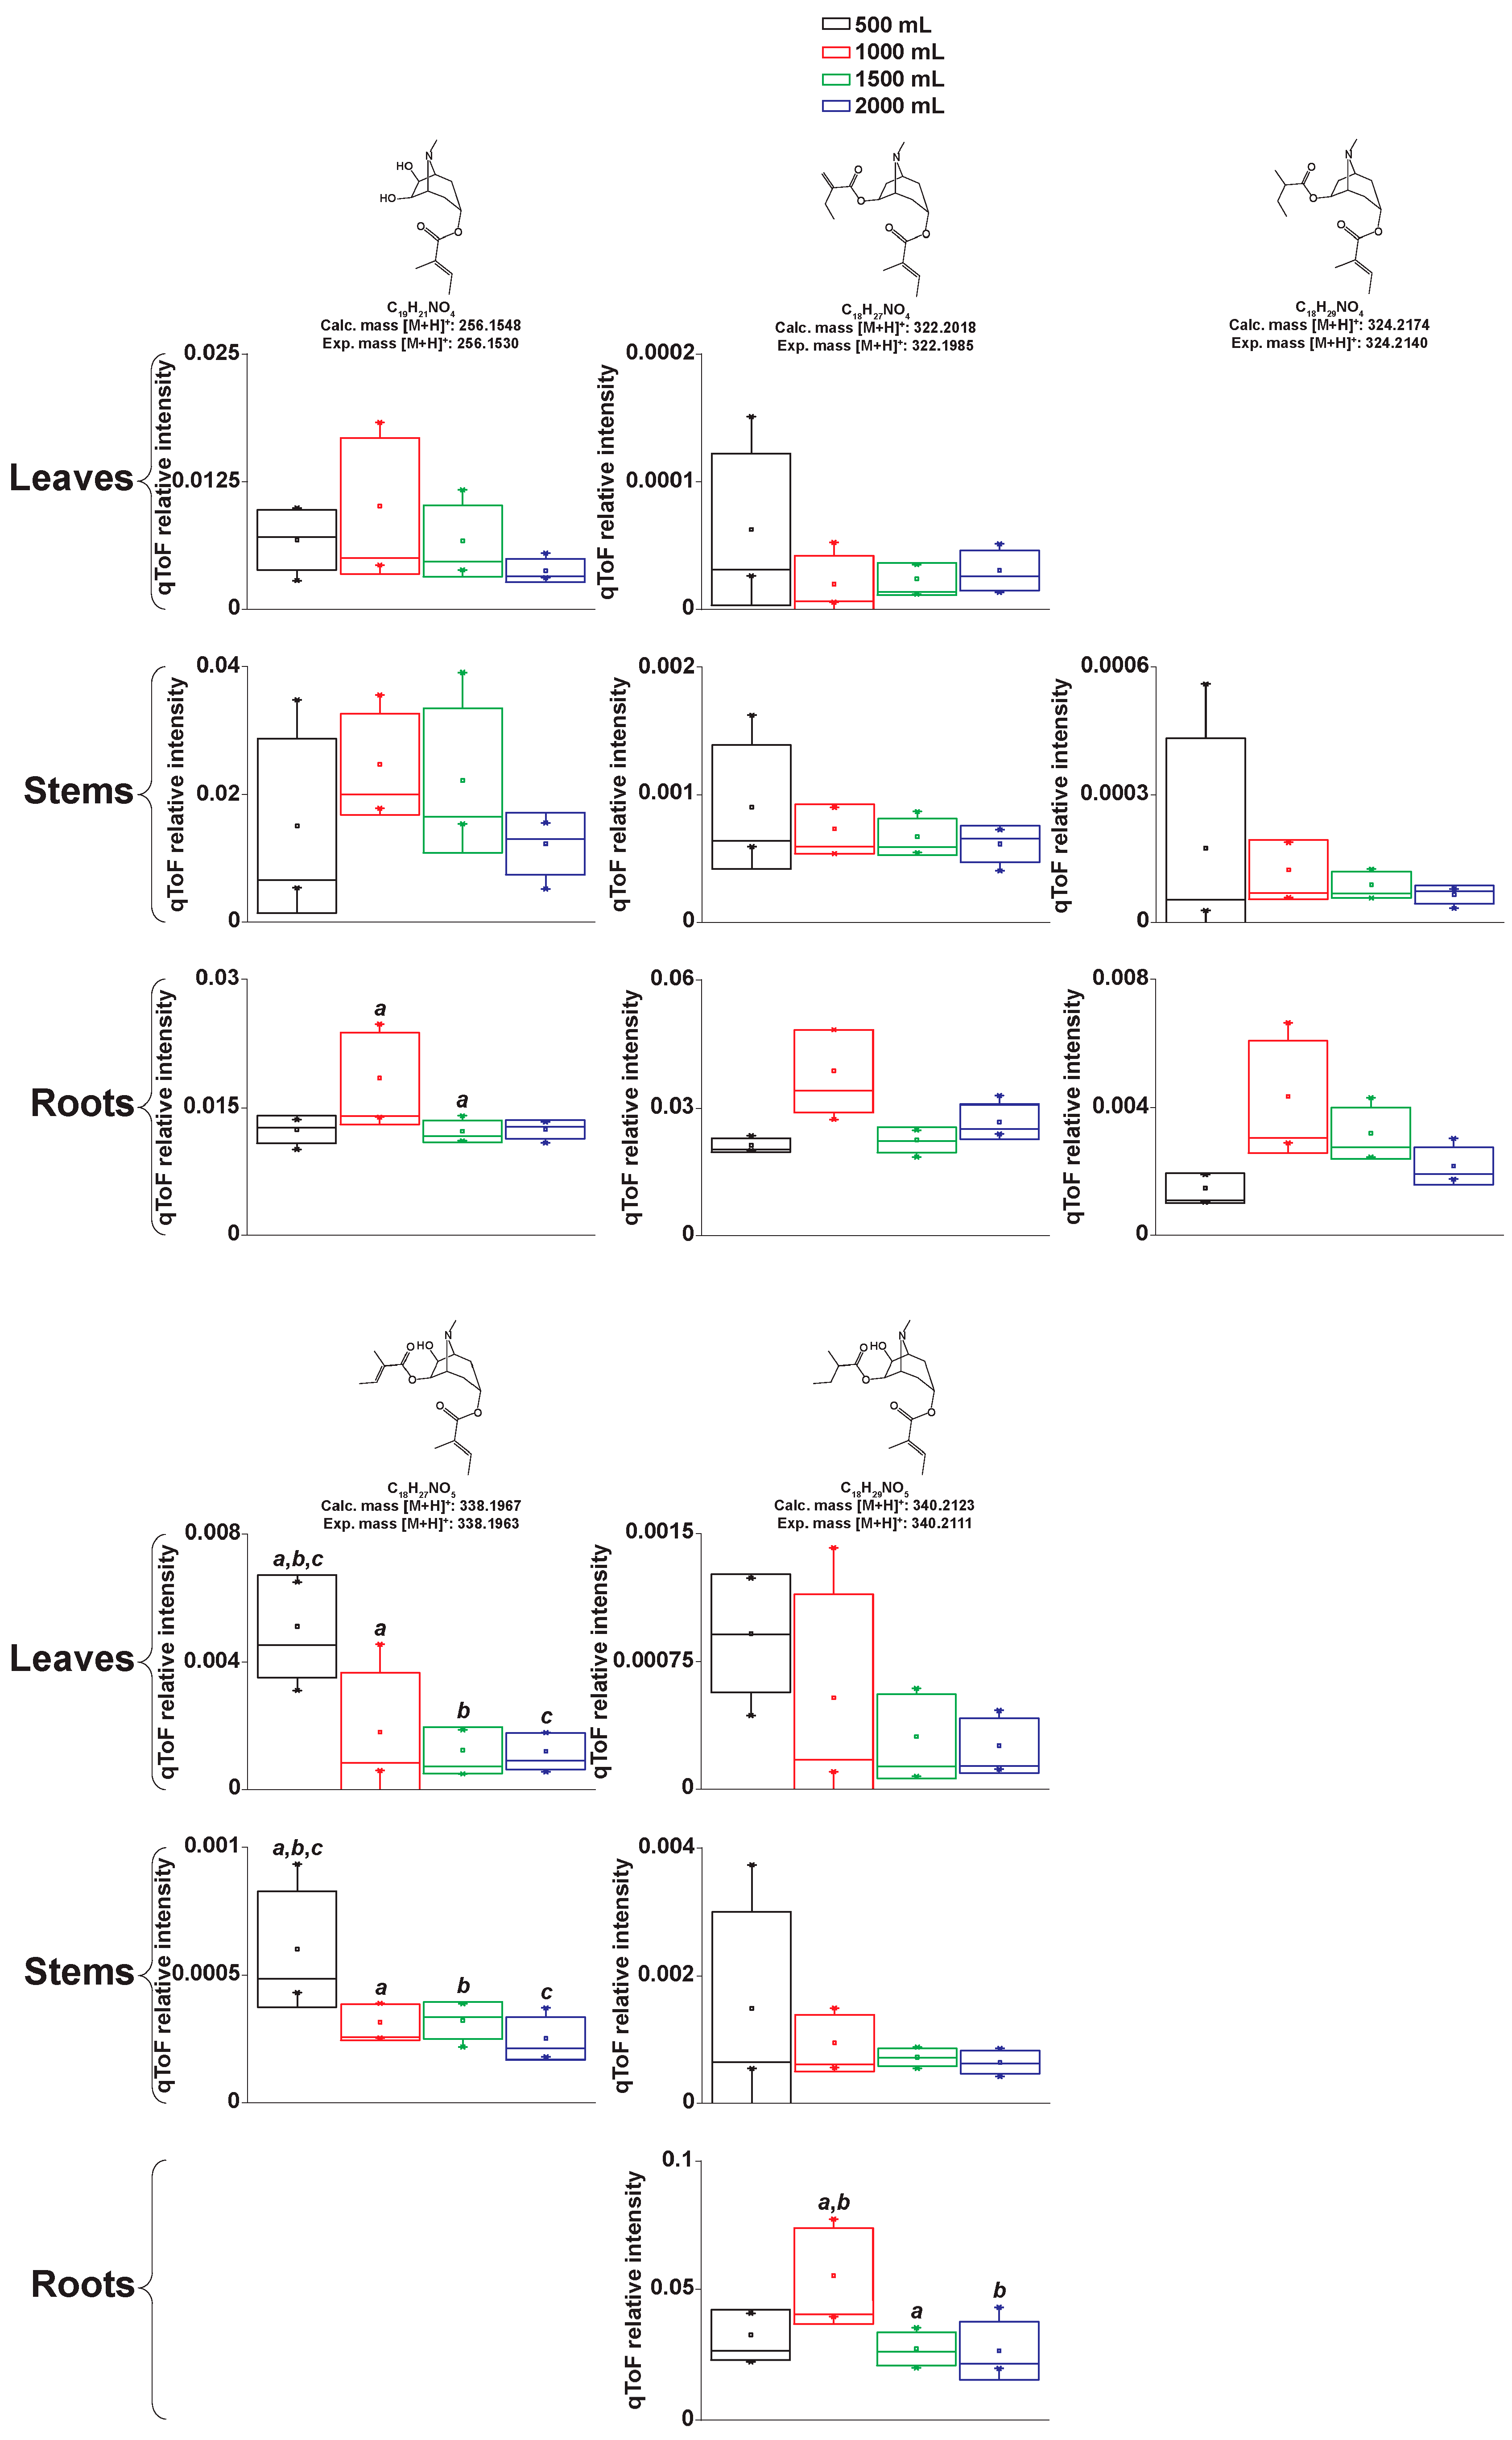
2.2.2. Manual Interpretation of Mass Spectra and Relative Signal Quantitation
2.3. Absolute Concentration of Atropine and Scopolamine
2.4. Atropine Hydroxylation
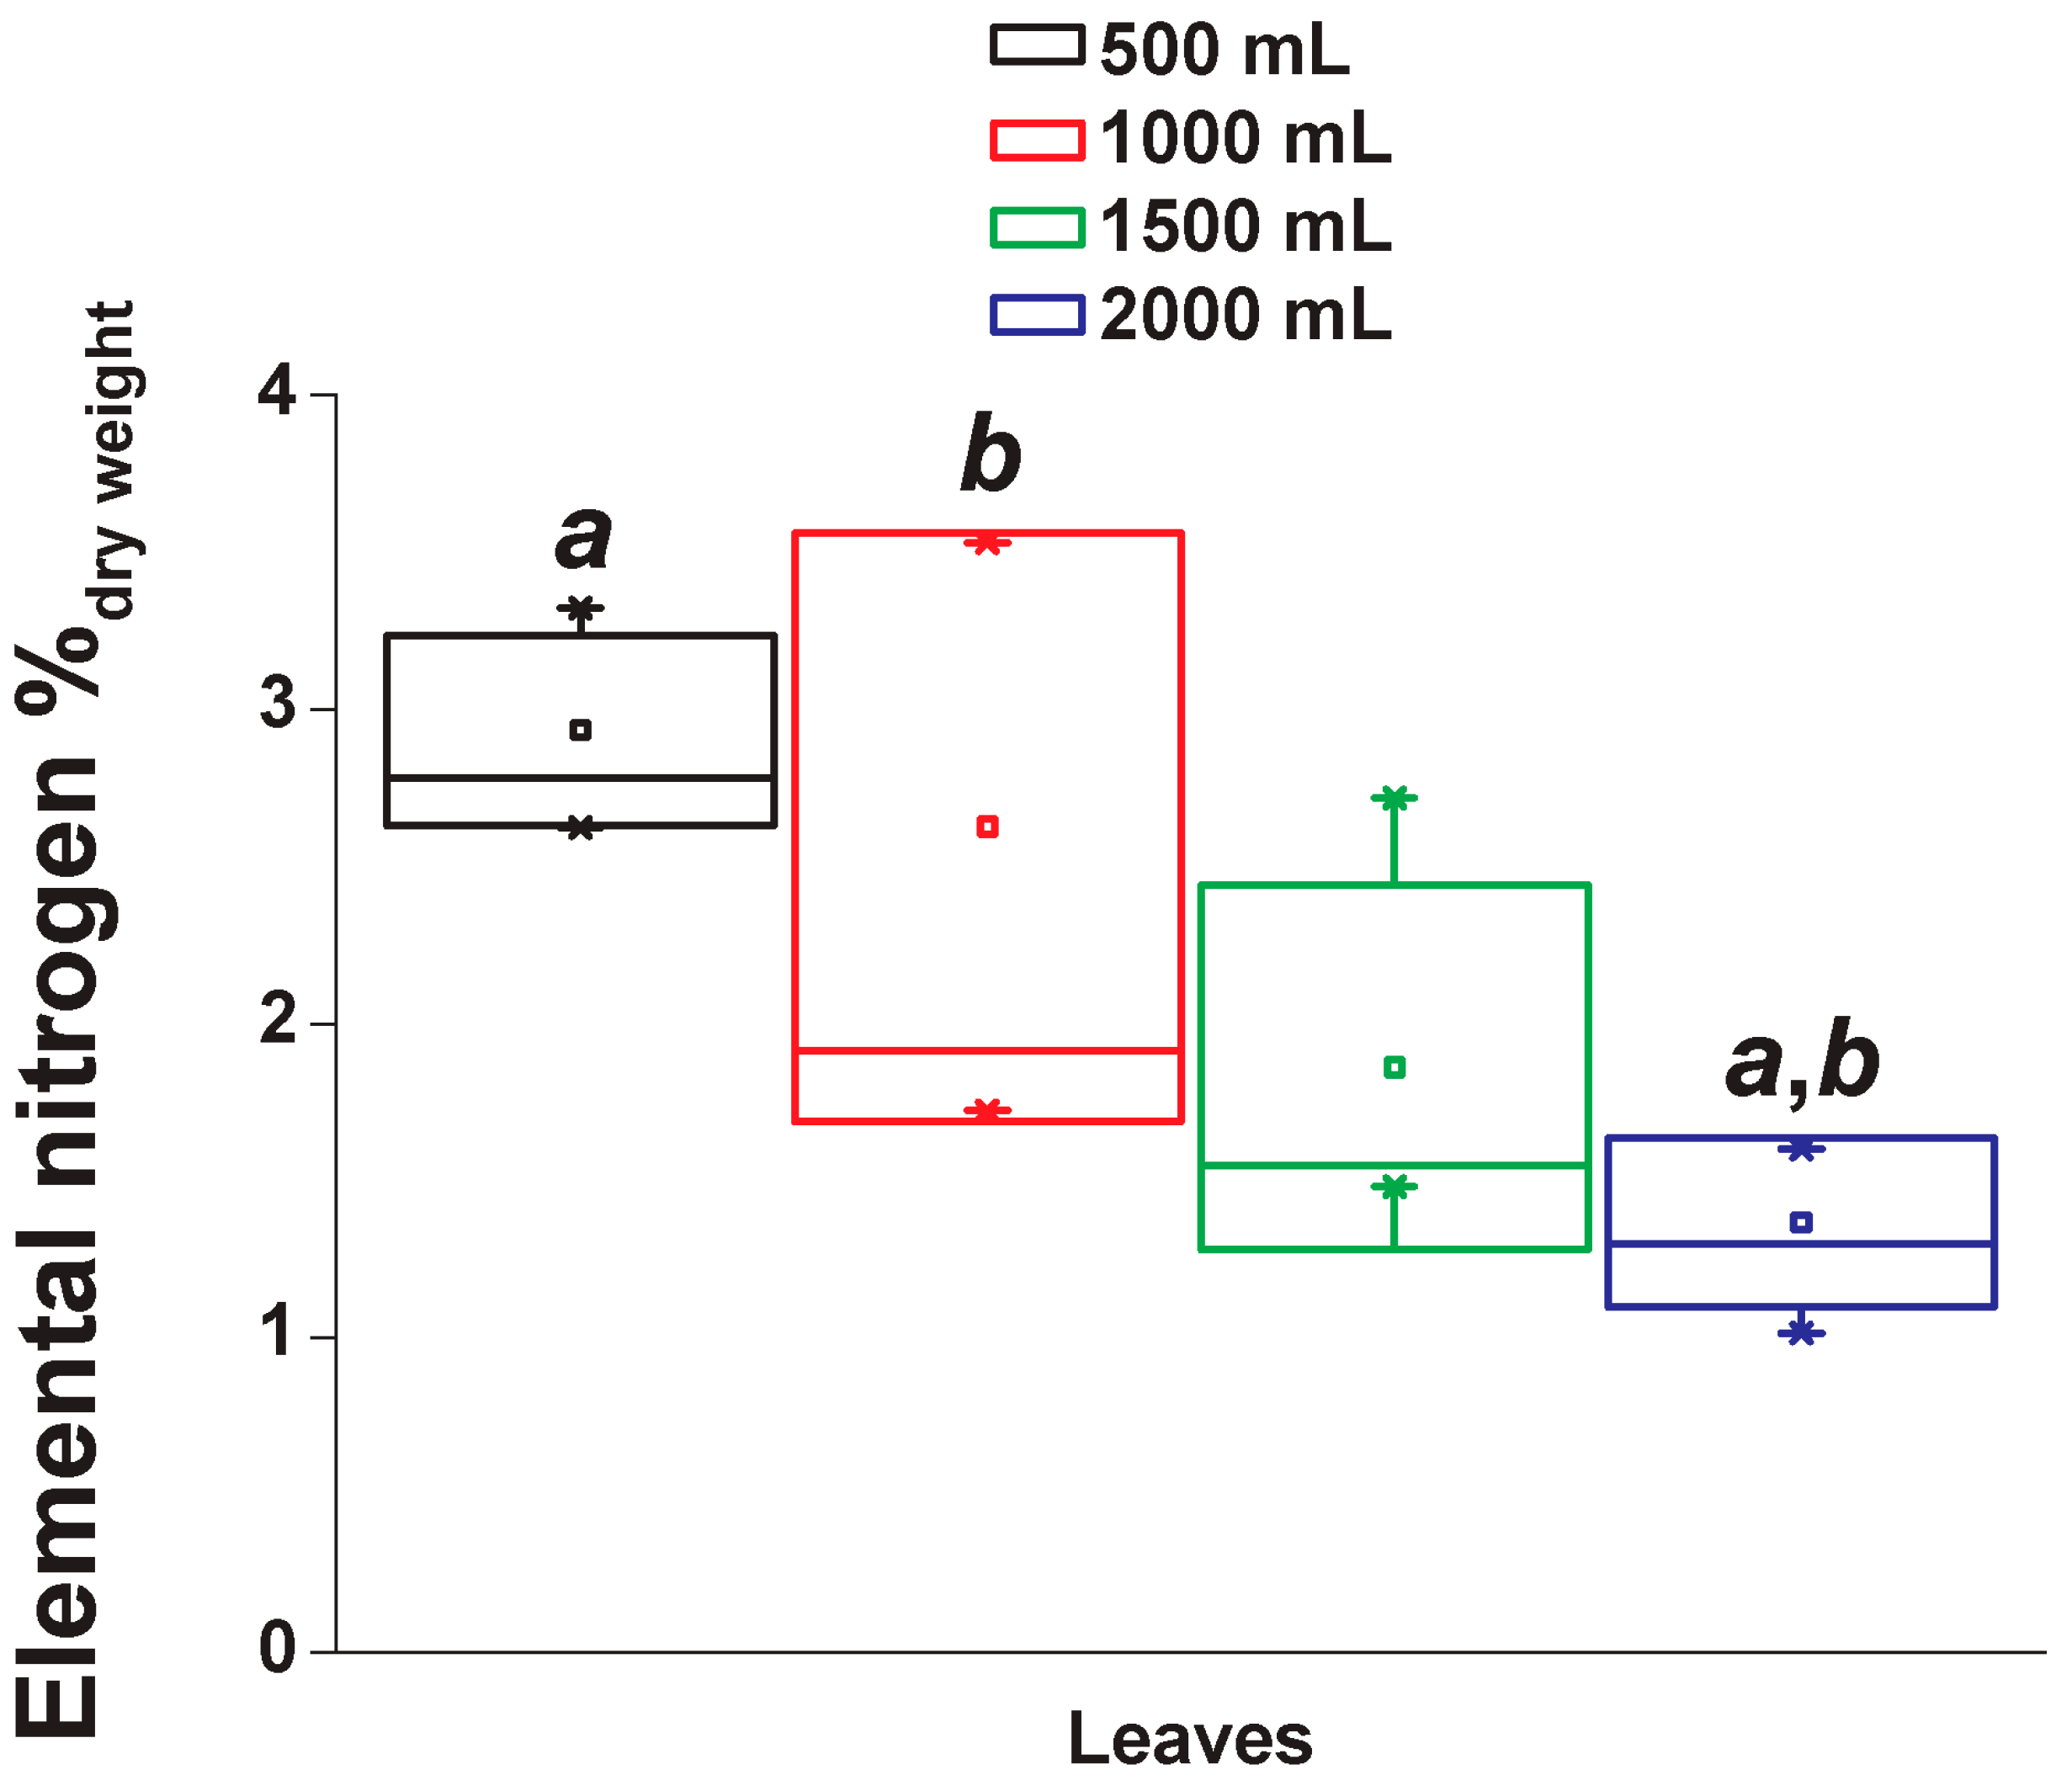
2.5. Elemental Nitrogen Content
3. Discussion
3.1. Effect of Irrigation on Tropane Alkaloid Accumulation
3.2. Total Tropane Alkaloid Productivity
3.3. Aromatic Tropane Alkaloid Metabolism
4. Materials and Methods
4.1. Plant Material and Greenhouse Conditions
4.2. Irrigation/Tensiometers
4.3. Metabolite Extraction
4.4. LC-MS Metabolic Profiling and MS2
4.5. LC-MS Data Processing
4.6. Interpretation of Mass Spectra and Generation of Compound Structure Hypotheses
4.6.1. Processing of MS2 Mass Spectra with MetFamily
4.6.2. Manual Interpretation of Mass Spectra and Ion Signal Relative Quantitation
4.7. Quantification of Atropine and Scopolamine
4.8. Quantification of Elemental Nitrogen
4.9. Additional Statistics
5. Conclusions
Supplementary Materials
Author Contributions
Funding
Acknowledgments
Conflicts of Interest
References
- Kohnen-Johannsen, K.; Kayser, O. Tropane alkaloids: Chemistry, pharmacology, biosynthesis and production. Molecules 2019, 24, 796. [Google Scholar] [CrossRef] [PubMed]
- Maeda, S.; Qu, Q.; Robertson, M.; Skiniotis, G.; Kobilka, B. Structures of the M1 and M2 muscarinic acetylcholine receptor/G-protein complexes. Science 2019, 364, 552–557. [Google Scholar] [CrossRef] [PubMed]
- Eddleston, M. Novel clinical toxicology and pharmacology of organophosphorus insecticide self-poisoning. Annu. Rev. Pharmacol. Toxicol. 2019, 59, 341–360. [Google Scholar] [CrossRef] [PubMed]
- Sanger, G.; Andrews, P. A history of drug discovery for treatment of nausea and vomiting and the implications for future research. Front. Pharmacol. 2018, 9, 913. [Google Scholar] [CrossRef] [PubMed]
- Latli, B.; Stiasni, M.; Hrapchak, M.; Li, Z.; Grinberg, N.; Lee, H.; Busacca, C.; Senanayake, C. Buscopan labeled with carbon-14 and deuterium. J. Label. Compd. Radiopharm. 2016, 59, 557–564. [Google Scholar] [CrossRef] [PubMed]
- The Selection and Use of Essential Medicines. Report of the WHO Expert Committee. 2017. Available online: http://apps.who.int/iris/bitstream/10665/259481/1/9789241210157-eng.pdf (accessed on 2 May 2019).
- Boehringer Ingelheim 2016 Annual Report. Available online: https://annualreport.boehringer-ingelheim.com/fileadmin/Download-Center/BI_GB_2016_EN_Gesamt.pdf (accessed on 2 May 2019).
- Nocquet, P.; Opatz, T. Total synthesis of (±)-scopolamine: Challenges of the tropane ring. Eur. J. Org. Chem. 2016, 2016, 1156–1164. [Google Scholar] [CrossRef]
- Ullrich, S.; Hagels, H.; Kayser, O. Scopolamine: A journey from the field to clinics. Phytochem. Rev. 2017, 16, 333–353. [Google Scholar] [CrossRef]
- Häkkinen, S.; Moyano, E.; Cusidó, R.; Oksman-Caldentey, K. Exploring the metabolic stability of engineered hairy roots after 16 years maintenance. Front. Plant Sci. 2016, 7, 1486. [Google Scholar] [CrossRef] [PubMed]
- Harfi, B.; Khelifi, L.; Khelifi-Slaoui, M.; Assaf-Ducrocq, C.; Gontier, E. Tropane alkaloids GC/MS analysis and low dose elicitors’ effects on hyoscyamine biosynthetic pathway in hairy roots of Algerian Datura species. Sci. Rep. 2018, 8, 17951. [Google Scholar] [CrossRef] [PubMed]
- Moussous, A.; Paris, C.; Khelifi-Slaoui, M.; Bekhouche, M.; Zaoui, D.; Rosloski, S.; Makhzoum, A.; Desobry, S.; Khelifi, L. Pseudomonas spp. increases root biomass and tropane alkaloid yields in transgenic hairy roots of Datura spp. In Vitro Cell. Dev. Biol. 2018, 54, 117–126. [Google Scholar] [CrossRef]
- Kohnen, K.; Sezgin, S.; Spiteller, M.; Hagels, H.; Kayser, O. Localization and organization of scopolamine biosynthesis in Duboisia myoporoides R. Br. Plant Cell Physiol. 2018, 59, 107–118. [Google Scholar] [CrossRef] [PubMed]
- Ohlendorf, W. Domestication and crop development of Duboisia spp. (Solanaceae). Domestication and Commercialization of Non-Timber Forest Products in Agroforestry Systems. 1996. Available online: http://www.fao.org/3/a-w3735e.pdf (accessed on 3 July 2019).
- Gleick, P. Water use. Annu. Rev. Environ. Resour. 2003, 28, 275–314. [Google Scholar] [CrossRef]
- Rosegrant, M.; Ringler, C.; Zhu, T. Water for agriculture: Maintaining food security under growing scarcity. Annu. Rev. Environ. Resour. 2009, 34, 205–222. [Google Scholar] [CrossRef]
- Kluger, H. Zur Bestäubung großblumiger Datura-Arten. Flora 1971, 160, 511–517. [Google Scholar]
- Motten, A.; Stone, J. Heritability of stigma position and the effect of stigma-anther separation on outcrossing in a predominant self-fertilizing weed, Datura stramonium (Solanaceae). Am. J. Bot. 2000, 87, 339–347. [Google Scholar] [CrossRef] [PubMed]
- Bello-Bedoy, R.; Nuñez-Farfan, J. The effect of inbreeding on defence against multiple enemies in Datura stramonium. J. Evol. Biol. 2011, 518–530. [Google Scholar] [CrossRef] [PubMed]
- Jimenez-Lobato, V.; Martinez-Borda, E.; Nuñez-Farfan, J.; Valverde, P.; Cruz, L.; Lopez-Velazquez, A.; Santos-Gally, R.; Arroyo, J. Changes in floral biology and inbreeding depression in native and invaded regions of Datura stramonium. Plant Biol. 2018, 20, 214–223. [Google Scholar] [CrossRef] [PubMed]
- Sinnott, B. Albert Francis Blakeslee. A Biographical Memoir. National Academy of Science of the USA. 1954. Available online: http://www.nasonline.org/publications/biographical-memoirs/memoir-pdfs/blakeslee-albert-f-2.pdf (accessed on 3 June 2019).
- Crow, J. Birth defects, Jimson weeds and bell curves. Genetics 1997, 147, 1–6. [Google Scholar] [PubMed]
- Hanselka, J. Prehistoric Plant Procurement, Food Production, and Land Use in Southwestern Tamaulipas, Mexico. Ph.D. dissertation. 2011. Available online: http://openscholarship.wustl.edu/etd/584 (accessed on 29 March 2019).
- King, A.; Powis, T.; Cheong, K.; Deere, B.; Pickering, R.; Singleton, E.; Gaikwad, N. Absorbed residue evidence for prehistoric Datura use in the American Southeast and Western Mexico. Adv. Archaeol. Prac. 2018, 6, 312–327. [Google Scholar] [CrossRef]
- Evans, W.; Major, V. The alkaloids of the genus Datura, Section Brugmansia. Part IV. New alkaloids of D. sanguinea R. and P. J. Chem. Soc. C. 1966, 1621–1623. [Google Scholar] [CrossRef]
- Evans, W.; Major, V.V. The alkaloids of the genus Datura, Section Brugmansia. Part V. Alkaloids of D. sanguinea R. and P. and related esters of tropane-3α,6β,7β-triol. J. Chem. Soc. C. 1968, 2775–2778. [Google Scholar] [CrossRef]
- Fischer, C.; Kwon, M.; Ro, D.; van Belkuma, M.; Vederas, J. 2018. Isolation, expression and biochemical characterization of recombinant hyoscyamine-6β-hydroxylase from Brugmansia sanguinea—tuning the scopolamine production. Med. Chem. Commun. 2018, 9, 888. [Google Scholar] [CrossRef] [PubMed]
- Guo, Z.; Tan, H.; Lv, Z.; Ji, Q.; Huang, Y.; Liu, J.; Chen, D.; Diao, Y.; Si, J.; Zhang, L. Targeted expression of Vitreoscilla hemoglobin improves the production of tropane alkaloids in Hyoscyamus niger hairy roots. Nat. Sci. Rep. 2018, 8, 17969. [Google Scholar] [CrossRef] [PubMed]
- Lan, X.; Zeng, J.; Liu, K.; Zhang, F.; Bai, G.; Chen, M.; Liao, Z.; Huang, L. Comparison of two hyoscyamine 6β-hydroxylases in engineering scopolamine biosynthesis in root cultures of Scopolia lurida. Biochem. Biophys. Res. Comm. 2018, 497, 25–31. [Google Scholar] [CrossRef] [PubMed]
- Ushimaru, R.; Ruszczycky, M.; Liu, H. Changes in regioselectivity of H atom abstraction during the hydroxylation and cyclization reactions catalyzed by hyoscyamine 6β-hydroxylase. J. Am. Chem. Soc. 2019, 141, 1062–1066. [Google Scholar] [CrossRef] [PubMed]
- Ushimaru, R.; Ruszczycky, M.; Chang, W.; Yan, F.; Liu, Y.; Liu, H. Substrate conformation correlates with the outcome of hyoscyamine 6β-hydroxylase catalyzed oxidation reactions. J. Am. Chem. Soc. 2018, 140, 7433–7436. [Google Scholar] [CrossRef] [PubMed]
- Eisenkraft, A.; Falk, A. Possible role for anisodamine in organophosphate poisoning. Br. J. Pharm. 2016, 173, 1719–1727. [Google Scholar] [CrossRef] [PubMed] [Green Version]
- Wu, T.; Zhu, J.; Wei, Q.; Li, P.; Wang, L.; Huang, J.; Wang, J.; Tang, L.; Wu, L.; Li, C.; et al. Preparative separation of four isomers of synthetic anisodamine by HPLC and diastereomer crystallization. Chirality 2019, 31, 11–20. [Google Scholar] [CrossRef] [PubMed]
- Treutler, H.; Tsugawa, H.; Porzel, A.; Gorzolka, K.; Tissier, A.; Neumann, S.; Balcke, G. Discovering regulated metabolite families in untargeted metabolomics studies. Anal. Chem. 2016, 88, 8082–8090. [Google Scholar] [CrossRef]


© 2019 by the authors. Licensee MDPI, Basel, Switzerland. This article is an open access article distributed under the terms and conditions of the Creative Commons Attribution (CC BY) license (http://creativecommons.org/licenses/by/4.0/).
Share and Cite
Moreno-Pedraza, A.; Gabriel, J.; Treutler, H.; Winkler, R.; Vergara, F. Effects of Water Availability in the Soil on Tropane Alkaloid Production in Cultivated Datura stramonium. Metabolites 2019, 9, 131. https://doi.org/10.3390/metabo9070131
Moreno-Pedraza A, Gabriel J, Treutler H, Winkler R, Vergara F. Effects of Water Availability in the Soil on Tropane Alkaloid Production in Cultivated Datura stramonium. Metabolites. 2019; 9(7):131. https://doi.org/10.3390/metabo9070131
Chicago/Turabian StyleMoreno-Pedraza, Abigail, Jennifer Gabriel, Hendrik Treutler, Robert Winkler, and Fredd Vergara. 2019. "Effects of Water Availability in the Soil on Tropane Alkaloid Production in Cultivated Datura stramonium" Metabolites 9, no. 7: 131. https://doi.org/10.3390/metabo9070131