Identification and Quantification of Enniatins and Beauvericin in Animal Feeds and Their Ingredients by LC-QTRAP/MS/MS


Abstract
:
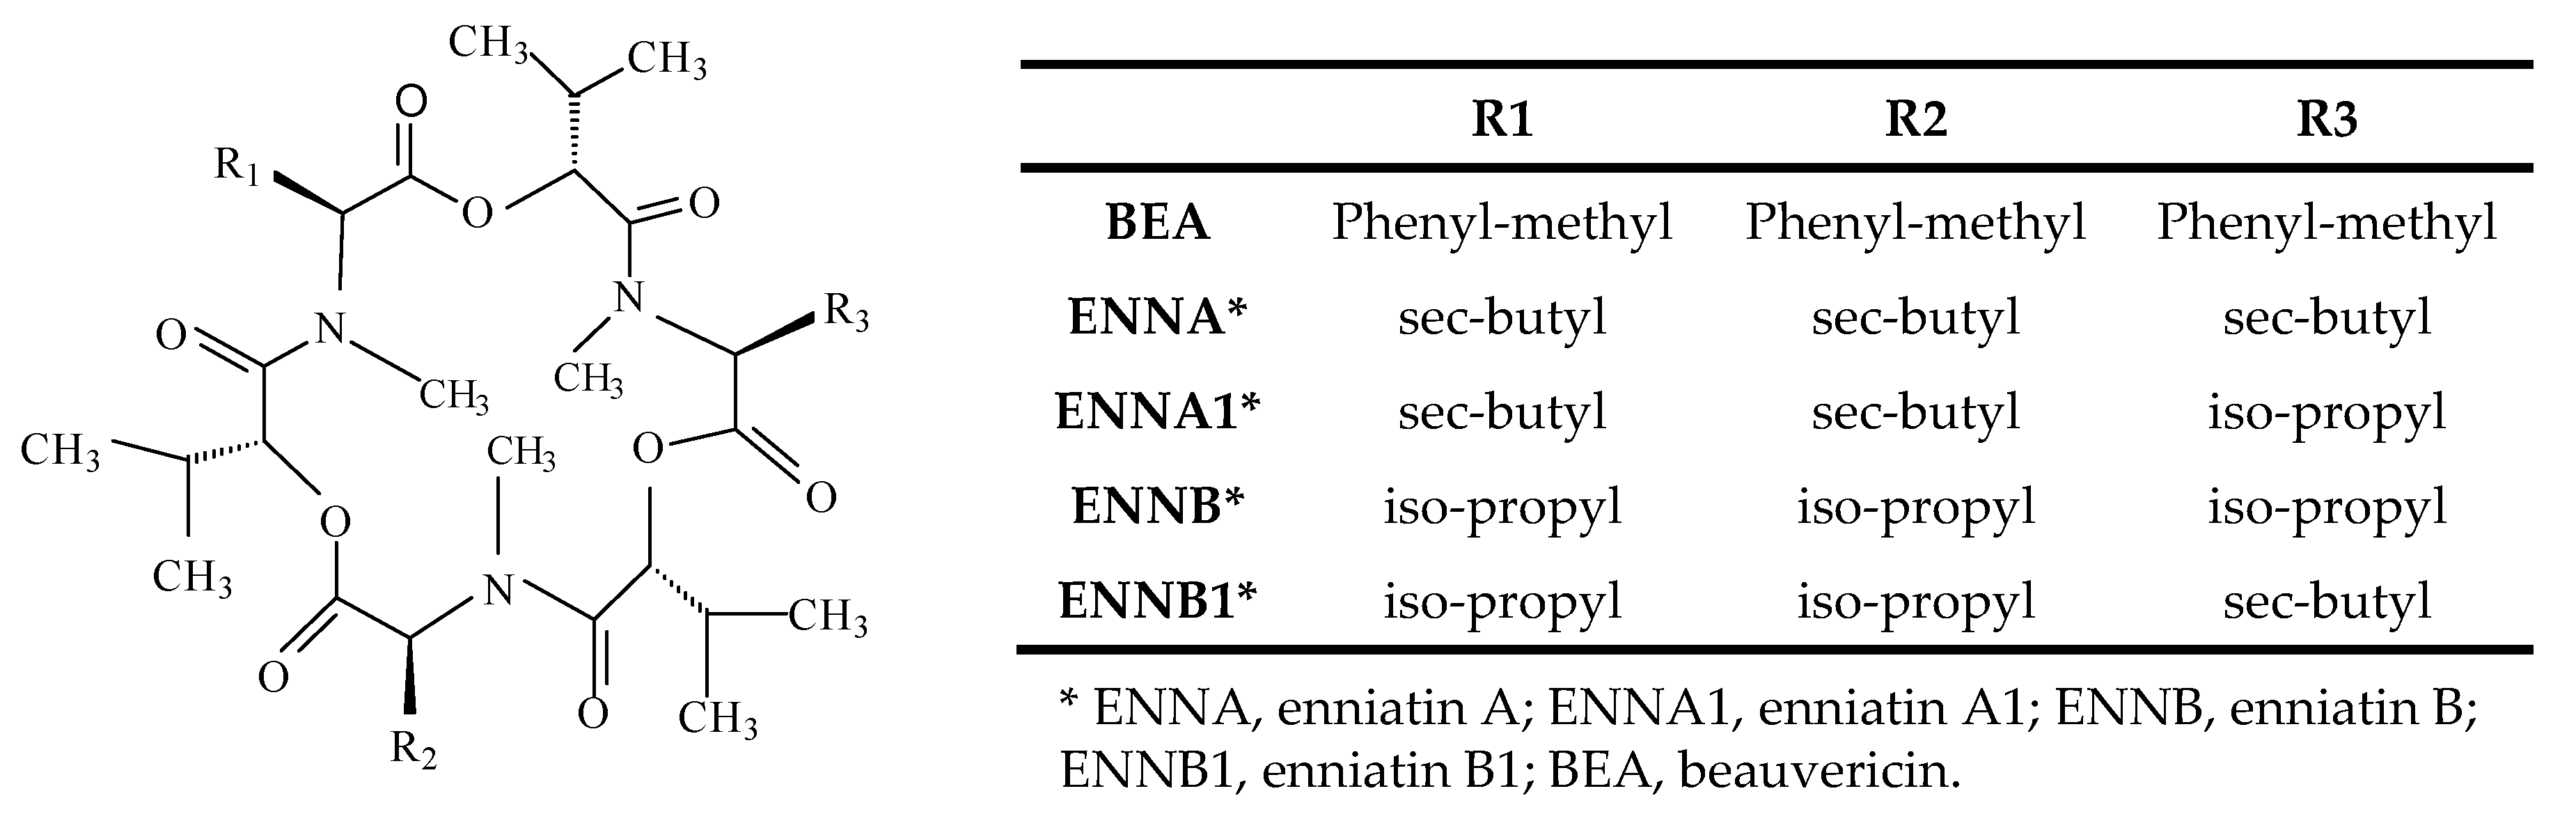
1. Introduction
2. Results and Discussion
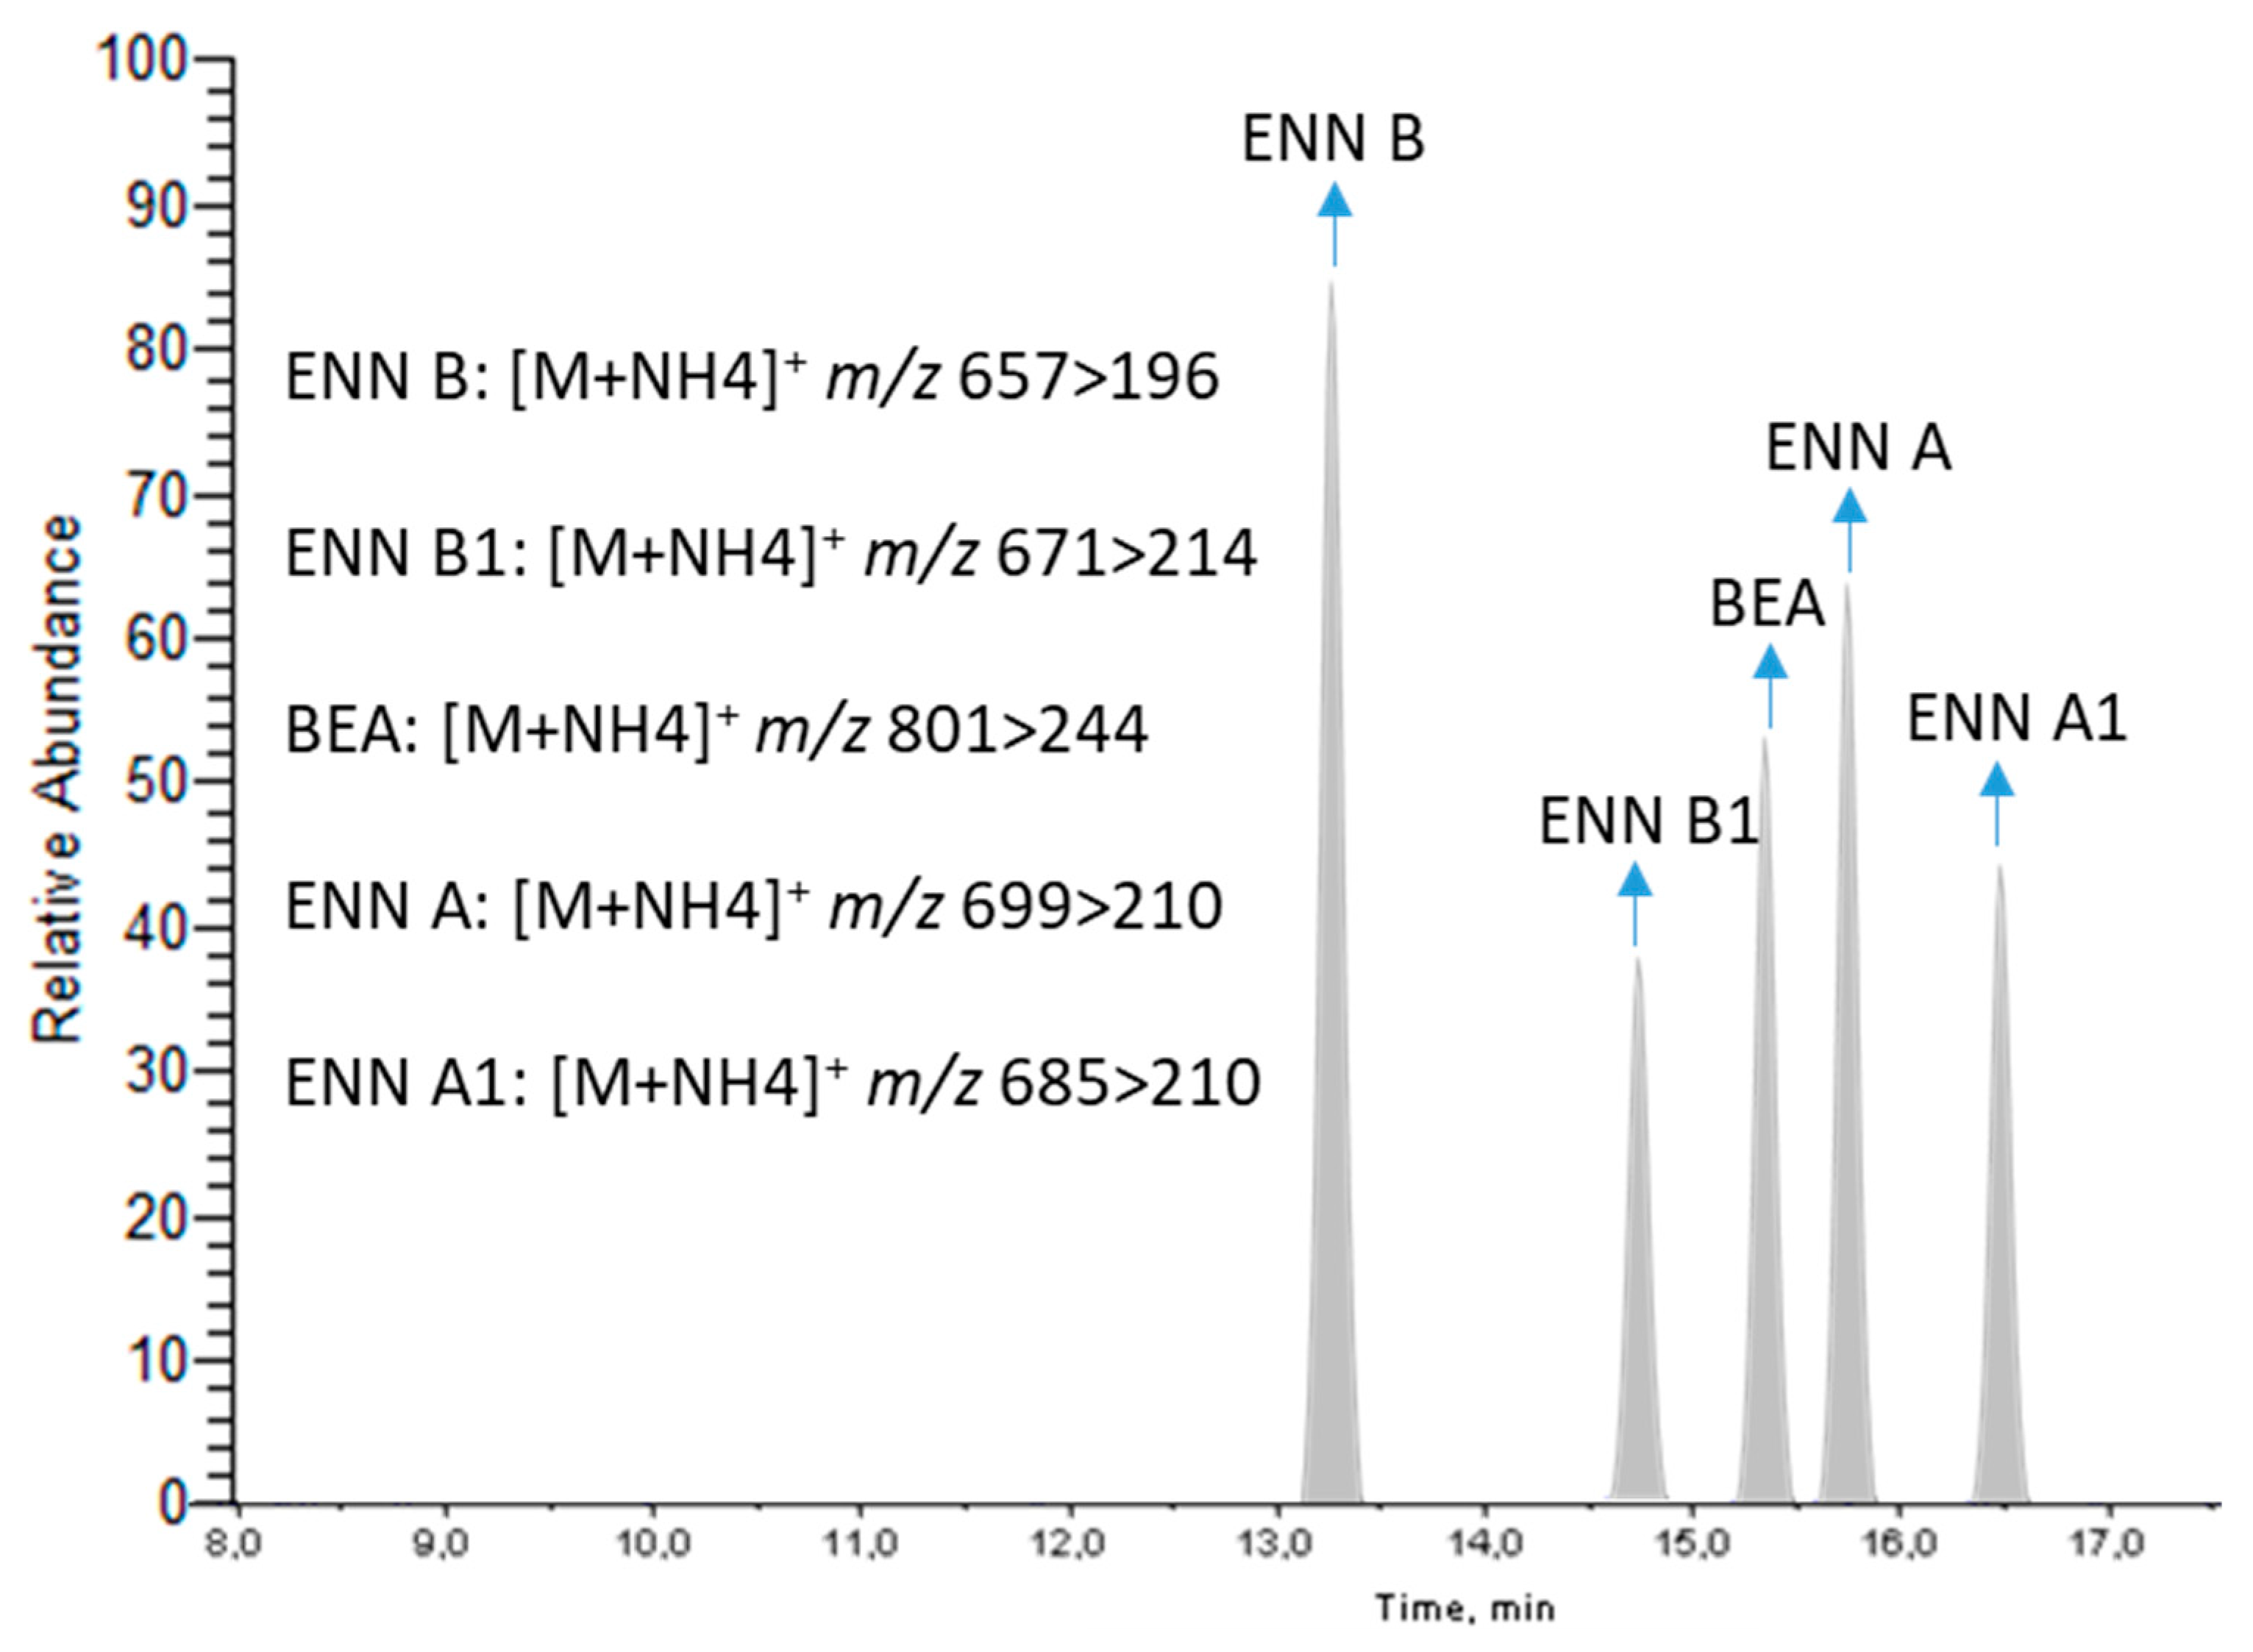
2.1. Instrumental Optimization
2.2. Method Validation
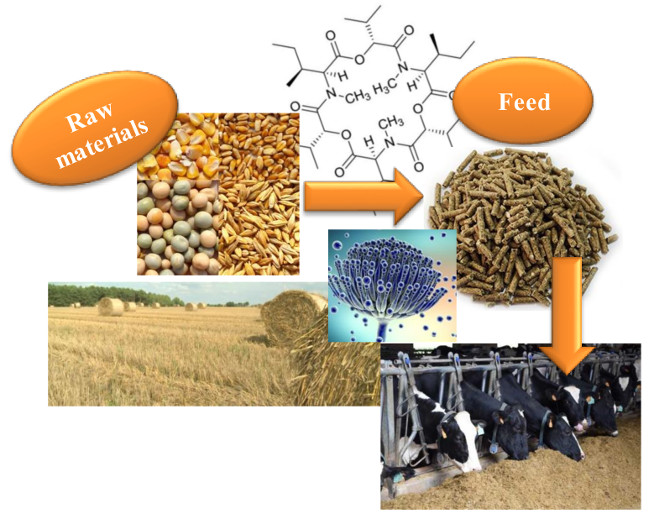
2.3. The Natural Occurrence of Mycotoxins in Raw Materials
2.4. Natural Occurrence of Mycotoxins in Feed
3. Materials and Methods
3.1. Sampling
3.2. Chemicals and Reagents
3.3. Preparation of Standard Solution and Spiking of Blank Samples
3.4. Sample Preparation
3.5. LC-MS/MS Equipment and Conditions
3.6. Method Validation and Quality Assurance/Quality Control (QA/QC)
3.7. Statistics and Data Analysis
4. Conclusions
Author Contributions
Funding
Conflicts of Interest
References
- Van Pamel, E.; Verbeken, A.; Vlaemynck, G.; De Boever, J.; Daeseleire, E. Ultrahigh-performance liquid chromatographic–tandem mass spectrometric multimycotoxin method for quantitating 26 mycotoxins in maize silage. J. Agric. Food Chem. 2011, 59, 9747–9755. [Google Scholar] [CrossRef] [PubMed]
- Uhlig, S.; Torp, M.; Heier, B.T. Beauvericin and enniatins A, A1, B and B1 in Norwegian grain: A survey. Food Chem. 2006, 94, 193–201. [Google Scholar] [CrossRef]
- Manning, B.B.; Abbas, H.K. The effect of Fusarium mycotoxins deoxynivalenol, fumonisin, and moniliformin from contaminated moldy grains on aquaculture fish. Toxin Rev. 2012, 31, 11–15. [Google Scholar] [CrossRef]
- Rodrigues, I.; Chin, L. A comprehensive survey on the occurrence of mycotoxins in maize dried distillers’ grain and solubles sourced worldwide. World Mycotoxin J. 2011, 5, 83–88. [Google Scholar] [CrossRef]
- Wu, F.; Munkvold, G.P. Mycotoxins in ethanol co-products: Modeling economic impacts on the livestock industry and management strategies. J. Agric. Food Chem. 2008, 56, 3900–3911. [Google Scholar] [CrossRef] [PubMed]
- Tolosa, J.; Font, G.; Mañes, J.; Ferrer, E. Nuts and dried fruits: Natural occurrence of emerging Fusarium mycotoxins. Food Control 2013, 33, 215–220. [Google Scholar] [CrossRef]
- Hu, L.; Koehler, P.; Rychlik, M. Effect of sourdough processing and baking on the content of enniatins and beauvericin in wheat and rye bread. Eur. Food Res. Technol. 2014, 238, 581–587. [Google Scholar] [CrossRef]
- Vaclavikova, M.; Malachova, A.; Veprikova, Z.; Dzuman, Z.; Zachariasova, M.; Hajslova, J. Emerging mycotoxins in cereals processing chains: Changes of enniatins during beer and bread making. Food Chem. 2013, 136, 750–757. [Google Scholar] [CrossRef]
- Marin, S.; Ramos, A.J.; Cano-Sancho, G.; Sanchis, V. Mycotoxins: Occurrence, toxicology, and exposure assessment. Food Chem. Toxicol. 2013, 60, 218–237. [Google Scholar] [CrossRef]
- Singh, S.D.; Chuturgoon, A.A. A comparative analysis of mycotoxin contamination of supermarket and premium brand pelleted dog food in Durban, South Africa. J. S. Afr. Vet. Assoc. 2017, 88, 1–6. [Google Scholar] [CrossRef]
- Bryden, W.L. Mycotoxin contamination of the feed supply chain: Implications for animal productivity and feed security. Anim. Feed Sci. Technol. 2012, 173, 134–158. [Google Scholar] [CrossRef]
- Cheli, F.; Pinotti, L.; Rossi, L.; Dell’Orto, V. Effect of milling procedures on mycotoxin distribution in wheat fractions: A review. LWT-Food Sci. Technol. 2013, 54, 307–314. [Google Scholar] [CrossRef]
- Binder, E.M. Managing the risk of mycotoxins in modern feed production. Anim. Feed Sci. Technol. 2007, 133, 149–166. [Google Scholar] [CrossRef]
- Binder, E.; Tan, L.; Chin, L.; Handl, J.; Richard, J. Worldwide occurrence of mycotoxins in commodities, feeds and feed ingredients. Anim. Feed Sci. Technol. 2007, 137, 265–282. [Google Scholar] [CrossRef]
- Rodrigues, I.; Naehrer, K. A three-year survey on the worldwide occurrence of mycotoxins in feedstuffs and feed. Toxins 2012, 4, 663–675. [Google Scholar] [CrossRef] [PubMed]
- Streit, E.; Schatzmayr, G.; Tassis, P.; Tzika, E.; Marin, D.; Taranu, I.; Tabuc, C.; Nicolau, A.; Aprodu, I.; Puel, O.; et al. Current situation of mycotoxin contamination and co-occurrence in animal feed—Focus on Europe. Toxins 2012, 4, 788–809. [Google Scholar] [CrossRef]
- Streit, E.; Schwab, C.; Sulyok, M.; Naehrer, K.; Krska, R.; Schatzmayr, G. Multi-mycotoxin screening reveals the occurrence of 139 different secondary metabolites in feed and feed ingredients. Toxins 2013, 5, 504–523. [Google Scholar] [CrossRef]
- Nizza, A.; Piccolo, G. Chemical-nutritional characteristics of diets in aquaculture. Vet. Res. Commun. 2009, 33, 25–30. [Google Scholar] [CrossRef]
- World Health Organization; International Agency for Research on Cancer. Some naturally occurring substances: Food items and constituents, heterocyclic aromatic amines and mycotoxins. In IARC Monographs on the Evaluation of Carcinogenic Risks to Humans; WHO: Geneva, Switzerland, 1993; Volume 56, pp. 489–521. [Google Scholar]
- European Commission. Commission Directive 2003/100/EC of 31 October 2003 amending Annex I to Directive 2002/32/EC of the European Parliament and of the Council on undesirable substances in animal feed. Off. J. Eur. Union 2003, 285, 33–37. [Google Scholar]
- European Commission. Commission Recommendation 2006/576/EC of 17 August 2006 on the presence of deoxynivalenol, zearalenone, ochratoxin A, T-2 and HT-2 and fumonisins in products intended for animal feeding. Off. J. Eur. Union 2006, 229, 7–9. [Google Scholar]
- European Commission. Commission Recommendation No 2013/165/EU of 27 March 2013 on the presence of T-2 and HT-2 toxin in cereals and cereal products. Off. J. Eur. Union 2013, 91, 12–15. [Google Scholar]
- Cheli, F.; Battaglia, D.; Gallo, R.; Dell’Orto, V. EU legislation on cereal safety: An update with a focus on mycotoxins. Food Control 2014, 37, 315–325. [Google Scholar] [CrossRef]
- EFSA Panel of Contaminants in the Food Chain (CONTAM). Scientific Opinion on the risks to human and animal health related to the presence of beauverivin and enniatins in food and feed. EFSA J. 2014, 12, 3802. [Google Scholar] [CrossRef]
- Sørensen, J.L.; Nielsen, K.F.; Rasmussen, P.H.; Thrane, U. Development of a LC-MS/MS method for the analysis of enniatins and beauvericin in whole fresh and ensiled maize. J. Agric. Food Chem. 2008, 56, 10439–10443. [Google Scholar] [CrossRef] [PubMed]
- Warth, B.; Parich, A.; Atehnkeng, J.; Bandyopadhyay, R.; Schuhmacher, R.; Sulyok, M.; Krska, R. Quantitation of mycotoxins in food and feed from Burkina Faso and Mozambique using a modern LC-MS/MS multitoxin method. J. Agric. Food Chem. 2012, 60, 9352–9363. [Google Scholar] [CrossRef] [PubMed]
- Zachariasova, M.; Dzuman, Z.; Veprikova, Z.; Hajkova, K.; Jiru, M.; Vaclavikova, M.; Zachariasova, A.; Pospichalova, M.; Florian, M.; Hajslova, J. Occurrence of multiple mycotoxins in European feedingstuffs, assessment of dietary intake by farm animals. Anim. Feed Sci. Technol. 2014, 193, 124–140. [Google Scholar] [CrossRef]
- Markov, K.; Pleadin, J.; Bevardi, M.; Vahčić, N.; Sokolić-Mihalak, D.; Frece, J. Natural occurrence of aflatoxin B1, ochratoxin A and citrinin in Croatian fermented meat products. Food Control 2013, 34, 312–317. [Google Scholar] [CrossRef]
- Prosperini, A.; Juan-García, A.; Font, G.; Ruiz, M.J. Beauvericin-induced cytotoxicity via ROS production and mitochondrial damage in Caco-2 cells. Toxicol. Lett. 2013, 222, 204–211. [Google Scholar] [CrossRef]
- Prosperini, A.; Juan-García, A.; Font, G.; Ruiz, M.J. Reactive oxygen species involvement in apoptosis and mitochondrial damage in Caco-2 cells induced by enniatins A, A1, B and B1. Toxicol. Lett. 2013, 222, 36–44. [Google Scholar] [CrossRef]
- European Commission. Commission decision 2002/657/EC of 12 August 2002 implementing Council directive 96/23/EC concerning the performance of analytical methods and the interpretation of results. Off. J. Eur. Community 2002, 221, L221–L228. Available online: http://data.europa.eu/eli/dec/2002/657/oj (accessed on 18 October 2018).
- European Commission. Health and Food Safety Directorate-General (DG SANTE); Guidance Document on Identification of Mycotoxin in Food and Feed; SANTE/12089/2016; European Commission 2016–DG SANTE; European Commission: Bruxelles, Belgium, 2016; Available online: https://ec.europa.eu/food/sites/food/files/safety/docs/cs_contaminants_sampling_guid-doc-ident-mycotoxins.pdf (accessed on 18 October 2018).
- Mortensen, A.; Granby, K.; Eriksen, F.D.; Cederberg, T.L.; Friis-Wandall, S.; Simonsen, Y.; Broesbøl-Jensen, B.; Bonnichsen, R. Levels and risk assessment of chemical contaminants in byproducts for animal feed in Denmark. J. Environ. Sci. Health Part B 2014, 49, 797–810. [Google Scholar] [CrossRef]
- Shimshoni, J.A.; Cuneah, O.; Sulyok, M.; Krska, R.; Galon, N.; Sharir, B.; Shlosberg, A. Mycotoxins in corn and wheat silage in Israel. Food Addit. Contam. Part A 2013, 30, 1614–1625. [Google Scholar] [CrossRef]
- Jestoi, M.; Rokka, M.; Yli-Mattila, T.; Parikka, P.; Rizzo, A.; Peltonen, K. Presence and concentrations of the Fusarium-related mycotoxins beauvericin, enniatins and moniliformin in Finnish grain samples. Food Addit. Contam. 2004, 21, 794–802. [Google Scholar] [CrossRef] [PubMed]
- Habler, K.; Rychlik, M. Multi-mycotoxin stable isotope dilution LC-MS/MS method for Fusarium toxins in cereals. Anal. Bioanal. Chem. 2016, 408, 307–317. [Google Scholar] [CrossRef] [PubMed]
- Lee, K.E.; Kim, B.H.; Lee, C. Occurrence of Fusarium mycotoxin beauvericin in animal feeds in Korea. Anim. Feed Sci. Technol. 2010, 157, 190–194. [Google Scholar] [CrossRef]
- Tolosa, J.; Font, G.; Mañes, J.; Ferrer, E. Presencia de micotoxinas de Fusarium en pescado de acuicultura. Rev. Toxicol. 2013, 30, 193–197. [Google Scholar]
- Humpf, H.U.; Voss, K.A. Effects of thermal food processing on the chemical structure and toxicity of fumonisin mycotoxins. Mol. Nutr. Food Res. 2004, 48, 255–269. [Google Scholar] [CrossRef]
- Rodríguez-Carrasco, Y.; Faus, E.; Font, G.; Berrada, H. Determinación de micotoxinas en rosquilletas, un tipo de pan especial típico de la Comunidad Valenciana. Rev. Toxicol. 2013, 30, 54. [Google Scholar]
- Oplatowska-Stachowiak, M.; Haughey, S.A.; Chevallier, O.P.; Galvin-King, P.; Campbell, K.; Magowan, E.; Adam, G.; Berthiller, F.; Krska, R.; Elliott, C.T. Determination of the Mycotoxin Content in Distiller’s Dried Grain with Solubles Using a Multianalyte UHPLC–MS/MS Method. J. Agric. Food Chem. 2015, 63, 9441–9451. [Google Scholar] [CrossRef]
- Nácher-Mestre, J.; Serrano, R.; Beltrán, E.; Pérez-Sánchez, J.; Silva, J.; Karalazos, V.; Hernández, F.; Berntssen, M. Occurrence and potential transfer of mycotoxins in gilthead sea bream and Atlantic salmon by use of novel alternative feed ingredients. Chemosphere 2015, 128, 314–320. [Google Scholar] [CrossRef]
- Tolosa, J.; Font, G.; Manes, J.; Ferrer, E. Natural occurrence of Fusarium mycotoxins in aquaculture fish food. Rev. Toxicol. 2013, 30, 193–197. [Google Scholar]
- Prosperini, A.; Berrada, H.; Ruiz, M.J.; Caloni, F.; Coccini, T.; Spicer, L.J.; Perego, M.C.; Lafranconi, A. A review of the mycotoxin enniatin B. Front. Public Health 2017, 5, 304. [Google Scholar] [CrossRef] [PubMed]


| Mycotoxin | RT (min) | Precursor Ion | Product Ions | DPc (V) | CEd (V) | CXPe (V) |
|---|---|---|---|---|---|---|
| ENN A | 15.8 | 699.400 | 228qa/210Qb | 76/76 | 59/35 | 16/14 |
| ENN A1 | 16.5 | 685.400 | 214qa/210Qb | 66/66 | 59/37 | 10/8 |
| ENN B | 13.3 | 657.300 | 214qa/196Qb | 51/51 | 59/39 | 10/8 |
| ENN B1 | 14.7 | 671.200 | 228qa/214Qb | 66/66 | 57/61 | 12/10 |
| BEA | 15.3 | 801.200 | 784Qa /244qb | 116/116 | 39/27 | 6/10 |
| Parameters | Recovery, % (RSDR, %; n = 9) | LOD | LOQ | ||
|---|---|---|---|---|---|
| LOQ (ng/g) | 10xLOQ (ng/g) | 100xLOQ (ng/g) | (ng/g) | (ng/g) | |
| ENN A | 95 (12) | 112 (10) | 93 (8) | 1.0 | 5.0 |
| ENN A1 | 91 (8) | 95 (9) | 89 (6) | 0.2 | 1.0 |
| ENN B | 89 (9) | 98 (8) | 97 (5) | 0.2 | 1.0 |
| ENN B1 | 98 (10) | 105 (9) | 94 (7) | 0.2 | 1.0 |
| BEA | 86 (7) | 136 (15) | 117 (12) | 1.0 | 5.0 |
| Raw Material (Number of Samples) | ENN A | ENN A1 | ENN B | ENN B1 | BEA |
|---|---|---|---|---|---|
| Wheat (n = 3) | nd | nd | 50.2 (50.2) | 36.3 (36.3) | nd |
| Maize (n = 2) | nd | nd | nd | nd | nd |
| Alfalfa (n = 3) | nd | nd | 75.6 (75.6) | 113.2 (113.2) | 6.0 (6.0) |
| Sugar beet pulp (n = 1) | nd | nd | nd | nd | 3.0 (3.0) |
| Barley (n = 10) | nd | nd | 1.3 (1.3) | nd | nd |
| Rice bran (n = 4) | nd | nd | nd | nd | 64.8 (64.8) |
| Corn pulp (n = 4) | nd | nd | 1.8 (1.3–2.2) | nd | 29 (20.4–37.8) |
| Meals (n = 7) | nd | nd | nd | nd | nd |
| Gluten feed (n = 5) | nd | nd | nd | nd | nd |
| Animal Specie (Number of Samples) | ENN A | ENN A1 | ENN B | ENN B1 | BEA |
|---|---|---|---|---|---|
| Bovine (n = 8) | nd | 9.7 (8.5–10.7) | 24.1 (2.4–41.6) | 15.2 (10.8–20.2) | 27.4 (20.7–51.4) |
| Ovine (n = 13) | nd | 10.2 (8.1–13.1) | 32.4 (2.0–89.5) | 16.7 (9.4–28.8) | 32.6 (8.1–129.6) |
| Caprine (n = 1) | nd | 8.4 (8.2–8.5) | 16.8 (8.3–23.9) | 12.7 (10.8–15.0) | 13.9 (4.6–23.2) |
| Horses (n = 3) | nd | 9.4 (8.7–10.1) | 21.8 (6.0–43.8) | 13.6 (10.0–15.5) | 19.0 (8.2–29.8) |
| Porcine (n = 4) | nd | 10.5 (9.1–11.9) | 32.2 (22.1–55.1) | 17.0 (14.1–24.0) | 10.2 (5.7–14.6) |
| Poultry (n = 11) | nd | 9.7 (8.1–11.9) | 18.4 (3.0–51.1) | 15.3 (7.4–23.1) | 15.8 (8.1–23.8) |
| Rabbits (n = 2) | nd | 11.8 (11.8) | 47.4 (44.5–50.3) | 23.5 (23.3–23.6) | 13.5 (13.5) |
| Dogs (n = 3) | nd | nd | 15.4 (7.5–24.8) | 10.1 (10.1) | 30.9 (21.3–40.5) |
| Cats (n = 3) | nd | nd | 6.7 (6.7) | 8.9 (8.9) | nd |
© 2019 by the authors. Licensee MDPI, Basel, Switzerland. This article is an open access article distributed under the terms and conditions of the Creative Commons Attribution (CC BY) license (http://creativecommons.org/licenses/by/4.0/).
Share and Cite
Tolosa, J.; Rodríguez-Carrasco, Y.; Ferrer, E.; Mañes, J. Identification and Quantification of Enniatins and Beauvericin in Animal Feeds and Their Ingredients by LC-QTRAP/MS/MS. Metabolites 2019, 9, 33. https://doi.org/10.3390/metabo9020033
Tolosa J, Rodríguez-Carrasco Y, Ferrer E, Mañes J. Identification and Quantification of Enniatins and Beauvericin in Animal Feeds and Their Ingredients by LC-QTRAP/MS/MS. Metabolites. 2019; 9(2):33. https://doi.org/10.3390/metabo9020033
Chicago/Turabian StyleTolosa, Josefa, Yelko Rodríguez-Carrasco, Emilia Ferrer, and Jordi Mañes. 2019. "Identification and Quantification of Enniatins and Beauvericin in Animal Feeds and Their Ingredients by LC-QTRAP/MS/MS" Metabolites 9, no. 2: 33. https://doi.org/10.3390/metabo9020033