Untargeted Metabolomics Reveal Defensome-Related Metabolic Reprogramming in Sorghum bicolor against Infection by Burkholderia andropogonis

 , , and
Abstract
:
1. Introduction
2. Results
2.1. Bacterial Leaf Stripe Symptom Progression and Evaluation
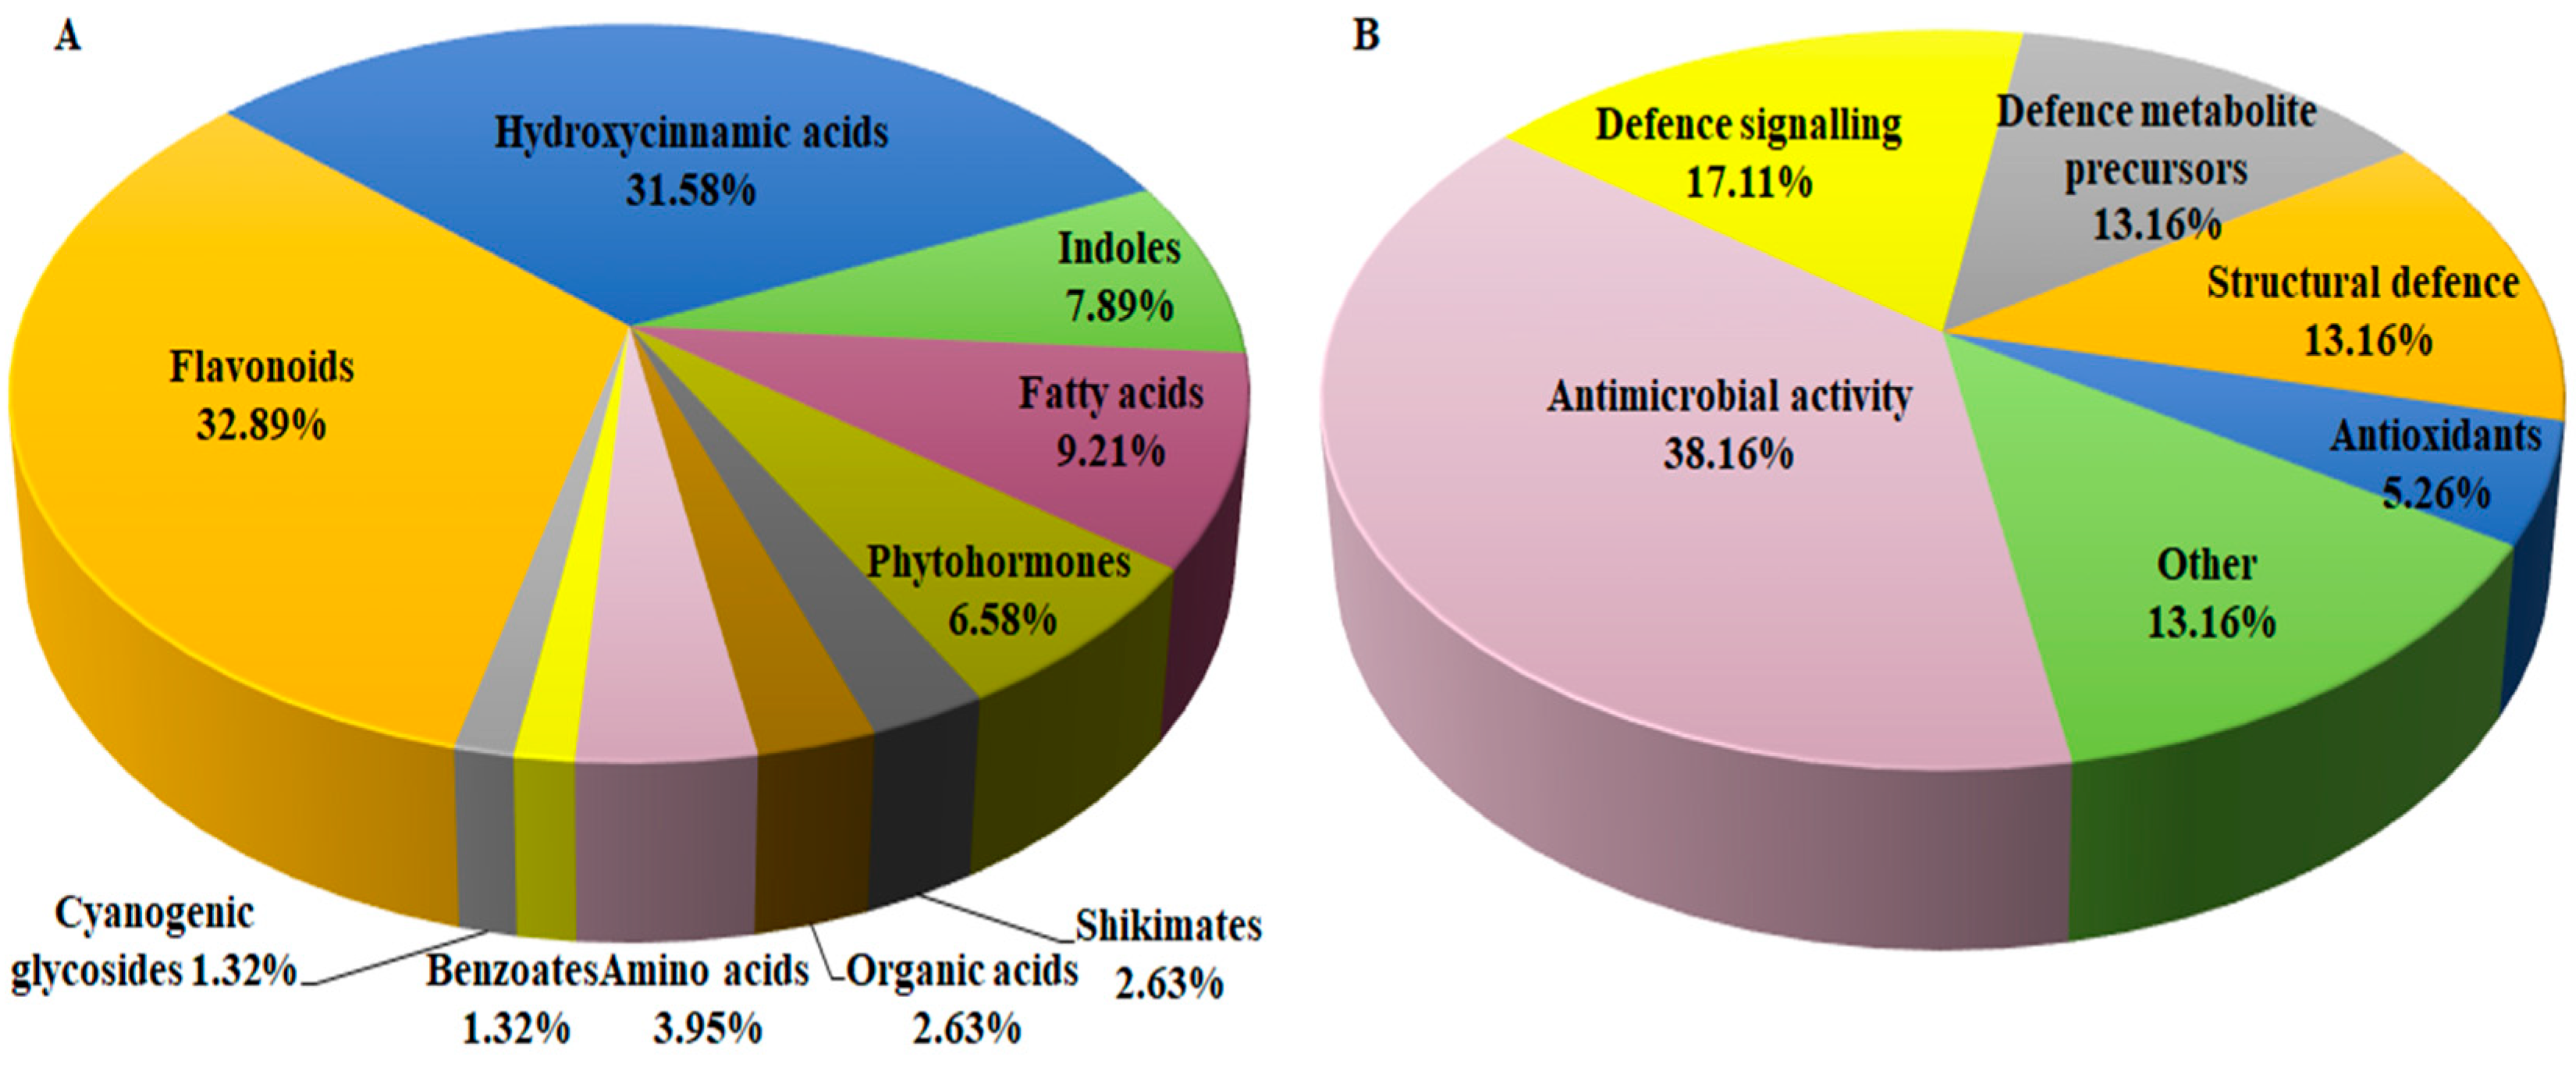
2.2. UHPLC-MS Analyses of Sorghum Leaf Extracts
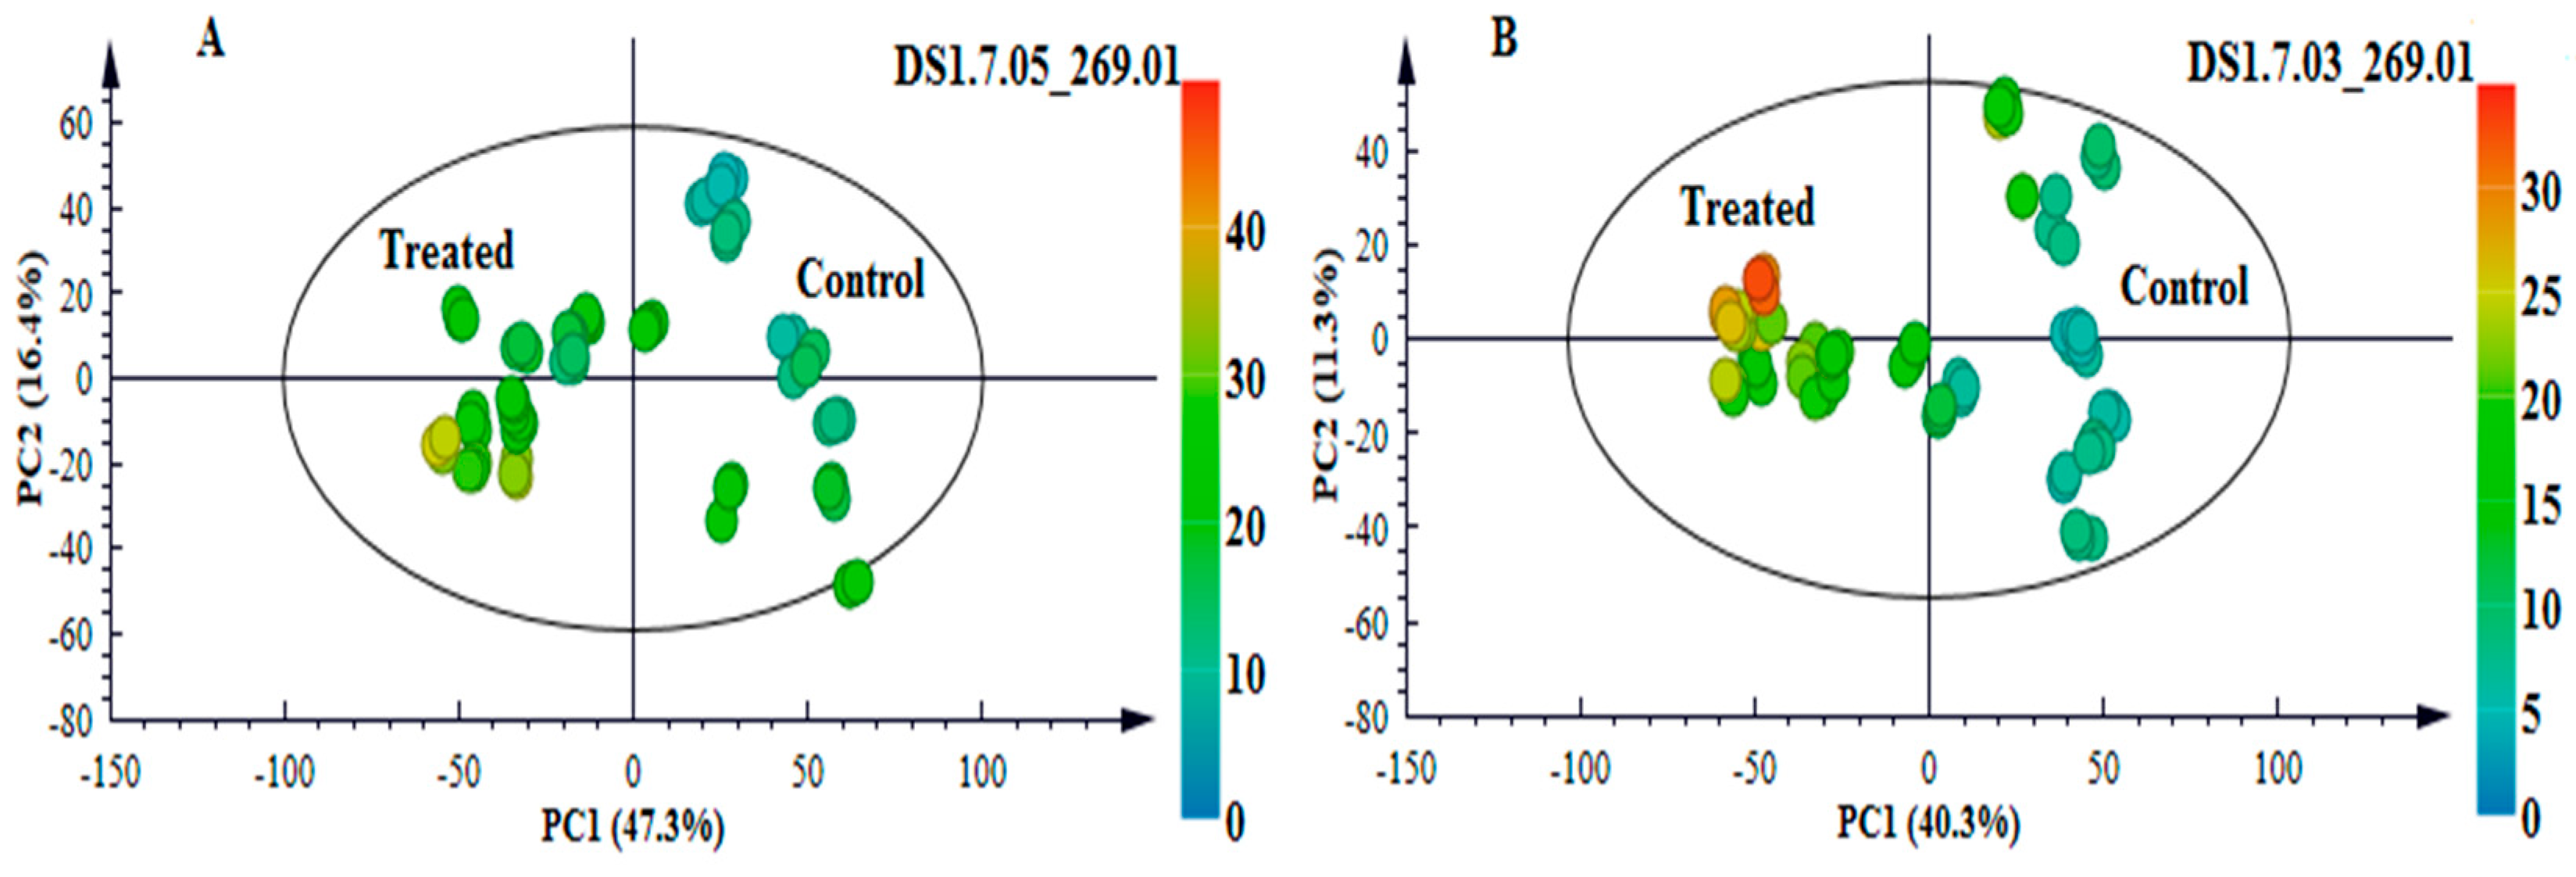
2.3. Multivariate Data Analyses: Statistical Description and Explanation of Variation in the Acquired LC-MS Data
3. Discussion
3.1. Metabolic Reprogramming of Primary and Secondary Metabolism—The Role of Aromatic Amino Acids in Pathogen-Induced Stress Responses
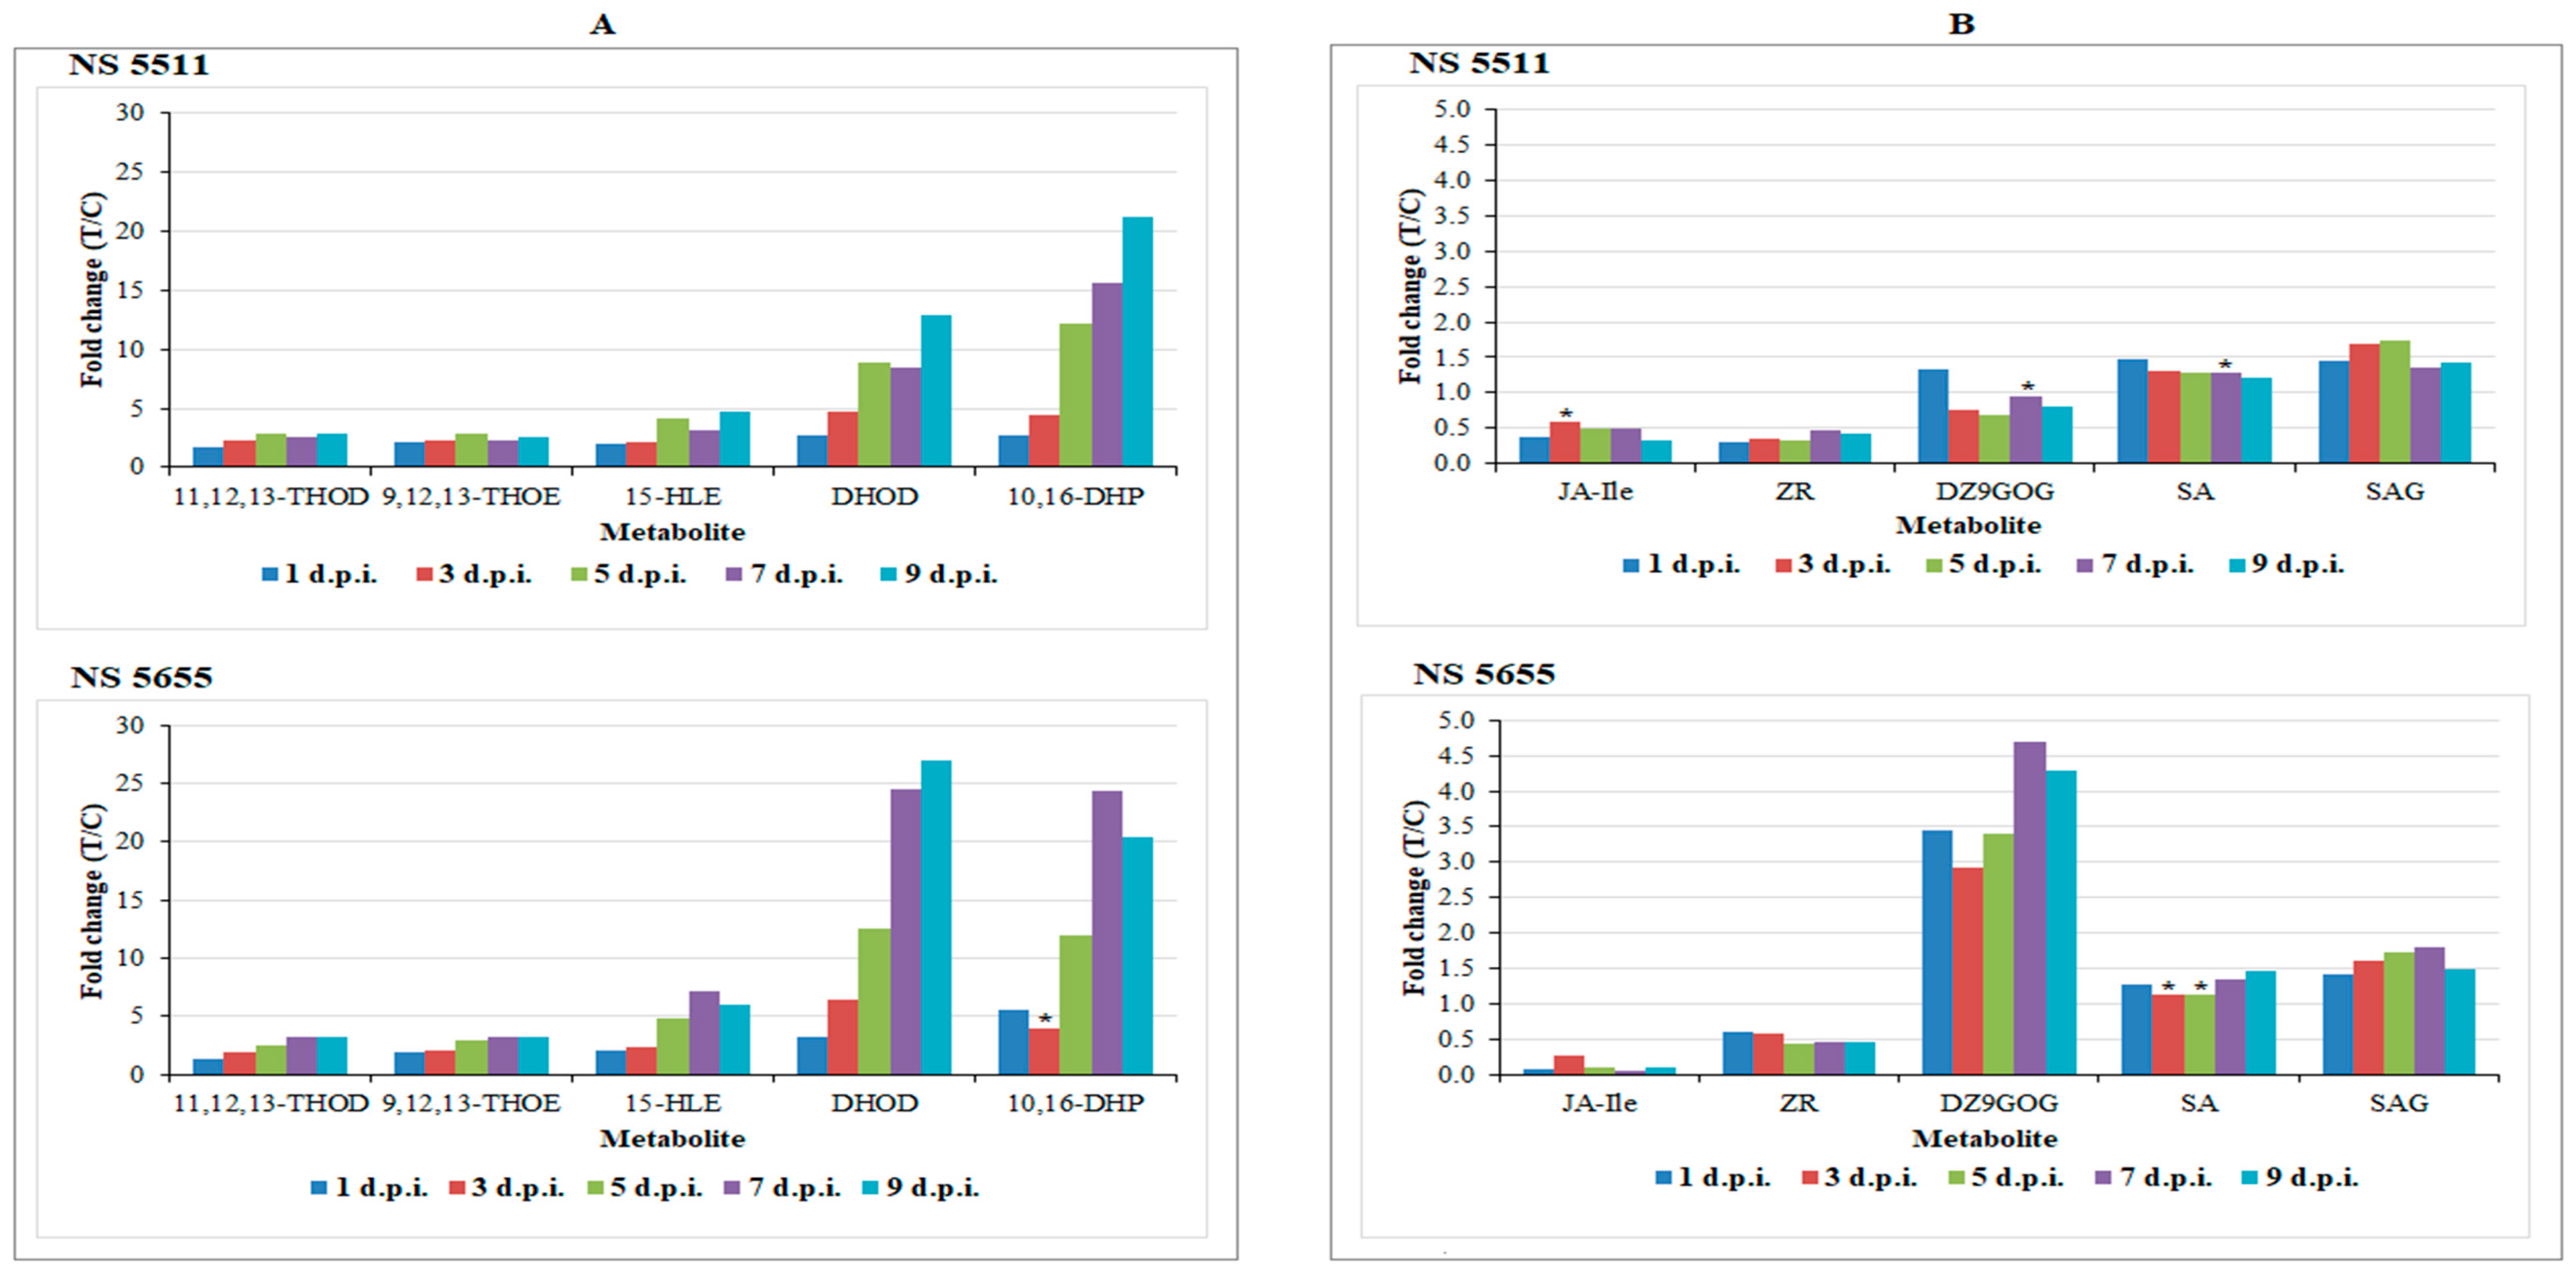
3.2. Differential Changes in Fatty Acid Metabolism
3.3. Plant Hormones: Regulatory and Signalling Molecules in Sorghum Defence Responses
3.4. Metabolic Reprogramming of Defence-Related Metabolites Derived from Shikimic Acid-, Phenylpropanoid- and Flavonoid Pathways
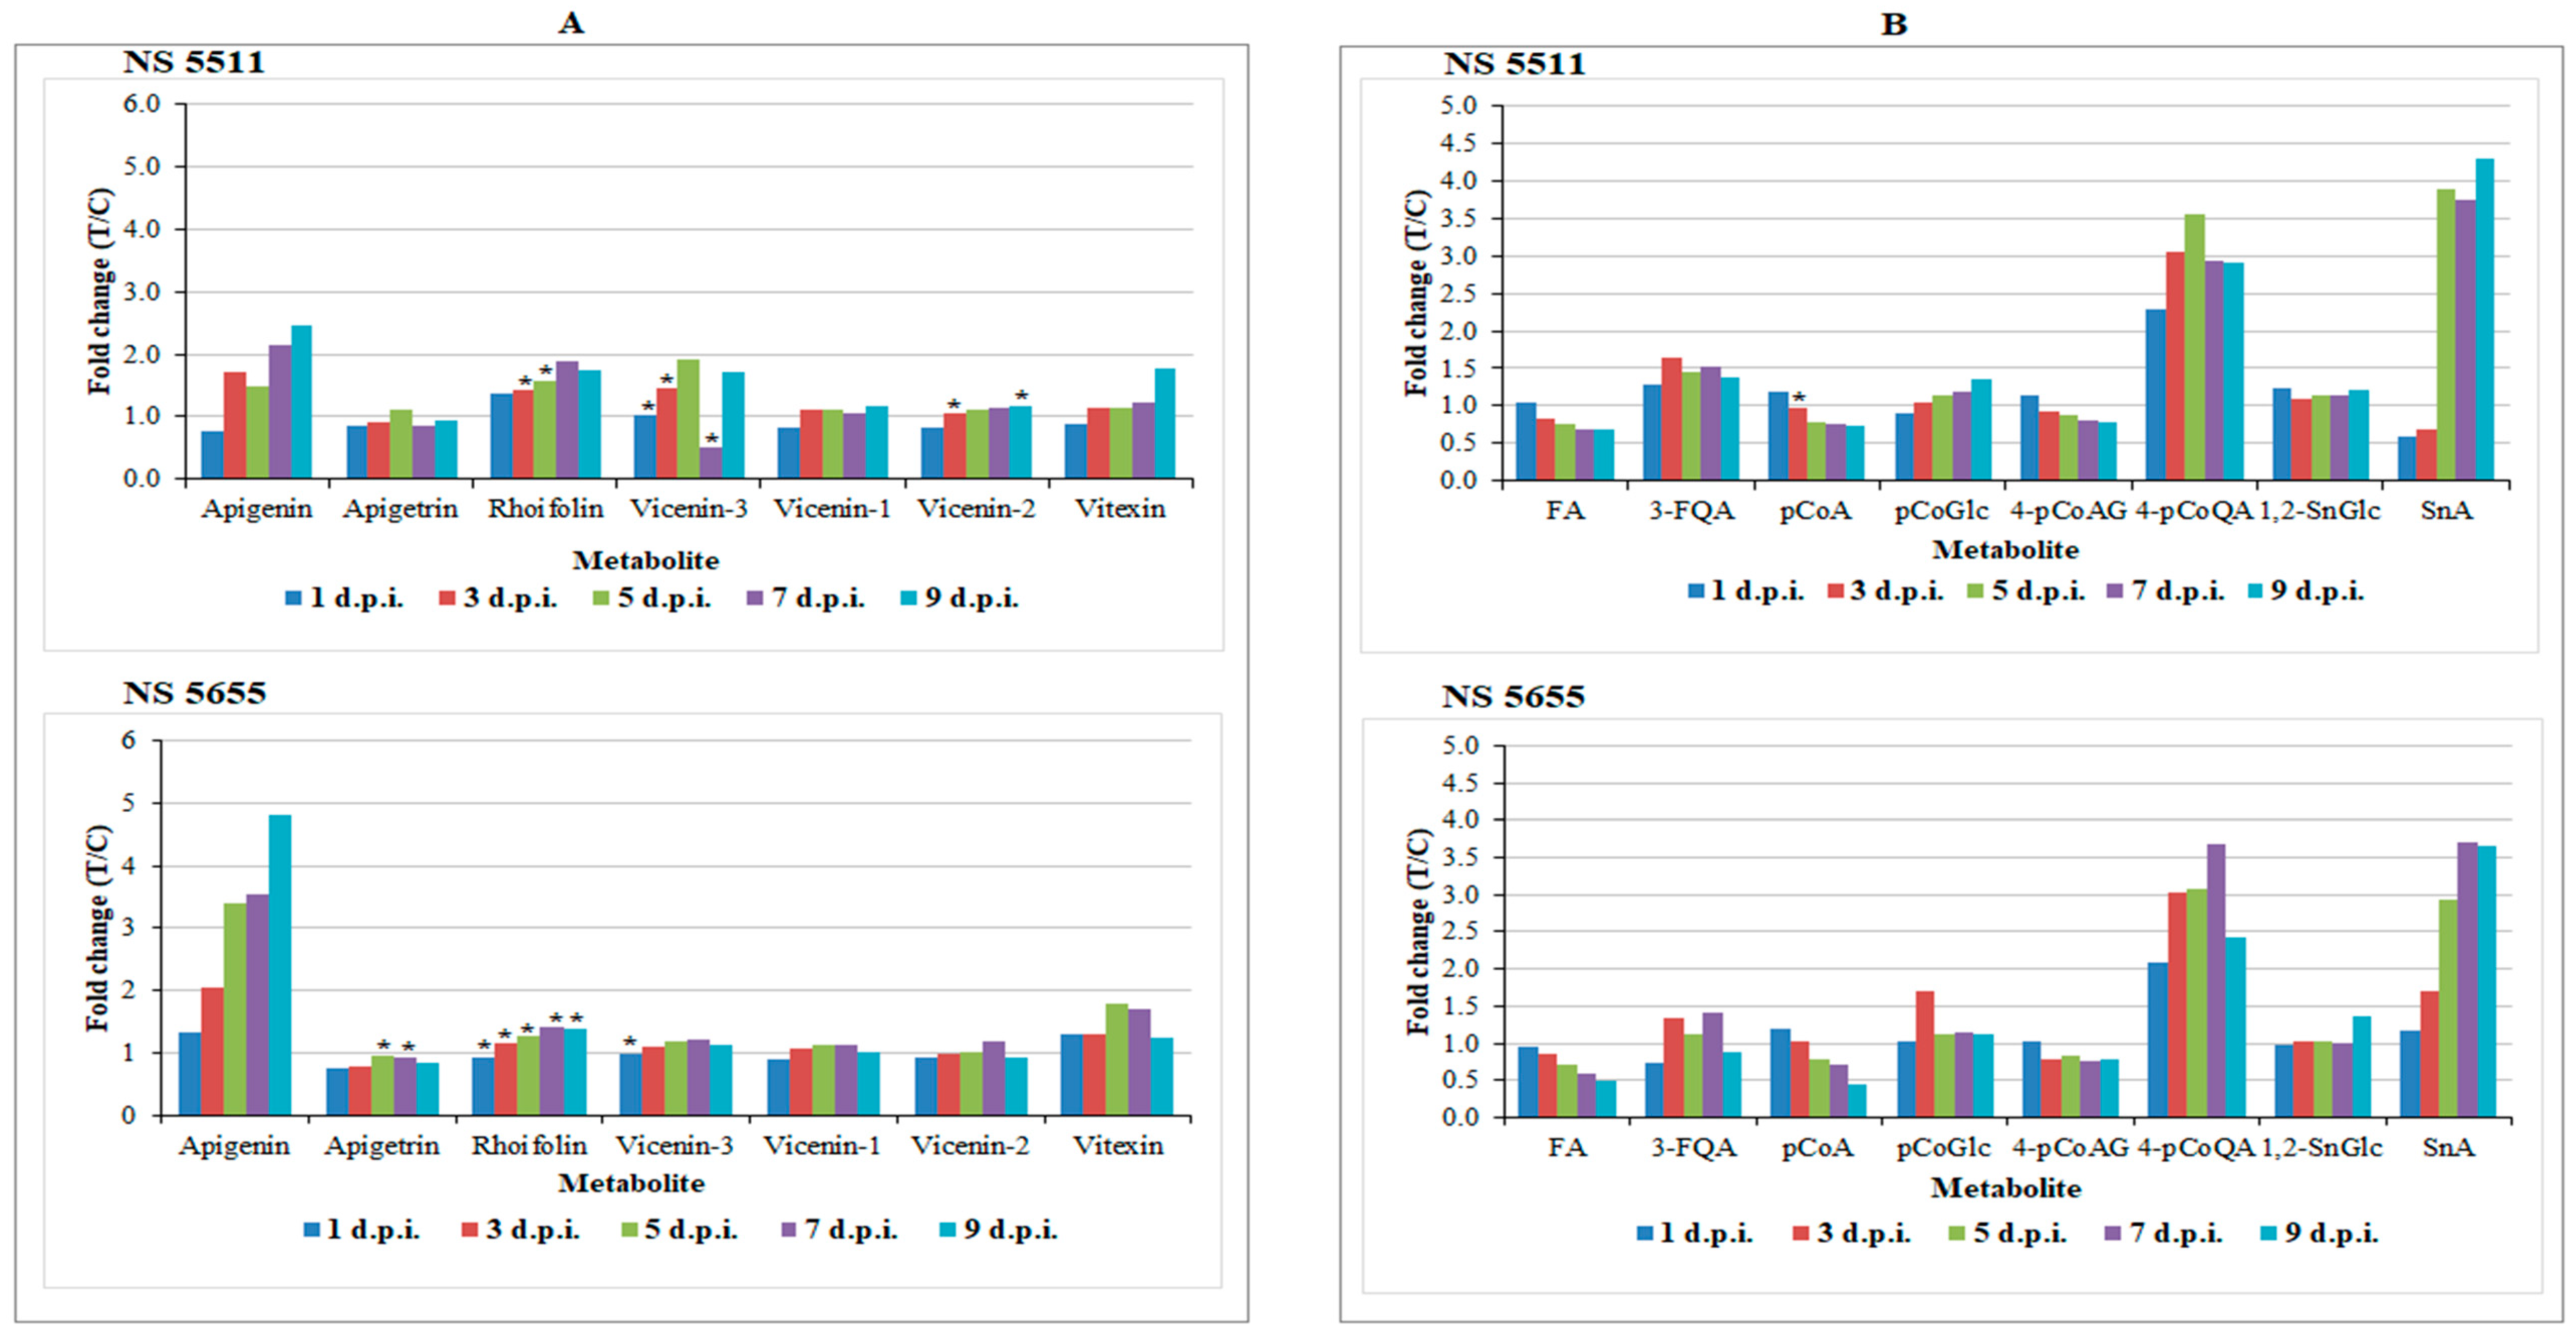
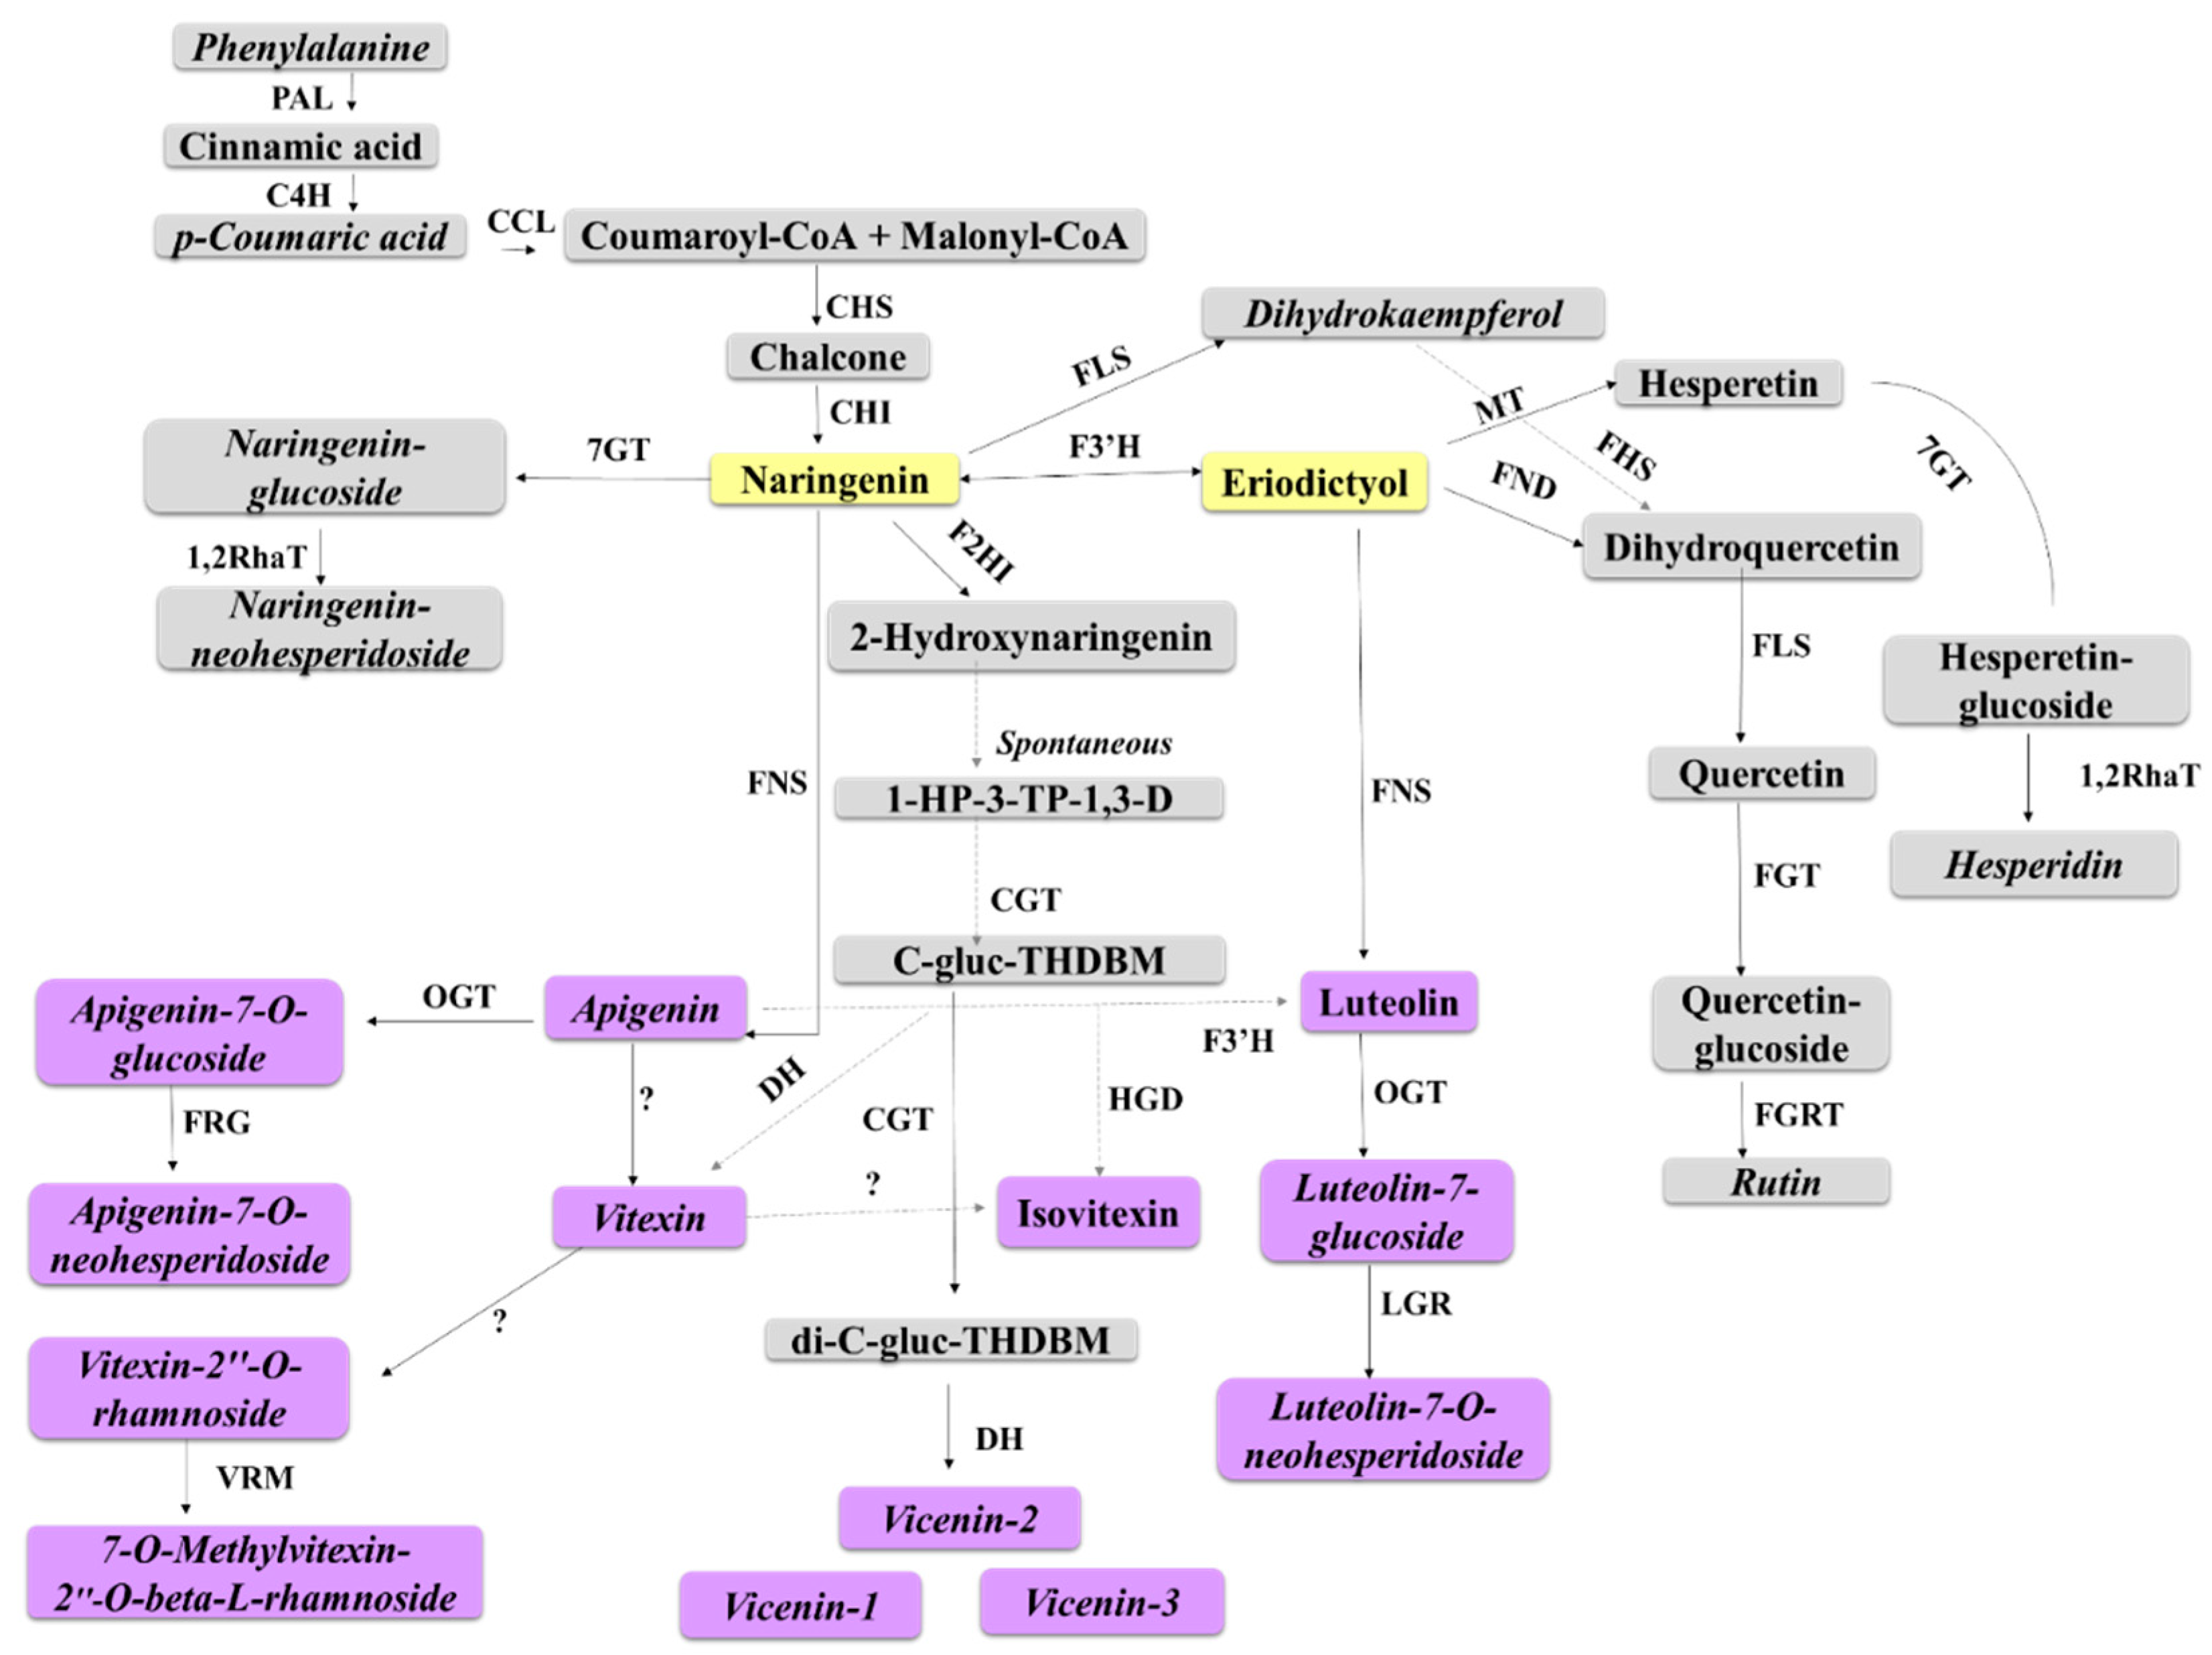
3.4.1. Flavonoids as Biomarkers in Sorghum Defence Responses
3.4.2. The Defensive Functions of Hydroxycinnamic Acids in Sorghum
4. Materials and Methods
4.1. Sorghum Plant Cultivation
4.2. Bacterial Suspension Preparation and Infection of Sorghum Seedlings
4.3. Metabolite Extraction and Pre-Analytical Sample Preparation
4.4. Ultra-High Performance Liquid Chromatography-High Definition Mass Spectrometry
4.5. Data Processing and Multivariate Data Analyses
4.6. Metabolite Annotation
5. Conclusions
Supplementary Materials
Author Contributions
Funding
Conflicts of Interest
Data Availability
References
- Navi, S.; Bandyopadhyay, R.; Devi, K.T.; Reddy, D. Bacterial leaf streak of sorghum—A new report from India. Int. Sorghum Millets Newslett. 2002, 43, 61–63. [Google Scholar]
- Bagsic, R.D.; Fegan, M.; Li, X.; Hayward, A.C. Construction of species-specific primers for Pseudomonas andropogonis based on 16S rDNA sequences. Lett. Appl. Microbiol. 1995, 21, 87–92. [Google Scholar] [CrossRef] [PubMed]
- Palleroni, N.J. Burkholderia. In Bergey’s Manual of Systematics of Archaea and Bacteria; Whitman, W.B., Ed.; Wiley Online Library: Hoboken, NY, USA, 2015; ISBN 9781118960608. [Google Scholar]
- Lopes-Santos, L.; Castro, D.B.A.; Ferreira-Tonin, M.; Corrêa, D.B.A.; Weir, B.S.; Park, D.; Ottoboni, L.M.M.; Neto, J.R.; Destéfano, S.A.L. Reassessment of the taxonomic position of Burkholderia andropogonis and description of Robbsia andropogonis gen. nov., comb. nov. Antonie Van Leeuwenhoek 2017, 110, 727–736. [Google Scholar] [CrossRef] [PubMed]
- Tenenboim, H.; Brotman, Y. Omic Relief for the biotically stressed: Metabolomics of plant biotic interactions. Trends Plant Sci. 2016, 21, 781–791. [Google Scholar] [CrossRef] [PubMed]
- Andolfo, G.; Ercolano, M.R. Plant innate immunity multicomponent model. Front. Plant Sci. 2015, 6, 987. [Google Scholar] [CrossRef] [PubMed]
- Misra, B.B.; Fahrmann, J.F.; Grapov, D. Review of emerging metabolomic tools and resources: 2015–2016. Electrophoresis 2017, 38. [Google Scholar] [CrossRef] [PubMed]
- Tugizimana, F.; Piater, L.A.; Dubery, I.A. Plant metabolomics: A new frontier in phytochemical analysis. S. Afr. J. Sci. 2013, 109, 18–20. [Google Scholar] [CrossRef]
- Tugizimana, F.; Steenkamp, P.A.; Piater, L.A.; Dubery, I.A. Multi-platform metabolomic analyses of ergosterol-induced dynamic changes in Nicotiana tabacum Cells. PLoS ONE 2014, 9, e87846. [Google Scholar] [CrossRef]
- Tugizimana, F.; Ncube, E.N.; Steenkamp, P.A.; Dubery, I.A. Metabolomics-derived insights into the manipulation of terpenoid synthesis in Centella asiatica cells by methyl jasmonate. Plant Biotechnol. Rep. 2015, 9, 125–136. [Google Scholar] [CrossRef]
- Mhlongo, M.I.; Steenkamp, P.A.; Piater, L.A.; Madala, N.E.; Dubery, I.A. Profiling of altered metabolomic states in Nicotiana tabacum cells induced by priming agents. Front. Plant Sci. 2016, 7, 1527. [Google Scholar] [CrossRef]
- Djami-Tchatchou, A.T.; Ncube, E.N.; Steenkamp, P.A.; Dubery, I.A. Similar, but different: Structurally related azelaic acid and hexanoic acid trigger differential metabolomic and transcriptomic responses in tobacco cells. BMC Plant Biol. 2017, 17, 227. [Google Scholar] [CrossRef] [PubMed]
- Kumari, A.; Parida, A.K. Metabolomics and network analysis reveal the potential metabolites and biological pathways involved in salinity tolerance of the halophyte Salvadora persica. Environ. Exp. Bot. 2018, 148, 85–99. [Google Scholar] [CrossRef]
- Little, C.R.; Perumal, R.; Tesso, T.; Prom, L.K.; Odvody, G.N.; Magill, C.W. Sorghum pathology and biotechnology—A fungal disease perspective: Part I. grain mold, head smut, and ergot. Eur. J. Plant Sci. Biotechnol. 2012, 6, 10–30. [Google Scholar]
- Mizuno, H.; Yazawa, T.; Kasuga, S.; Sawada, Y.; Kanamori, H.; Ogo, Y.; Hirai, M.Y.; Matsumoto, T.; Kawahigashi, H. Expression of flavone synthase II and flavonoid 3′-hydroxylase is associated with color variation in tan-colored injured leaves of sorghum. Front. Plant Sci. 2016, 7, 1718. [Google Scholar] [CrossRef] [PubMed]
- Tugizimana, F.; Steenkamp, P.A.; Piater, L.A.; Dubery, I.A. A conversation on data mining strategies in LC-MS untargeted metabolomics: Pre-processing and pre-treatment steps. Metabolites 2016, 6, 40. [Google Scholar] [CrossRef] [PubMed]
- Madsen, R.; Lundstedt, T.; Trygg, J. Chemometrics in metabolomics ‒ A review in human disease diagnosis. Anal. Chim. Acta 2010, 659, 23–33. [Google Scholar] [CrossRef]
- Alonso, A.; Marsal, S.; Juliã, A. Analytical methods in untargeted metabolomics: State of the art in 2015. Front. Bioeng. Biotechnol. 2015, 3, 23. [Google Scholar] [CrossRef]
- Yin, P.; Xu, G. Current state-of-the-art of nontargeted metabolomics based on liquid chromatography-mass spectrometry with special emphasis in clinical applications. J. Chromatogr. A 2014, 1374, 1–3. [Google Scholar] [CrossRef]
- Tugizimana, F.; Djami-Tchatchou, A.T.; Steenkamp, P.A.; Piater, L.A.; Dubery, I.A. Metabolomic analysis of defence-related reprogramming in Sorghum bicolor in response to Colletotrichum sublineolum infection reveals a functional metabolic web of phenylpropanoid and flavonoid pathways. Front. Plant Sci. 2018, 9, 1840. [Google Scholar] [CrossRef]
- Finnegan, T.; Steenkamp, P.A.; Piater, L.A.; Dubery, I.A. The lipopolysaccharide-induced metabolome signature in Arabidopsis thaliana reveals dynamic reprogramming of phytoalexin and phytoanticipin pathways. PLoS ONE 2016, 11, e0163572. [Google Scholar] [CrossRef]
- Balmer, D.; Flors, V.; Glauser, G.; Mauch-Mani, B. Metabolomics of cereals under biotic stress: Current knowledge and techniques. Front. Plant Sci. 2013, 4, 82. [Google Scholar] [CrossRef] [PubMed]
- Salzman, R.A.; Brady, J.A.; Finlayson, S.A.; Buchanan, C.D.; Summer, E.J.; Sun, F.; Klein, P.E.; Klein, R.R.; Pratt, L.H.; Cordonnier-Pratt, M.-M.; et al. Transcriptional profiling of sorghum induced by methyl jasmonate, salicylic acid, and aminocyclopropane carboxylic acid reveals cooperative regulation and novel gene responses. Plant Physiol. 2005, 138, 352–368. [Google Scholar] [CrossRef] [PubMed]
- Zeier, J. New insights into the regulation of plant immunity by amino acid metabolic pathways. Plant Cell Environ. 2013, 36, 2085–2103. [Google Scholar] [CrossRef] [PubMed] [Green Version]
- Gunnaiah, R.; Kushalappa, A.C. Metabolomics deciphers the host resistance mechanisms in wheat cultivar Sumai-3, against trichothecene producing and non-producing isolates of Fusarium graminearum. Plant Physiol. Biochem. 2014, 83, 40–50. [Google Scholar] [CrossRef] [PubMed]
- Cuperlovic-Culf, M.; Rajagopalan, N.; Tulpan, D.; Loewen, M.C. Metabolomics and cheminformatics analysis of antifungal function of plant metabolites. Metabolites 2016, 6, 31. [Google Scholar] [CrossRef]
- Tzin, V.; Galili, G. The biosynthetic pathways for shikimate and aromatic amino acids in Arabidopsis thaliana. In The Arabidopsis Book; American Society of Plant: Rockville, MD, USA, 2010. [Google Scholar]
- Tohge, T.; Watanabe, M.; Hoefgen, R.; Fernie, A.R. Shikimate and phenylalanine biosynthesis in the green lineage. Front. Plant Sci. 2013, 4, 62. [Google Scholar] [CrossRef]
- Du Fall, L.A.; Solomon, P.S. Role of cereal secondary metabolites involved in mediating the outcome of plant‒pathogen interactions. Metabolites 2011, 1, 64–78. [Google Scholar] [CrossRef]
- Ishihara, A.; Hashimoto, Y.; Tanaka, C.; Dubouzet, J.G.; Nakao, T.; Matsuda, F.; Nishioka, T.; Miyagawa, H.; Wakasa, K. The tryptophan pathway is involved in the defense responses of rice against pathogenic infection via serotonin production. Plant J. 2008, 54, 481–495. [Google Scholar] [CrossRef] [Green Version]
- Lim, G.-H.; Singhal, R.; Kachroo, A.; Kachroo, P. Fatty acid- and lipid-mediated signaling in plant defense. Annu. Rev. Phytopathol. 2017, 55, 505–536. [Google Scholar] [CrossRef]
- Walley, J.W.; Kliebenstein, D.J.; Bostock, R.M.; Dehesh, K. Fatty acids and early detection of pathogens. Curr. Opin. Plant Biol. 2013, 16, 520–526. [Google Scholar] [CrossRef] [Green Version]
- Kachroo, A.; Kachroo, P. Fatty acid-derived signals in plant defense. Annu. Rev. Phytopathol. 2009, 47, 153–176. [Google Scholar] [CrossRef] [PubMed]
- Göbel, C.; Feussner, I.; Hamberg, M.; Rosahl, S. Oxylipin profiling in pathogen-infected potato leaves. Biochim. Biophys. Acta Mol. Cell Biol. Lipids 2002, 1584, 55–64. [Google Scholar] [CrossRef]
- Hamberg, M.; Hamberg, G. 15(R)-hydroxylinoleic acid, an oxylipin from oat seeds. Phytochemistry 1996, 42, 729–732. [Google Scholar] [CrossRef]
- Aghofack-Nguemezi, J.; Schwab, W. Spatiotemporal changes in the content and metabolism of 9,12,13-trihydroxy-10(e)-octadecenoic acid in tomato (Solanum Lycopersicum L. Cv Balkonstar) Fruits. J. Sci. Technol. 2013, 33, 12–22. [Google Scholar] [CrossRef]
- Hamberg, M.; Olsson, U. Efficient and specific conversion of 9-lipoxygenase hydroperoxides in the beetroot. formation of pinellic acid. Lipids 2011, 46, 873–878. [Google Scholar] [CrossRef] [PubMed]
- Prost, I. Evaluation of the antimicrobial activities of plant oxylipins supports their involvement in defense against pathogens. Plant Physiol. 2005, 139, 1902–1913. [Google Scholar] [CrossRef] [PubMed]
- Pushpa, D.; Yogendra, K.N.; Gunnaiah, R.; Kushalappa, A.C.; Murphy, A. Identification of late blight resistance-related metabolites and genes in potato through nontargeted metabolomics. Plant Mol. Biol. Rep. 2014, 32, 584–595. [Google Scholar] [CrossRef]
- Mhlongo, M.I.; Piater, L.A.; Madala, N.E.; Steenkamp, P.A.; Dubery, I.A. Phenylpropanoid defences in Nicotiana tabacum cells: Overlapping metabolomes indicate common aspects to priming responses induced by lipopolysaccharides, chitosan and flagellin-22. PLoS ONE 2016, 11, e0151350. [Google Scholar] [CrossRef]
- Wani, S.H.; Kumar, V.; Shriram, V.; Sah Kumar, S. Engineering phytohormones for abiotic stress tolerance in crop plants. Crop J. 2016, 4, 247–266. [Google Scholar] [CrossRef]
- Ramirez-Estrada, K.; Vidal-Limon, H.; Hidalgo, D.; Moyano, E.; Golenioswki, M.; Cusidó, R.M.; Palazon, J. Elicitation, an effective strategy for the biotechnological production of bioactive high-added value compounds in plant cell factories. Molecules 2016, 21, 182. [Google Scholar] [CrossRef]
- Mur, L.A.J.; Kenton, P.; Lloyd, A.J.; Ougham, H.; Prats, E. The hypersensitive response; The centenary is upon us but how much do we know? J. Exp. Bot. 2008, 59, 501–520. [Google Scholar] [CrossRef] [PubMed]
- Sudha, G.; Ravishankar, G.A. Involvement and interaction of various signaling compounds on the plant metabolic events during defense response, resistance to stress factors, formation of secondary metabolites and their molecular aspects. Plant Cell. Tissue Organ Cult. 2002, 71, 181–212. [Google Scholar] [CrossRef]
- Bigeard, J.; Colcombet, J.; Hirt, H. Signaling mechanisms in pattern-triggered immunity (PTI). Mol. Plant 2015, 8, 521–539. [Google Scholar] [CrossRef] [PubMed]
- Wasternack, C.; Strnad, M. Jasmonate signaling in plant stress responses and development—Active and inactive compounds. Nat. Biotechnol. 2016, 33, 604–613. [Google Scholar] [CrossRef] [PubMed]
- Antico, C.J.; Colon, C.; Banks, T.; Ramonell, K.M. Insights into the role of jasmonic acid-mediated defenses against necrotrophic and biotrophic fungal pathogens. Front. Biol. (Beijing) 2012, 7, 48–56. [Google Scholar] [CrossRef]
- Großkinsky, D.; Edelsbrunner, K.; Pfeifhofer, H.; Van der Graaff, E.; Roitsch, T. Cis- and trans-zeatin differentially modulate plant immunity. Plant Signal. Behav. 2013, 8, e24798. [Google Scholar] [CrossRef] [PubMed]
- Schäfer, M.; Brütting, C.; Meza-Canales, I.D.; Großkinsky, D.K.; Vankova, R.; Baldwin, I.T.; Meldau, S. The role of cis-zeatin-type cytokinins in plant growth regulation and mediating responses to environmental interactions. J. Exp. Bot. 2015, 66, 4873–4884. [Google Scholar] [CrossRef]
- Jiang, C.-J.; Shimono, M.; Sugano, S.; Kojima, M.; Liu, X.; Inoue, H.; Sakakibara, H.; Takatsuji, H. Cytokinins act synergistically with salicylic acid to activate defense gene expression in rice. Mol. Plant-Microbe Interact. 2013, 26, 287–296. [Google Scholar] [CrossRef]
- Shigenaga, A.M.; Argueso, C.T. No hormone to rule them all: Interactions of plant hormones during the responses of plants to pathogens. Semin. Cell Dev. Biol. 2016, 56, 174–189. [Google Scholar] [CrossRef]
- Dixon, R.A.; Achnine, L.; Kota, P.; Liu, C.J.; Reddy, M.S.S.; Wang, L. The phenylpropanoid pathway and plant defence—A genomics perspective. Mol. Plant Pathol. 2002, 3, 371–390. [Google Scholar] [CrossRef]
- Karamac, M.; Kosiñska, A.; Pegg, R.B. Content of gallic acid in selected plant extracts. J. Food Nutr. Sci. 2006, 15, 55–58. [Google Scholar]
- Taylor, J.R.N.; Belton, P.S.; Beta, T.; Duodu, K.G. Increasing the utilisation of sorghum, millets and pseudocereals: Developments in the science of their phenolic phytochemicals, biofortification and protein functionality. J. Cereal Sci. 2014, 59, 257–275. [Google Scholar] [CrossRef] [Green Version]
- Kang, J.; Price, W.E.; Ashton, J.; Tapsell, L.C.; Johnson, S. Identification and characterization of phenolic compounds in hydromethanolic extracts of sorghum wholegrains by LC-ESI-MSn. Food Chem. 2016, 211, 215–226. [Google Scholar] [CrossRef] [PubMed]
- Bollina, V.; Kumaraswamy, G.K.; Kushalappa, A.C.; Choo, T.M.; Dion, Y.; Rioux, S.; Faubert, D.; Hamzehzarghani, H. Mass spectrometry-based metabolomics application to identify quantitative resistance-related metabolites in barley against Fusarium head blight. Mol. Plant Pathol. 2010, 11, 769–782. [Google Scholar] [CrossRef] [PubMed]
- Anjum, T.; Akram, W.; Ahmad, A.; Hussain, M.; Aslam, H. An insight into the basis of resistance in Sorghum bicolor against Colletotrichum sublineolum. Afr. J. Microbiol. Res. 2013, 7, 1397–1408. [Google Scholar] [CrossRef]
- Mierziak, J.; Kostyn, K.; Kulma, A. Flavonoids as important molecules of plant interactions with the environment. Molecules 2014, 19, 16240–16265. [Google Scholar] [CrossRef] [PubMed]
- Martens, S.; Mitho, A. Flavones and flavone synthases. Phytochemistry 2005, 66, 2399–2407. [Google Scholar] [CrossRef]
- Ahuja, I.; Kissen, R.; Bones, A.M. Phytoalexins in defense against pathogens. Trends Plant Sci. 2012, 17, 73–90. [Google Scholar] [CrossRef]
- Basile, A.; Giordano, S.; Lopez-Saez, J.A.; Cobianchi, R.C. Antibacterial activity of pure flavonoids isolated from mosses. Phytochemistry 1999, 52, 1479–1482. [Google Scholar] [CrossRef] [Green Version]
- Refaat, J.; Desoukey, S.Y.; Ramadan, M.A.; Kamel, M.S. Rhoifolin: A review of sources and bilogical activities. Int. J. Pharmacogn. 2015, 2, 102–109. [Google Scholar] [CrossRef]
- Chamarthi, S.K.; Kumar, K.; Gunnaiah, R.; Kushalappa, A.C.; Dion, Y.; Choo, T.M. Identification of Fusarium head blight resistance related metabolites specific to doubled-haploid lines in barley. Eur. J. Plant Pathol. 2014, 138, 67–78. [Google Scholar] [CrossRef]
- Abdel-Farid, I.B.; Jahangir, M.; van den Hondel, C.A.M.J.J.; Kim, H.K.; Choi, Y.H.; Verpoorte, R. Fungal infection-induced metabolites in Brassica rapa. Plant Sci. 2009, 176, 608–615. [Google Scholar] [CrossRef]
- Mhlongo, M.I.; Piater, L.A.; Steenkamp, P.A.; Madala, N.E.; Dubery, I.A. Priming agents of plant defence stimulate the accumulation of mono- and di-acylated quinic acids in cultured tobacco cells. Physiol. Mol. Plant Pathol. 2014, 88, 61–66. [Google Scholar] [CrossRef]
- Yogendra, K.N.; Pushpa, D.; Mosa, K.A.; Kushalappa, A.C.; Murphy, A.; Mosquera, T. Quantitative resistance in potato leaves to late blight associated with induced hydroxycinnamic acid amides. Funct. Integr. Genom. 2014, 14, 285–298. [Google Scholar] [CrossRef] [PubMed]
- Gauthier, L.; Atanasova-Penichon, V.; Chéreau, S.; Richard-Forget, F. Metabolomics to decipher the chemical defense of cereals against Fusarium graminearum and deoxynivalenol accumulation. Int. J. Mol. Sci. 2015, 16, 24839–24872. [Google Scholar] [CrossRef] [PubMed]
- Dictionary of Natural Products. Available online: dnp.chemnetbase.com (accessed on 30 November 2017).
- Plant Metabolic Network. Available online: https://www.plantcyc.org/ (accessed on 20 January 2018).
- Spínola, V.; Pinto, J.; Castilho, P.C. Identification and quantification of phenolic compounds of selected fruits from Madeira Island by HPLC-DAD-ESI-MSn and screening for their antioxidant activity. Food Chem. 2015, 173, 14–30. [Google Scholar] [CrossRef] [PubMed]
- Waridel, P.; Wolfender, J.-L.; Ndjoko, K.; Hobby, K.R.; Major, H.J.; Hostettmann, K. Evaluation of quadruple time of flight tandem mass spectrometry and ion trap multiple stage mass spectrometry for differentiation of C-glycosidic flavonoid isomers. J. Chromatogr. A 2001, 926, 29–41. [Google Scholar] [CrossRef]
- Rodríguez-Pérez, C.; Quirantes-Piné, R.; Fernández-Gutiérrez, A.; Segura-Carretero, A. Optimization of extraction method to obtain a phenolic compounds-rich extract from Moringa oleifera Lam leaves. Ind. Crops Prod. 2015, 66, 246–254. [Google Scholar] [CrossRef]
- Brito, A.; Ramirez, J.E.; Areche, C.; Sepúlveda, B.; Simirgiotis, M.J. HPLC-UV-MS profiles of phenolic compounds and antioxidant activity of fruits from three citrus species consumed in Northern Chile. Molecules 2014, 19, 17400–17421. [Google Scholar] [CrossRef]
- Masike, K.; Mhlongo, M.I.; Mudau, S.P.; Nobela, O.; Ncube, E.N.; Tugizimana, F.; George, M.J.; Madala, N.E. Highlighting mass spectrometric fragmentation differences and similarities between hydroxycinnamoyl-quinic acids and hydroxycinnamoyl-isocitric acids. Chem. Cent. J. 2017, 11, 29. [Google Scholar] [CrossRef]
- Benayad, Z.; Gó, C. Characterization of flavonoid glycosides from fenugreek (Trigonella foenum-graecum) crude seeds by HPLC–DAD–ESI/MS Analysis. Int. J. Mol. Sci. 2014, 15, 20668–20685. [Google Scholar] [CrossRef] [PubMed]
- Ibrahima, R.M.; El-Halawany, A.M.; Saleh, D.O.; El Naggar, E.M.B.; EL-Shabrawy, A.E.R.O.; El-Hawary, S.S. HPLC-DAD-MS/MS profiling of phenolics from Securigera securidaca flowers and its anti-hyperglycemic and anti-hyperlipidemic activities. Braz. J. Pharmacogn. 2015, 25, 134–141. [Google Scholar] [CrossRef]
- Sumner, L.W.; Amberg, A.; Barrett, D.; Beale, M.H.; Beger, R.; Daykin, C.A.; Fan, T.W.M.; Fiehn, O.; Goodacre, R.; Griffin, J.L.; et al. Proposed minimum reporting standards for chemical analysis: Chemical Analysis Working Group (CAWG) Metabolomics Standards Initiative (MSI). Metabolomics 2007, 3, 211–221. [Google Scholar] [CrossRef] [PubMed]
- Wu, G.; Johnson, S.K.; Bornman, J.F.; Bennett, S.J.; Clarke, M.W.; Singh, V.; Fang, Z. Growth temperature and genotype both play important roles in sorghum grain phenolic composition. Sci. Rep. 2016, 6, 21835. [Google Scholar] [CrossRef] [PubMed] [Green Version]
- Mazid, M.; Khan, T.A.; Mohammad, F. Role of secondary metabolites in defense mechanisms of plants. Biol. Med. 2011, 3, 232–249. [Google Scholar]


| Metabolites | m/z | RT (min) | Adduct | Ion Mode | Molecular Formula | NS 5511 | NS 5655 | Metabolite Class | ||
|---|---|---|---|---|---|---|---|---|---|---|
| p-Value | Fold Change | p-Value | Fold Change | |||||||
| l-Phenylalanine | 180.092 | 2.59 | [M−H_NH3]− | neg | C9H11NO2 | 0.159 | 0.9 | 0.002 | 0.9 | Amino acid |
| l-Tyrosine | 182.081 | 1.13 | [M+H]+ | pos | C9H11NO3 | 1.77 × 10⁻³¹ | 0.5 | 1.94 × 10⁻³¹ | 0.4 | Amino acid |
| l-Tryptophan | 205.097 | 2.69 | [M+H]+ | pos | C11H12N2O2 | 1.87 × 10⁻²⁷ | 0.6 | 2.67 × 10⁻¹⁵ | 0.5 | Amino acid |
| Benzoic acid | 121.028 | 4.46 | [M−H]− | neg | C7H6O2 | 1.76 × 10⁻²⁰ | 0.6 | 0.603 | 0.7 | Benzoates |
| Dhurrin | 334.090 | 2.6 | [M+H_Na]+ | pos | C14H17NO7 | 2.49 × 10⁻²⁹ | 0.4 | 2.51 × 10⁻²⁷ | 0.4 | Cyanogen |
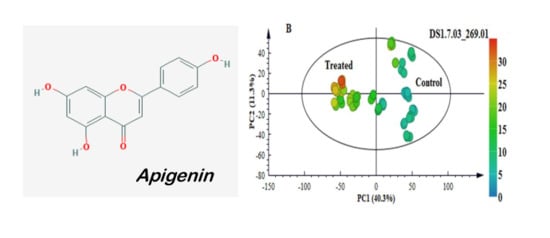
| Apigenin | 269.007 | 7.05 | [M−H]− | neg | C15H10O5 | 0.838 | 1.0 | 0.000 | 1.5 | Flavonoid |
| Protocatechuic acid hexoside | 315.069 | 5.41 | [M−H]− | neg | C13H16O9 | 5.24 × 10⁻⁷ | 1.5 | 1.67 × 10⁻¹¹ | 2.1 | Flavonoid |
| Tricin | 329.066 | 8.92 | [M−H]− | neg | C17H14O7 | 6.62 × 10⁻⁷ | 0.7 | 0.091 | 0.8 | Flavonoid |
| Sophoraflavanone B | 341.137 | 2.50 | [M+H]+ | pos | C20H20O5 | 8.06 × 10⁻³⁴ | 0.4 | 4.38 × 10⁻²⁷ | 0.4 | Flavonoid |
| Trihydroxypentamethoxyflavone | 419.095 | 5.69 | [M−H]− | neg | C20H20O10 | 1.64 × 10⁻²⁴ | 3.1 | 1.31 × 10⁻¹⁶ | 3.8 | Flavonoid |
| Sophoraflavanone G | 423.182 | 5.46 | [M−H]− | neg | C25H28O6 | 4.59 × 10⁻¹¹ | 0.6 | 1.29 × 10⁻⁵ | 0.7 | Flavonoid |
| Apigenin-8-C-glucoside (vitexin) | 431.099 | 5.55 | [M−H]− | neg | C21H20O10 | 7.57 × 10⁻⁵ | 1.4 | 0.347 | 1.1 | Flavonoid |
| Apigetrin (apigenin 7-O-glucoside) | 431.098 | 6.33 | [M−H]− | neg | C21H20O10 | 0.238 | 1.0 | 0.001 | 0.8 | Flavonoid |
| Naringenin 7-O-beta-d-glucoside (prunin) | 433.114 | 5.91 | [M−H]− | neg | C21H22O10 | 1.44 × 10⁻¹⁶ | 2.3 | 5.76 × 10⁻¹⁸ | 4.6 | Flavonoid |
| Luteolin 7-O-glucoside | 447.091 | 5.71 | [M−H]− | neg | C21H20O11 | 4.44 × 10⁻¹³ | 1.6 | 0.799 | 1.0 | Flavonoid |
| Quercetin 3-O-rhamnoside (quercitrin) | 447.092 | 4.61 | [M−H]− | neg | C21H20O11 | 9.02 × 10⁻¹⁷ | 1.8 | 8.37 × 10⁻¹⁷ | 3.8 | Flavonoid |
| Pentahydroxychalcone 4′-O-glucoside | 449.108 | 4.57 | [M−H]− | neg | C21H22O11 | 7.50 × 10⁻¹¹ | 1.4 | 5.49 × 10⁻¹⁹ | 2.1 | Flavonoid |
| Apigenin 8-C-xyloside-6-C-glucoside (vicenin-3) | 563.139 | 5.09 | [M−H]− | neg | C26H28O14 | 0.672 | 1.1 | 3.88 × 10⁻⁸ | 1.2 | Flavonoid |
| Apigenin 6-C-xyloside-8-C-glucoside (vicenin-1) | 563.140 | 4.87 | [M−H]− | neg | C26H28O14 | 6.91 × 10⁻¹¹ | 1.2 | 0.008 | 1.1 | Flavonoid |
| Vitexin 2″-O-rhamnoside | 577.154 | 5.32 | [M−H]− | neg | C27H30O14 | 1.43 × 10⁻¹⁵ | 1.5 | 7.43 × 10⁻¹⁴ | 1.5 | Flavonoid |
| Apigenin 7-O-neohesperidoside (rhoifolin) | 577.156 | 6.06 | [M−H]− | neg | C27H30O14 | 1.52 × 10⁻⁷ | 1.1 | 0.488 | 1.0 | Flavonoid |
| Unknown flavonoid | 581.149 | 4.33 | [M−H]− | neg | C26H30O15 | 7.67 × 10⁻²⁵ | 2.5 | 1.75 × 10⁻¹⁵ | 2.8 | Flavonoid |
| Luteolin 7-O-neohesperidoside | 593.150 | 5.51 | [M−H]− | neg | C27H30O15 | 2.20 × 10⁻¹⁵ | 1.3 | 0.037 | 0.9 | Flavonoid |
| Apigenin-6,8-di-C-glucoside (vicenin-2) | 593.151 | 4.45 | [M−H]− | neg | C27H30O15 | 0.637 | 1.0 | 8.60 × 10⁻⁶ | 1.3 | Flavonoid |
| Quercetin-3-rhamnoside-7-rhamnoside | 595.165 | 4.51 | [M−H]− | neg | C27H32O15 | 2.87 × 10⁻⁹ | 1.4 | 4.17 × 10⁻¹⁰ | 1.5 | Flavonoid |
| Quercetin rutinoside (rutin) | 609.146 | 5.43 | [M−H]− | neg | C27H30O16 | 1.22 × 10⁻¹⁹ | 2.1 | 3.98 × 10⁻¹⁰ | 2.1 | Flavonoid |
| Hesperidin | 609.181 | 4.80 | [M−H]− | neg | C28H34O15 | 0.236 | 1.1 | 0.000 | 0.9 | Flavonoid |
| Unknown flavonoid | 611.158 | 3.10 | [M−H]− | neg | C27H32O16 | 4.59 × 10⁻⁹ | 1.2 | 3.07 × 10⁻⁸ | 1.4 | Flavonoid |
| Naringenin 7-O-neohesperidoside (naringin) | 625.180 | 3.33 | [M−H_HCOOH]− | neg | C27H32O14 | 0.000 | 1.1 | 3.10 × 10⁻⁶ | 0.7 | Flavonoid |
| 7-O-Methylvitexin 2″-O-beta-l-rhamnoside | 637.177 | 6.21 | [M−H_HCOOH]− | neg | C28H31O14 | 0.466 | 1.0 | 0.563 | 1.0 | Flavonoid |
| 4-Hydroxycoumarin | 161.024 | 1.87 | [M−H]− | neg | C9H6O3 | 3.91 × 10⁻¹² | 0.6 | 0.017 | 0.8 | HCA |
| p-Coumaric acid | 163.039 | 3.65 | [M−H]− | neg | C9H8O3 | 0.064 | 0.9 | 0.953 | 0.9 | HCA |
| Caffeic acid | 179.034 | 4.35 | [M−H]− | neg | C9H8O4 | 1.68 × 10⁻⁷ | 0.5 | 0.083 | 0.6 | HCA |
| Ferulic acid | 193.048 | 4.01 | [M−H]− | neg | C10H10O4 | 1.95 × 10⁻¹² | 0.8 | 1.25 × 10⁻⁷ | 0.8 | HCA |
| Sinapoyl alcohol | 209.074 | 6.72 | [M−H]− | neg | C11H14O4 | 1.48 × 10⁻¹⁵ | 2.4 | 1.07 × 10⁻¹⁶ | 3.1 | HCA |
| Coniferyl acetate | 221.081 | 7.42 | [M−H]− | neg | C12H14O4 | nd | nd | 3.47 × 10⁻¹⁰ | 8.2 | HCA |
| 2-O-Caffeoylglyceric acid | 267.048 | 4.38 | [M−H]− | neg | C12H12O7 | 1.48 × 10⁻¹⁰ | 0.5 | 0.017 | 0.7 | HCA |
| 4-Coumaroylquic acid | 337.051 | 3.29 | [M−H]− | neg | C16H18O8 | 1.54 × 10⁻³⁰ | 3.8 | 6.41 × 10⁻²⁶ | 3.6 | HCA |
| Caffeic acid hexose | 341.083 | 6.17 | [M−H]− | neg | C15H18O9 | 3.44 × 10⁻⁷ | 0.7 | 0.003 | 0.8 | HCA |
| 4-Caffeoylquinic acid | 353.091 | 3.58 | [M−H]− | neg | C16H18O9 | 4.75 × 10⁻²³ | 0.3 | 2.60 × 10⁻⁵ | 0.5 | HCA |
| 1-O-Feruloyl-beta-d-glucose | 355.102 | 4.06 | [M−H]− | neg | C16H20O9 | 3.21 × 10⁻²⁴ | 0.2 | 4.17 × 10⁻¹⁸ | 0.1 | HCA |
| 4-Coumaroylagmatine | 277.027 | 2.63 | [M−H]− | neg | C14H20N4O2 | 0.0464 | 0.9 | 1.09 × 10⁻⁷ | 0.8 | HCA |
| 3-Feruloylquinic acid | 367.099 | 3.75 | [M−H]− | neg | C17H20O9 | 5.98 × 10⁻⁹ | 1.3 | 0.002 | 1.2 | HCA |
| Sinapoyl aldehyde | 371.130 | 6.53 | [M+H]+ | pos | C17H22O9 | 4.70 × 10⁻²⁹ | 0.3 | 3.58 × 10⁻²² | 0.4 | HCA |
| 2-O-Caffeoylglucarate | 371.062 | 2.05 | [M−H]− | neg | C15H16O11 | 0.167 | 0.3 | nd | nd | HCA |
| 1-O-Coumaroyl-beta-d-glucose | 371.097 | 4.26 | [M−H_HCOOH]− | neg | C15H18O8 | 0.001 | 1.1 | 0.442 | 1.0 | HCA |
| Sinapoyl-(S)-malate | 385.078 | 3.74 | [M−H_HCOOH]− | neg | C15H16O9 | 1.56 × 10⁻¹⁰ | 0.8 | 0.066 | 0.6 | HCA |
| 1-O-Sinapoyl-beta-d-glucose | 385.113 | 5.16 | [M−H]− | neg | C17H22O10 | 7.38 × 10⁻⁹ | 0.8 | 0.000 | 0.9 | HCA |
| Feruloylserotonin | 351.072 | 3.65 | [M−H]− | neg | C20H20N2O4 | 0.793 | 1.0 | 1.43 × 10⁻¹⁰ | 0.3 | HCA |
| 1,3-O-Coumaroyl-feruloylglycerol | 413.121 | 9.03 | [M−H]− | neg | C22H22O8 | 9.84 × 10⁻¹² | 0.4 | 4.47 × 10⁻¹⁷ | 0.5 | HCA |
| Sinapaldehyde glucoside | 415.123 | 4.44 | [M−H_HCOOH]− | neg | C17H22O9 | 7.13 × 10⁻¹⁶ | 0.7 | 9.48 × 10⁻⁷ | 0.8 | HCA |
| 1,3-O-Diferuloylglycerol | 443.132 | 9.22 | [M−H]− | neg | C23H24O9 | 4.20 × 10⁻¹¹ | 0.4 | 2.53 × 10⁻²⁶ | 0.3 | HCA |
| Caffeic acid derivative | 475.143 | 1.92 | [M−H]− | neg | C20M28O13 | 1.81 × 10⁻¹⁵ | 1.5 | 2.56 × 10⁻¹⁷ | 2.5 | HCA |
| 1,2-bis-O-Sinapoyl-beta-d-glucoside | 591.166 | 6.19 | [M−H]− | neg | C28H32O14 | 0.547 | 1.0 | 0.105 | 1.0 | HCA |
| Indole-3-acrylic acid/N-Ac-indole-3-carboxyaldehyde | 188.076 | 2.71 | [M+H]+ | pos | C11H9NO2 | 2.12 × 10⁻²⁷ | 0.5 | 1.85 × 10⁻¹⁸ | 0.5 | Indole |
| Methyl indole-3-acetate | 190.085 | 2.69 | [M+H]+ | pos | C11H11NO2 | 4.47 × 10⁻¹¹ | 0.5 | 4.33 × 10⁻⁹ | 0.5 | Indole |
| Indole-3-pyruvate | 202.051 | 7.89 | [M−H]− | neg | C11H9NO3 | 3.07 × 10⁻¹⁸ | 1.9 | 5.79 × 10⁻¹³ | 2.5 | Indole |
| 6-Hydroxy-indole-3-acetyl-valine | 289.119 | 3.95 | [M−H]− | neg | C15H18N2O4 | 1.83 × 10⁻⁹ | 1.7 | 0.469 | 0.9 | Indole |
| Indole-3-acetyl-leucine | 333.120 | 3.25 | [M+H_NaNa]+ | pos | C16H20N2O3 | 1.45 × 10⁻⁷ | 4.1 | 0.001 | 1.9 | Indole |
| Indole-3-yl-acetyl-myo-inositol l-arabinoside | 468.152 | 3.13 | [M−H]− | neg | C21H27NO11 | 0.000 | 1.3 | 0.117 | 0.9 | Indole |
| DIMBOA-Glc | 372.093 | 1.58 | [M−H]− | neg | C15H19NO10 | 0.001 | 0.8 | 9.77 × 10⁻¹⁴ | 0.4 | Benzoxazine |
| Isocitric acid | 191.018 | 1.10 | [M−H]− | neg | C6H8O7 | 5.97 × 10⁻¹⁴ | 2.3 | 1.64 × 10⁻⁹ | 1.6 | Carboxylic acid |
| Octadecatetraenoic acid | 275.200 | 13.44 | [M−H]− | neg | C18H28O2 | 1.64 × 10⁻¹⁷ | 4.1 | 1.20 × 10⁻¹¹ | 3.6 | Fatty acid |
| 16-Hydroxypalmitate | 271.044 | 13.43 | [M−H]− | neg | C16H31O3 | 8.38 × 10⁻¹⁹ | 4.9 | 9.55 × 10⁻¹³ | 4.1 | Fatty acid |
| 15-Hydroxylinoleic acid | 295.226 | 14.3 | [M−H]− | neg | C18H32O3 | 1.38 × 10⁻¹⁸ | 3.6 | 8.76 × 10⁻¹⁴ | 3.4 | Fatty acid |
| 10,16-Dihydroxypalmitate | 287.075 | 10.24 | [M−H]− | neg | C16H31O4 | 9.76 × 10⁻¹⁴ | 8.0 | 6.75 × 10⁻¹¹ | 8.1 | Fatty acid |
| Dihydroxy-octadecadienoic acid | 311.220 | 11.81 | [M−H]− | neg | C18H32O4 | 5.87 × 10⁻¹⁷ | 4.9 | 2.18 × 10⁻¹¹ | 6.0 | Fatty acid |
| 11,12,13-Trihydroxy-9,15-octadecadienoic acid | 327.215 | 9.06 | [M−H]− | neg | C18H32O5 | 1.95 × 10⁻³² | 2.7 | 1.30 × 10⁻⁵ | 1.5 | Fatty acid |
| 9,12,13-Trihydroxy-10-octadecenoic acid | 329.229 | 9.60 | [M−H]− | neg | C18H34O5 | 3.23 × 10⁻²⁷ | 2.5 | 3.95 × 10⁻¹⁷ | 2.0 | Fatty acid |
| Salicylic acid | 137.031 | 3.69 | [M−H]− | neg | C7H6O3 | 4.29 × 10⁻¹² | 1.3 | 0.091 | 3.9 | Phytohormone |
| Salicylic acid 2-O-beta-d-glucoside | 299.074 | 1.62 | [M−H]− | neg | C13H16O8 | 7.21 × 10⁻¹⁷ | 1.7 | 9.28 × 10⁻²⁴ | 1.9 | Phytohormone |
| Jasmonoyl-l-isoleucine | 322.010 | 4.16 | [M−H]− | neg | C18H29NO4 | 2.94 × 10⁻¹² | 0.5 | 5.03 × 10⁻²⁰ | 0.1 | Phytohormone |
| Dihydrozeatin-9-N-glucoside-O-glucoside | 544.208 | 2.80 | [M−H]− | neg | C22H35N5O11 | 0.001 | 0.8 | 4.22 × 10⁻¹² | 2.8 | Phytohormone |
| Zeatin riboside | 352.183 | 3.16 | [M+H]+ | pos | C15H21N5O5 | 1.35 × 10⁻²⁸ | 0.3 | 3.27 × 10⁻²² | 0.4 | Phytohormone |
| Chorismic acid | 225.040 | 2.61 | [M−H]− | neg | C10H10O6 | nd | nd | 0.076 | 0.9 | Shikimate |
| Caffeoylshikimic acid | 335.076 | 4.64 | [M−H]− | neg | C16H16O8 | 2.89 × 10⁻¹⁷ | 0.3 | 3.84 × 10⁻¹¹ | 0.3 | Shikimate/HCA |
© 2019 by the authors. Licensee MDPI, Basel, Switzerland. This article is an open access article distributed under the terms and conditions of the Creative Commons Attribution (CC BY) license (http://creativecommons.org/licenses/by/4.0/).
Share and Cite
Mareya, C.R.; Tugizimana, F.; Piater, L.A.; Madala, N.E.; Steenkamp, P.A.; Dubery, I.A. Untargeted Metabolomics Reveal Defensome-Related Metabolic Reprogramming in Sorghum bicolor against Infection by Burkholderia andropogonis. Metabolites 2019, 9, 8. https://doi.org/10.3390/metabo9010008
Mareya CR, Tugizimana F, Piater LA, Madala NE, Steenkamp PA, Dubery IA. Untargeted Metabolomics Reveal Defensome-Related Metabolic Reprogramming in Sorghum bicolor against Infection by Burkholderia andropogonis. Metabolites. 2019; 9(1):8. https://doi.org/10.3390/metabo9010008
Chicago/Turabian StyleMareya, Charity R., Fidele Tugizimana, Lizelle A. Piater, Ntakadzeni E. Madala, Paul A. Steenkamp, and Ian A. Dubery. 2019. "Untargeted Metabolomics Reveal Defensome-Related Metabolic Reprogramming in Sorghum bicolor against Infection by Burkholderia andropogonis" Metabolites 9, no. 1: 8. https://doi.org/10.3390/metabo9010008