1. Introduction
Cancer is fundamentally a metabolic disease. As far back as 1927 [
1], it was shown that cancer cells exhibit a distinct metabolic phenotype, consuming up to 200X more glucose than normal cells. This glycolytic phenotype, commonly known as the Warburg effect, has been found in nearly every type of cancer ever studied. However, interest in the influence of metabolism on cancer and its utility for cancer treatment largely waned in the 1960s and almost completely disappeared by the 1970s. The “re-discovery” of cancer as a metabolic disorder largely occurred in the last ten years [
2,
3]. This shift in thinking has mostly been due to the increased accessibility of metabolomics, the identification of useful cancer metabolite biomarkers and the discovery, via metabolomics, of “oncometabolites” [
4]. Oncometabolites are endogenous metabolites that either initiate or sustain tumor growth and metastasis. The first oncometabolite to be identified was 2-hydroxyglutarate, a rare metabolite found in high concentrations in gliomas [
3]. Since the discovery of 2-hydroxyglutarate many other oncometabolites have been identified including fumarate (renal cell carcinoma), succinate (paraganglioma), sarcosine (prostate cancer), asparagine (leukemia), choline (prostate, brain, breast cancer) and polyamines (most cancers). Almost all of these oncometabolites arise from, or are needed for, a number of key cancer-associated metabolic pathways, including aerobic glycolysis, glutaminolysis and one-carbon metabolism.
The discovery of oncometabolites (via metabolomics) has also been complemented with the discovery (also via metabolomics) of many other cancer-associated metabolites that could potentially serve as cancer biomarkers. These include numerous metabolite biomarkers found in serum [
5], plasma [
6], urine [
7], saliva [
8], and tissue samples [
9]. Recently, volatile organic compounds (VOC) from breath and breath condensate have been found to be useful biomarkers of lung cancer [
10,
11]. Some examples of cancer-associated metabolite biomarkers are: phosphocholine, isoleucine, threonine, glutamate, histidine, acetoactetate, glycerol, mannose, phenylalanine and pyruvate in breast cancer [
12,
13,
14]; taurine, lactate, choline, phenylalanine, isoglutamine, tyrosine, lipids, triglycerides, TCA cycle intermediates in colorectal cancer [
15,
16]; phosphatidylcholine, lysophosphatidylcholine, phosphocholine, glycerophosphocholine, and arachidonic acid in head and neck cancer [
17].
Unfortunately, with so many cancer-associate metabolites being identified it is often difficult for scientists to keep track of which compounds are associated with which cancers. It is also challenging to track down information on the physiological role or the specific pathways that particular cancer-associated metabolites (or oncometabolites) may be affecting. Even more frustrating for metabolomics researchers and cancer researchers alike are the difficulties associated with identifying metabolites from NMR (nuclear magnetic resonance) or MS (mass spectrometry) spectra of metabolite mixtures [
18]. What is clearly needed to address these challenges are comprehensive, open access databases that contain up-to-date referential information about metabolites, metabolic pathways, biomarkers and reference NMR, MS/MS (tandem mass spectrometry), and GC-MS (gas chromatography mass spectrometry) spectra for compound identification. Fortunately, a number of freely accessible metabolomics databases are starting to appear that offer at least some of these features. One such database is the Human Metabolome Database or HMDB [
19,
20]. The HMDB is currently the world’s largest and most comprehensive, organism-specific metabolomics database. It contains nearly 42,000 metabolite entries, more than 5000 normal and abnormal metabolite concentrations, nearly 800 metabolic and disease-associated pathways, and detailed information on dozens of cancer biomarkers. In this review, we will describe the HMDB in more detail and highlight some of its unique display features, search capabilities and data content attributes. We will also offer some guidance, selected case studies and simple examples on how to use the HMDB in metabolomic studies of cancer.
2. A Brief Overview of the HMDB
The Human Metabolome Database (HMDB) (
www.hmdb.ca) contains comprehensive spectroscopic, quantitative, analytic and physiological information about human metabolites, their associated enzymes or transporters, their abundance and their disease-related properties. Since its first release in 2007 [
19], the HMDB website has been accessed more than 10 million times and its associated papers cited nearly 3000 times. Broadly speaking, the HMDB contains three kinds of data: (1) chemical data; (2) clinical data; and (3) molecular biology/biochemistry data. The chemical data in the HMDB covers both water-soluble and lipid soluble metabolites as well as metabolites that would be regarded as either abundant (>1 uM) or relatively rare (<1 nM). The metabolite entries in HMDB are classified into three groups, “detected” metabolites [separated into two categories: (i) detected and quantified and (ii) detected but not quantified] and “expected” metabolites (those for which biochemical pathways are known or human intake/exposure is frequent but the compound has yet to be detected in the body).
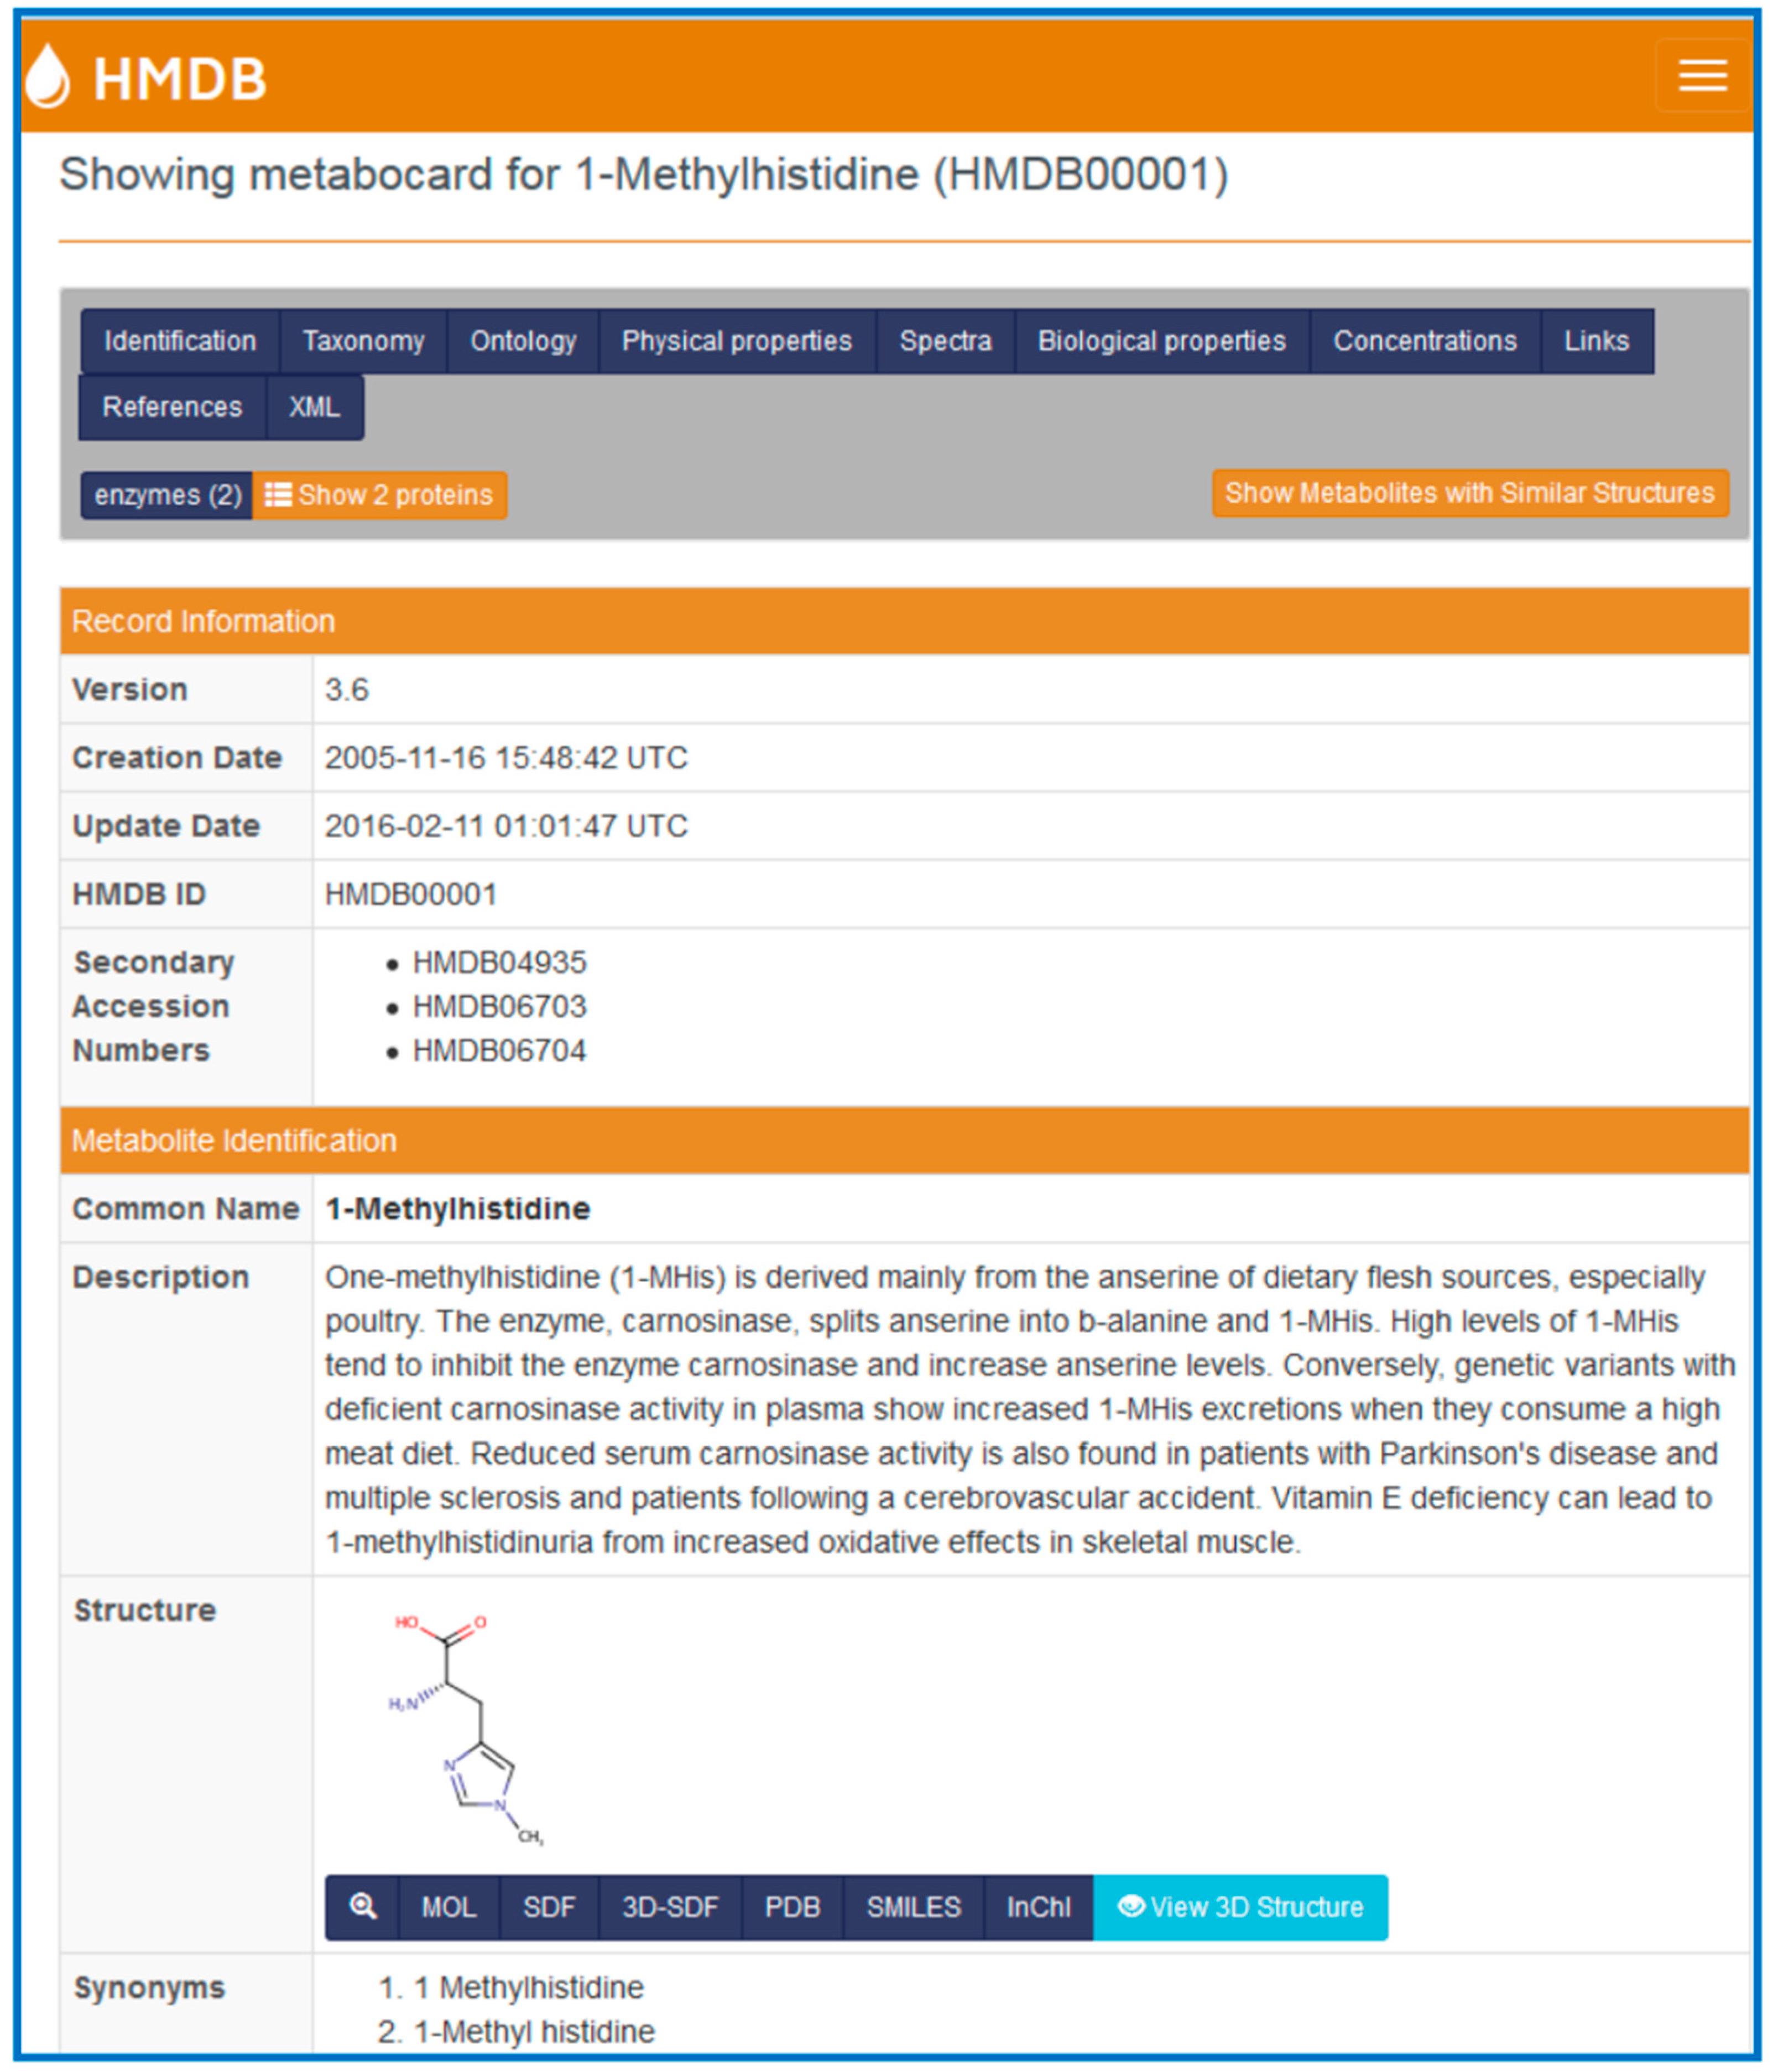
Each metabolite in the HMDB is linked to a “MetaboCard”. Every MetaboCard contains 114 data fields with approximately two-thirds of the information being devoted to chemical or physico-chemical data and the other third devoted to biological or biomedical data. Each MetaboCard is divided into 14 distinctive categories or superfields with clearly demarcated titles (
Figure 1). These superfields include: (i) record information; (ii) metabolite identification; (iii) chemical taxonomy; (iv) chemical ontology; (v) physical properties; (vi) spectra; (vii) biological properties; (viii) normal concentrations; (ix) abnormal concentrations; (x) associated disorders; (xi) external links; (xii) references; (xiii) enzymes; and (xiv) transporters. In addition to providing comprehensive numeric, sequence and textual data, each MetaboCard also contains hyperlinks to many other online databases (Kyoto Encyclopedia of Genes and Genomes (KEGG) [
21], BioCyc [
22], PubChem [
23], Chemical Entities of Biological Interest (ChEBI) [
24], PubMed, Protein Data Bank (PDB) [
25], Universal Protein Resource (UniProt) [
26], GenBank [
23], Online Mendelian Inheritance in Man (OMIM) [
23] and the Single Nucleotide Polymorphism Database (dbSNP)) [
23]), abstracts, digital images and applets for viewing molecular structures and pathways. All the metabolites in HMDB are linked to more than 333,311 different synonyms. These metabolites are further connected to 721 non-redundant pathways, 6305 distinct enzymes, 110,000 SNPs as well as 617 metabolic diseases (genetic and acquired). Nearly 1400 compounds are also linked to experimentally acquired referential
1H and
13C NMR, MS/MS and GC-MS spectra. Concentration data (normal and abnormal values) for plasma, urine, CSF and/or other biofluids are also provided for a total of 5027 compounds. The entire database, including text, sequence, and structure and image data occupies nearly 20 GB of data—most of which can be freely downloaded. A detailed list of the HMDB content is shown in
Table 1.
The HMDB is fully searchable with many built-in tools for viewing, sorting and extracting metabolites, biofluid concentrations, enzymes, genes, NMR or MS spectra and disease information. Detailed instructions on where to locate and how to use these browsing/search tools are provided on the HMDB homepage (
www.hmdb.ca). As with most on-line databases, the HMDB supports standard text queries through a text-based search box located near the top right of each page. It also offers general database browsing using the drop-down menu of “Browse” button for metabolites, diseases, pathways, biofluids, metabolite classes, proteins and reactions located in the top left corner of HMDB menu bar. The Biofluids link in the Browse menu generates hyperlinked tables listing normal and abnormal concentrations of different metabolites for 23 different biofluids.
Located on the right of the Browse menu is the Search menu. Under Search, the ChemQuery (structure search) link allows users to draw (using a ChemSketch applet) or type in (using a SMILES string) a chemical compound and to search HMDB for chemicals similar or identical to the query compound. The Molecular Weight Query allows users to search for metabolites in the HMDB according to a molecular weight range. The Text Query supports a more sophisticated text search (partial word matches, case sensitive, misspellings, etc.) of the text portion of HMDB. HMDB’s Sequence Search allows users to conduct BLAST sequence searches of the over 5701 gene and protein sequences contained in HMDB. Both single and multiple sequence BLAST queries are supported. The Advanced Search link opens an easy-to-use relational query search tool that allows users to select or search over various combinations of subfields. The MS and MS/MS Searches allow users to submit Mass spectral files that will be searched against the HMDB’s library of MS and MS/MS spectra. This allows the identification of metabolites from mixtures via MS/MS spectroscopy. The 1D and 2D NMR Searches allow users to submit peak lists from 1H or 13C NMR spectra (both pure and mixtures) or 2D Total correlation spectroscopy (TOCSY) or 13C Heteronuclear single-quantum correlation spectroscopy (HSQC) spectra, respectively, and to have these spectra compared to the NMR libraries contained in the HMDB. This allows the identification of metabolites from mixtures via NMR spectroscopy.
Over the past three years, a significant effort has been undertaken to upgrade the number and quality of reference NMR, MS/MS and GC-MS spectra in the HMDB. In particular, hundreds of additional reference MS and NMR spectra were collected, assigned, and/or annotated by HMDB curators, whereas hundreds of additional annotated/assigned MS and NMR reference spectra were obtained from the BioMagResBank [
27], METLIN [
28] and MassBank [
29]. As a result, the HMDB now contains approximately 3186 experimental
1H and
13C NMR spectra for 1381 compounds. It also contains 1200 MS/MS (Triple-Quad) spectra at three different collision energies for 1250 pure compounds. Additionally, GC-MS reference data/spectra are now available for 1220 compounds. The HMDB’s spectral search utilities allow both pure compounds and mixtures of compounds to be identified from their MS or NMR spectra via peak matching algorithms that were developed in-house. All NMR spectral assignments are now available for download in an NMR-STAR format [
27]. This format captures all relevant spectral features, spectral collection conditions, assignments and chemical structure information. NMR spectra are also available as raw (FID) files and as simple images (PNG format). In addition to NMR spectra, nearly all MS/MS spectra in the HMDB are now available in mzML format. The mzML format is rapidly becoming the preferred format for MS data exchange as it robustly captures all relevant spectral features, MS spectral collection conditions and associated annotations. All MS spectra in the HMDB are also available as simple images (PNG format) and as simple mass list files.
Perhaps the most relevant features of the HMDB from the perspective of a medical researcher are its rich content and extensive linkage to metabolic diseases, to normal and abnormal metabolite concentration ranges (in many different biofluids) and pathways associated with many diseases of interest. Over the past four years, several comprehensive studies conducted by us have led to the experimental validation and accurate concentration measurements of thousands of compounds in normal cerebrospinal fluid [
30], serum [
31], urine [
32] and saliva [
33]. Four additional databases, DrugBank [
34], T3DB [
35], SMPDB [
36] and FooDB (
www.foodb.org) are also part of the HMDB suite of databases. DrugBank contains equivalent information on 8070 drug and drug metabolites, T3DB contains information on 3673 common toxins and environmental pollutants, SMPDB contains pathway diagrams for more than 1700 metabolic and disease pathways, while FooDB contains equivalent information on 26,619 food constituents and food additives.
5. Using the HMDB in Cancer-Related Metabolomics Studies
One of the biggest challenges in metabolomics involves the identification and/or quantification of compounds. In most untargeted metabolomic studies, compounds must be identified by comparing the accurate molecular weight (
m/
z), retention time, NMR, GC-MS and/or LC-MS/MS spectrum of the “unknown” or “query” compound with some kind of database containing the molecular weights or spectra of known metabolites [
18]. Finding a good or, ideally, a perfect match between the query and the database provides the necessary (but not sufficient) evidence that the compound has been properly identified.
While many cancer metabolomics researchers typically want to search the largest possible database (i.e., PubChem for m/z data searches, the NIST database for GC-MS data searches or METLIN for LC-MS/MS data searches), for their metabolomic queries, this is often not the best choice. This is because these databases do not limit their compound collections or spectral data sets to human-only or mammalian-only compounds. For instance, PubChem contains 61 million compounds, but less than 0.5% of its chemicals are metabolites, natural products or compounds that could possibly be found in humans and/or other mammals. The other 99.5% have never left the laboratory or were never produced in sufficient quantity to be detected in any biological sample. In the case of the NIST GC-MS database, only a small fraction (<5%) of the compounds in their vast GC-MS library appear to be metabolites or natural products that could possibly be found in humans or other mammals. A similar issue has emerged for the METLIN database, as no information about the possible biological origin of its compounds or their associated MS/MS spectra is provided. As a result, it is not uncommon for researchers doing untargeted metabolomic studies on mice, for instance, to report “impossible” compound identifications, such as exotic spices, rare marine compounds or banned performance enhancing drugs—simply because they naively chose to only look at the largest possible chemical or spectral database to do their compound identification. In other words, for metabolomics to work, the database needs to match the organism.
In this regard, the HMDB is actually an ideal database for cancer metabolomic studies. This is because the compounds and the reference spectra contained in the HMDB are limited to compounds that are known, or widely expected, to be in humans. These include more than 29,000 endogenous metabolites, thousands of common food constituents, hundreds of microbial metabolites and dozens of high-abundance environmental chemicals or contaminants. In many cases, these same compounds are also found in mice, rats or other mammalian models used for cancer research. The HMDB is also unique with regard to the diversity of its spectral reference data. Unlike the BioMagResBank (which is limited to NMR-only data) or METLIN (which is limited to LC-MS data), the HMDB houses extensive NMR, GC-MS and MS/MS spectral data. Furthermore, the HMDB provides well-supported
m/
z and spectral search functions that allow users to easily submit, view and assess their spectral matches. Users can also select between expected (33,000), detected (7000) or all (42,000) metabolites in the HMDB for their MS search routines. A simple adduct calculator generates more than 25 possible adducts (containing Na+, K+, NH
4+ and dimer adducts) for three different modes (positive ion, negative ion, neutral) for each compound, creating an effective database of more than one million masses for high resolution parent ion matching. The HMDB’s NMR search utilities allow users to submit peak lists from 1D
1H or
13C NMR spectra (both pure and mixtures) or 2D TOCSY or 2D
13C HSQC spectra, respectively, and to have these spectra compared to the NMR libraries contained in the HMDB. This allows facile identification of metabolites from mixtures via NMR spectroscopy. In particular, the HMDB’s NMR search utilities were used for one of the first metabolomic studies on cancer cachexia using urine samples [
40]. These unique search functions and large spectral libraries permitted the identification of a number of predictive biomarkers for cancer-induced cachexia that could not be identified via commercial software or any other source. In addition to their utility in cancer biomarker applications, the NMR spectral libraries in the HMDB have recently been used to develop an automated tool for NMR spectral deconvolution, called Bayesil [
41]. Bayesil is able to take raw NMR spectra from 500 and 600 MHz NMR instruments and automatically phase, reference, baseline correct and identify as well as quantify up to 60 metabolites from complex mixtures such as serum, cerebrospinal fluid and saliva. This new tool is now being used by a number of laboratories to look for pre-cancerous biomarkers for colon cancer.
While the HMDB’s spectral libraries are very helpful for compound identification, it is the HMDB’s associated chemical and biochemical information that is perhaps far more useful. In other words, the HMDB allows users to not only identify or confirm the existence of a compound, it also allows users to almost understand its biological or biochemical context. In this regard, the HMDB appears to be unique among all existing metabolomic or reference spectral databases. In particular, each compound in the HMDB has information regarding its name(s), synonyms, 2D and 3D structure, molecular weight, general description, references, biological activities, probable origin, structural properties, chemical classification and chemical similarity. Many compounds in the HMDB also have additional information regarding their known chemical reactions, associated enzymes or transporters, biological pathways, tissue or biofluid locations, disease associations and normal/abnormal concentrations. This rich information content is also quite easily mined and even more easily integrated into more advanced analytical tools for metabolomics. Indeed, the HMDB is now the primary reference source for many of the functions offered through MetaboAnalyst [
42]. MetaboAnalyst is a web-based package for performing comprehensive metabolomic analysis and biomarker identification that is now accessed by more than 75,000 users a month. Much of the success of MetaboAnalyst appears to be tied to its tight linkage to the rich information in HMDB.
6. A Sample Workflow Using HMDB and SMPDB
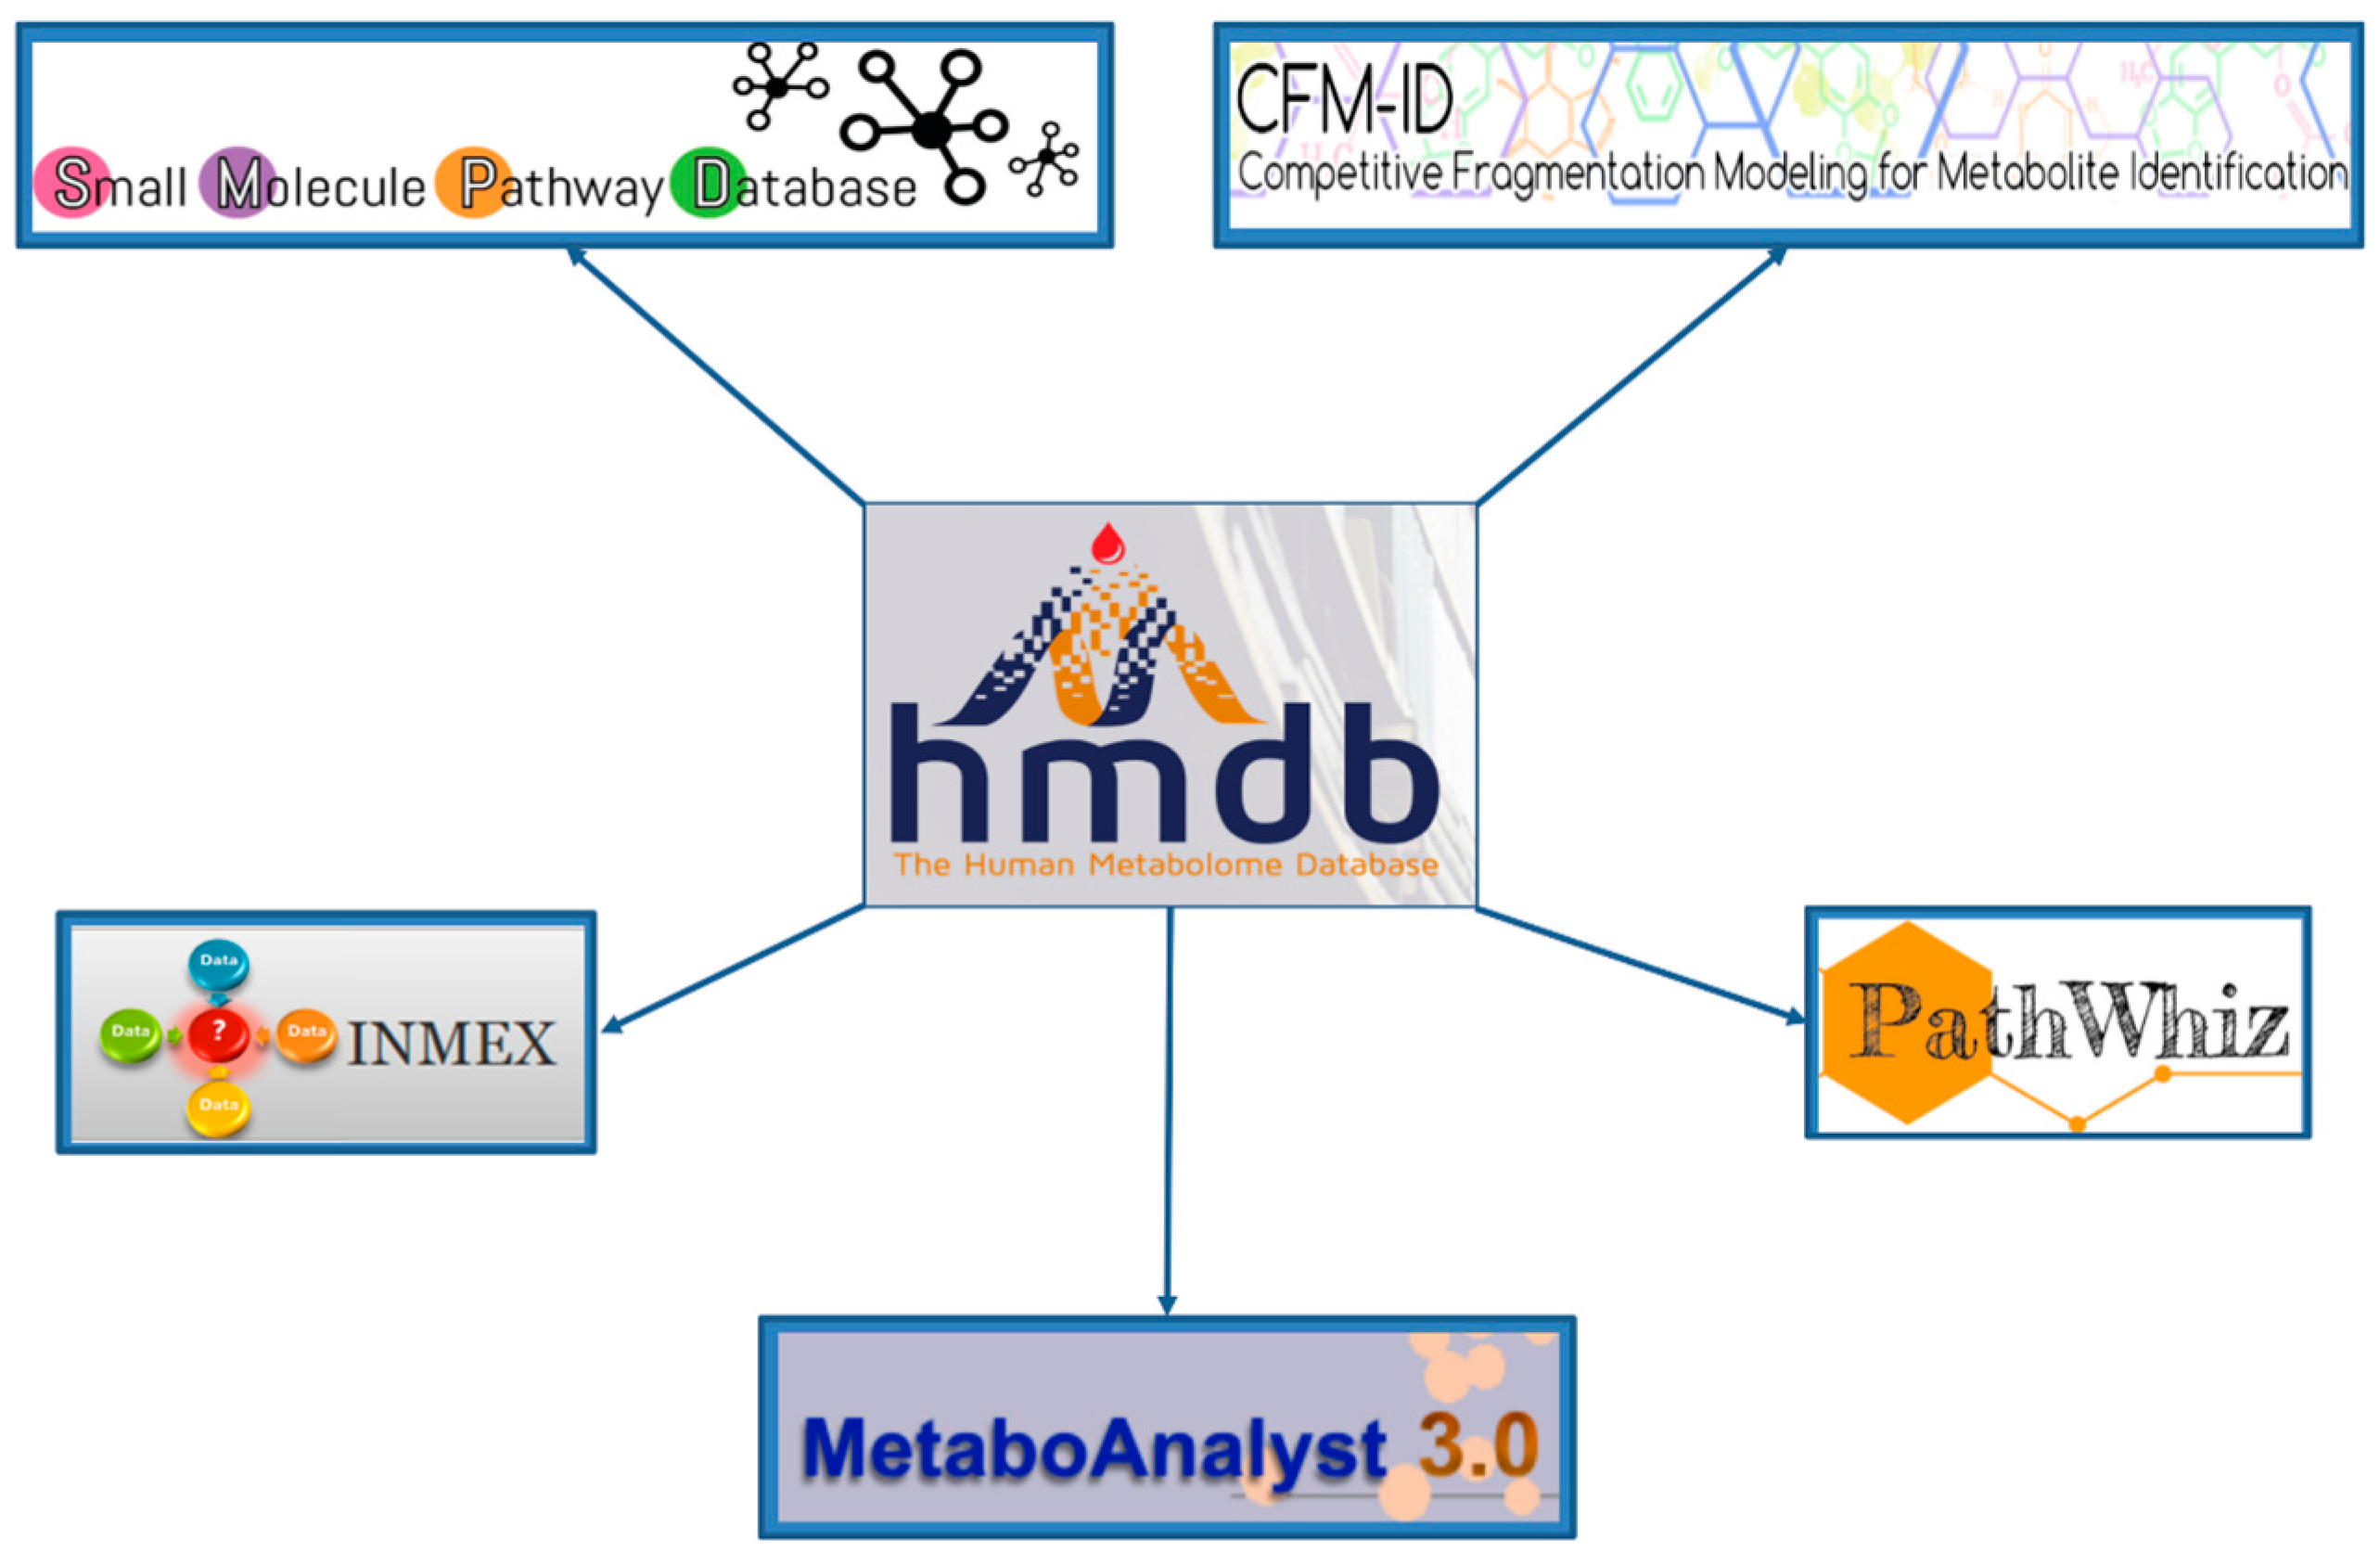
The HMDB serves as a hub to many online metabolomics and metabolism resources. As noted already, it is linked to several metabolomic analysis tools such as MetaboAnalyst [
42], PathWhiz [
37], SMPDB [
36], CFM-ID [
43,
44] and INMEX [
45]. These tools use the HMDB’s data resources to facilitate metabolomic data interpretation, analysis and visualization. This “hub-and-spoke” linkage is shown in
Figure 6. To better illustrate how these linkages occur we will demonstrate how the HMDB and SMPDB could be used in a cancer metabolomics study. For this example, let us assume that a high resolution MS experiment has been completed on CSF (cerebrospinal fluid) collected from a set of 30 patients with glioma and another set of 30 patients with no cancer symptoms (but with suspected meningitis, spinal fractures,
etc.). In the positive ion mode, peaks with the following
m/
z values were found to be significantly increased in the cancer patients: 149.0444, 117.0183, 119.0339, 91.0388 while the peaks with the following
m/
z values were found to be significantly decreased in the cancer patients relative to the non-cancer “controls”: 147.0763, 193.0341, 308.0911.
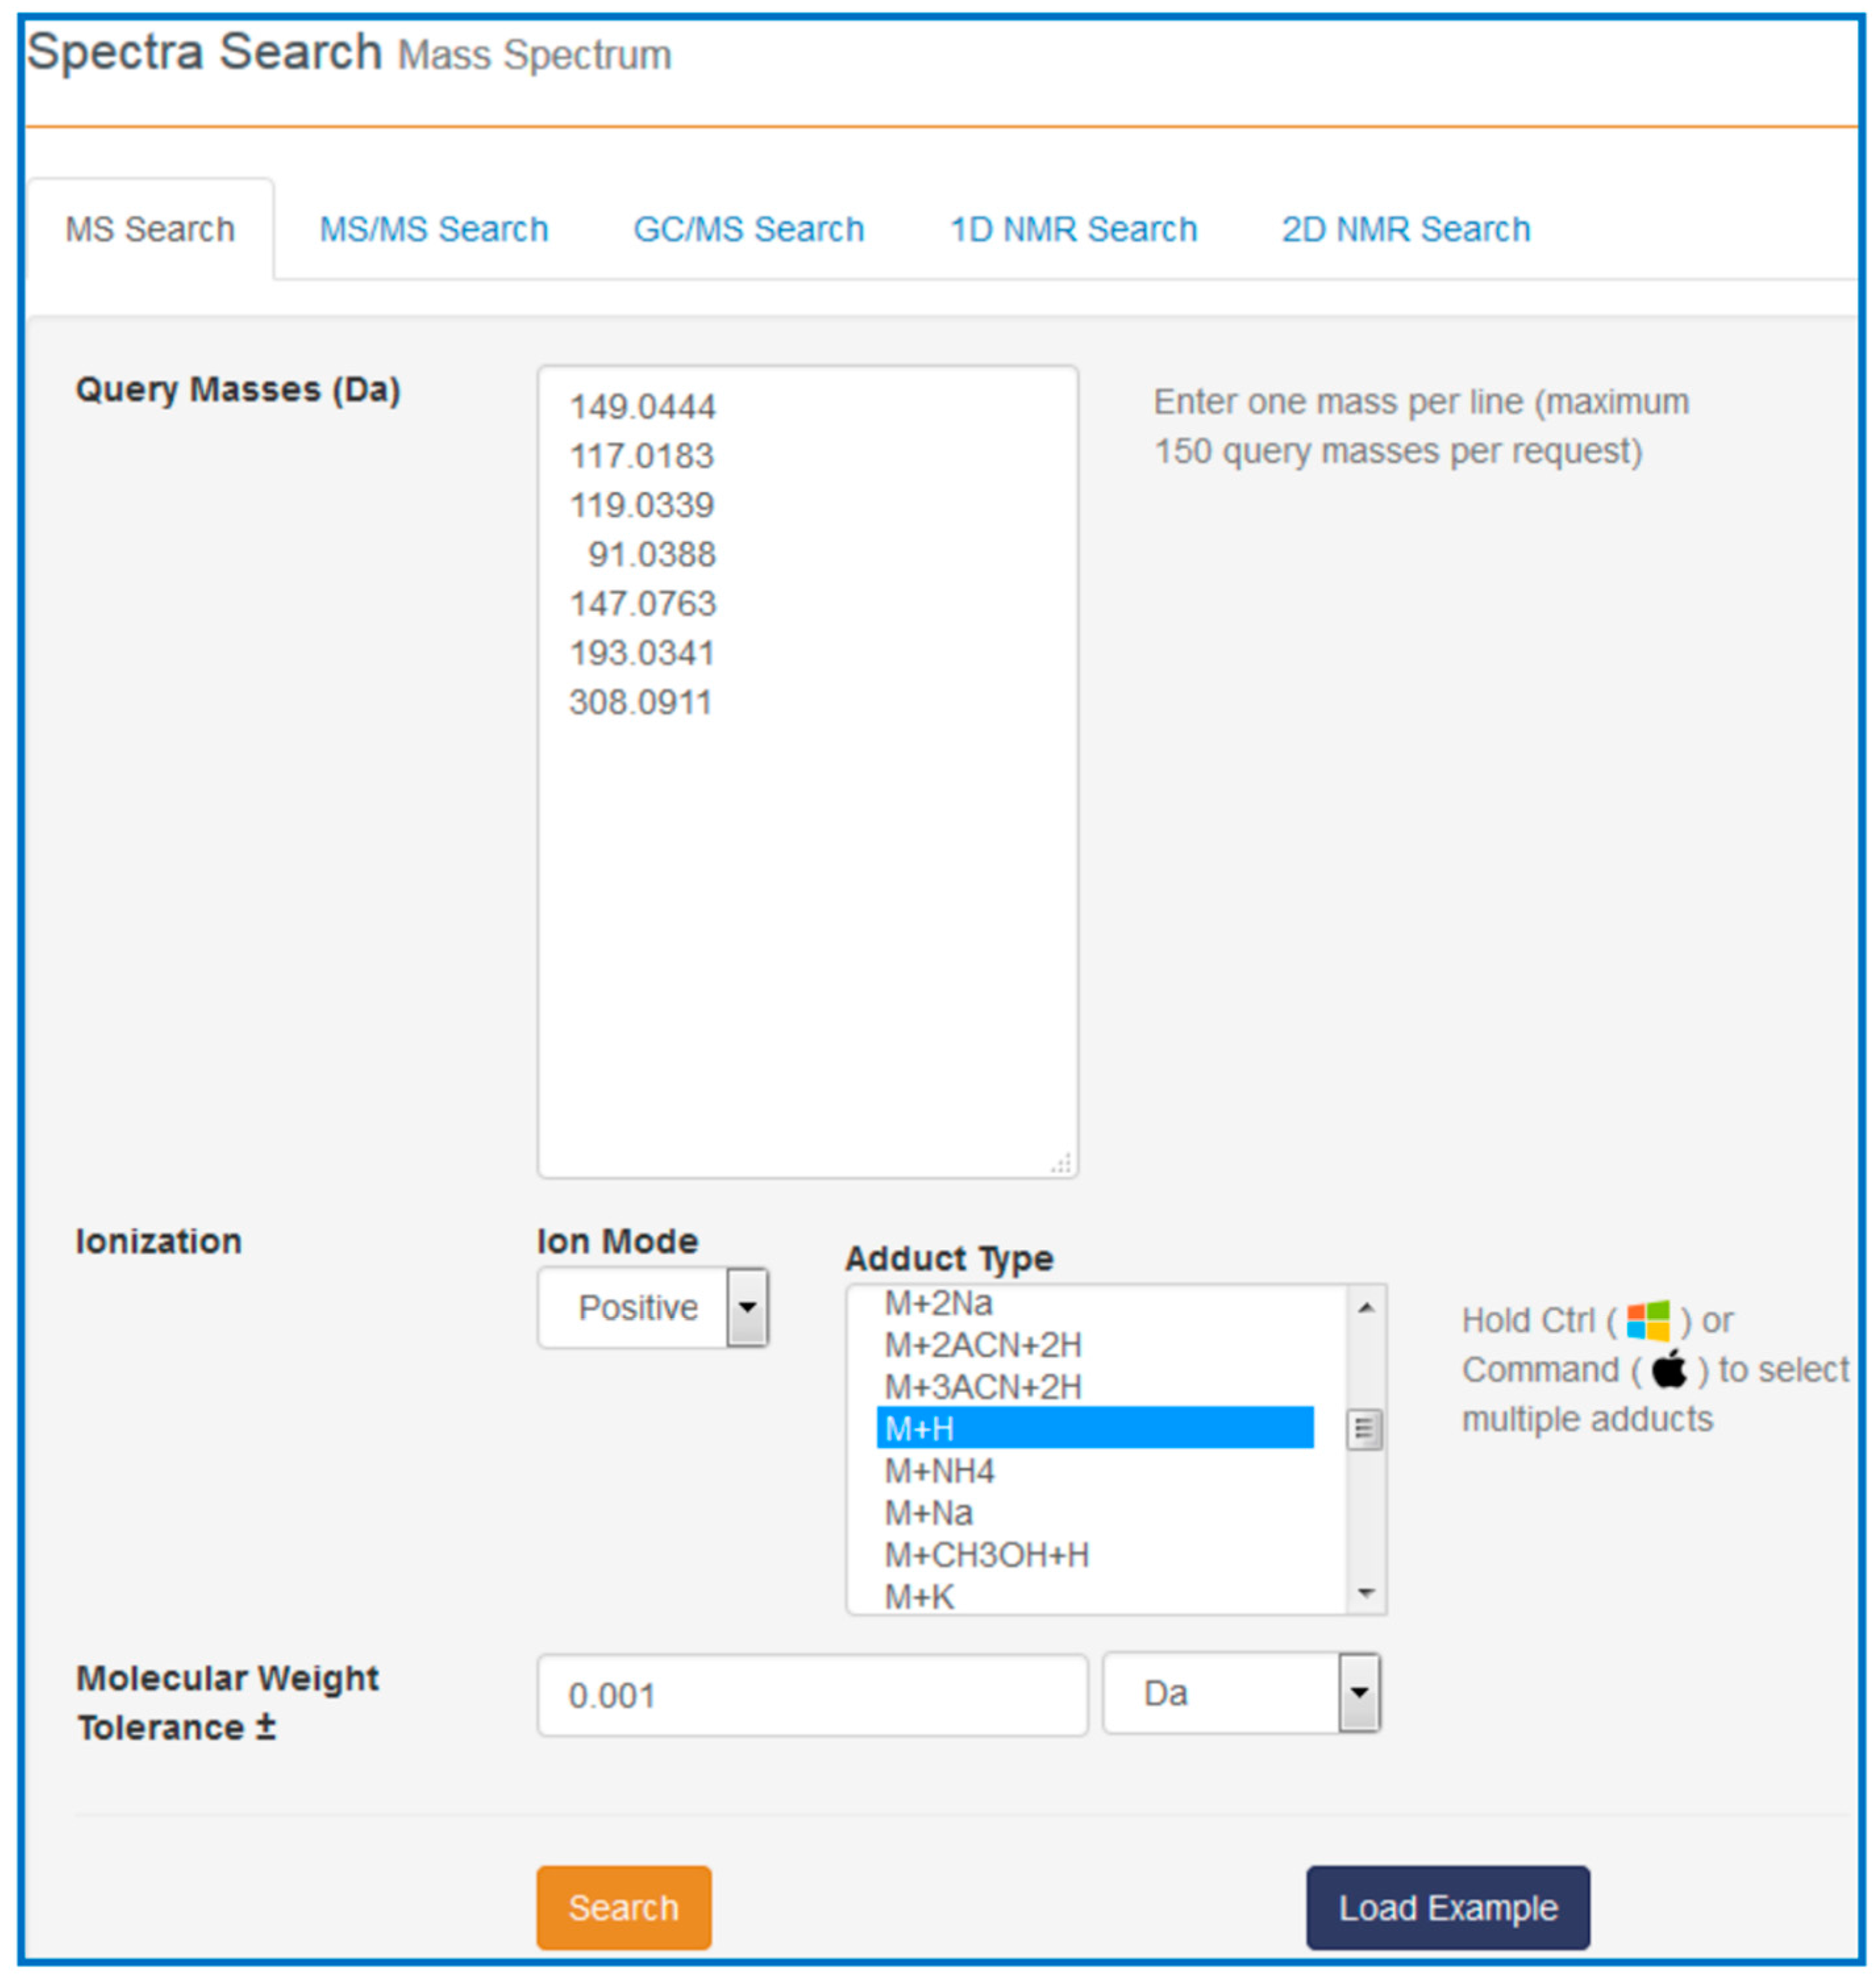
Our task is to find out what these compounds are, how they might be involved in cancer and with which pathways they are associated. To answer these questions, go to the HMDB website (
www.hmdb.ca) and click on the “Search” tab (at the top of the HMDB menu bar). The drop down menu will display several search options including sequence, text, spectral and molecular weight searches. For this example select the “MS Search” option. Once this is selected, type in the
m/
z values (listed above) into the “Query Masses” box. Make sure the Ion Mode is marked positive and the molecular weight tolerance is set to 0.001 Da. Choose the adduct type to be “M + H”. See
Figure 7 for a sample screen shot of what the query should look like. Press the search button. In a few seconds a list of top scoring hits in the HMDB will be displayed. In some cases five to six metabolites with identical masses (isobaric compounds) will be displayed.
From the list of top matches, click on any HMDB hyperlink under the “Compound” column. For instance, if you click HMDB00606 this will take you immediately to the HMDB metabocard for d-2-hydroxyglutarate. Reading through the description you will see that d-2-hydroxyglutarate has been implicated as an oncometabolite as well as a key metabolite in an inborn of metabolism (d-2-hydroxyglutaricaciduria). Scrolling down this information card, you will see its structure, its synonyms, its chemical classifications, its concentrations in different biofluids, a list of pathways that it is involved in and the enzymes or transporters that bind it or act on it. For this example we will limit our discussion to molecules that have moderately high concentrations (>1 uM) in known biofluids and which have known links to cancer metabolism. This information can be gleaned by clicking on each of the links from our MS search and reading the material in each HMDB metabocard. To save time, the final list of seven metabolites is: d-2-hydroxyglutarate (increased), fumarate (increased), succinate (increased), lactate (increased), glutamine (decreased), isocitrate (decreased) and glutathione (decreased).
Identifying compounds using only m/z data is always a bit risky. If we had MS/MS data for these compounds we could have searched for similar MS/MS spectra via HMDB’s “MS/MS Search” option or we could have gone to the CFM-ID website and performed a similar kind of MS/MS spectral search. Finding matching MS/MS spectra (either observed or predicted) to our query MS/MS spectra would have given us additional supporting evidence regarding the actual identity of these compounds.
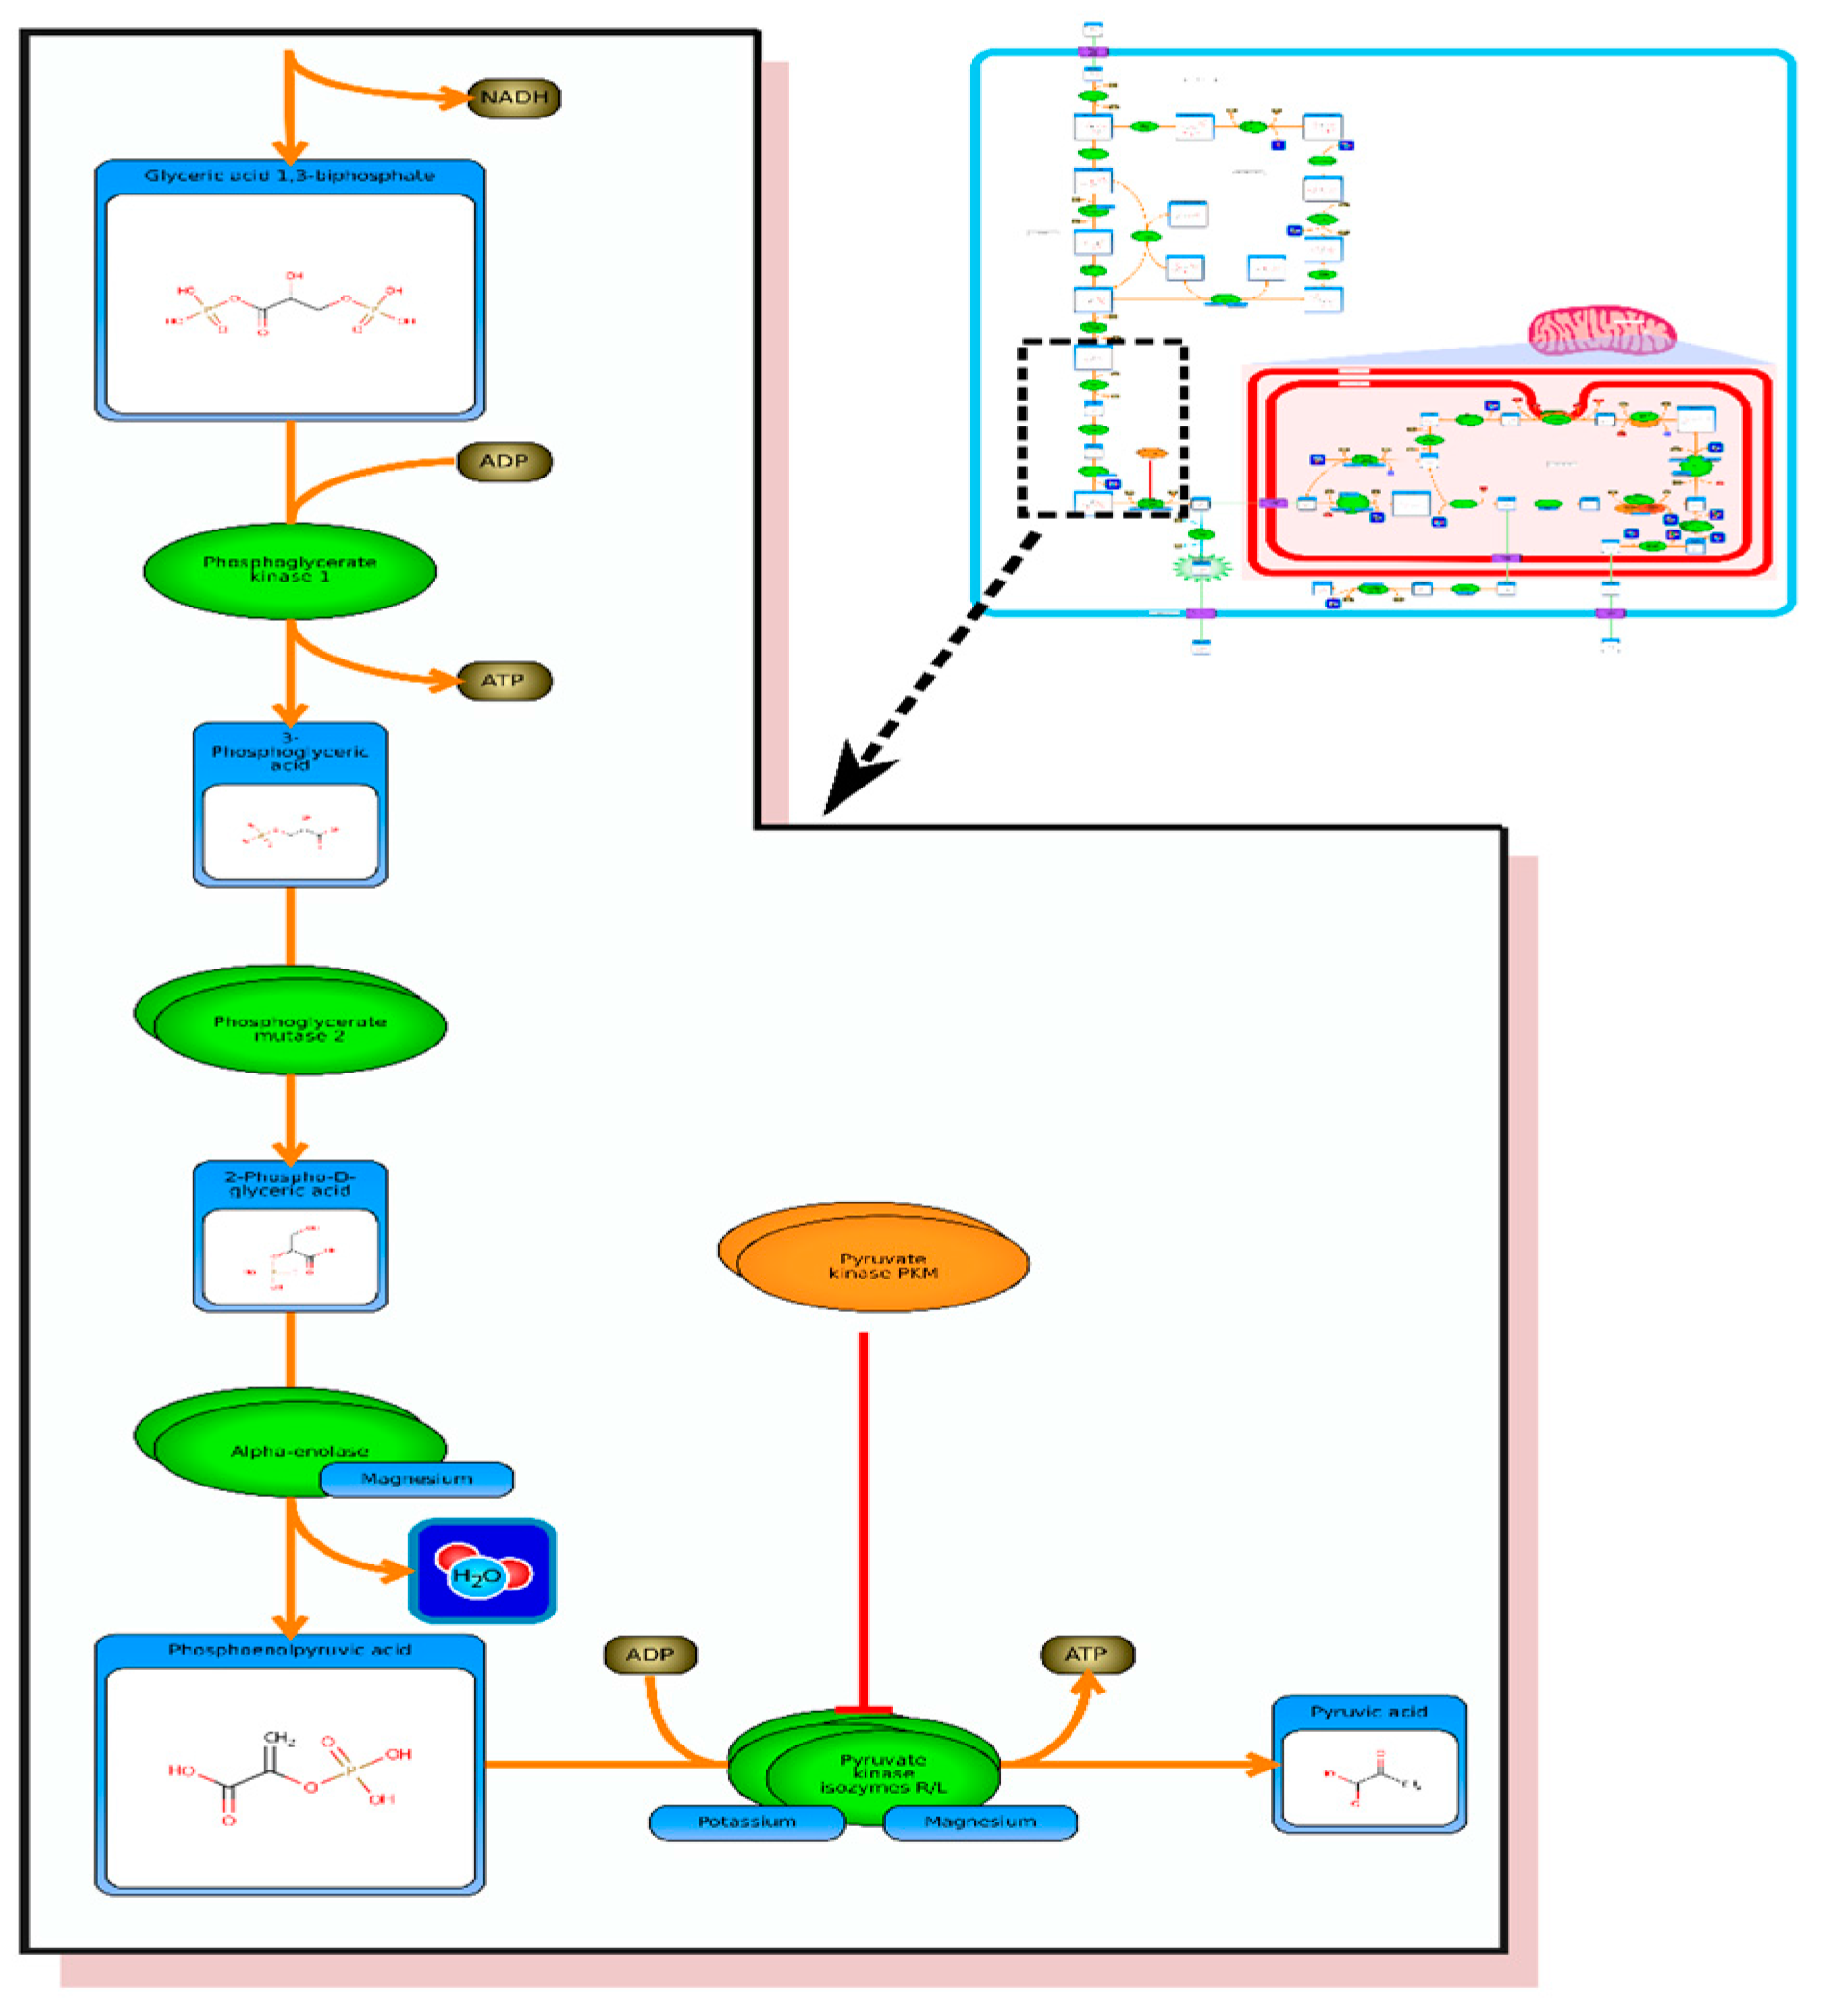
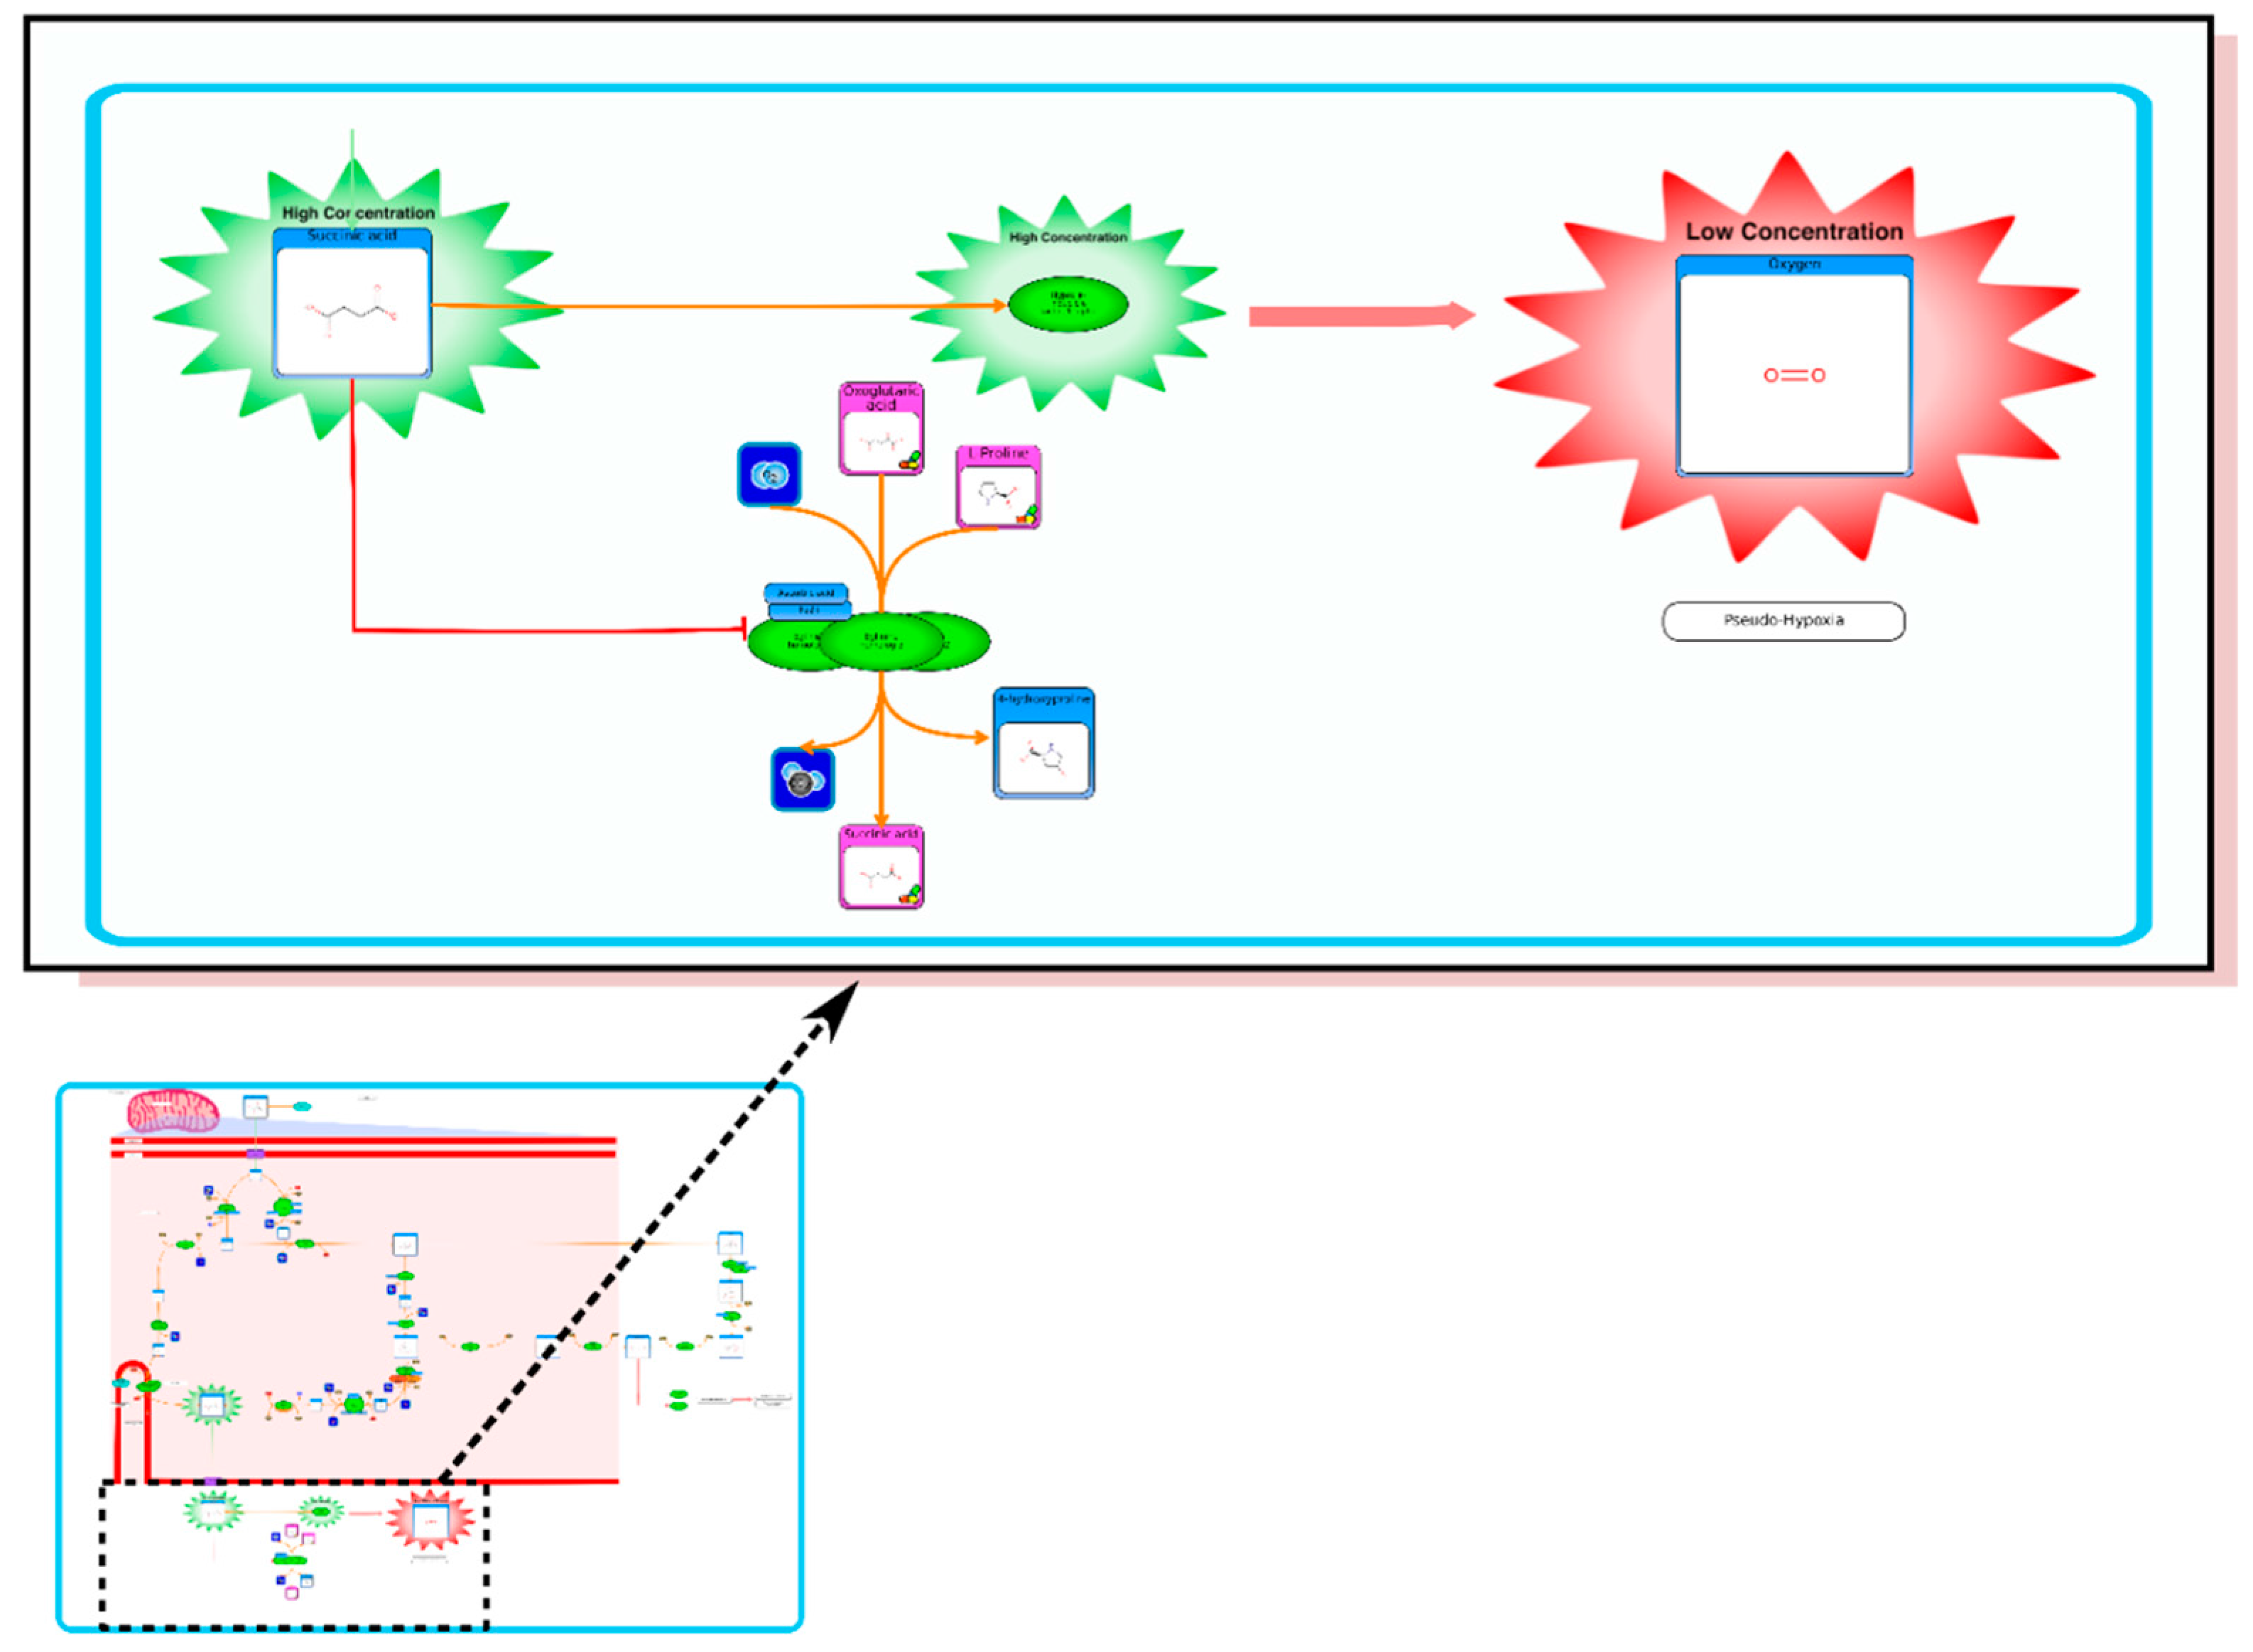
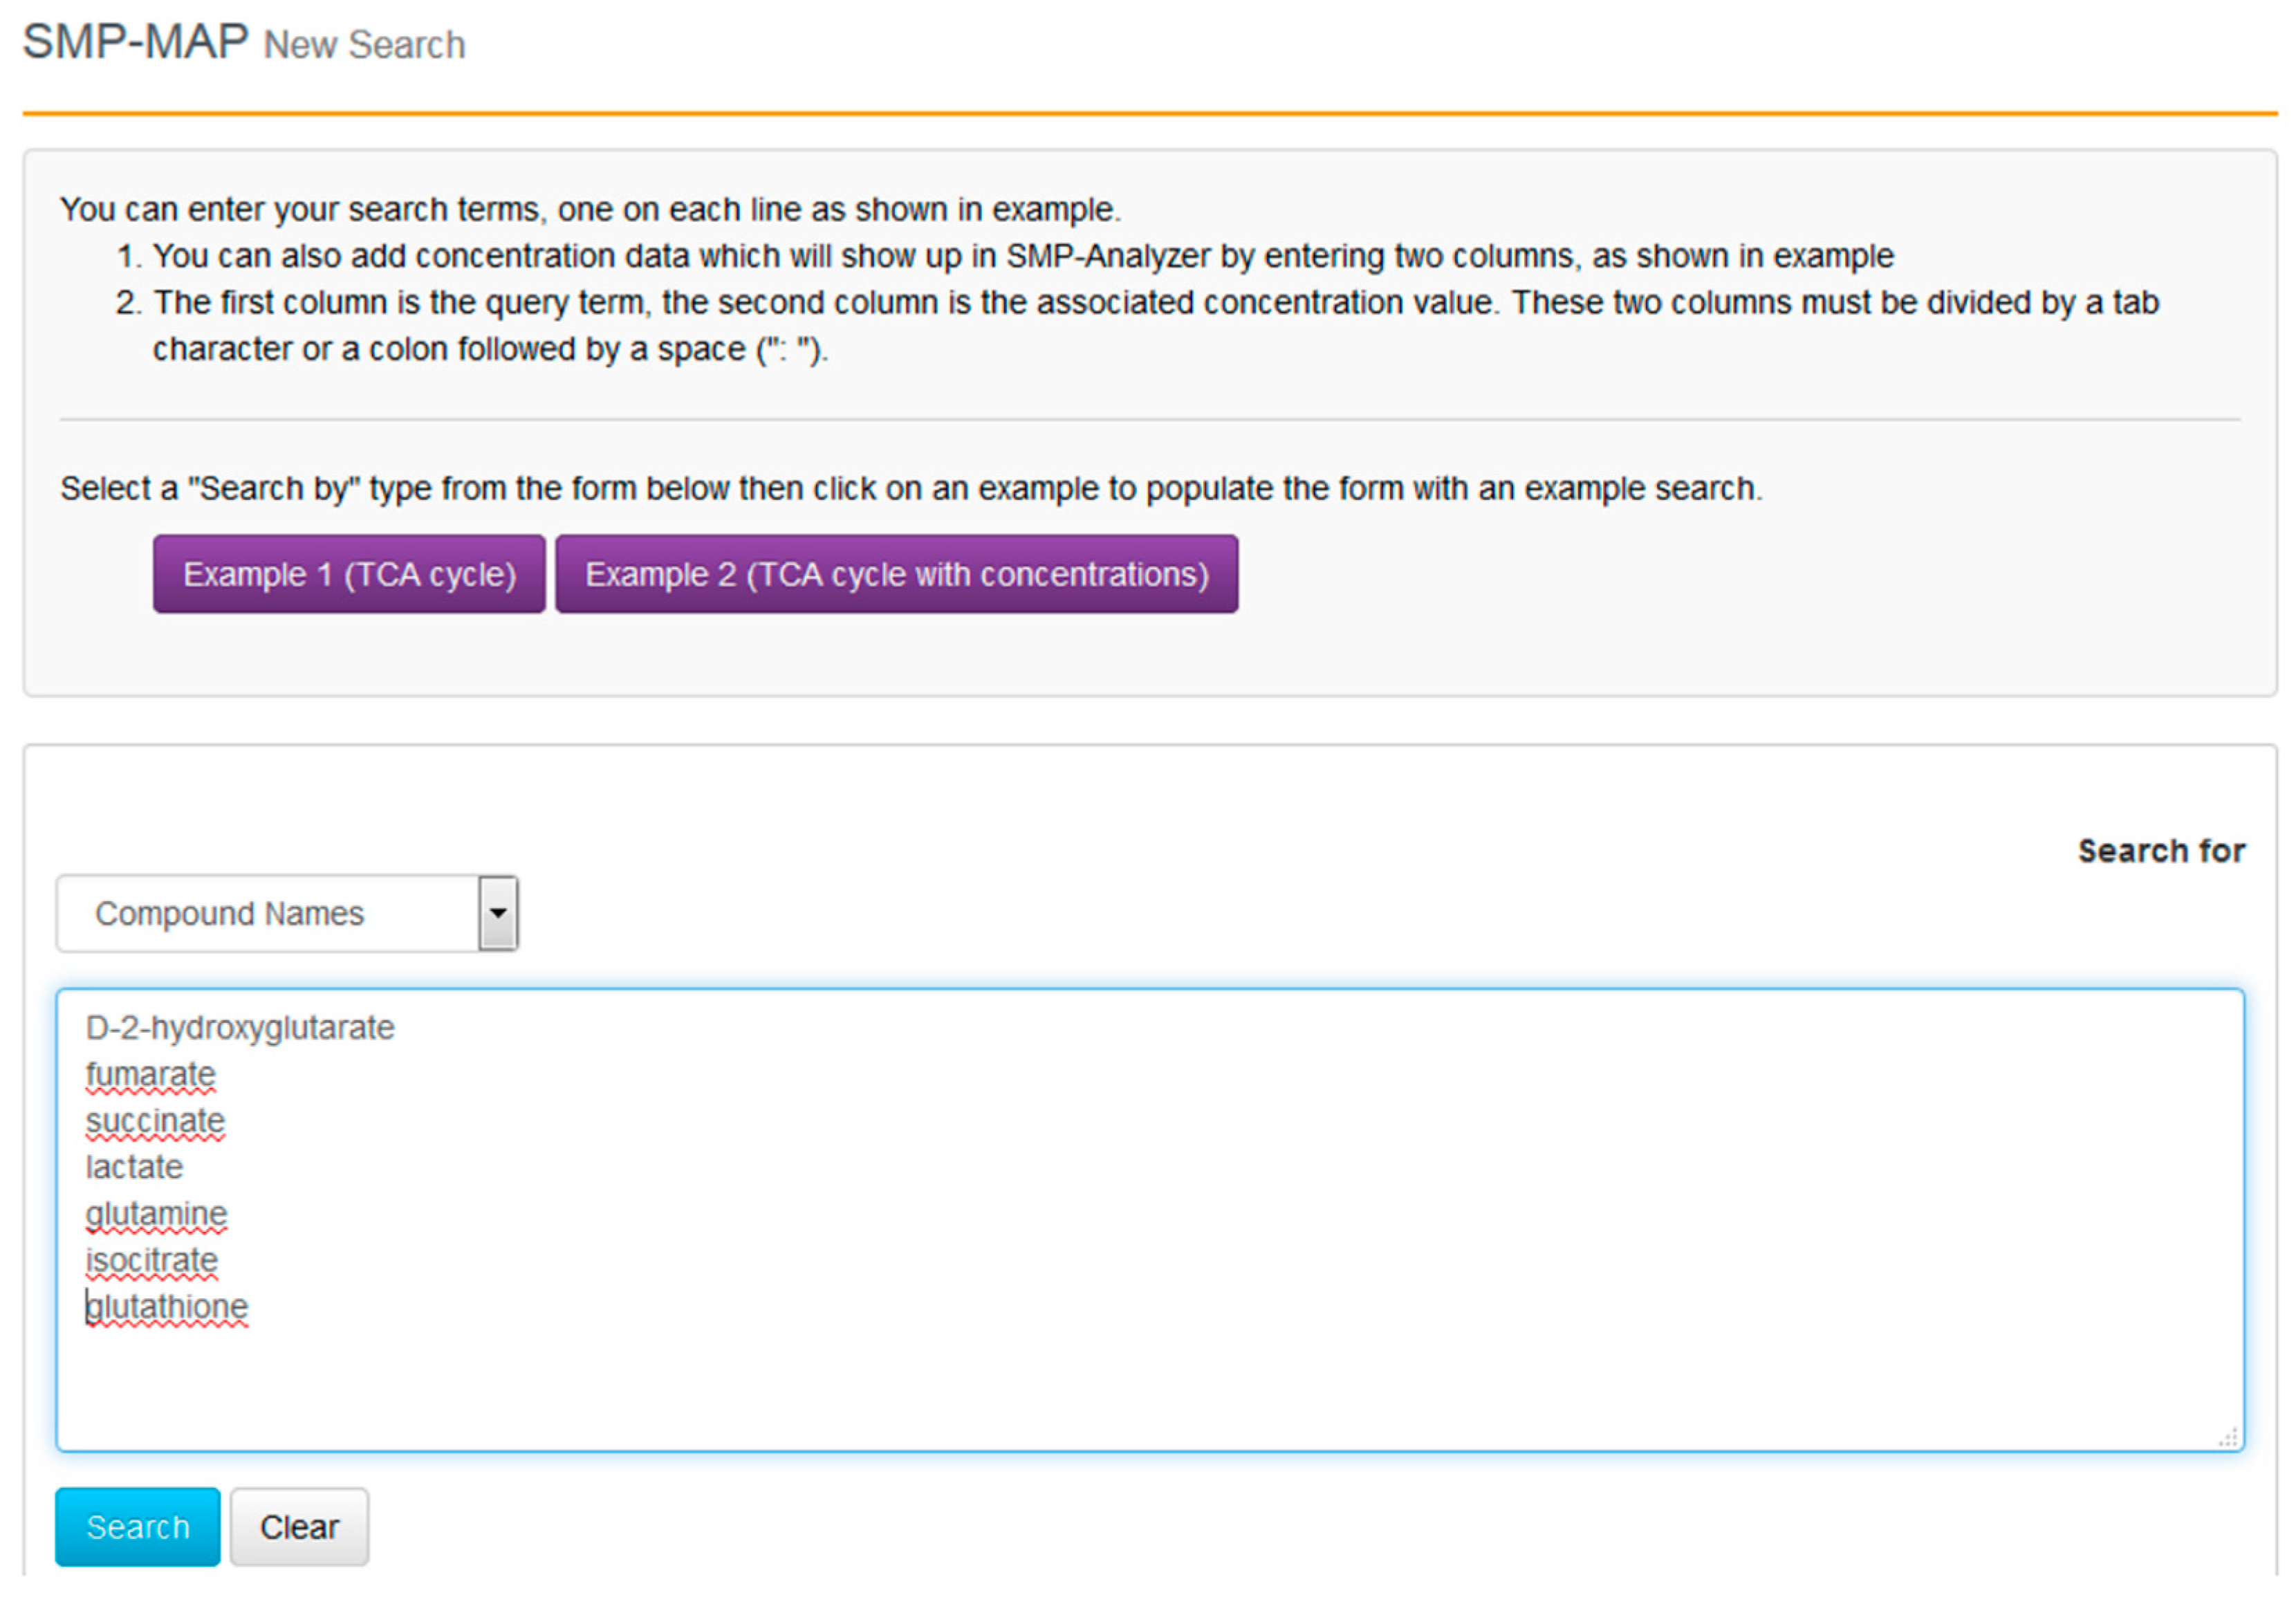
With the compounds identified and their clinical context more clearly delineated, we can now proceed to go to SMPDB and get a better picture of their molecular biological or biochemical context. SMPDB is a pathway database that uses HMDB as a reference “hub”. It also supports some useful pathway visualization tools. For this example go to the SMPDB website (
www.smpdb.ca) and click on the “Search” tab (at the top of the SMPDB menu bar). The drop down menu will display several search options including sequence, text and molecular weight searches. For this example select the “SMP-MAP Advanced Search” option. Once this is selected, type in the list of compounds names (
d-2-hydroxyglutarate, fumarate, succinate, lactate, glutamine, isocitrate, glutathione) in a single column. See
Figure 8 for a sample screen shot of what the query should look like. Press the search button. In a few seconds a list of disease pathways associated with these metabolites should appear. On the top menu bar you should see a list of seven pathway categories (All, Metabolic, Physiological,
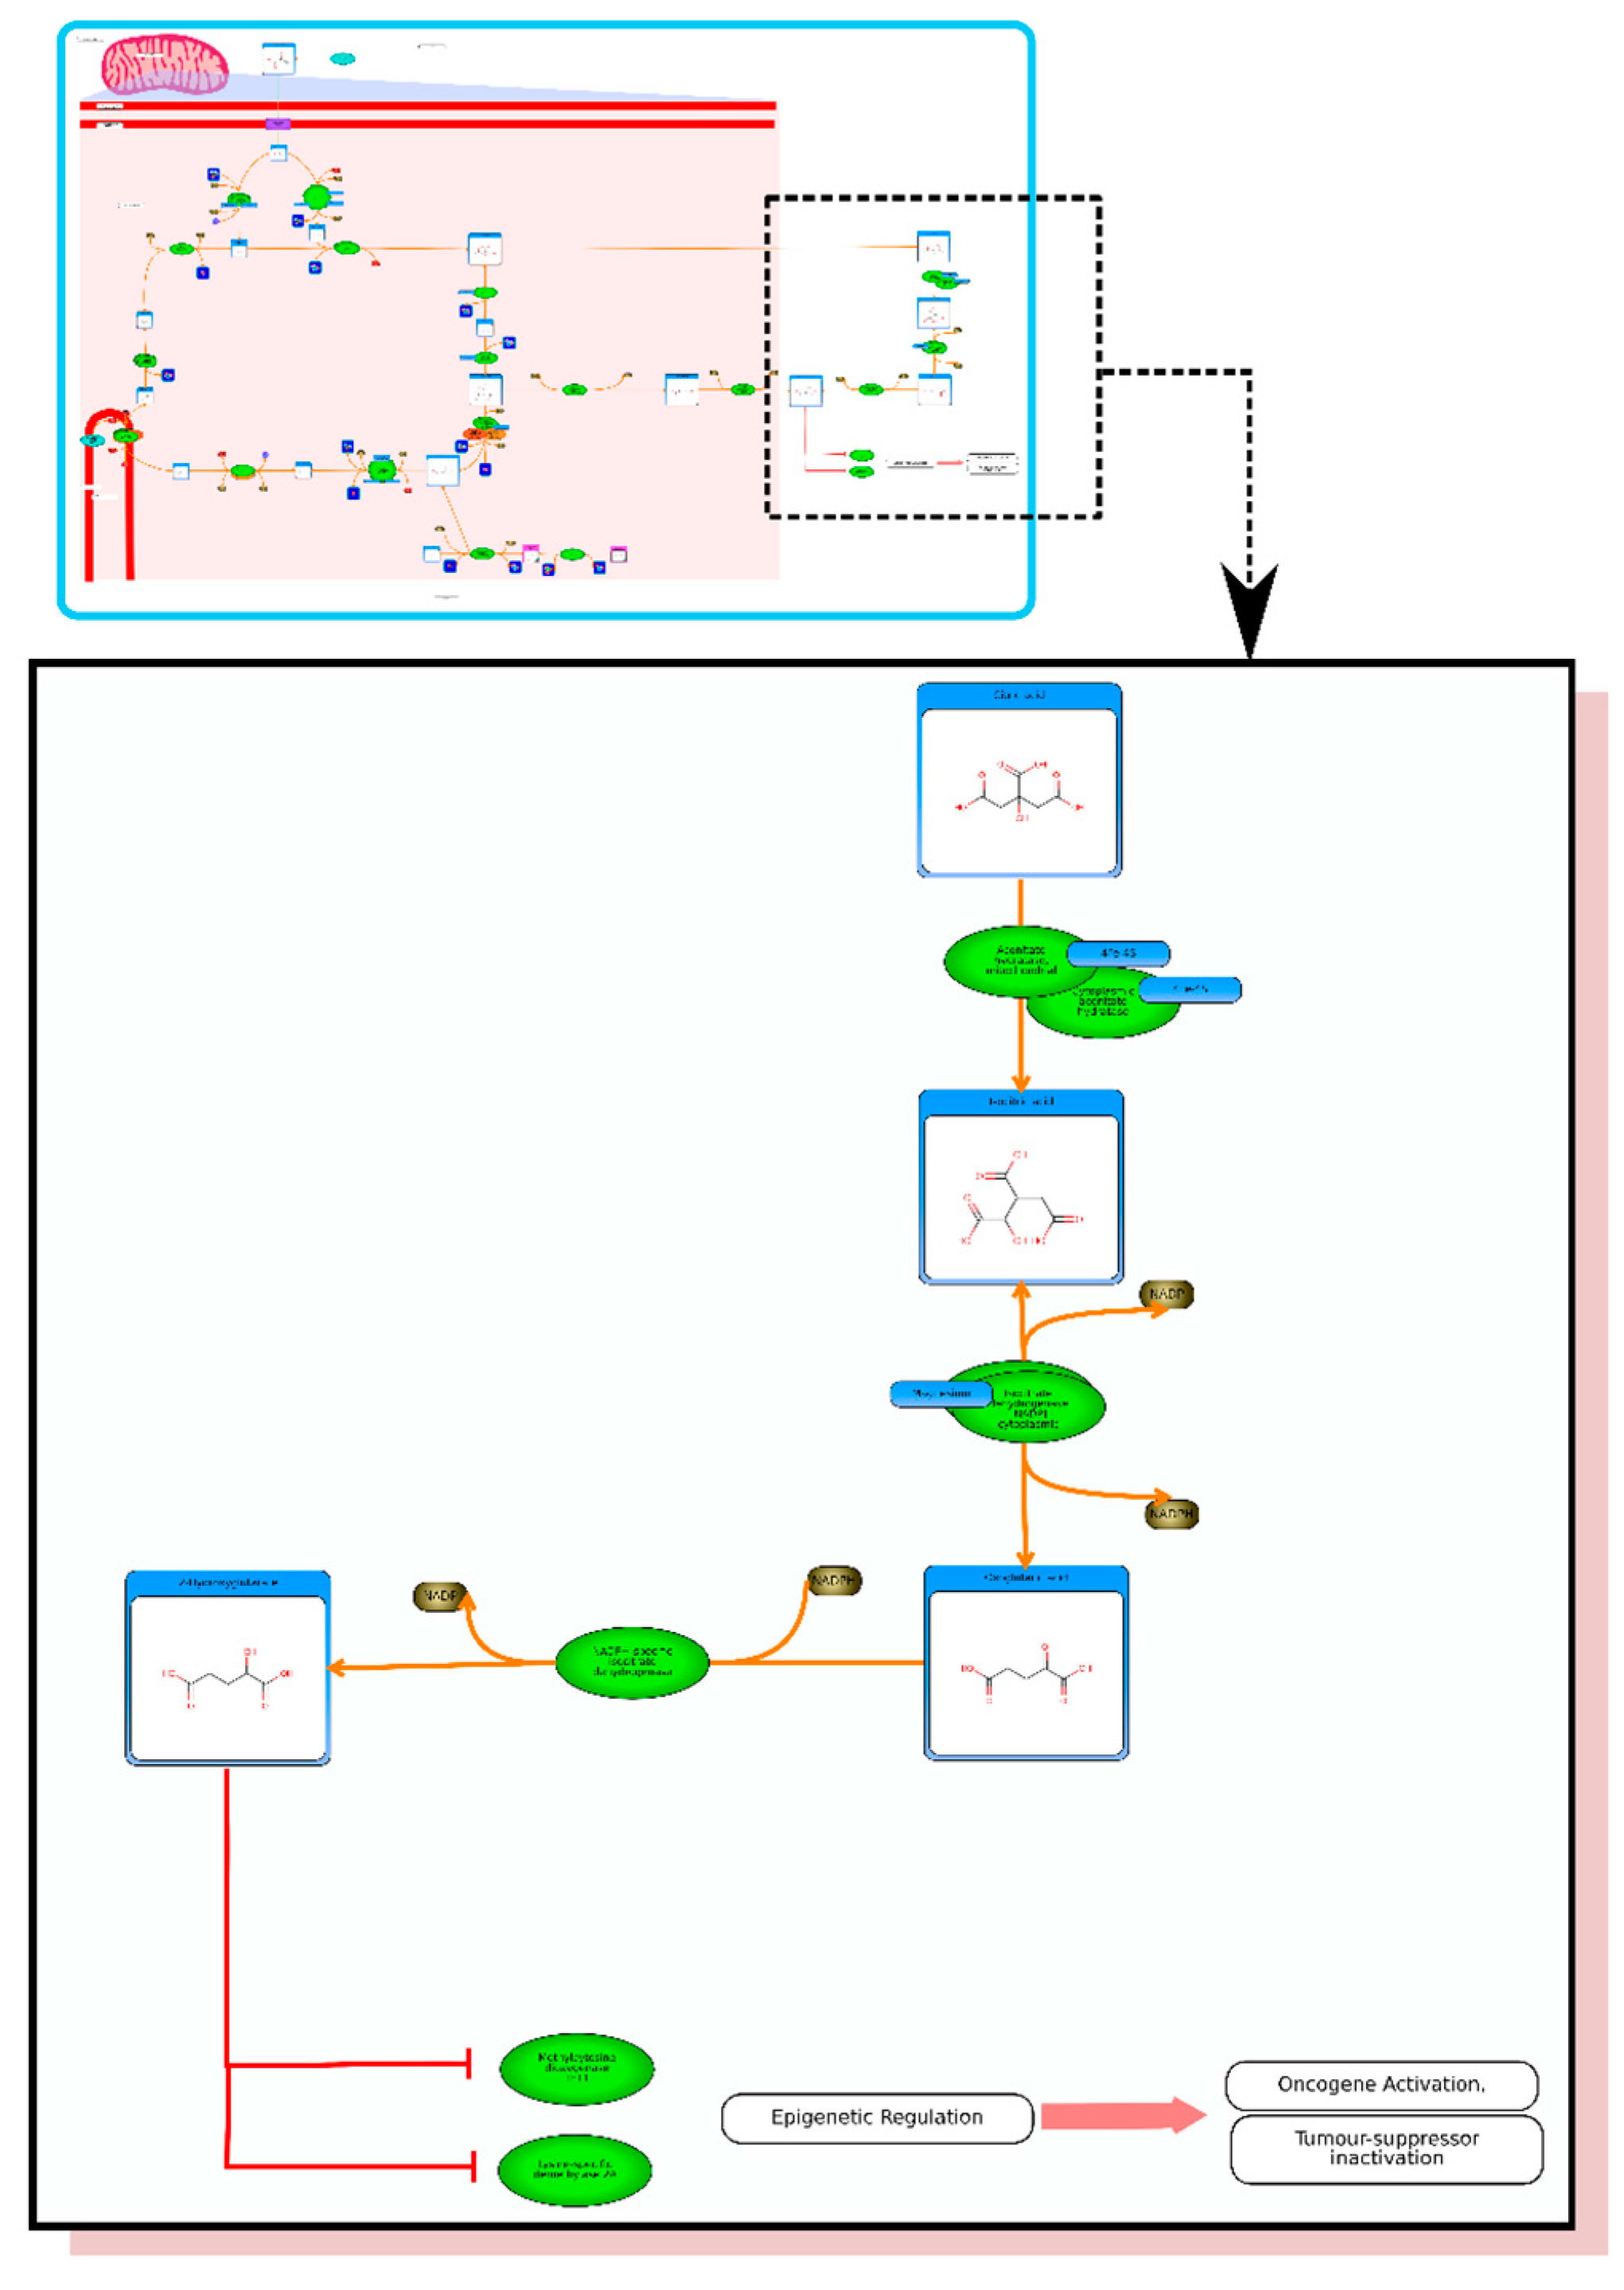
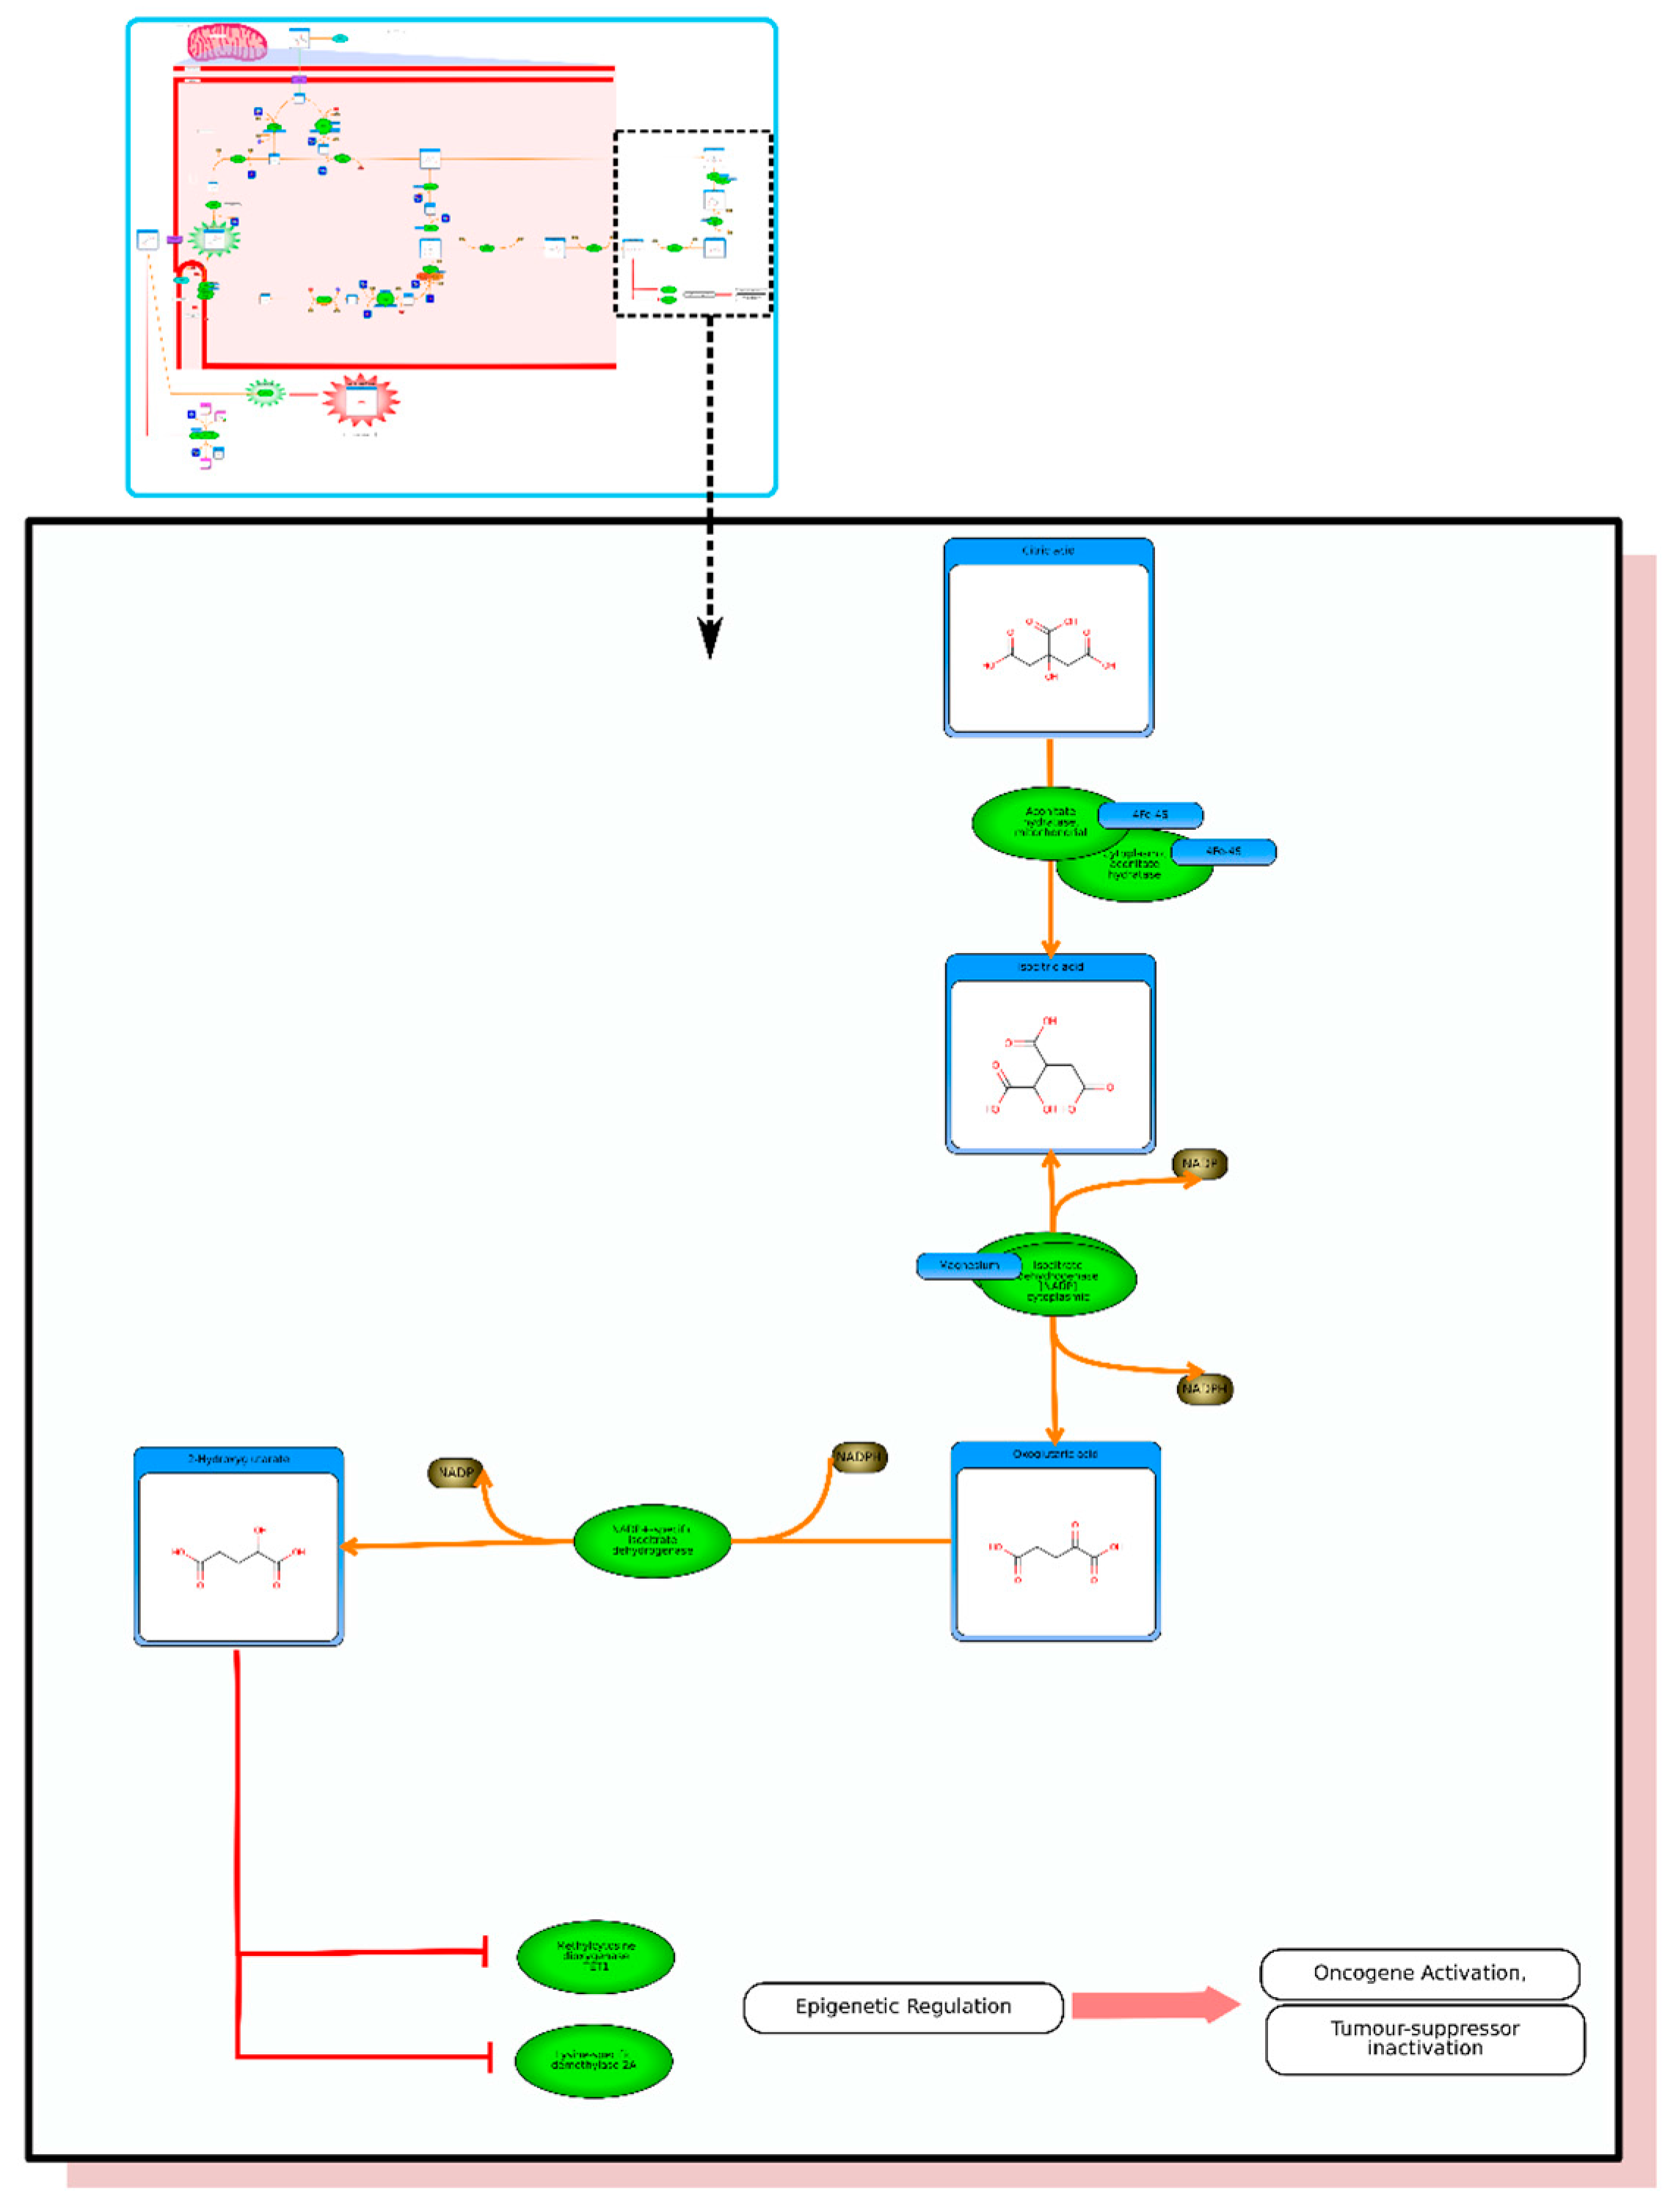
etc.). On the far right tab “Disease Pathways” should be visible. If you click on that hyperlink a list of 175 Disease pathways should be visible. One of the top hits will be a pathway entitled “The oncogenic action of 2-hydroxyglutarate”. Clicking on any of these pathway images and zooming into each pathway using the JavaScript widgets should allow you to explore the pathway in more detail and gain an understanding of how 2-hydroxyglutarate is produced, its likely mechanism of action and the various upstream and downstream products of its metabolism and transport.
Acknowledgments
Funding for the HMDB and many of the programs described in this review has been provided by Genome Canada, Genome Alberta, The Canadian Institutes of Health Research, Alberta Innovates BioSolutions, Alberta Innovates Health Solutions, The National Research Council, and The National Institute of Nanotechnology.
Author Contributions
Rupasri Mandal and Avalyn Stanislaus performed literature review, and prepared the manuscript draft including tables and figures. Miguel Ramirez-Gaona generated the pathways in the HMDB. David S. Wishart conceived the topic of the review and its design, critically revised the manuscript including tables, figures and gave final approval of the manuscript.
Conflicts of Interest
The authors declare no conflict of interest.
References
- Warburg, O.; Wind, F.; Negelein, E. The Metabolism of tumors in the body. J. Gen. Physiol. 1927, 8, 519–530. [Google Scholar] [CrossRef] [PubMed]
- Vander Heiden, M.G.; Canltey, L.C.; Thompson, C.B. Understanding the Warburg effect: The metabolic requirements of cell proliferation. Science 2009, 324, 1029–1033. [Google Scholar] [CrossRef] [PubMed]
- Ward, P.S.; Patel, J.; Wise, D.R.; Abdel-Wahab, O.; Bennett, B.D.; Coller, H.A.; Cross, J.R.; Fantin, V.R.; Hedvat, C.V.; Perl, A.E.; et al. The common feature of leukemia-associated IDH1 and IDH2 mutations is a neomorphic enzyme activity converting alpha-ketoglutarate to 2-hydroxyglutarate. Cancer Cell 2010, 17, 225–234. [Google Scholar] [CrossRef] [PubMed]
- Wishart, D.S. Is cancer a genetic disease or a metabolic disease? EBioMedicine 2015, 2, 478–479. [Google Scholar] [CrossRef] [PubMed]
- Kobayashi, T.; Nishiumi, S.; Ikeda, A.; Yoshie, T.; Sakai, A.; Matsubara, A.; Izumi, Y.; Tsumura, H.; Tsuda, M.; Nishisaki, H.; et al. A novel serum metabolomics-based diagnostic approach to pancreatic cancer. Cancer Epidemiol. Biomarkers Prev. 2013, 22, 571–579. [Google Scholar] [CrossRef] [PubMed]
- Beger, R.; Schnackenberg, L.; Holland, R.; Li, D.; Dragan, Y. Metabonomic models of human pancreatic cancer using 1d proton NMR spectra of lipids in plasma. Metabolomics 2006, 2, 125–134. [Google Scholar] [CrossRef]
- Ganti, S.; Weiss, R.H. Urine metabolomics for kidney cancer detection and biomarker discovery. Metabolomics 2011, 29, 551–557. [Google Scholar] [CrossRef] [PubMed]
- Wang, Q.; Gao, P.; Wang, X.; Duan, Y. Investigation and identification of potential biomarkers in human saliva for the early diagnosis of oral squamous cell carcinoma. Clin. Chim. Acta 2014, 427, 79–85. [Google Scholar] [CrossRef] [PubMed]
- Tian, Y.; Nie, X.; Xu, S.; Li, Y.; Huang, T.; Tang, H.; Wang, Y. Integrative metabonomics as potential method for diagnosis of thyroid malignancy. Sci. Rep. 2015, 5. [Google Scholar] [CrossRef] [PubMed]
- Handa, H.; Usuba, A.; Maddula, S.; Baumbach, J.I.; Mineshita, M.; Miyazawa, T. Exhaled breath analysis for lung cancer detection using ion mobility spectrometry. PLoS ONE 2014, 9, e114555. [Google Scholar] [CrossRef] [PubMed]
- Westhoff, M.; Litterst, P.; Freitag, L.; Urfer, W.; Bader, S.; Baumbach, J.I. Ion mobility spectrometry for the detection of volatile organic compounds in exhaled breath of patients with lung cancer: Results of a pilot study. Thorax 2009, 64, 744–748. [Google Scholar] [CrossRef] [PubMed]
- Mimmi, M.C.; Finato, N.; Pizzolato, G.; Beltrami, C.A.; Fogolari, F.; Corazza, A.; Esposito, G. Absolute quantification of choline-related biomarkers in breast cancer biopsies by liquid chromatography electrospray ionization mass spectrometry. Anal. Cell. Pathol. 2013, 36, 71–83. [Google Scholar] [CrossRef]
- Wei, S.; Liu, L.; Zhang, J.; Bowers, J.; Gowda, G.A.N.; Seeger, H.; Fehm, T.; Neubauer, H.J.; Vogel, U.; Clare, S.E.; et al. Metabolomics approach for predicting response to neoadjuvant chemotherapy for breast cancer. Mol. Oncol. 2013, 7, 297–307. [Google Scholar] [CrossRef] [PubMed]
- Jobard, E.; Pontoizeau, C.; Blaise, B.J.; Bachelot, T.; Elena-Herrmann, B.; Trédan, O. A serum nuclear magnetic resonance-based metabolomic signature of advanced metastatic human breast cancer. Cancer Lett. 2014, 343, 33–41. [Google Scholar] [CrossRef] [PubMed]
- Jiménez, B.; Mirnezami, R.; Kinross, J.; Cloarec, O.; Keun, H.C.; Holmes, E.; Goldin, R.D.; Ziprin, P.; Darzi, A.; Nicholson, J.K. 1H HR-MAS NMR spectroscopy of tumor-induced local metabolic “field-effects” enables colorectal cancer staging and prognostication. J. Proteome Res. 2013, 12, 959–968. [Google Scholar] [CrossRef] [PubMed]
- Tan, B.; Qiu, Y.; Zou, X.; Chen, T.; Xi, G.; Cheng, Y.; Dong, T.; Zhao, L.; Feng, B.; Hu, X.; et al. Metabonomics identifies serum metabolite markers of colorectal cancer. J. Proteome Res. 2013, 12, 3000–3009. [Google Scholar] [CrossRef] [PubMed]
- Tripathi, P.; Kamarajan, P.; Somashekar, B.S.; MacKinnon, N.; Chinnaiyan, A.M.; Kapila, Y.L.; Rajendiran, T.M.; Ramamoorthy, A. Delineating metabolic signatures of head and neck squamous cell carcinoma: Phospholipase A2, a potential therapeutic target. Int. J. Biochem. Cell Biol. 2012, 44, 1852–1861. [Google Scholar] [CrossRef] [PubMed]
- Wishart, D.S. Computational strategies for metabolite identification in metabolomics. Bioanalysis 2009, 1, 1579–1596. [Google Scholar] [CrossRef] [PubMed]
- Wishart, D.S.; Tzur, D.; Knox, C.; Eisner, R.; Guo, A.C.; Young, N.; Cheng, D.; Jewell, K.; Arndt, D.; Sawhany, S.; et al. HMDB: The Human Metabolome Database. Nucleic Acids Res. 2007, 35, D521–D526. [Google Scholar] [CrossRef] [PubMed]
- Wishart, D.S.; Jewison, T.; Guo, A.C.; Wilson, M.; Knox, C.; Liu, Y.; Djoumbou, Y.; Mandal, R.; Aziat, F.; Dong, E.; et al. HMDB 3.0—The Human Metabolome Database in 2013. Nucleic Acids Res. 2013, 41, D801–D807. [Google Scholar] [CrossRef] [PubMed]
- Kanehisa, M.; Goto, S.; Sato, Y.; Kawashima, M.; Furumichi, M.; Tanabe, M. Data, information, knowledge and principle: Back to metabolism in KEGG. Nucleic Acids Res. 2014, 42, D19–D205. [Google Scholar] [CrossRef] [PubMed]
- Caspi, R.; Billington, R.; Ferrer, L.; Foerster, H.; Vulcher, C.A.; Keseler, I.M.; Kothari, A.; Krummenacker, M.; Latendresse, M.; Mueller, L.A.; et al. The MetaCyc database of metabolic pathways and enzymes and the BioCyc collection of pathway/genome databases. Nucleic Acids Res. 2015. [Google Scholar] [CrossRef]
- NCBI Resource Coordinators. Database resources at the National Center for Biotechnology Information. Nucleic Acids Res. 2015, 43, D6–D17. [Google Scholar]
- De Matos, P.; Alcantara, R.; Dekker, A.; Ennis, M.; Hastings, J.; Haug, K.; Spiteri, I.; Turner, S.; Steinbeck, C. Chemical Entities of Biological Interest: An update. Nucleic Acids Res. 2010, 38, D249–D254. [Google Scholar] [CrossRef] [PubMed]
- Berman, H.; Henrick, K.; Nakamura, H.; Markley, J.L. The worldwide Protein Data Bank (wwPDB): Ensuring a single, uniform archive of PDB data. Nucleic Acids Res. 2007, 35, D301–D303. [Google Scholar] [CrossRef] [PubMed]
- The UniProt Consortium. UniProt: A hub for protein information. Nucleic Acids Res. 2015, 43, D204–D212. [Google Scholar]
- Ulrich, E.L.; Akutsu, H.; Doreleijers, J.F.; Harano, Y.; Ioannidis, Y.E.; Lin, J.; Livny, M.; Mading, S.; Maziuk, D.; Miller, Z.; et al. BioMagResBank. Nucleic Acids Res. 2008, 36, D402–D408. [Google Scholar] [CrossRef] [PubMed]
- Smith, C.A.; O’Maille, G.; Want, E.J.; Qin, C.; Trauger, S.A.; Brandon, T.R.; Custodio, D.E.; Abagyan, R.; Siuzdak, G. METLIN: A metabolite mass spectral database. Ther. Drug Monit. 2005, 27, 747–751. [Google Scholar] [CrossRef] [PubMed]
- Horai, H.; Arita, M.; Kanaya, S.; Nihei, Y.; Ikeda, T.; Suwa, K.; Ojima, Y.; Tanaka, K.; Tanaka, S.; Aoshima, K.; et al. MassBank: A public repository for sharing mass spectral data for life sciences. J. Mass Spectrom. 2010, 45, 703–714. [Google Scholar] [CrossRef] [PubMed]
- Mandal, R.; Guo, A.C.; Chaudhary, K.K.; Liu, P.; Yallou, F.S.; Dong, E.; Aziat, F.; Wishart, D.S. Multi-platform characterization of the human cerebrospinal fluid metabolome: A comprehensive and quantitative update. Genome Med. 2012, 4, 38–48. [Google Scholar] [CrossRef] [PubMed]
- Psychogios, N.; Hau, D.D.; Peng, J.; Guo, A.C.; Mandal, R.; Bouatra, S.; Sinelnikov, I.; Krishnamurthy, R.; Eisner, R.; Gautam, B.; et al. The Human serum metabolome. PLoS ONE 2011, 6, e16957. [Google Scholar] [CrossRef] [PubMed]
- Bouatra, S.; Aziat, F.; Mandal, R.; Guo, A.C.; Wilson, M.R.; Knox, C.; Bjorndahl, T.C.; Krishnamurthy, R.; Saleem, F.; Liu, P.; et al. The human urine metabolome. PLoS ONE 2013, 8, e73076. [Google Scholar] [CrossRef] [PubMed]
- Dame, Z.T.; Aziat, F.; Mandal, R.; Krishnamurthy, R.; Bouatra, S.; Borzouie, S.; Guo, A.C.; Sajed, T.; Deng, L.; Lin, H.; et al. The human saliva metabolome. Metabolomics 2015, 11, 1864–1883. [Google Scholar] [CrossRef]
- Law, V.; Knox, C.; Djoumbou, Y.; Jewison, T.; Guo, A.C.; Liu, Y.; Maciejewski, A.; Arndt, D.; Wilson, M.; Neveu, V.; et al. DrugBank 4.0: Shedding new light on drug metabolism. Nucleic Acids Res. 2014, 42, D1091–D1097. [Google Scholar] [CrossRef] [PubMed]
- Wishart, D.S.; Arndt, D.; Pon, A.; Sajed, T.; Guo, A.C.; Djoumbou, Y.; Knox, C.; Wilson, M.; Liang, Y.; Grant, J.; et al. T3DB: The toxic exposome database. Nucleic Acids Res. 2015, 43, D928–D934. [Google Scholar] [CrossRef] [PubMed]
- Jewison, T.; Su, Y.; Disfany, F.M.; Liang, Y.; Knox, C.; Maciejewski, A.; Poelzer, J.; Huynh, J.; Zhou, Y.; Arndt, D.; et al. SMPDB 2.0: Big improvements to the Small Molecule Pathway Database. Nucleic Acids Res. 2014, 42, D1091–D1097. [Google Scholar] [CrossRef] [PubMed]
- Pon, A.; Jewison, T.; Su, Y.; Liang, Y.; Knox, C.; Maciejewski, A.; Wilson, M.; Wishart, D.S. Pathways with PathWhiz. Nucleic Acids Res. 2015, 43, W552–W559. [Google Scholar] [CrossRef] [PubMed]
- Fan, J.; Teng, X.; Liu, L.; Mattaini, K.R.; Looper, R.E.; Vander Heiden, M.G.; Rabinowitz, J.D. Human phosphoglycerate dehydrogenase produces the oncometabolite d-2-hydroxyglutarate. ACS Chem. Biol. 2015, 10, 510–516. [Google Scholar] [CrossRef] [PubMed]
- Boroughs, L.K.; DeBerardinis, R.J. Metabolic pathways promoting cancer cell survival and growth. Nat. Cell Biol. 2015, 17, 351–359. [Google Scholar] [CrossRef] [PubMed]
- Eisner, R.; Stretch, C.; Eastman, T.; Xia, J.; Hau, D.; Damaraju, S.; Greiner, R.; Wishart, D.S.; Baracos, V.E. Learning to predict cancer-associated skeletal muscle wasting from 1H-NMR profiles of urinary metabolites. Metabolomics 2011, 7, 25–34. [Google Scholar] [CrossRef]
- Ravanbakhsh, S.; Liu, P.; Bjordahl, T.C.; Mandal, R.; Grant, J.R.; Wilson, M.; Eisner, R.; Sinelnikov, I.; Hu, X.; Luchinat, C.; et al. Accurate, Fully-Automated NMR Spectral Profiling for Metabolomics. PLoS ONE 2015, 10, e0124219. [Google Scholar] [CrossRef] [PubMed]
- Xia, J.; Sinelnikov, I.; Han, B.; Wishart, D.S. MetaboAnalyst 3.0—Making metabolomics more meaningful. Nucleic Acids Res. 2015, 43, W251–W257. [Google Scholar] [CrossRef] [PubMed]
- Allen, F.; Greiner, R.; Wishart, D. Competitive fragmentation modeling of ESI-MS/MS spectrafor putative metabolite identification. Metabolomics 2015, 11, 98–110. [Google Scholar] [CrossRef]
- Allen, F.; Pon, A.; Wilson, M.; Greiner, R.; Wishart, D. CFM-ID: A web server for annotation, spectrum prediction and metabolite identification from tandem mass spectra. Nucleic Acids Res. 2014. [Google Scholar] [CrossRef] [PubMed]
- Xia, J.; Fjell, C.D.; Mayer, M.L.; Pena, O.M.; Wishart, D.S.; Hancock, R.E.W. INMEX—A web-based tool for integrative meta-analysis of expression data. Nucleic Acids Res. 2013, 41, W63–W70. [Google Scholar] [CrossRef] [PubMed]
- Wu, H.; Xue, R.; Tang, Z.; Deng, C.; Liu, T.; Zeng, H.; Sun, Y.; Shen, X. Metabolomic investigation of gastric cancer tissue using gas chromatography/mass spectrometry. Anal. Bioanal. Chem. 2010, 396, 1385–1395. [Google Scholar] [CrossRef] [PubMed]
- Mörén, L.; Bergenheim, A.T.; Ghasimi, S.; Brännström, T.; Johansson, M.; Antti, H. Metabolomic screening of tumor tissue and serum in glioma patients reveals diagnostic and prognostic information. Metabolites 2015, 5, 502–520. [Google Scholar] [CrossRef] [PubMed]
- Sulek, K.; Han, T.L.; Villas-Boas, S.G.; Wishart, D.S.; Soh, S.E.; Kwek, K.; Gluckman, P.D.; Chong, Y.S.; Kenny, L.C.; Baker, P.N. Hair metabolomics: Identification of fetal compromise provides proof of concept for biomarker discovery. Theranostics 2014, 4, 953–959. [Google Scholar] [CrossRef] [PubMed]
- Patel, N.; Alkhouri, N.; Eng, K.; Cikach, F.; Mahajan, L.; Yan, C.; Grove, D.; Rome, E.S.; Lopez, R.; Dweik, R.A. Metabolomic analysis of breath volatile organic compounds reveals unique breathprints in children with inflammatory bowel disease: A pilot study. Aliment. Pharmacol. Ther. 2014, 40, 498–507. [Google Scholar] [CrossRef] [PubMed]
- Duckwall, C.S.; Murphy, T.A.; Young, J.D. Mapping cancer cell metabolism with 13C flux analysis: Recent progress and future challenges. J. Carcinog. 2013, 12. [Google Scholar] [CrossRef]
- Chokkathukalam, A.; Kim, D.-H.; Barrett, M.P.; Breitling, R.; Creek, D.J. Stable isotope-labeling studies in metabolomics: New insights into structure and dynamics of metabolic networks. Bioanalysis 2014, 6, 511–524. [Google Scholar] [CrossRef] [PubMed]
© 2016 by the authors; licensee MDPI, Basel, Switzerland. This article is an open access article distributed under the terms and conditions of the Creative Commons by Attribution (CC-BY) license (http://creativecommons.org/licenses/by/4.0/).


