Article

Flux Balance Analysis Inspired Bioprocess Upgrading for Lycopene Production by a Metabolically Engineered Strain of Yarrowia lipolytica

1
State Key Laboratory of Bioreactor Engineering, East China University of Science and Technology, 130 Meilong Road, Shanghai 200237, China
2
INRA, UMR1319 Micalis, Domaine de Vilvert, F-78352 Jouy-en-Josas, France
3
Shanghai Collaborative Innovation Center for Biomanufacturing Technology (SCICBT), 130 Meilong Road, Shanghai 200237, China
*
Author to whom correspondence should be addressed.
These authors contributed equally to this work.
Present address: INRA, UMR782 GMPA, AgroParisTech Campus, CBAI, F-78850 Thiverval-Grignon, France
Metabolites 2015, 5(4), 794-813; https://doi.org/10.3390/metabo5040794
Submission received: 29 August 2015 / Revised: 1 December 2015 / Accepted: 10 December 2015 / Published: 21 December 2015
(This article belongs to the Special Issue Metabolic Flux Analysis)

Abstract

:
Genome-scale metabolic models embody a significant advantage of systems biology since their applications as metabolic flux simulation models enable predictions for the production of industrially-interesting metabolites. The biotechnological production of lycopene from Yarrowia lipolytica is an emerging scope that has not been fully scrutinized, especially for what concerns cultivation conditions of newly generated engineered strains. In this study, by combining flux balance analysis (FBA) and Plackett-Burman design, we screened chemicals for lycopene production from a metabolically engineered strain of Y. lipolytica. Lycopene concentrations of 126 and 242 mg/L were achieved correspondingly from the FBA-independent and the FBA-assisted designed media in fed-batch cultivation mode. Transcriptional studies revealed upregulations of heterologous genes in media designed according to FBA, thus implying the efficiency of model predictions. Our study will potentially support upgraded lycopene and other terpenoids production from existing or prospect bioengineered strains of Y. lipolytica and/or closely related yeast species.

1. Introduction

Carotenoids represent a subcategory of tetraterpenoid pigmented lipid compounds made by plants and various fungi and bacteria [1]. Majorly exemplified by ß-carotene, lycopene, astaxanthin, zeaxanthin, fucoxanthin, ß-cryptoxanthin, canthaxanthin, lutein, and crocetin, compounds of the carotenoids family handle a diversity of bright colors such as yellow, red, purple, and orange [2,3]. Lycopene is a bioactive phytochemical of this vast family of carotenoids that has gained much concerns these recent years because of its commercial attributes and due to its biofunctionality [4]. Exclusively synthesized on one hand, by plants like tomato, watermelon, guava, papaya, apricots, pink grapefruits, and red oranges and on the other hand by carotenogenic microorganisms, lycopene is essential for the human body given that it can only be provided through its ingestion under multiple forms such as food or drugs. Lycopene promotes good health owing to its therapeutic, prophylactic, and nutraceutical functions. Increasing scientific evidence displays its implications in carcinogenic cell apoptosis and cell cycle arrest of diverse types of human cancers [5,6,7,8]. Lycopene is also recognized as a strong cancer chemo-preventive agent [9,10] and has been found to have cardio-protective, antioxidant, and anti-inflammatory effects [11]. In view of the above, the large scale production of lycopene is of fundamental necessity. However, the current manufacture of lycopene from plant sources faces food competition, environment, high production cost, long processing time, and low yield problems. Besides, microbial fermentation using carotenogenic microorganism is scarce and fails to produce sizable titers of lycopene. Big efforts have been made to engineer non-carotenogenic hosts for lycopene production; but the fermentation process still constitutes the foremost impediment for generating great amounts of lycopene. Yarrowia lipolytica, categorized as GRAS (Generally Recognized As Safe), has been established as a promising fermentation platform. Recently, a complete procedure for engineering Y. lipolytica for lycopene production was developed. Nonetheless, apart from the culture medium and genetic manipulation procedure provided [12], no deep investigation of cultural conditions was communicated. In addition, a fed-batch process for lycopene production from this species was established, but authors did not focus on the improvement of the bioprocess route [13]. Furthermore, up to now, only one patent has reported lycopene production from engineered strains of Y. lipolytica under lipid accumulation conditions [14]. Therefore, endeavors need to be made for building complete innovative, cost-effective, and competitive bioprocesses for lycopene production from genetically engineered strains of Y. lipolytica. One of the most efficient tools for yielding high titers of carotenoids in engineered strains is based on knock-out or overexpression of specific genes coupled with computational approaches [15,16,17]. Moreover, whole-genome sequencing and high-throughput omics as well as the detailed biochemical and enzymatic documentation on microbial metabolism have promoted prosperous genome-scale metabolic network (GSMN) reconstruction [18,19].
In silico models are valuable for comprehending the biochemical aptitudes of an organism and to foresee the influence of genetic and/or medium perturbations on growth and metabolic fluxes [20,21]. Flux balance analysis (FBA) has been materialized as an operational in silico channel for scrutinizing biological networks in a quantitative approach. Contrary to mechanistic simulations that rely on precise kinetic information, FBA is based on the stoichiometric matrix and a biologically important objective function for identifying optimal reaction flux distributions which are subsequently used to unravel the metabolic capabilities of the studied system [22].
The present-day FBA is in a wide way to guide designs of experiments. In a previous study, we constructed a genome scale metabolic model of Y. lipolytica for lipid production and predicted a minimal culture medium for lipids biosynthesis. Afterward, we have updated this model for generating model information for terpenoids production. The updated model is apt to provide reliable information when farnesyl diphosphate (FPP), one of the key precursors of terpenoids backbone in Y. lipolytica, is resolved as the objective metabolite. We hypothesized that such a metabolic network model can support the prediction of culture media for ameliorating the yield of lycopene in biotechnological applications.
Statistical design methods, especially the Plackett-Burman design, are commonly employed for optimization of fermentation media. The Plackett-Burman designs are usually resolution III, highly efficient two level fractional factorial screening designs for studying N-1 variables using N runs, where N is a multiple of 4. They use the minimum number of runs to quickly identify the factors with a significant effect on the response. However, the choice of the initial set of chemical compounds is laborious since these compounds are generally randomly selected. In addition, though GSMN can predict the nutritional requirements for a given biological system, the accuracy of the amount of a single predicted compound to be added is difficult to determine because in silico data rarely match with the in vivo metabolic behavior. However, by combining GSMN (FBA) results and statistical methods such as Plackett-Burman design, it is possible to develop an efficient culture medium for the production of valuable objective products.
Therefore, in this paper, we run FBA by means of COBRA Toolbox 2.0 [23] to foresee environmental conditions contributing to FPP overproduction that may well redirect the carbon flux toward lycopene biosynthesis in an engineered strain of Y. lipolytica harboring only crtE, crtB, and crtI genes. As model predictions do not correctly reflect the in vivo situation, we combined modelling data with Plackett-Burman factorial design of experiments for optimizing cultivation media. Furthermore, we compared lycopene production in modeling suggested media with other media designed based on compounds usually reported in the literature through fermentation scale up experiments.

2. Results

2.1. Media Designing for Bioprocess Improvement

FBA-Independent Screening of Medium Components

Up to date, no deep investigation for development of fermentation media for lycopene production from Y. lipolytica has been realized. In order to establish a reference medium for evaluation of the FBA efficiency, we first selected a set of 23 factors in the light of preliminary experiments and literature review for the designing of FBA-independent cultivation medium. Bioprocess improvement experiments were carried out using the engineered strain Po1f-1312E-1269IB. In a first step, we screened a set of chemicals without considering the flux balance analysis (FBA). The matrix of the Plackett-Burman design used in regard of this achievement is reported in Table 1. According to the Plackett-Burman principle, data transformation is required if the ratio max/min is greater than 10. For this reason, we used Log10 or the root square (Sqrt) for data transformation. Subsequently, the Pareto chart was used for analyzing the effects of different components and selecting those to be included in the model. There are two different t limits plotted on the graph based on the Bonferroni or family-wise corrected t and a standard t for individual effects tested. Effects above the Bonferroni Limit were added to the model as certainly significant factors. Effects above the t-value Limit were possibly significant and added if they make sense. Effects below the t-value limit were likely insignificant. Pareto charts of all experimental data are reported in Supplementary File 1.
The results showed that biomass production was significantly (effects above the Bonferroni Limit) improved by the effects of KNO3, MgSO4·7H2O, FeCl3·6H2O, FeSO4·7H2O, yeast extract, fructose, BaCl2·2H2O, NiCl2·6H2O, KH2PO4 and vitamin B1 in this decreasing order. The effect of MnCl2·4H2O, Na2MoO4·2H2O and KI were also positively significant (t-value < effects < Bonferroni Limit) while the positive effect of K2HPO4 was not significant. The set of factors including CuCl2·2H2O, NiSO4·6H2O, CoCl2·6H2O, H3BO3, ZnCl2, MnSO4·7H20, NaCl, Glucose, (NH4)2SO4 were found as inhibitors of biomass production. The highest biomass concentration obtained was 16.14 g/L with max/min value of 25.22. The final equation in term of coded factors was: Sqrt (Biomass) = 2.24 − 0.38 × A − 0.18 × B − 0.043 × C + 0.29 × D + 0.15 × E − 0.13 × G − 0.095 × H + 0.072 × J + 0.089 × K + 0.28 × L + 0.082 × M + 0.29 × N + 0.37 × O − 0.095 × Q +0.22 × R + 0.25 × S − 0.20 × T + 0.14 × U + 0.020 × V + 0.12 × W + 0.19 × X.
For lycopene production, MgSO4·7H2O, FeCl3·6H2O, fructose, KNO3, NiCl2·6H2O, vitamin B1 and KH2PO4 had significant positive effects. The maximum lycopene concentration obtained in flasks was 9.18 mg/L. The final equation in terms of coded factors was: Sqrt (Lycopene)= 0.75 − 0.52 × A − 0.12 × B − 0.2 × C + 0.32 × D + 0.18 × E + 0.059 × G + 0.074 × H + 0.081 × J + 0.052 × K + 0.049 × L + 0.049 × M + 0.3 × N + 0.26 × O − 0.064 × P − 0.071 × Q + 0.28 × R − 0.15 × T + 0.11 × U − 0.17 × V + 0.14 × W + 0.072 × X.
The maximal lycopene content obtained from the 24 runs was 1.11 mg/g dry cell weight (DCW). Lycopene content was positively promoted by the effects of MgSO4·7H2O, NiCl2·6H2O, ZnCl2, MnSO4·7H20, KI, MnCl2·4H2O, FeCl3·6H2O, KNO3, fructose, KH2PO4, vitamin B1, BaCl2·2H2O. Other components had negative effects.
The post-optimization experiments conducted to the optimized medium (PM medium) with the following composition (g/L): MgSO4·7H2O (14.74), NiCl2·6H2O (0.097), H3BO3 (0.099), ZnCl2 (0.15), MnSO4·7H20 (0.4), KI (0.012), MnCl2·4H2O (0.2), Na2MoO4·2H2O (0.1), FeCl3·6H2O (2.87), KNO3 (0.05), Glucose (19.9), fructose (20), yeast extract (0.96), (NH4)2SO4 (0.51), KH2PO4 (10) and vitamin B1 (1.00E-02).
Table 1. Matrix of Plackett-Burman screening of medium components selected independently from the FBA.
StdRunA:CuCl2·2H2OB:NiSO4·6H2OC:CoCl2·6H2OD:MgSO4·7H2OE:NiCl2·6H2OF:H3BO3G:ZnCl2H:MnSO4·7H20J:KIK:MnCl2·4H2OL:FeSO4·7H2OM:Na2MoO4·2H2ON:FeCl3·6H2OO:KNO3P:NaClQ:GlucoseR:FructoseS:Yeast extractT:(NH4)2SO4U:KH2PO4V:K2HPO4W:Vitamine B1X:BaCl2·2H2OBiomassLycopeneLycopene content
g/Lg/Lg/Lg/Lg/Lg/Lg/Lg/Lg/Lg/Lg/Lg/Lg/Lg/Lg/Lg/Lg/Lg/Lg/Lg/Lg/Lg/Lg/Lmg/Lmg/g
1010.0310.41.50.10.010.010.020.010.22.50.130.20.0120010100.0100.01114.261.760.12
2220.330.41.50.10.010.150.40.010.012.50.10.020.01110200.50.50.0100.0111.5200
1230.330.021.50.10.010.150.020.010.010.10.130.21200100.5103.500.013.3800
240.0330.4150.10.10.010.40.010.22.50.010.020.21100100.510000.0111.061.820.16
750.0330.021.50.050.010.150.40.10.22.50.0130.0112000.510100012.360.60.26
1360.0330.41.50.050.10.010.40.010.010.10.0130.2120200.5100.013.50.010.012.660.370.14
170.330.4150.10.010.150.020.10.20.10.0130.20.0110200.5100.01000.013.461.170.34
1680.330.021.50.10.10.010.020.10.012.50.010.020.010.01202010101000.010.012.3800
390.0310.4150.10.10.150.020.10.012.50.10.020.0112000.5100.013.500.012.740.040.02
15100.310.02150.10.010.010.40.010.20.10.010.020.011202010100.013.5012.8200
14110.0310.4150.050.010.150.020.10.010.10.010.020.212020100.51000.01112.843.820.3
21120.330.02150.050.10.150.020.010.22.50.010.020.20.012000.50.50.013.50.0113.760.040.01
24130.0310.021.50.050.010.010.020.010.010.10.010.020.010.011000.50.50.01000.010.6400
18140.310.4150.050.010.150.40.010.012.50.0130.010.011001010103.50.010.013.5200
19150.0330.02150.10.010.010.40.10.010.10.10.020.20.011000.510103.50.0117.362.820.38
6160.310.021.50.050.10.150.40.10.20.10.10.020.2110010100.0100.010.011.3800
23170.330.4150.050.10.010.40.10.010.10.130.010.01200100.50.010012.400
5180.0310.021.50.10.10.150.40.10.012.50.0130.20.011020100.50.013.50116.145.760.36
8190.310.41.50.050.010.010.40.10.22.50.10.020.20.0120200.50.5103.500.014.4400
17200.0330.41.50.050.10.150.020.010.20.10.10.020.010.0110201010103.5012.7600
4210.0310.02150.10.10.150.40.010.20.10.130.010.0120200.50.51000.010.018.39.181.11
11220.310.02150.050.10.010.020.010.012.50.130.2110200.5101000111.262.170.19
9230.0330.02150.050.010.010.020.10.22.50.130.0111020100.50.013.50.010.0115.163.270.22
20240.310.41.50.10.10.010.020.10.20.10.0130.0111000.50.5103.50.0114.3600

2.2. Combination of Flux Balance Analysis and Plackett-Burman Design for Media Designing

2.2.1. Flux Balance Analysis and Prediction of Media Components

In this study, the flux balance analysis (FBA) was implemented to determine metabolic flux distribution with the genome-scale metabolic network model of Y. lipolytica (yli v1.7) that was updated from model iYL619_PCP by correcting topological network and parameters of model (model yli v1.7 is available at http://www.echaoceshi.com/ECLOSB/CN/Default.aspx). In model yli v1.7, R0763 is the only reaction, in which farnesyl diphosphate (FPP) is produced; R2000 is the reaction of growth (biomass formation reaction). Besides, the maximum flux of R2000 (specific growth rate) is 0.0350 h−1 in the glucose minimal media. The model yli v1.7 and iYL619_PCP predicted the equal glucose minimal media. The composition of minimal media in the experiment is as follows: glucose (20 g/L), NH4SO4 (3 g/L), KH2PO4 (2 g/L), in which the maximum specific growth rate is 0.0352 h−1. This indicates that model yli v1.7 predicted the maximum specific growth rate more accurately (Supplementary File 2).
The fluxes of exchange reactions of the updated model were generated through FBA. Exchange reactions with negative fluxes indicated compounds that needed to be consumed when targeting a maximized production of FPP and the addition of those components into the culture medium was of crucial requirement. To predict the potential benefit of supplementing the minimal media with of amino acids or several cofactors in terms of FPP production based on FBA metabolic flux distributions, we relaxed the exchange reactions of model yli v1.7. The list of exchange reactions with negative fluxes and their fluxes when glucose, fructose, or both carbohydrates were selected as carbon sources is summarized in Supplementary File 3 (Table S1 of Supplementary File 3). The most prevailing class of exchange reactions included exchange reactions involving amino acids such as l-isoleucine, l-leucine, l-valine, l-asparagine, l-histidine, l-methionine, l-tryptophan, guanine, and l-lysine. The additional exchange reactions were those of O2, thiamine diphosphate, succinate, phosphate, ammonia, 4-aminobutanoate, ergosterol, ethanolamine, d-fructose, urea, d-glucose, hypoxanthine, and (R)-pantothenate. The number of negative exchange reactions and fluxes varied widely with the nature of the carbon source opted for. Putting aside the fact that FBA only gives one possible random solution instead of looking at all the possibilities (like Flux Variability Analysis would do, for example), it seems that the only “non-zero” values in this table are those corresponding to O2 exchange, d-fructose exchange and d-glucose exchange. All other values from −8.05e-35 to −1.46e-13 are most probably rounding errors of the LP solver, and so all those values could be considered as zeros. However, in order to predict the potential benefit of supplementing the minimal media with of above amino acids or several cofactors in terms of FPP production based on FBA metabolic flux distributions, we relaxed the exchange reactions of model yli v1.7. We first tested effects of 18 amino acids (only 18 amino acid can be utilized in model yli v1.7) on FPP production in a definite specific growth rate (90% of the maximum specific growth rate), and found that all the 18 amino acids facilitated FPP production in different degrees (Table 2). However, only eight amino acids (l-isoleucine, l-leucine, l-valine, l-asparagine, l-histidine, l-methionine, l-lysine, l-tryptophan) were found as amino acids that could be supplemented to the minimal medium owing to the guarantee of C/N ratio more than 10. Additionally, we also tested effects of 10 factors on FPP production in a definite specific growth rate (Table 3). We found that a certain number of factors had significant effect on FPP production. Furthermore, all 10 factors were chosen and supplemented to the minimal medium to verify their effects on FPP production (Supplementary File 3).
Table 2. Fluxes (mmol/g DCW/h) of 18 exchange reactions of amino acids and their respective effects on FPP production.
IDReaction NameBiomassFPPFlux
R1202l-isoleucine exchange0.0315 #0.4342−0.0042
R1203l-leucine exchange0.03150.4352−0.0085
R1205l-valine exchange0.03150.4350−0.0104
R1226l-glutamate exchange0.03150.4763−2 $
R1241l-alanine exchange0.03150.5871−2
R1244l-arginine exchange0.03150.5159−2
R1245l-asparagine exchange0.03150.4344−0.0052
R1248l-cysteine exchange0.03150.5878−2
R1268l-histidine exchange0.03150.4347−0.0030
R1273l-methionine exchange0.03150.4352−0.0072
R1275l-lysine exchange0.03150.4353−0.0067
R1280l-serine exchange0.03150.6640−2
R1283l-threonine exchange0.03150.7025−2
R1285l-tryptophan exchange0.03150.4339−0.0010
R1298l-aspartate exchange0.03150.6640−2
R1300l-phenylalanine exchange0.03150.6215−2
R1301l-proline exchange0.03150.5150−2
R1303l-tyrosine exchange0.03150.5650−1.6980
# we set a definite specific growth rate of 0.0315 h−1 at the 90% of the maximum specific growth rate; $ we respectively set the lower bounds of amino acids exchange reaction to −2 mmol/g DCW/h.
Table 3. Fluxes (mmol/g DCW/h) of 10 exchange reactions of factors used to test effects on FPP production.
IDReaction nameBiomassFPPFlux
R1207Thiamine diphosphate exchange0.0315 #0.43320.0000
R12394-aminobutanoate exchange0.03150.4525−1 $
R1251Ergosterol exchange0.03150.4333−0.0002
R1258Ethanolamine exchange0.03150.4392−0.0769
R1267Guanine exchange0.03150.4345−1
R1278(R)Pantothenate exchange0.03150.43320.0000
R1281Sulfite exchange0.03150.43320
R1287Urea exchange0.03150.43320
R1296Hypoxanthine exchange0.03150.4353−0.0049
R1306Pyridoxine exchange0.03150.43320
# we set a definite specific growth rate of 0.0315 h−1 at the 90% of the maximum specific growth rate; $ we respectively set the lower bounds of factors exchange reaction to −1 mmol/g DCW/h.

2.2.2. Plackett-Burman Design Screening of FBA-Predicted Components

Taking into account the results of the above simulations, we applied the Plackett-Burman design for experimental validation of FBA-predicted factors. The design matrix and responses obtained for biomass, lycopene and lipid production in Plackett-Burman design screening of FBA-predicted factors are correspondingly reported in Table 4. The results showed that biomass production ranged from 9.075 to 35.5 g/L (ratio max/min = 3.91) while the produced lycopene and lipid concentrations ranged from 1.77 to 41.23 mg/L (ratio max/min = 23.29) and 0.82 to 2.65 g/L (ratio max/min = 3.23), respectively. The highest lycopene and lipid contents were respectively 2.9 mg/g (ratio max/min = 29.48) and 12.01% (ratio max/min = 4.48). On media corresponding to run 7 and run 8, the engineered strain of Y. lipolytica produced consistent amount of lycopene (41.23 and 40.54 mg/L, respectively) with average biomass production of 14.23 and 16.53 g/L leading to lycopene content of 2.90 and 2.45 mg/g. Approximately equal quantities of lipids (1.55 and 1.53 g/L) were yielded on both media and corresponded to lipid contents of 10.90% and 9.23%.
The analysis of the effects of FBA-predicted factors on the biomass production showed that thiamine pyrophosphate, nicotinate, KH2PO4, ethanolamine, guanine, l-methionine, l-tryptophan, l-valine, l-asparagine, d-glucose, and d-fructose had positive effects on biomass production. Fructose was the most significant terms (effect above the Bonferroni Limit) followed by KH2PO4, l-valine, ethanolamine, nicotinate, l-asparagine, guanine, l-tryptophan, and glucose. The list of compounds composed of pyridoxine hydrochloride, succinate, 4-aminobutyric acid, Na2SO3, hypoxanthine, l-histidine, l-isoleucine, and l-leucine had negative effects on biomass production. The negative effects of 4-aminobutyric acid, l-histidine, and l-leucine were not significant. The effects of thiamine pyrophosphate and l-methionine were not significant for biomass production. The final equation of biomass production obtained after ANOVA analysis in terms of coded factors was:
Biomass = 1761.61 +1.00 × A − 1.16 × B + 1158.95 × C − 1.25 × D − 0.77 × E +2.70 × F − 1.70 × J + 1.57 × L − 1.18 × M + 1.51 × N − 0.71 × O + 0.63 × P + 1.41 × R + 1.75 × S + 1.52 × T − 1.85 × U − 0.66 × V + 1.14 × W + 3.28 × X.
Six factors were found to have significant positive effects on lycopene production. The most significant factors were l-tryptophan, l-isoleucine, ergosterol, and thiamine pyrophosphate (effect above the Bonferroni Limit) followed by ethanolamine and (NH4)2SO4 (effects above the t-value Limit). Although l-asparagine had a positive effect, this effect was not significant. All other compounds had an inhibitory effect on lycopene production. The final equation in terms of coded factors was:
Log10 (Lycopene) = 1.10 + 0.055 × A − 0.049 × B − 0.14 × D − 0.056 × E − 0.046 × F + 0.026 × G − 0.15 × J + 0.080 × K + 0.049 × L − 0.11 × M − 0.010 × N − 0.085 × P + 5.397e-004 × Q + 0.14 × R − 0.027 × S + 8.320e-003 × T + 0.095 × U − 0.14 × V − 0.053 × W − 0.077 × X.
l-isoleucine was found as the most significant factor having positive effect on lycopene content, followed by l-tryptophan, ergosterol, thiamine pyrophosphate, and l-histidine. Ethanolamine and (NH4)2SO4 had negligible positive effects on lycopene content. The large number of factors negatively influenced the lycopene content.
Table 4. Matrix of Plackett-Burman design of FBA predicted medium components.
StdRunA:Thiamine pyrophosphateB:Pyridoxine, hydroclorideC:SuccinateD:(R) PantothenateE:4-Aminobutyric acidF:KH2PO4G:(NH4)2SO4H:UreaJ:Sulfite Na2SO3K:ErgosterolL:EthanolamineM:HypoxanthineN:GuanineO:l-histidineP:l-methionineQ:l-lysineR:l-tryptophanS:l-valineT:l-asparagineU:l-isoleucineV:l-leucineW:d-glucoseX:d-fructoseLycopeneBiomassLycopene contentLipidLipid content
g/Lg/Lg/Lg/Lg/Lg/Lg/Lg/Lg/Lg/Lg/Lg/Lg/Lg/Lg/Lg/Lg/Lg/Lg/Lg/Lg/Lg/Lg/Lmg/Lg/Lmg/gg/L%
1210.0060.006115620.50.10.010.0555555151101020209.9913.350.751.279.51
1620.0060.006115120.50.520.010.3111155510101602034.5126.731.292.419.02
430.00060.000615512220.10.10.0555115511101602027.8719.481.432.211.3
640.0060.0006111122220.10.055155115101160209.8527.40.361.575.73
2050.0060.0006515120.50.520.10.0515151111101060606.6930.880.221.65.18
2260.0060.0065156220.10.010.35115151111606018.4731.450.591.023.24
870.0060.000651160.5220.10.3515155111010202041.2314.232.91.5510.9
2480.00060.000611160.50.50.10.010.051111111111202040.5416.532.451.539.23
1890.0060.00065516220.10.010.31511115101010602019.9529.050.691.635.61
13100.00060.006511120.520.10.010.05155555110110602012.4130.580.410.822.68
3110.00060.00065551220.520.010.351155111011020202.0721.050.11.456.86
5120.00060.0006115122220.010.31551155111020609.833.230.31.44.21
7130.00060.00611162220.10.3151551110101206023.5823.6511.626.85
2140.00060.006555120.520.10.10.311551151101202016.4421.330.770.884.13
19150.00060.00615560.5220.010.05515111110101060601.779.080.21.0912.01
9160.00060.00615160.50.520.10.35515155111060204.0921.30.191.567.3
15170.0060.000615560.520.10.10.05111555510110206012.3629.130.421.444.93
14180.00060.0006551620.520.010.0511555551101606011.1424.750.451.566.3
10190.00060.000651560.50.50.10.10.355515151011606016.3235.50.461.895.32
1200.0060.006555620.520.10.0515511511011202024.8420.731.229.65
21210.0060.0061511220.50.10.10.31151511111060609.9928.650.352.659.23
17220.00060.0065111220.50.10.10.055111155101010206024.7932.630.762.226.8
11230.0060.0006151120.50.50.10.010.3555515110101206022.733.830.671.193.52
23240.0060.006551120.5220.010.05551151511120603.0727.730.111.625.83
The final equation for lycopene content in terms of coded factors was:
Log10 (Lycopene content) = −42.56 + 0.033 × A − 0.025 × B − 28.22 × C − 0.12 × D − 0.035 × E − 0.10 × F + 0.012 × G − 0.12 × J + 0.067 × K + 0.015 × L − 0.073 × M − 0.041 × N + 0.020 × O − 0.10 × P + 0.10 × R − 0.065 × S − 0.017 × T + 0.14 × U − 0.12 × V − 0.072 × W − 0.13 × X.
For lipid production, ergosterol, (NH4)2SO4, and l-lysine had significant positive effects. The effects of KH2PO4, glucose, and thiamine pyrophosphate were also moderately significantly positive. l-methionine, urea, l-histidine, nicotinate, and hypoxanthine significantly inhibited lipid production. The effects of other components were not significant. The final equation for lycopene content in terms of coded factors was:
Lipid = −76.10 + 0.072 × A − 51.85 × C − 0.036 × E + 0.077 × F + 0.13 × G − 0.19 × H + 0.029 × J + 0.17 × K − 0.038 × M − 0.023 × N − 0.10 × O − 0.26 × P + 0.12 × Q + 0.024 × R + 0.030 × S + 0.021 × T − 0.034 × V + 0.077 × W.
Lipid content was positively affected by l-isoleucine, Na2SO3, l-lysine, hypoxanthine, ergosterol, succinate, pyridoxine hydrochloride, 4-aminobutyric acid, (NH4)2SO4, and l-leucine. l-histidine had no significant positive effect. The rest of predicted components strongly repressed lipid accumulation.
Based on the above observations and multiple post-optimization experiments, the optimization process gave MP medium constituted of 1 g/L asparagine, 6 g/L KH2PO4, 0.5 g/L (NH4)2SO4, 0.1 g/L ergosterol, 0.3 g/L ethanolamine, 5 g/L lysine, 5 g/L tryptophan, 10 g/L isoleucine, 20 g/L fructose, and 10 g/L glucose.

2.2.3. Analysis of the Correlation between Lipid Content and Lycopene Content

The correlation analysis was carried out using the Pearson correlation analysis method with a two-tailed test of significance. The correlation analysis was applied to the data obtained from the Plackett-Burman design responses obtained with the FBA-predicted factors. We obtained a Pearson correlation of 0.49 with a significance of 0.01. The correlation between both variable was significant at the 0.05 level. Furthermore, we found commonness between both variables when positive factors were taken into account. Specifically, lycopene content and lipid content were both significantly stimulated by l-isoleucine, ergosterol and (NH4)2SO4. This suggested the positive correlation between lipid accumulation and lycopene biosynthesis. This relationship between both pathways may be influenced by the composition of the culture medium since we found diverse discrete distribution of the concentration of these compounds in the different culture media. In addition, high lipid content did not necessarily imply high lycopene content.

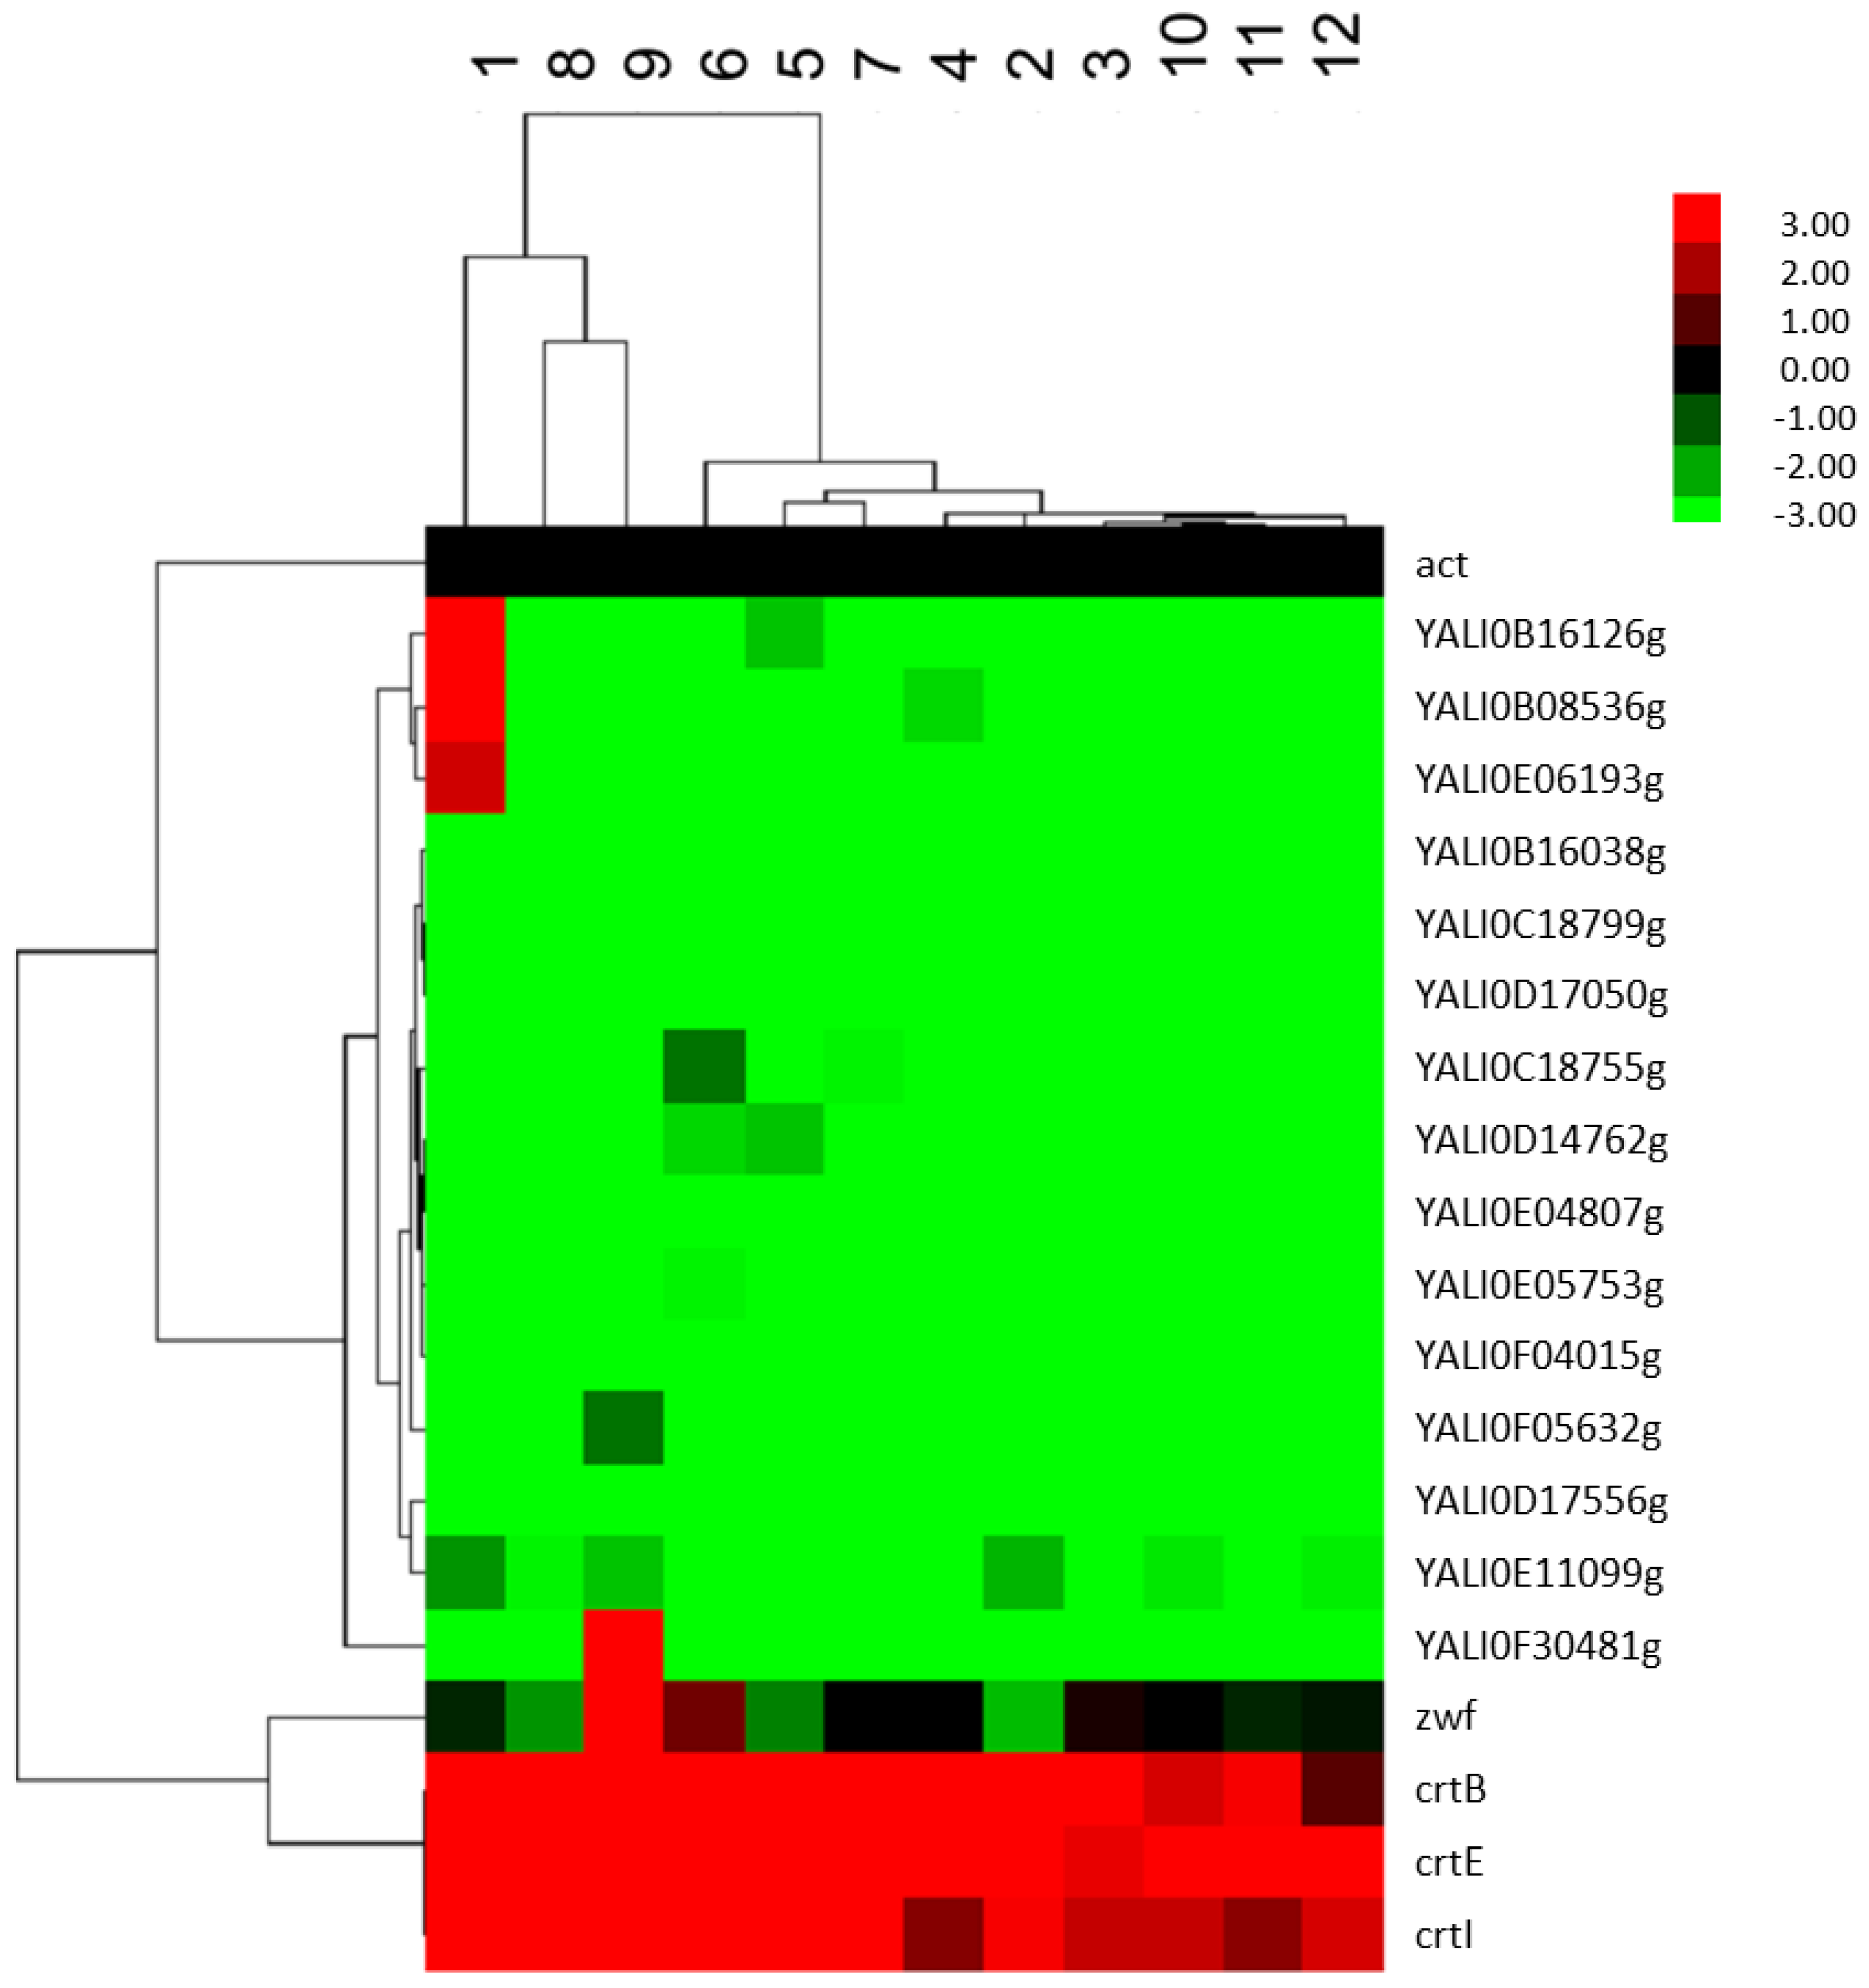
2.2.4. Analysis of the Effect of FBA Predicted Factors on the Expression of Genes of the Terpenoids Backbone

Following the first Plackett-Burman design (PBD), we conducted another PBD (Supplementary File 4) in order to adjust the culture medium components to optimized conditions and determine the effect of above selected positive factors on the terpenoids backbone genes through the determination of their expression levels. The PBD design responses demonstrated that biomass production was significantly improved by the effects of lysine, fructose, l-tryptophan, (NH4)2SO4, KH2PO4, thiamine, and l-isoleucine in this decreasing order. The rest of the components including glucose, l-asparagine, and ethanolamine had moderate negative effects on biomass production. The highest biomass production of 33.58 g/L was obtained with run 10. The elimination of factors with negative effects in the first PBD driven on the FBA predicted components did not significantly affect biomass production, showing that their elimination was not due to errors. Similarly, KH2PO4, fructose, ergosterol, (NH4)2SO4, and l-tryptophan promoted lycopene accumulation. A lycopene production of 4.35 mg/g DCW (76.62 mg/L) was achieved under the coordinated effect of these compounds in shake flasks. Only KH2PO4 had positive effect on lycopene content.
This second tour PBD suggested that the selected components were further optimizable for biomass and lycopene concentration but did not really impact on lycopene content. Furthermore, some of components with positive effects in the first round of screening were found inhibiting lycopene production. This could be explained by the fact that the scale of choice of these components was reduced.
In order to get insights into the effect of selected factors on genes of the terpenoids backbone, we realized quantitative RT-PCR experiments to explore expression levels of these genes. No significant effect was found for YALI0B16126g which is annotated as protein farnesyltransferase/geranylgeranyltransferase type-1 subunit alpha. On the contrary, significant effects were recorded for YALI0C18755g, the gene encoding for (2E,6E)-farnesyl pyrophosphate (FPP) specific hexaprenyl-diphosphate synthase. This gene was significantly stimulated by the effects of l-tryptophan, l-lysine, l-isoleucine, l-asparagine, KH2PO4, and fructose. The high number of positive factorial effects corroborated with the fact that FPP was set as the target metabolite in the FBA simulation. Only ergosterol, thiamine, and glucose had inhibitory effects on this gene. In addition, the ditrans, polycis-polyprenyl diphosphate synthase (also specific to (2E,6E)-farnesyl diphosphate) gene YALI0C18799g was activated by l-tryptophan, ergosterol, l-asparagine, and to some extent KH2PO4 while other components displayed negative effects. YALI0D17556g, another gene responsible for (2E,6E)-FPP specific ditrans, polycis-polyprenyl diphosphate synthase, was significantly stimulated by ethanolamine but repressed by l-tryptophan. The expression of the gene in charge of protein farnesyltransferase subunit beta, YALI0D14762g, was similarly triggered by l-lysine, l-asparagine, fructose, KH2PO4, and l-tryptophan and to a minor extent by glucose. Only l-tryptophan had a positive effect on YALI0D17050g (geranylgeranyl diphosphate synthase). The rate-limiting gene of the mevalonate pathway governing the expression of hydroxymethylglutaryl-CoA reductase (HMGCR), YALI0E04807g, was significantly activated by factors including l-lysine, l-asparagine, l-tryptophan, KH2PO4, and fructose but significantly inhibited by ergosterol and thiamine. The activation of this gene was necessary for converting HMG-CoA into mevalonic acid and subsequent metabolites of the terpenoids biosynthesis backbone. YALI0E05753g ((2E,6E)-farnesyl diphosphate synthase) was significantly stimulated by l-tryptophan, KH2PO4 and to a minor extent by L-asparagine. However, the lycopene biosynthesis genes introduced into the engineered strains, although highly expressed, were activated by numerous positive factors. However, the number of positive effects was not as significant as expected. This could be explained by the fact that the FBA was targeted towards FPP synthesis. Specifically, the expression of the crtE, crtB, and crtI genes were all promoted by ethanolamine (significant effect) and l-lysine, l-isoleucine, glucose, (NH4)2SO4, ergosterol, and glucose to a trivial degree.
Overall, the results showed that FBA-predicted and PBD screened factors differentially affected genes of the terpenoids backbone, zwf and crt genes. Figure 1 is the heat map of the hierarchical clustering of genes relative expression levels obtained from the PBD experiments. We found that genes of the terpenoids backbone (Supplementary Figure S1) were downregulated after seven days of cultivation compared to the housekeeping gene ACT1 while all heterologous genes were upregulated. The upregulation of heterologous genes implied that the carbon metabolism was efficiently directed to FPP biosynthesis and subsequently permitted lycopene production. Nevertheless, different amounts of biomass and lycopene yielded on different runs of culture media could be explained by divergences in expression patterns as depicted in Figure 1.
Figure 1. Heat map showing the expression levels of crtE, crtB, crtI, zwf, and terpenoids backbone genes in Po1f-1312E + 1269IB with respect to that of the internal control ACT1 on different culture media designed based on FBA predictions. The data represent the average of three independently grown cultures.
Metabolites 05 00794 g001
Indeed, though some heterologous genes were highly expressed in certain media, the level of produced lycopene did not match with expression levels. We found that some media components were inhibiting genes of the terpenoids backbone at different levels but the inhibition did not necessarily imply low production of lycopene. Each gene of the terpenoids backbone was activated by specific selected factors whose coordinated actions allowed high lycopene production.

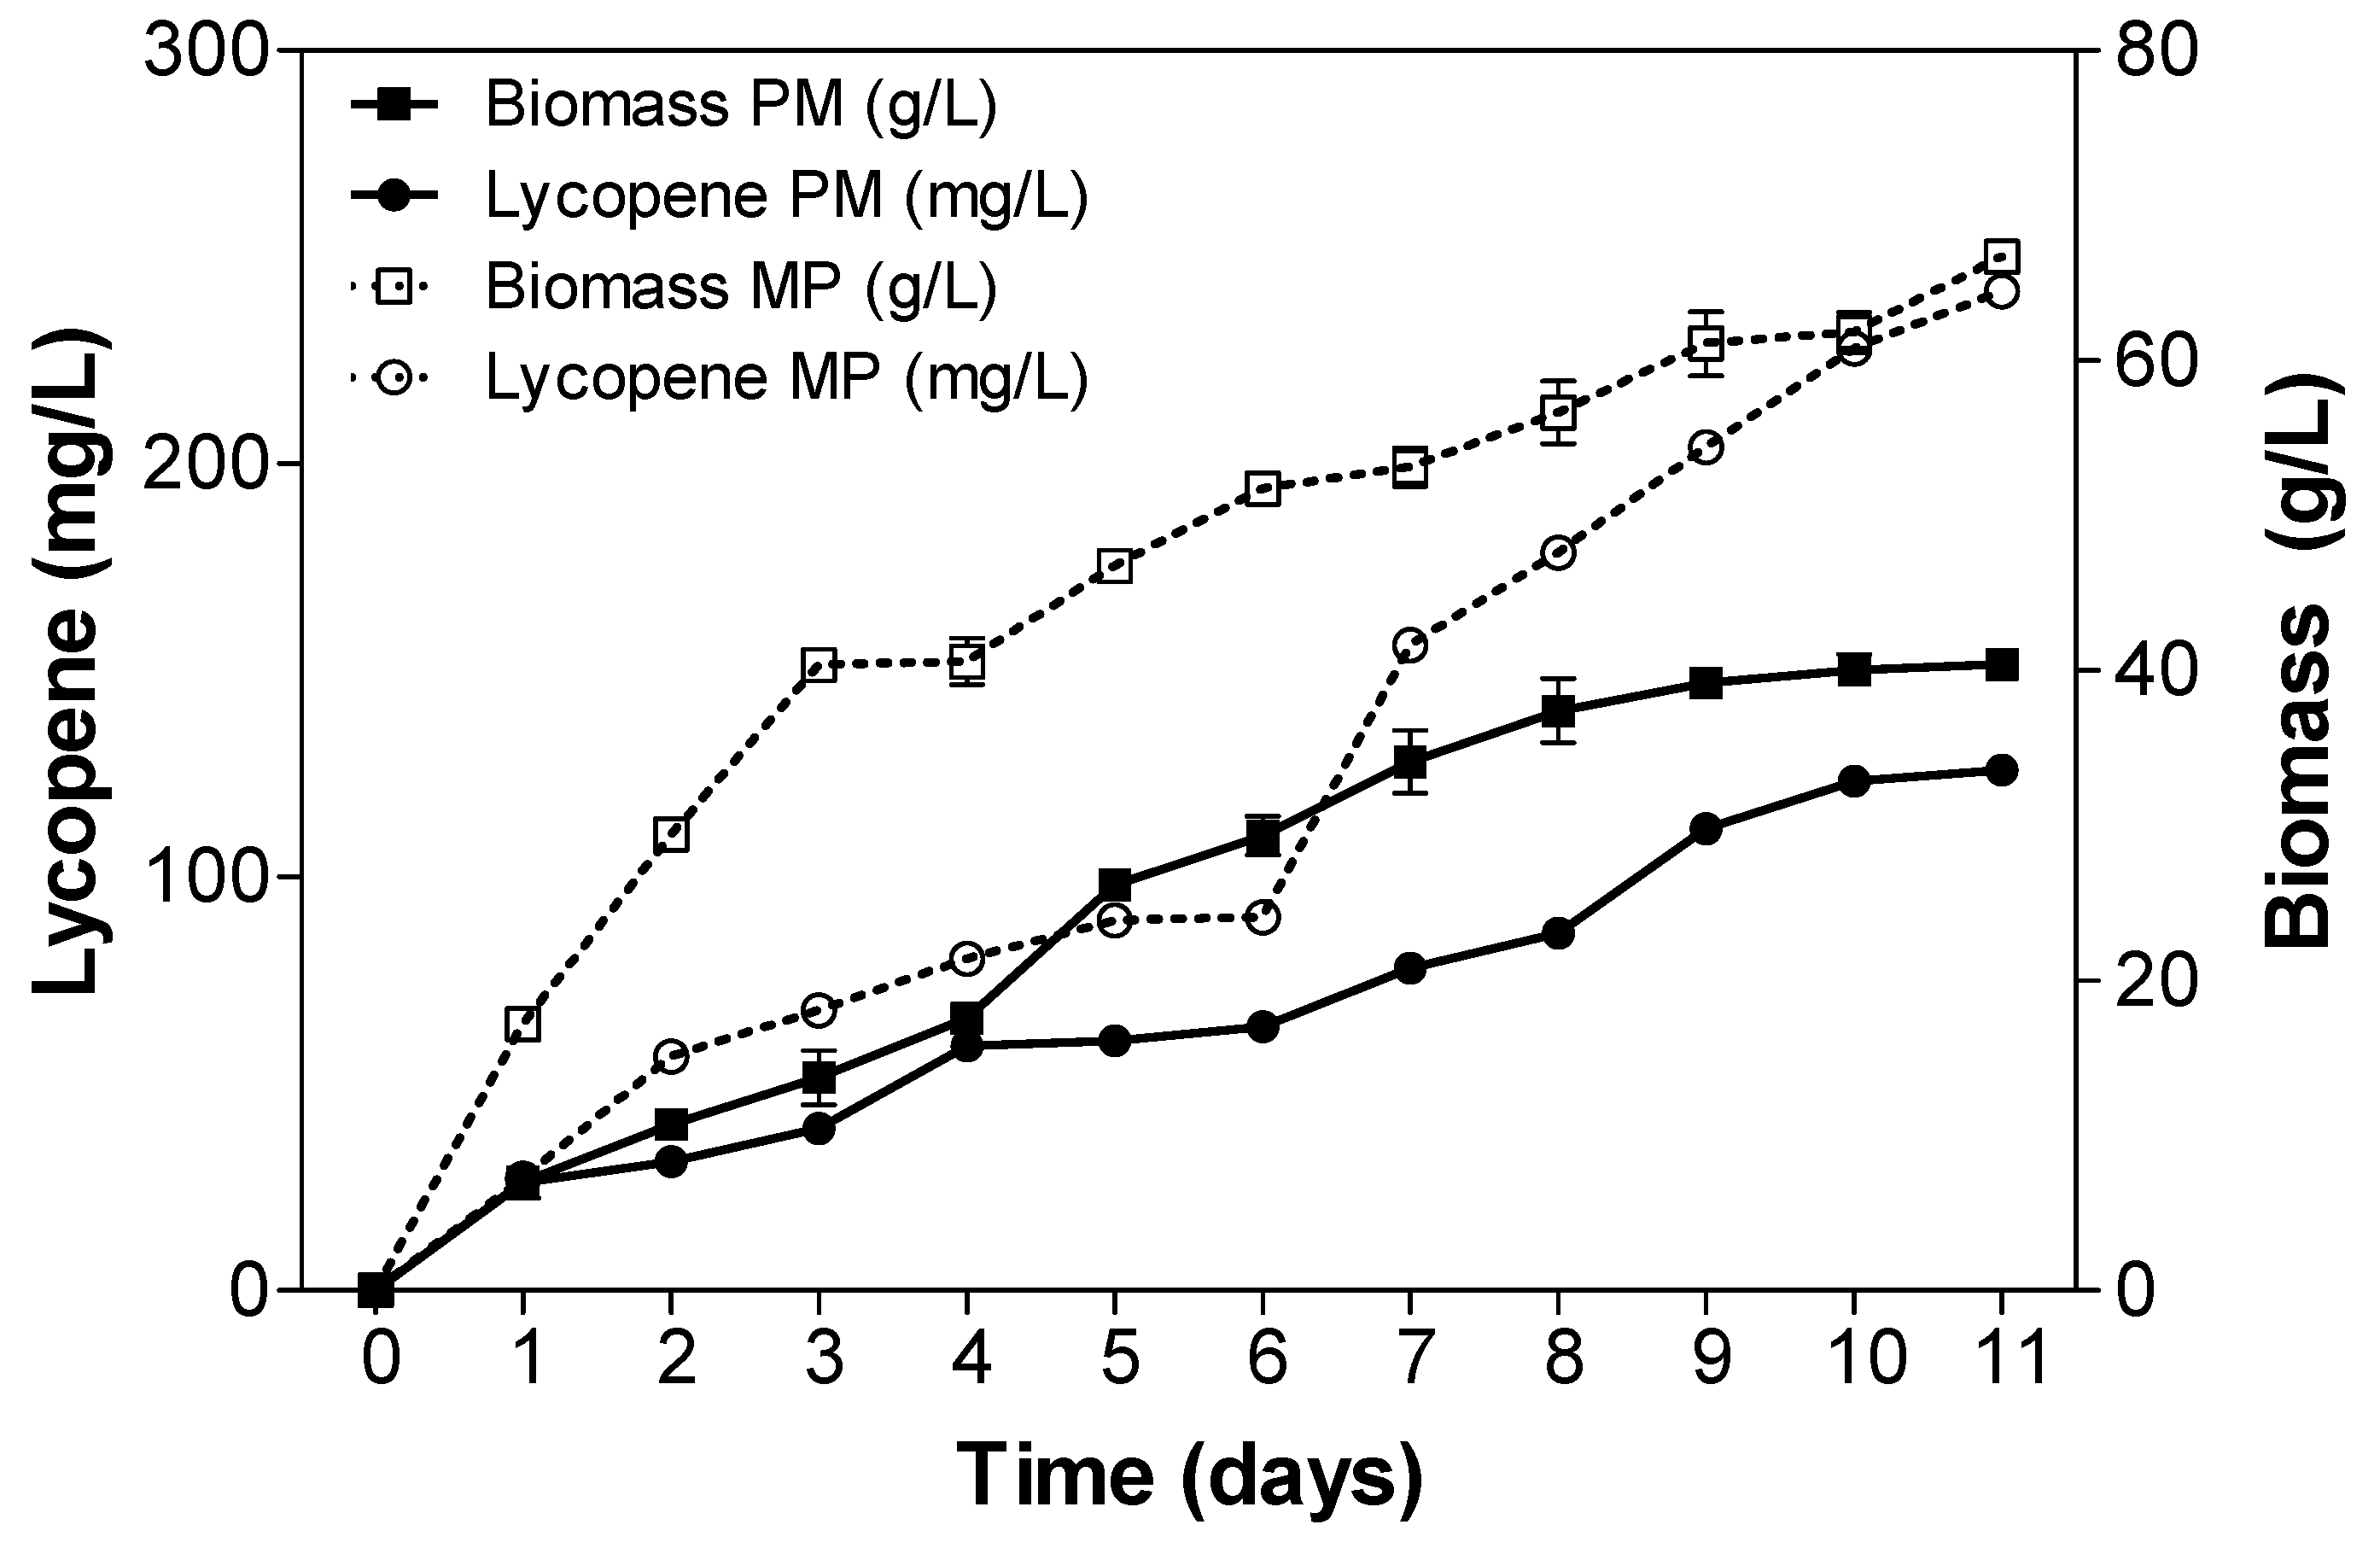
2.3. Fed-Batch Fermentation of Y. lipolytica for Lycopene Production on Designed Media

Designed media were initially used for lycopene production in a 1.5 L fermenter with a working volume of 1 L in batch. The fed-batch operation started at 24 h and consisted in the supplementation of a feeding solution containing 200 g/L glucose and 200 g/L of fructose. The feeding (50 mL) was executed every 24 h. The pH was initially controlled at 5.5 and then controlled at 3 after 48 h when the color began to appear. The results of biomass and lycopene production on different media over the fermentation course are depicted in Figure 2.
Figure 2. Fed-batch cultivation of Po1f-1312E + 1269IB for lycopene and biomass production in a 1.5 L fermenter at 30 °C and DO = 50% using the literature-based designed medium (PM) and the FBA-assisted (combination FBA + Plackett-Burman) designed medium (MP). Error bars embody standard deviation among the average of two distinct reiterated experiments. The pH was initially controlled at 5.5, then at 3 from the 48th hour of fermentation. The aeration rate was fixed at 1 vvm (volume air per volume per minute) and the agitation rate was set to automatically respond to the dissolved oxygen (DO) concentration so as to maintain it at 50%. The fed-batch started at 24 h with a feeding solution containing 200 g/L glucose and 200 g/L of fructose. The feeding was executed every 24 h with 50 mL of the feeding solution.
Metabolites 05 00794 g002
After 10 days of fermentation, we found a maximum biomass production of 40.2 g/L with a lycopene concentration of 126 mg/L from the medium designed without taking into account the FBA predictions (PM) (Figure 2a). Lycopene production increased progressively to reach a maximum value of 126 mg/L. In the medium obtained by combination of FBA and Plackett-Burman design (MP), a biomass of 61.08 g/L and a lycopene concentration of 242 mg/L were obtained after 10 days of fermentation (Figure 2b). Lycopene production in the designed using both methods (MP) was about two-fold that obtained in the PM medium. The maximum lycopene content of 4.02 mg/g DCW was obtained on this medium.

3. Discussion

Relative to other yeasts, Y. lipolytica, as an oleaginous yeast, is able to accumulate significant quantities of lipid bodies under certain growth conditions. This property provides a reliable storehouse for carotenoids biosynthesis and, consequently, the heterologous production of carotenoids using Y. lipolytica may constitute a promising asset for large-scale operations. The heterologous synthesis of lycopene in Y. lipolytica requires the introduction of the biosynthetic genes (crtE, crtB and crtI) even if the expression of crtE is not necessary in various heterologous hosts including Y. lipolytica, and bioengineering approaches for integrating these genes in Y. lipolytica have been described previously [24]. CrtE is a geranylgeranyl diphosphate synthase that catalyzes the conversion of FPP and IPP to GGPP and CrtB is a phytoene synthase that can condense two molecules of the C20 precursor, GGPP, to yield the first C40 hydrocarbon, the phytoene. This is followed by a series of sequential desaturations of phytoene to produce ζ-carotene, neurosporene, and, finally, lycopene [25]. This process is catalyzed by the phytoene desaturase (CrtI). The most advanced lycopene production using Y. lipolytica is the recent publication of Matthäus, Ketelhot, Gatter, and Barth [13] in which the codon-optimized genes crtB and crtI of Pantoea ananatis were expressed in Y. lipolytica under the control of the TEF1 promoter of Y. lipolytica. Moreover, these authors undertook the modifications of native metabolic pathways in Y. lipolytica via the overexpression of bottleneck genes in the isoprenoid pathway (GGS1 and HMG1) and the knock-out of POX1 to POX6 as well as GUT2 genes and successfully enhanced lycopene production (16 mg/g DCW). In a previous study, taking into account the fact that the use of expression vectors pINA1269 and pINA1312, carotenoid genes crtE, crtB, and crtI can be successively integrated into the yeast chromosome with improved strain stability, we synchronically introduced combinations of these plasmids carrying lycopene biosynthesis genes and spawned lycopene producing strains. Further characterization of these engineered strains showed discrepancies in terms of lycopene and biomass production among engineered strains and suggested the impact of engineering tactics on lycopene biosynthesis in engineered strains.
In the present study, we aimed to establish an effective fermentation platform for lycopene production from the most robust engineered strain (Po1f-1312E + 1269IB) using statistical and GSMN modeling tools for screening chemical compounds and designing culture media. Efficient media were employed for fed-batch cultivation. The improvement of cultivation conditions (media and scale-up) led to lycopene production of 242 mg/L of lycopene using the medium designed based on the variables screened from the FBA-predicted factors. This concentration of lycopene was approximately the double of that obtained in the medium designed based on the literature. The above results demonstrated the usefulness of FBA and modelling tools for improved production of lycopene in consistency with previous investigations showing that FBA simulations can be efficiently applied for experimental validation and improvement of the production of objectives production or biological processes [26,27,28]. The lycopene content obtained in shake flasks was three-fold that achieved by Matthäus, Ketelhot, Gatter, and Barth [13] but the lycopene content in fed-batch cultivation mode was lower compared to their results. This could be explained by the fact that these authors carried out supplementary genetic modifications in their experiments or because of the source of lycopene biosynthesis genes. As a matter of fact, the lycopene production obtained from the present study was higher than the concentration these authors obtained with their basic strain (H222 Δ BI). In view of the above, we believe that the FBA-driven designed medium will contribute largely in the improvement of lycopene production. This could be applicable to a wide range of engineered strains of Y. lipolytica and other yeast species for lycopene and other terpenoids molecules. Additionally, our study gave insights into the comprehension of the effects of some external factors on genes of the terpenoids pathway. Correct monitoring of these factors for media designing, coupled with adequate metabolic engineering tactics, will contribute to the fundamental research and the efficient production of lycopene even at the industrial level.

4. Material and Methods

4.1. Description of the Engineered Lycopene Producing Y. Lipolytica Strain

Prior to cultivation improvement experiments, we first proceeded to the bioengineering of Y. lipolytica in order to obtain a dependable lycopene producing strain. The bioengineering work has been published in a local Chinese journal. The strain designated as Po1f-1312E + 1269IB, representing the recombinant strain obtained from the introduction of plasmid pINA1312 (carrying gene crtE) and pINA1269 (carrying genes crtI and crtB) into the host strain Y. lipolytica Po1f, was used in this study given that it displayed noteworthy growth and lycopene production behavior.

4.2. Modeling Platform

Flux balance analysis (FBA) is the paramount method for estimating flux distributions and assumes that organisms utilize substrates adequately to maximize a fixed objective of model (biomass or a particular reaction of production). The FBA method can be used to reproduce environmental conditions necessary for achieving the maximization of the objective function of the model and is an integrated element of the COBRA 2.0 Toolbox in Matlab. The FBA was carried out using Matlab R2011a (Mathworks, Natick, MA, USA) and the COBRA 2.0 toolbox. We used an in silico Y. lipolytica terpenoids biosynthesis genome-scale metabolic model (GSM) yli v1.7 updated from our previous publication [29]. The updated GSM yli v1.7 was composed of 718 genes, 1293 reactions, and 986 metabolites. The solvers used to optimize problems included “glpk” (version 4.35) and Tomlab/CPLEX (version 7.9). All the calculations were implemented on a personal computer with 3.40 GHz Intel (R) Core (TM) i7-2600k and 16.0 GB RAM. The implementation consisted in the computation of flux distributions with farnesyl pyrophosphate (FPP), a key terpenoids biosynthesis precursor, as the objective metabolite. Medium components were predicted by screening exchange reactions with negative fluxes.

4.3. Plackett-Burman Design and Shake Flasks Cultivation

To identify the vital factors that affect biomass and lycopene production in the engineered strain and make breakthrough improvements, a saturated screening design based on the Plackett-Burman structures incorporated into Design expert software (version 8) was adopted. The total number of trials to be implemented according to Plackett-Burman was (n+1) runs, wherein n represents the number of modules to be screened. Each component was assigned two levels of concentrations (high concentration and low concentration). Firstly, a set of 23 factors selected in light of the preliminary experiments and literature review (data not shown), were combined in 24 trials for the designing of FBA-independent cultivation media. Following this, the FBA-driven predicted factors (n = 23) were used for conducting a Plackett-Burman design of 24 runs. Numerous post-optimization experiments were equally carried out on the basis of Plackett-Burman design.
The cultivation conditions were as follows. Primarily, the metabolically engineered Y. lipolytica harboring carotenogenic plasmids were inoculated into 50 mL of S2 medium for 24 h at 30 °C with a shaking speed of 200 rpm. These pre-cultures were then transferred to a 250 mL shake flask containing 50 mL of each designed medium and grown for another seven days under the same fermentation temperature and agitation speed.

4.4. Bioreactor Scale-up

The optimized designed media were directly used for aerobic fermentation of the transgenic Y. lipolytica strain Po1f-1312E + 1269IB for lycopene production. The fermentation process was run in fed-batch mode in a 1.5 L stirred-tank fermenter (Baoxing Co., Shanghai, China) with a working volume of 1 L at 30 °C. The aeration rate was fixed at 1 vvm (volume air per volume per minute) and the agitation rate was set to automatically respond to the dissolved oxygen (DO) concentration so as to maintain it at 50%. Sterile air filters with 0.2 µm pores were used for air transfer into bioreactor. The DO concentration in the culture broth was measured using a pO2 electrode. Silicone was periodically added as an antifoam agent. The fed-batch operation started at 24 h and consisted in the supplementation of a feeding solution containing 200 g/L glucose and 200 g/L of fructose. The feeding (50 mL) was executed every 24 h. The pH was initially controlled at 5.5 and then controlled at 3 after 48 h following the appearance of color.

4.5. Determination of Glucose Concentration, Dry Cell Weight, and Lipids

After cultivation, 5 mL of cell broth was harvested, centrifuged at 12,000 rpm for 5 min, washed twice with distilled water and dried at 105 °C for 48 h. The dry cell weight (DCW) was determined by gravimetrically measuring the weight of the dry cell pellets. Glucose measurement was monitored by a spectrophotometric procedure by means of a Glucose Reagent Kit (Kexin Biotech Co., Ltd., Shanghai, China) following the vendor’s guidelines. Lipid extraction protocol was as described in our previous publication [30].

4.6. Lycopene Extraction and HPLC Analysis

Following the cultivation end time, precise volumes of homogenous culture broth were harvested, centrifuged at 12,000 rpm for 10 min at 4 °C and washed twice with deionized water. The supernatant was discarded and the pellet was used for lycopene extraction. Prior to lycopene extraction, pellets were dissolved in 500 μL of dimethyl sulfoxide (DMSO), pre-warmed at 55 °C for 30 min, shook strongly for 30 s, and then maintained for an extra 30 min without shaking. After that, 500 μL of acetone was added to the DMSO extract and homogenized by vortexing for 30 s, followed by incubation at 55 °C for 15 min with intermittent shaking. The mixture was subsequently centrifuged at 12,000 rpm for 10 min, and the colored mixed supernatants were transferred into a new tube. The extraction step was repeated until all visible pigments in the residual cell pellet and supernatant were extracted. The obtained colored supernatants were pooled together and used for lycopene quantification via high-performance liquid chromatography (HPLC) analysis. All operations occurred on ice under dim light to prevent photodegradation, isomerizations, and structural changes of the carotenoids.
The lycopene concentration of each extract was quantified by HPLC analysis which was performed on a Shimadzu LC-20A HPLC instrument equipped with a LC solution software program, LC-20AD pump, and a detector with a UV-Vis lamp. Specifically, it was carried out by injecting 10 μL of the crude carotenoid extract into a Zorbax SB-Aq C18-reverse-phase column (4.6 mm × 250 mm, 5 μm; Agilent Technologies, Palo Alto, CA, USA). The extract was eluted under isocratic condition with a mobile phase containing 80% acetonitrile, 15% methanol and 5% isopropanol at a flow rate of 1 mL/min at 30 °C. Quantitative analysis was accomplished using a calibration curve obtained with a lycopene standard and final lycopene concentrations were obtained by normalization to the total initial volumes used during extraction.

4.7. Quantitative Reverse Transcription-PCR (qRT-PCR) Studies

The cells were pelleted and total RNA was extracted as previously described [31]. To keep comparable content of starting materials, the total RNA was prudently determined with a DU 800 spectrophotometer (Beckman-Coulter, Fullerton, CA, USA). The chromosomal DNA was degraded by treatment with DNase I according to the manufacturer’s instructions. Next, 1000 ng of RNA from each sample was used for the reverse transcription with ReverTra Ace qPCR RT Master Mix instrument (Toyobo Co., Ltd., Osaka, Japan). Subsequently, 1 μL sample from each reaction mixture was used to perform quantitative PCRs (qPCRs) (in triplicate) with SYBR Green Realtime PCR Master Mix (Toyobo) using specific primers, with a non-template control. The primers used are presented in Supplementary File 5. The reactions were performed in a CFX Fast real-time PCR system (Bio-Rad Laboratories, Inc., Hercules, CA, USA).
To prevent the variation of starting materials amounts, ACT1 was utilized as a housekeeping gene. The results were expressed as fractions of gene expression between the target gene and the housekeeping gene, ACT1 [32].

5. Conclusions

The FBA and Plackett–Burman screening investigational design empowered the bringing about of significant variables for lycopene production from Y. lipolytica. The findings of the present study could have implications for improved production of lycopene using Y. lipolytica as a fermentation platform and promote terpenoids production at the industrial scale. Supplementary material in relation to Pareto charts of Plackett-Burman design and the Plackett-Burman design regarding terpenoids backbone genes expression levels is available on the journal website.

Supplementary Files

Supplementary File 1

Acknowledgments

This study was financially supported by National Basic Research Program of China (973 Program) (2012CB721101) and National Natural Science Foundation of China (21576089).

Author Contributions

Komi Nambou, Qiang Hua, Xingxing Jian, Xinkai Zhang, Liujing Wei conceived and designed the experiments; Komi Nambou, Xingxing Jian, Xinkai Zhang. performed the simulation and experiments, Komi Nambou, Xinkai Zhang, Qiang Hua. analyzed the data; Jiajia Lou, Catherine Madzak contributed reagents and materials; Komi Nambou wrote the manuscript under supervision of Qiang Hua.

Conflicts of Interest

The authors declare no conflict of interest.

References

  1. Heider, S.E.; Peters-Wendisch, P.; Netzer, R.; Stafnes, M.; Brautaset, T.; Wendisch, V. Production and glucosylation of c50 and c40 carotenoids by metabolically engineered Corynebacterium glutamicum. Appl. Microbiol. Biotechnol. 2014, 98, 1223–1235. [Google Scholar] [CrossRef] [PubMed]
  2. Britton, G. Carotenoids. In Natural Food Colorants; Hendry, G.A.F., Houghton, J.D., Eds.; Springer: London, UK, 1996; pp. 197–243. [Google Scholar]
  3. Krinsky, N.I. Actions of carotenoids in biological systems. Annu. Rev. Nutr. 1993, 13, 561–587. [Google Scholar] [CrossRef] [PubMed]
  4. Amorim-Carrilho, K.T.; Cepeda, A.; Fente, C.; Regal, P. Review of methods for analysis of carotenoids. TrAC Trend Anal. Chem. 2014, 56, 49–73. [Google Scholar] [CrossRef]
  5. Gloria, N.F.; Soares, N.; Brand, C.; Oliveira, F.L.; Borojevic, R.; Teodoro, A.J. Lycopene and beta-carotene induce cell-cycle arrest and apoptosis in human breast cancer cell lines. Anticancer Res. 2014, 34, 1377–1386. [Google Scholar] [PubMed]
  6. Ilic, D. Lycopene for the prevention and treatment of prostate disease. Recent Results Cancer Res. 2014, 202, 109–114. [Google Scholar] [PubMed]
  7. Zhang, B.; Gu, Y. Low expression of erk signaling pathway affecting proliferation, cell cycle arrest and apoptosis of human gastric hgc-27 cells line. Mol. Biol. Rep. 2014, 41, 3659–3669. [Google Scholar] [CrossRef] [PubMed]
  8. Takeshima, M.; Ono, M.; Higuchi, T.; Chen, C.; Hara, T.; Nakano, S. Anti-proliferative and apoptosis-inducing activity of lycopene against three subtypes of human breast cancer cell lines. Cancer Sci. 2014, 105, 252–257. [Google Scholar] [CrossRef] [PubMed]
  9. Bilecova-Rabajdova, M.; Birkova, A.; Urban, P.; Gregova, K.; Durovcova, E.; Marekova, M. Naturally occurring substances and their role in chemo-protective effects. Cent. Eur. J. Public Health 2013, 21, 213–219. [Google Scholar] [PubMed]
  10. Khuda-Bukhsh, A.R.; Das, S.; Saha, S.K. Molecular approaches toward targeted cancer prevention with some food plants and their products: Inflammatory and other signal pathways. Nutr. Cancer 2014, 66, 194–205. [Google Scholar] [CrossRef] [PubMed]
  11. Ciccone, M.M.; Cortese, F.; Gesualdo, M.; Carbonara, S.; Zito, A.; Ricci, G.; de Pascalis, F.; Scicchitano, P.; Riccioni, G. Dietary intake of carotenoids and their antioxidant and anti-inflammatory effects in cardiovascular care. Mediat. Inflamm. 2013, 2013, 782137. [Google Scholar] [CrossRef] [PubMed]
  12. Ye, R.W.; Sharpe, P.L.; Zhu, Q. Bioengineering of oleaginous yeast Yarrowia lipolytica for lycopene production. Methods Mol. Biol. 2012, 898, 153–159. [Google Scholar] [PubMed]
  13. Matthäus, F.; Ketelhot, M.; Gatter, M.; Barth, G. Production of lycopene in the non-carotenoid-producing yeast Yarrowia lipolytica. Appl. Environ. Microbiol. 2014, 80, 1660–1669. [Google Scholar] [CrossRef] [PubMed]
  14. Sharpe, P.L.; Ye, R.W.; Zhu, Q.Q. Carotenoid Production in a Recombinant Oleaginous Yeast. WO Patent 2,008,073,367 A1, 19 June 2008. [Google Scholar]
  15. Jin, Y.S.; Stephanopoulos, G. Multi-dimensional gene target search for improving lycopene biosynthesis in Escherichia coli. Metab. Eng. 2007, 9, 337–347. [Google Scholar] [CrossRef] [PubMed]
  16. Alper, H.; Jin, Y.-S.; Moxley, J.F.; Stephanopoulos, G. Identifying gene targets for the metabolic engineering of lycopene biosynthesis in Escherichia coli. Metab. Eng. 2005, 7, 155–164. [Google Scholar] [CrossRef] [PubMed]
  17. Zhao, J.; Li, Q.; Sun, T.; Zhu, X.; Xu, H.; Tang, J.; Zhang, X.; Ma, Y. Engineering central metabolic modules of Escherichia coli for improving β-carotene production. Metab. Eng. 2013, 17, 42–50. [Google Scholar] [CrossRef] [PubMed]
  18. Bernhard, Ø.P.A. A protocol for generating a high-quality genome-scale metabolic reconstruction. Nat. Protoc. 2010, 5, 93–121. [Google Scholar]
  19. Henry, C.S.; DeJongh, M.; Best, A.A.; Frybarger, P.M.; Linsay, B.; Stevens, R.L. High-throughput generation, optimization and analysis of genome-scale metabolic models. Nat. Biotechnol. 2010, 28, 977–982. [Google Scholar] [CrossRef] [PubMed]
  20. Kitano, H. Computational systems biology. Nature 2002, 420, 206–210. [Google Scholar] [CrossRef] [PubMed]
  21. Lewis, N.E.; Hixson, K.K.; Conrad, T.M.; Lerman, J.A.; Charusanti, P.; Polpitiya, A.D.; Adkins, J.N.; Schramm, G.; Purvine, S.O.; Lopez-Ferrer, D.; et al. Omic data from evolved E. coli are consistent with computed optimal growth from genome-scale models. Sports Med. Arthrosc. Rev. 2010. [Google Scholar] [CrossRef] [PubMed]
  22. Varma, A.; Palsson, B.O. Stoichiometric flux balance models quantitatively predict growth and metabolic by-product secretion in wild-type Escherichia coli w3110. Appl. Environ. Microbiol. 1994, 60, 3724–3731. [Google Scholar] [PubMed]
  23. Schellenberger, J.; Que, R.; Fleming, R.M.; Thiele, I.; Orth, J.D.; Feist, A.M.; Zielinski, D.C.; Bordbar, A.; Lewis, N.E.; Rahmanian, S.; et al. Quantitative prediction of cellular metabolism with constraint-based models: The cobra toolbox v2.0. Nat. Protoc. 2011, 6, 1290–1307. [Google Scholar] [CrossRef] [PubMed]
  24. Ye, V.M.; Bhatia, S.K. Pathway engineering strategies for production of beneficial carotenoids in microbial hosts. Biotechnol. Lett. 2012, 34, 1405–1414. [Google Scholar] [CrossRef] [PubMed]
  25. Sandmann, G. Phytoene desaturase: Genes, enzymes and phylogenetic aspects. J. Plant Physiol. 1994, 143, 444–447. [Google Scholar] [CrossRef]
  26. Jin, Y.S.; Jeffries, T.W. Stoichiometric network constraints on xylose metabolism by recombinant Saccharomyces cerevisiae. Metab. Eng. 2004, 6, 229–238. [Google Scholar] [CrossRef] [PubMed]
  27. Boyle, N.R.; Morgan, J.A. Flux balance analysis of primary metabolism in Chlamydomonas reinhardtii. BMC Syst. Biol. 2009. [Google Scholar] [CrossRef] [PubMed]
  28. Tajparast, M.; Frigon, D. Genome-scale metabolic model of Rhodococcus jostii rha1 (imt1174) to study the accumulation of storage compounds during nitrogen-limited condition. BMC Syst. Biol. 2015. [Google Scholar] [CrossRef] [PubMed]
  29. Pan, P.; Hua, Q. Reconstruction and in silico analysis of metabolic network for an oleaginous yeast, Yarrowia lipolytica. PLoS ONE 2012, 7, e51535. [Google Scholar] [CrossRef] [PubMed]
  30. Nambou, K.; Zhao, C.; Wei, L.; Chen, J.; Imanaka, T.; Hua, Q. Designing of a “cheap to run” fermentation platform for an enhanced production of single cell oil from Yarrowia lipolytica dsm3286 as a potential feedstock for biodiesel. Bioresour. Technol. 2014, 173, 324–333. [Google Scholar] [CrossRef] [PubMed]
  31. Verwaal, R.; Paalman, J.W.; Hogenkamp, A.; Verkleij, A.J.; Verrips, C.T.; Boonstra, J. Hxt5 expression is determined by growth rates in Saccharomyces cerevisiae. Yeast 2002, 19, 1029–1038. [Google Scholar] [CrossRef] [PubMed]
  32. Pfaffl, M.W. A new mathematical model for relative quantification in real-time RT-PCR. Nucleic Acids Res. 2001, 29, 2003–2007. [Google Scholar] [CrossRef]

