Article

Transcriptome in Liver of Periparturient Dairy Cows Differs between Supplementation of Rumen-Protected Niacin and Rumen-Protected Nicotinamide

1
College of Animal Science and Technology, Northwest A&F University, Xianyang 712100, China
2
UWA Institute of Agriculture, The University of Western Australia, Crawley, WA 6009, Australia
3
College of Veterinary Medicine, Northwest A&F University, Xianyang 712100, China
*
Authors to whom correspondence should be addressed.
These authors contributed equally to this work.
Metabolites 2024, 14(3), 150; https://doi.org/10.3390/metabo14030150
Submission received: 30 December 2023 / Revised: 4 February 2024 / Accepted: 15 February 2024 / Published: 1 March 2024
(This article belongs to the Special Issue Nutrition and Metabolism in Animals)

Abstract

:
To investigate the difference between rumen-protected niacin (RPN) and rumen-protected nicotinamide (RPM) in the transcriptome of genes relating to the lipid metabolism of the liver of periparturient dairy cows, 10 healthy Chinese Holstein cows were randomly divided into two groups and fed diets supplemented with 18.4 g/d RPN or 18.7 g/d RPM, respectively. The experiment lasted from 14 days before to 21 days after parturition. Liver biopsies were taken 21 days postpartum for transcriptomic sequencing. In addition, human LO2 cells were cultured in a medium containing 1.6 mmol/L of non-esterified fatty acids and 1 mmol/L niacin (NA) or 2 mmol/L nicotinamide (NAM) to verify the expression of the 10 genes selected from the transcriptomic analysis of the liver biopsies. The expression of a total of 9837 genes was detected in the liver biopsies, among which 1210 differentially expressed genes (DEGs) were identified, with 579 upregulated and 631 downregulated genes. These DEGs were associated mainly with lipid metabolism, oxidative stress, and some inflammatory pathways. Gene ontology (GO) enrichment analysis showed that 355 DEGs were enriched in 38 GO terms. The differences in the expression of these DEGs between RPN and RPM were predominantly related to the processes of steroid catabolism, steroid hydroxylase, monooxygenase activity, oxidoreductase activity, hemoglobin binding, and ferric iron binding, which are involved mainly in lipid anabolism and redox processes. The expressions of FADS2, SLC27A6, ARHGAP24, and THRSP in LO2 cells were significantly higher (p < 0.05) while the expressions of BCO2, MARS1, GARS1, S100A12, AGMO, and OSBPL11 were significantly lower (p < 0.05) on the NA treatment compared to the NAM treatment, indicating that NA played a role in liver metabolism by directly regulating fatty acid anabolism and transport, inflammatory factor expression, and oxidative stress; and NAM functioned more as a precursor of nicotinamide adenine dinucleotide (NAD, coenzyme I) and nicotinamide adenine dinucleotide phosphate (NADP, coenzyme II) to participate indirectly in biological processes such as ether lipid metabolism, cholesterol metabolism, energy metabolism, and other processes.

1. Introduction

The transition period in dairy cows (21 days, respectively, before and after calving) is the most critical stage of the lactation cycle. Approximately 75% of diseases in cows occurs during this period, and severe diseases can lead to the culling or even death of cattle, resulting in significant economic losses [1]. Energy deficiency is the main cause of diseases in periparturient cows [2]. As a result, a large amount of body fat is mobilized to compensate for the energy deficit [3]. An increase in fat mobilization in the body results in a significant increase in plasma non-esterified fatty acids (NEFAs), beta-hydroxybutyrate (BHBA), and hepatic triglycerides (TAGs). High concentrations of NEFAs are highly associated with the incidence of ketosis and fatty liver disease in lactating cows [4], as well as oxidative stress, protein metabolism disorder, and inflammation [5], which results in a reduction in lactating performance, fertility and immunity, and economic income. Niacin (NA) and its amide derivative nicotinamide (NAM) are two forms of water-soluble vitamin B3, which is also known as vitamin PP, an indispensable nutrient in dairy cows. A sharp decline in feed intake in perinatal cows is accompanied with reduction in dietary intake of niacin, therefore, additional dietary niacin must be supplied to meet the cows’ demand for this vitamin [6]. Morey reported that addition of 24 g/d of RPN to the basal diet for periparturient dairy cows reduced postpartum plasma NEFA concentrations [7].
The major role of NA is anti-lipolytic [8], which can be used to alleviate hepatic lipid deposition by increasing hepatic lipid oxidation and decreasing de novo fatty acid synthesis. The role is mainly mediated through the niacin receptor, the G-protein–coupled receptor (GPCR) GPR109A, as well as by non-competitively inhibiting the activity of key rate-limiting enzymes in hepatic triglyceride synthesis [9]. In addition to its role in lipid metabolism, NA also improves dyslipidemia and reduces inflammation in adipose tissues by affecting key genes involved in gluconeogenesis, which in turn modulate the expression of genes associated with glycolysis, the pentose phosphate pathway, lipid and cholesterol synthesis, lipid transport, and very-low-density lipoprotein (VLDL)/LDL assembly [6,7,8,10,11,12]. Excessive accumulation of liver fat leads to elevated levels of reactive oxygen species(ROS) and exacerbates inflammation, while the addition of NA into cultured hepatocytes alleviated lipid accumulation, inhibited ROS production, and reduced the levels of pro-inflammatory factors [13].Unlike NA, NAM can reduce blood fatty acid content by promoting lipid synthesis, and perinatal supplementation of NAM facilitates the transformation of the rumen fermentation mode to the propionic acid type, which not only improves the efficiency of liver energy metabolism, but also promotes lipid metabolism [14]. NAM treatment increases proteins related to mitochondrial function that are involved in oxidative phosphorylation, fatty acid oxidation, and the tricarboxylic acid (TCA) cycle, thereby enhancing cellular antioxidant capacity [9,15]. Therefore, the addition of high doses of NA and NAM can indeed significantly improve the nutritional and health status of dairy cows, such as promoting rumen digestion, improving colostrum quality, increasing milk production, enhancing antioxidant and immune capacity [6,16,17,18,19], and reducing plasma NEFA content and insulin resistance [13,19].
Furthermore, NA and NAM are components of nicotinamide adenine dinucleotide (NAD, coenzyme I) and nicotinamide adenine dinucleotide phosphate (NADP, coenzyme II). These coenzymes are involved in the regulation of energy metabolism, glycolipid metabolism, inflammation, and oxidative stress in the organism [20]. The metabolism of NA and NAM produces NAD+, which serves as a necessary catalyst in energy production pathways, including glycolysis, the TCA cycle, fatty acid oxidation, and oxidative metabolism.
To investigate the transcriptomic differences between dietary addition of RPN and RPM on hepatic lipid metabolism in periparturient dairy cows, we performed a biopsy of cow livers to identify differentially expressed genes (DEGs) and screen for differential metabolic pathways. Then, we validated some DEGs in an in vitro model constructed from NEFA-treated cells to further understand the different mechanisms of the nutritional action of NA and NAM at the molecular level. Currently, bovine hepatocytes are not easily available, so we used human hepatocyte line 2 (LO2) cells in this experiment to build the model and treated the cells with NA or NAM to explore the molecular mechanisms.

2. Materials and Methods

2.1. Animals and Sample Collection

All experimental protocols and interventions in this study were approved by the Ethics Committee of the Northwest A&F University and complied with the Animal Protection Act and the Guidelines for the Care and Use of Laboratory Animals.
Ten healthy Chinese Holstein pregnant cows does with similar parity, weight and expected calving date were selected and randomly divided into 2 groups (5 pregnant cows per group): RPN (RPN 18.4 g/d, purity 65%, rumen bypass rate 80.3%, active ingredient 9.6 g/d) and RPM (RPM 18.7 g/d, purity 60%, rumen bypass rate 85.6%, active ingredient 9.6 g/d) from King Techina, Hangzhou, China. The cows were fed for a period of 35 days, including 14 days before calving and 21 days after calving. During the experimental period, the cows gave birth to healthy calves according to the pre-calving schedule.
All cows were housed in an individual pen and fed twice a day at 07:00 and 16:00 h with a total mixed diet ration (TMR). Pregnant cows were fed a prepartum diet, and after calving they were fed a postpartum diet. The ingredients and chemical compositions of the diet are shown in Table 1. The cows were allowed to eat and drink ad libitum. Liver biopsy was performed by hepatic needle aspiration on day 21 postpartum (collected at 13:00 each day) as previously described by Shen et al. [21]. Then, the liver biopsies were frozen immediately after collection in liquid nitrogen and stored at −80 °C.

2.2. Culture of Human Hepatocyte Line LO2

LO2 cells were initially cultured at 37 °C for 24 h at 5% CO2 in Roswell Park Memorial Institute (RPMI) 1640 medium (HyClone, Logan, UT, USA) containing 10% fetal bovine serum (Gibco BRL, Grand Island, NY, USA). LO2 cells were placed in a 1.6 mmol/L NEFA-deficient RPMI 1640 medium (without NA and NAM) to establish a fatty liver cell model, and then 1 mmol/L NA or 2 mmol/L NAM was added to the cells. The stock NEFA solution contained 3.19 mM palmitic acid, 0.53 mM palmitoleic acid, 1.44 mM stearic acid, 0.49 mM linoleic acid, and 4.35 mM oleic acid, and the final concentration of the stock solution was 53.4 mM. All reagents were purchased from Sigma-Aldrich.

2.3. RNA Isolation and Quantitative Real-Time Polymerase Chain Reaction

Total RNA from LO2 cells was isolated with Trizol (Invitrogen). The Reverse Transcription-Polymerase Chain Reaction (RT-PCR) reaction conditions were carried out according to the instructions provided by Vazyme. 1–2 µg of total RNA was treated with DNAse (Invitrogen) and then reverse transcribed to cDNA using Moloney Murine Leukemia Virus Reverse Transcriptase (M-MLV) reverse transcriptase (Vazyme, Nanjing, China). Quantitative Real-Time PCR (RT-PCR) was performed using SYBR® Select Master Mix (vazyme, Nanjing, China) and BIO-RAD® (Funglyn Biotech Inc., Richmond Hill, ON, Canada) CFX Opus 96 Real-Time PCR System. The relative quantitative gene expression levels were determined using the 2−ΔΔCt method and normalized by GAPDH (Table 2).

2.4. RNA Isolation and cDNA Library Construction

Total RNA in liver biopsies was extracted, and the RNA concentration and purity were determined using a Nanodrop2000 (Thermo Fisher Scientific, Waltham, MA, USA). Agarose gel- electrophoresis was used to detect the integrity of RNA. An Agilent 2100 Bioanalyzer was used to measure the RNA value. The enriched mRNA was segmented, then reverse synthesized to cDNA, which completed the construction of the library to be sequenced. The following conditions were set up for the creation of a single library to be sequenced: the total amount of RNA ≤ 1 µg, the concentration ≥ 35 ng/µL, OD260/280 ≥ 1.8, OD260/230 ≥ 1.0. After passing the quality assessment, the library was sequenced on the IlluminaNovaseq6000 platform, and the database was established by Shanghai Meiji Biomedical Technology Co., Shanghai, China.

2.5. Analysis of Differential Expression of Genes

The software DESeq2 version1.24.0 in R [22] based on negative binomial distribution was used to analyze the DEGs. We used the NA-treated group as a control for comparison between the two groups. According to the p-value and |log2 FC| (fold change) as screening thresholds, log2 FC > 0 indicates gene expression as upregulated and log2 FC < 0 indicates gene expression as downregulated.

2.6. Analysis of DEG Enrichment

Goatools software version 0.6.5 in python [23] was used for GO (gene ontology) enrichment analysis of genes/transcripts, and R script was used for KEGG (Kyoto encyclopedia of genes and genomes) pathway enrichment analysis of genes/transcripts. Fisher’s exact test and the Benjamini–Hochberg method was used to correct the p-value. Significance of GO enrichment and KEGG enrichment was considered as a p-value < 0.05.

2.7. Statistical Analysis

MetaboAnalyst 5.0 (Wishart Research Group, Edmonton, AB, Canada) software was used to perform orthogonal partial least squares-discriminant analysis (OPLS-DA) on the samples from the RPN and RPM treatments. A volcano plot was used to analyze DEGs and their changes in each treatment, and a cluster heatmap was used to analyze the gene expression patterns in each sample. Statistical analysis was performed using IBM SPSS Statistics 26.0 (Armonk, NY, USA). Data are represented as means ± SD and treated with normal distribution test. Unpaired Student’s t-test was used to determine the significance between the means of RPN and RPM treatments. * indicates p < 0.05, ** indicates p < 0.01, *** indicates p < 0.001.

3. Results

3.1. Sequencing Data Quality Control

Transcriptome sequencing data showed better results for subsequent analysis (Supplemental Table S1).

3.2. Analysis of DEGs

The transcriptome gene expression results of the RPN and RPM groups showed that 1261 genes were specifically expressed in the RPN treatment, and 358 genes were specifically expressed in the RPM treatment (Supplementary Figure S1). To characterize the differences in transcriptional profiles between RPM and RPN, we performed pairwise comparisons to obtain differentially expressed genes (DEGs) and identified 1210 genes: 579 genes were upregulated and 631 genes were downregulated (Figure 1; Supplemental Table S2). The top 30 DEGs identified in the RPN and RPM groups are listed in Table 3. As shown in Figure 2, heatmap analysis of the clustering of the identified DEGs showed significant clustering between the two groups. To determine the correlation between samples from different conditions, we performed an OPLS-DA analysis, which showed that the two groups were independent (Figure 3).

3.3. Analysis of Differential Gene Enrichment

The abundances of the top 20 are shown in Figure 4, and the most prominent GO annotation was for steroid metabolism processes. In these processes, NA and NAM could be involved in the bioprocess of hepatic cholesterol production of steroids and their conversion to other steroids in periparturient dairy cows (Table 4). In addition, the GO results showed that NA and NAM are involved in a variety of molecular reactions in the body by regulating the metabolism of proteins, nucleic acids, and metal ions. For example, NA accelerates cholesterol metabolism, allowing steroid hydroxylase to promote the synthesis of cholesterol derivatives of the steroid hormone cortisol. Cortisol is a common steroid hormone that breaks down triglyceride esters in fats [24]. The KEGG results indicate that monooxygenase is involved in metabolic reactions in the body through various types of electron donors. Monooxygenase requires NAD(P)H to drive the process with O2, which is provided by NAM [25].
The results of the pathway enrichment of the DEGs analyzed by KEGG showed that a total of 33 pathways were significantly enriched in two groups and the top 20 enriched KEGG pathways are shown in Table 5. Among these 20 pathways, retinol metabolism had a higher enrichment rate (Figure 5). These results reflected a number of pathway differences between the NA and NAM treatments, which could reveal their different nutritional mechanisms on hepatic metabolism in periparturient dairy cows.

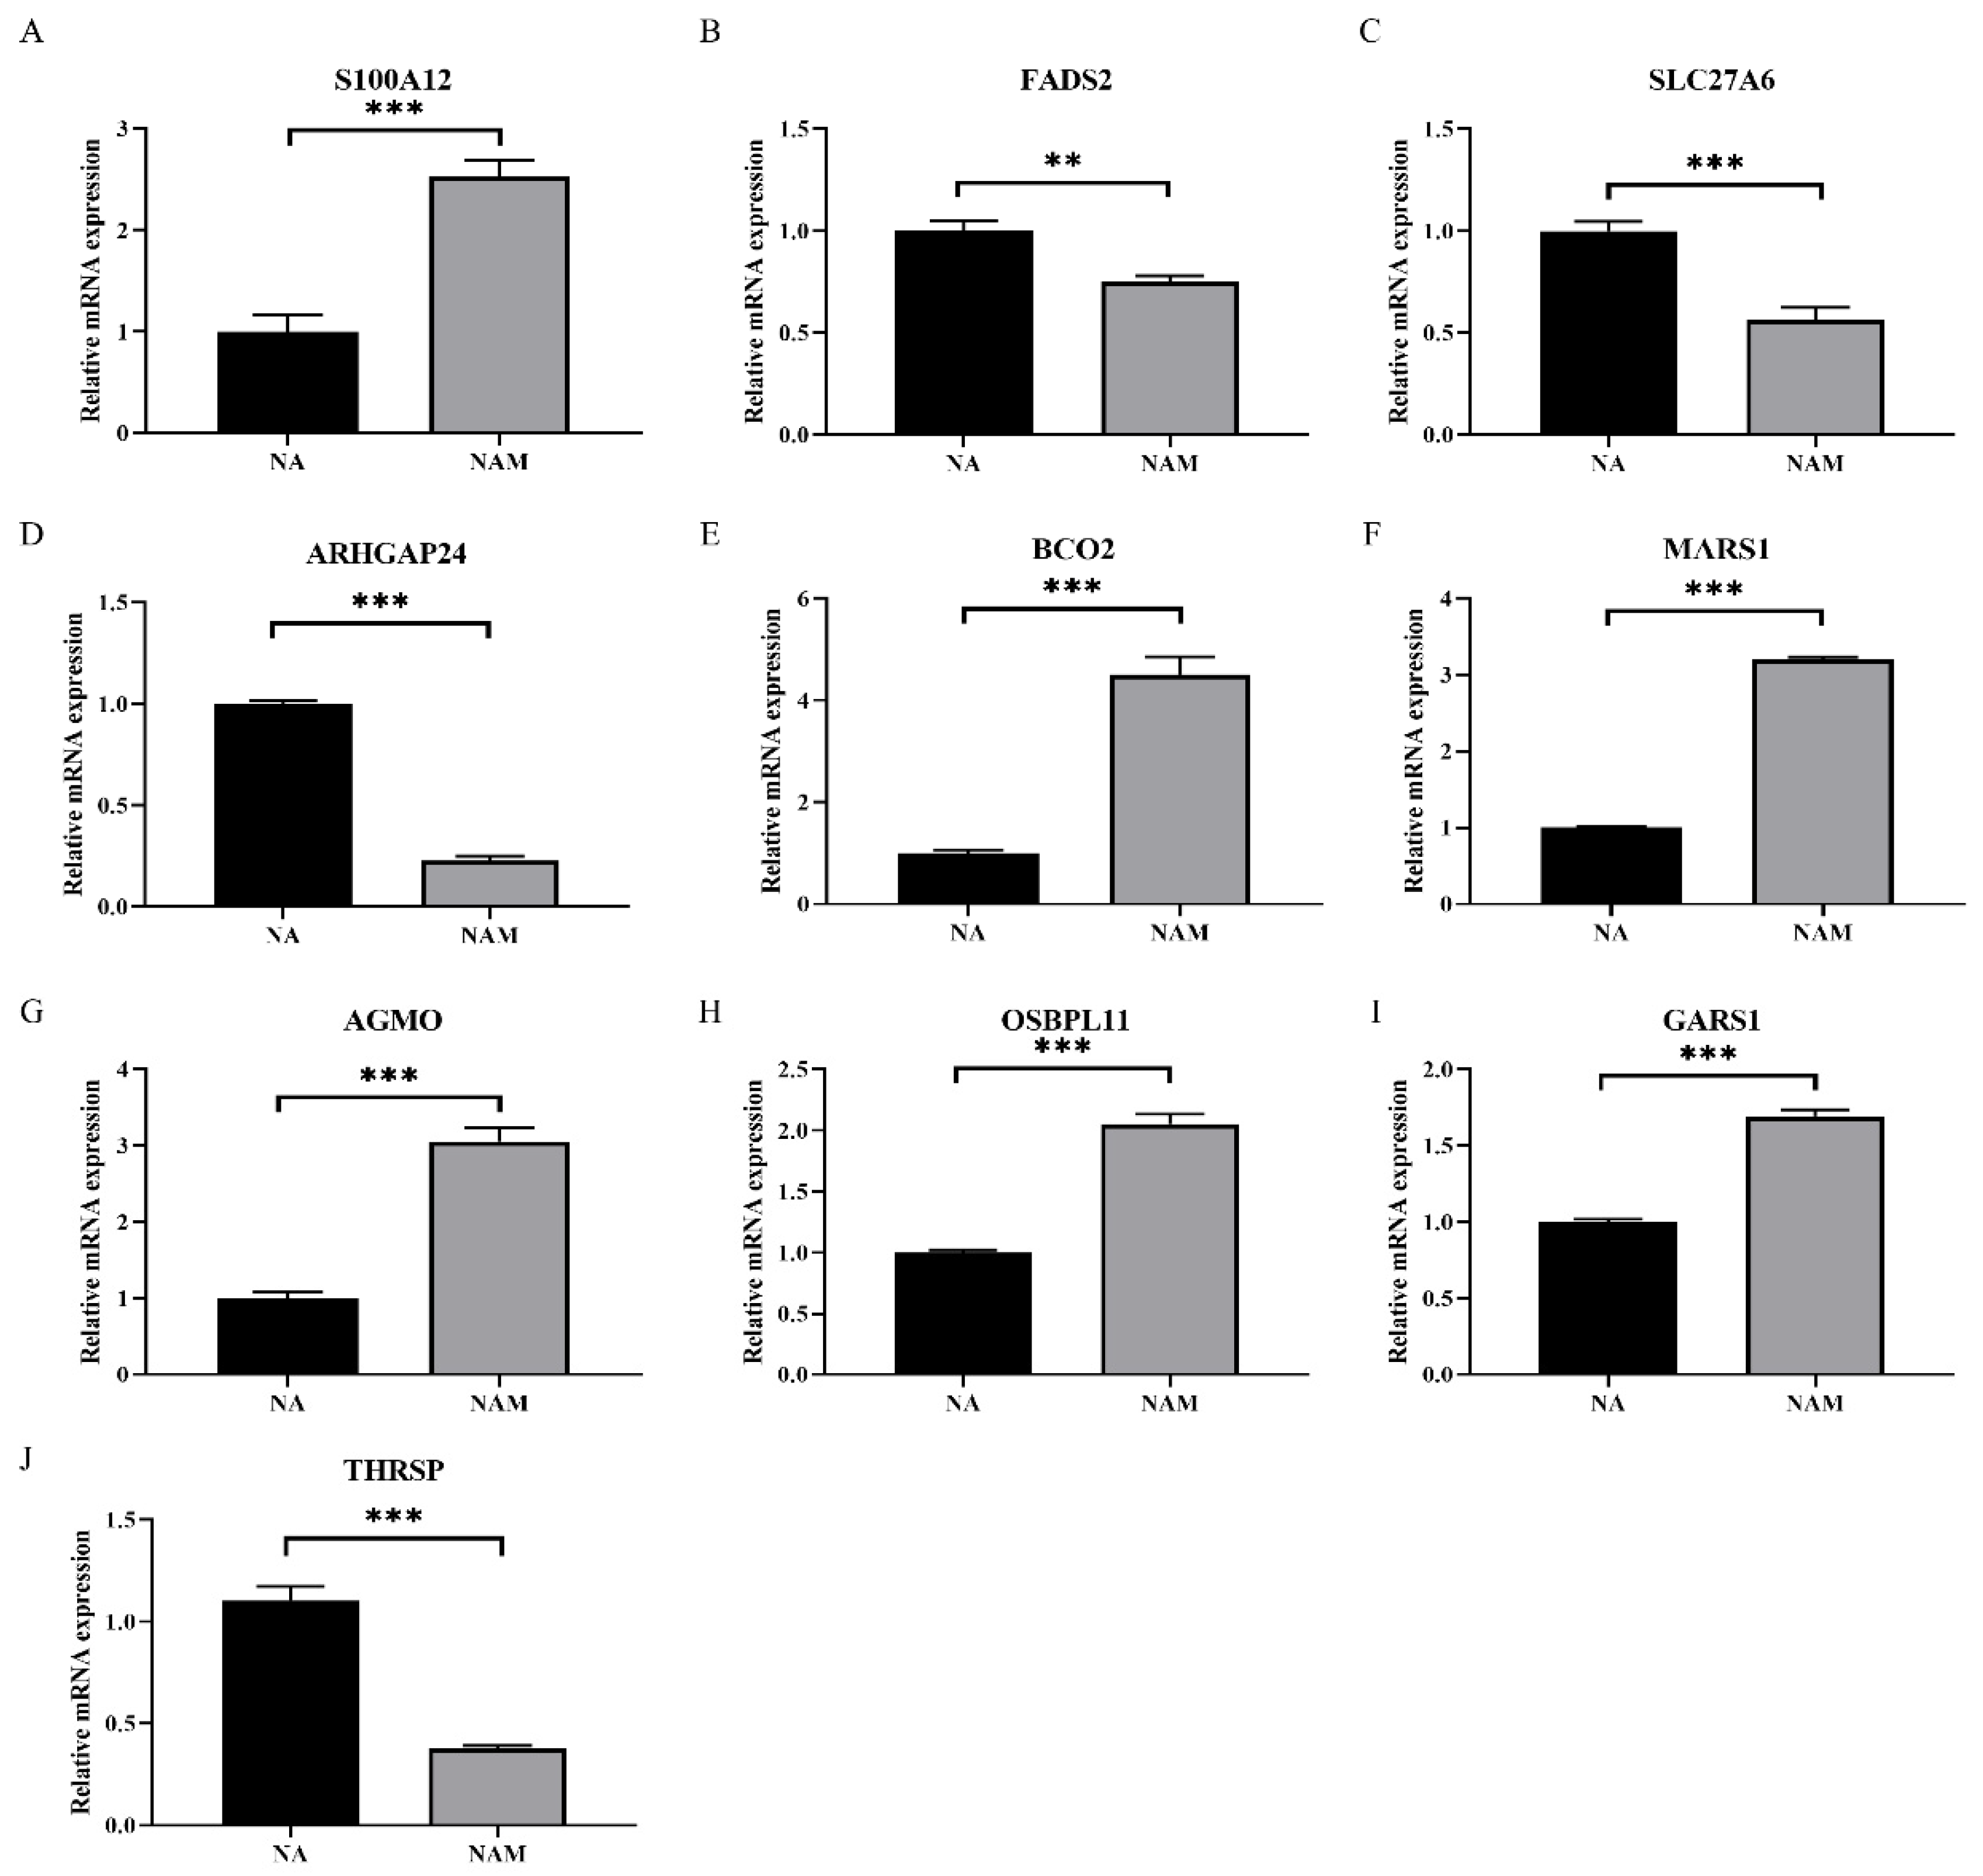
3.4. Validation of DEGs in LO2 Cells

Based on the results of the liver transcriptome analysis, 10 DEGs (AGMO, ARHGAP24, BCO2, FADS2, GARS1, MARS1, OSBPL11, SLC27A6, S100A12, and THRSP) in the LO2 cell model were selectively validated by RT-qPCR for the effects of NA and NAM on hepatic nutrient metabolism (Figure 6). The biological relevance, functional diversity, technical feasibility, and significant differential expression observed in the transcriptome of these genes confirmed that these genes play key roles in hepatic metabolic pathways. Compared with the NAM treatment, the NA treatment increased the expression of FADS2, SLC27A6, and THRSP (p < 0.05), but reduced the expression of S100A12, ARHGAP24, BCO2, MARS1, AGMO, OSBPL11, and GARS1 (p < 0.05).

4. Discussion

The periparturient period of dairy cows is the most critical of their production stages, and the liver, as a central metabolic organ of the whole body, is subject to a variety of nutritional and environmental influences [24]. This study examined the transcriptomic differences in the liver of periparturient dairy cows supplemented with RPN or RPM, and we found most of the DEGs and pathway differences between the two groups were related to lipid metabolism, particularly lipid synthesis.
Except the differentiated effects on the lipid synthesis pathway, NA and NAM treatments also differed in their involvements in other metabolic pathways, such as steroid synthesis and bile secretion, which reveals that the addition of NA or NAM may indirectly affect lipid metabolism by altering the level of hepatic cholesterol and the metabolism of amino acids, ribosomes, and other important proteins. In order to understand the regulation of nutrients in detail, we will discuss mainly at the genetic level. At the gene level, the top DEG was thyroid hormone responsive spot 14 (THRSP). THRSP is an important transcription factor in hepatocytes and an adipogenic activator that controls the expression of several genes involved in lipid metabolism, including fatty acid synthase (FASN) and stearoyl coenzyme A desaturase 1(SCD1) [26]. The levels of glucose, carbohydrates, polyunsaturated fatty acids, and insulin in the liver affect THRSP expression [27], the insulin-responsive factor sterol regulatory element-binding protein-1c (SREBP-1C) and the glucose-responsive transcription factor, carbohydrate response element binding protein (ChREBP), control the levels of THRSP. In addition, the upregulation of THRSP increases the expression of adenosine triphosphate citrate lyase (ACL) and FASN in hepatocytes, activates the pregnenolone X receptor (PXR), and thus affects steroid metabolism [28]. Cellular assays have shown that NA supplementation can increase glucose and insulin levels compared to NAM and stimulate THRSP expression.
In this study, we found the top DEG, BCO2, was for retinol metabolism. Vitamin A is stored in hepatic stellate cells in the form of retinol, which provides vitamin A to all tissues in the body [29]. β-carotenoids can be synthesized to vitamin A, which is often described as an antioxidant and is also important for immune responses [30]. Dairy cows are unable to synthesize carotenoids themselves and must obtain them from the diet. Once ingested, they enter the gut where they form micelles with celiac immature chylomicrons and are transferred into the liver [31], where beta-carotene oxygenase 2 (BCO2) cleaves them into retinoic acid, the most potent form of vitamin A [32]. However, the excessive accumulation of carotenoids can lead to lipid deposition and a corresponding increase in the risk of oxidative stress and inflammation [31,33]. In this study, the expression of BCO2 was found to be significantly higher on the NAM treatment than on the NA treatment, suggesting that the addition of NAM may prevent the over-accumulation of hepatic carotenoids and maintain the homeostasis by increasing the expression of BCO2.
Periparturient cows are susceptible to hepatic steatosis due to high fat mobilization but inadequate removal of free fatty acids [34]. We further revealed the DEGs that are closely related to liver metabolism to elucidate the differences in regulation of liver metabolism by NA and NAM: FADS2 and SLC27A6 were significantly upexpressed on the NA treatment than on the NAM treatment. Fatty acid desaturase 2 (FADS2) is a key enzyme in lipid metabolism, and SREBP-1c and PPAR-α may upregulate FADS2 promoter activity [35]. It can convert linolenic acid into long-chain polyunsaturated fatty acids (LC-PUFA), which are essential fatty acids for organisms and play a crucial role in regulating glycolipid metabolism in organisms. [36] In addition, FADS2 may alter the pathogenesis of NAFLD by modifying DNA methylation [37]. The synthesized fatty acids are then transported by specific transport proteins to be used in the body for substance synthesis and other biological processes. Solute carrier family 27 (SLC27), consisting of six main members (SLC27A1~SLC27A6), is commonly referred as fatty acid transporter proteins (FATPs) or very-long-chain acyl-coenzyme A (CoA) synthase (ACSVLs) [38]. Studies have shown that SLC27 can directly take up long-chain fatty acids and also has acyl coenzyme A synthase activity. Acyl coenzyme A catalyzes the conversion of long-chain fatty acids to acyl coenzyme A thioesters for other metabolic processes such as fatty acid oxidation and phospholipid synthesis [39,40]. The differences in the expression of these two genes suggest that NA has a greater ability than NAM to influence hepatic lipid metabolism through regulation of fatty acid synthesis and transport.
Alkyl glycerolipids are used to form a variety of lipids and phospholipids in animals. Alkylglycerol monooxygenase (AGMO) is currently the only enzyme capable of degrading alkylglycerol lipids and, due to the irreversible nature of the reaction, is critical for ether lipid metabolism [41]. Ether-linked lipid species act as important biofilm components in several organs of the body and also play key roles in other fatty acid processes, including the degradation of long- and branched-chain fatty acids. Interestingly, AGMO is differentially expressed in adipose tissue and liver of hyperlipidemic mice, which implies that its mechanism of action may be different in liver [42,43]. The transcriptome results in this study showed that the AGMO expression was significantly higher on the NA treatment than on the NAM treatment, but the cell model confirmed that the AGMO expression was higher on the NAM treatment. The exact physiological role of AGMO is still unknown. As mentioned above, NA can regulate the glucose and lipid levels of the body, among other things, this may also indirectly affect the condition for AGMO activation. The oxysterol binding protein like 11 (OSBP)-related protein (ORP) family is important in the regulation of cholesterol metabolism and can affect the transport of cholesterol between the Golgi apparatus and biofilm through autophosphorylation, as well as interacting with vitamins after binding [44]. The results of the cell model showed that the expression of OSBP11 was significantly increased on the NAM treatment, suggesting that NAM may use hydroxysterol binding proteins to influence cholesterol metabolism and thus modulate the status of hepatic steatosis.
As the cow’s pregnancy progresses, coupled with dietary changes, the body goes into a more severe negative energy balance, and oxidative stress and inflammation increase [45]. In addition to fat synthesis and metabolism, NA and NAM supplementation in periparturient dairy cows differed in other aspects, such as oxidative stress and inflammatory factors, in the present study.
Rho GTPase activating protein 24 (ARHGAP24) is a member of the ATPase family that can reduce the expression of inflammatory factors, such as IL-6 and TNF-α, by inactivating the Rac1/AKT/NF-ĸB pathway and ameliorate inflammation [46]. The S100 protein family involves in a variety of cellular processes including apoptosis, migration, protein phosphorylation, differentiation, proliferation, and inflammation [47]. It also binds to pattern recognition receptors, triggering downstream nuclear factor-κB (NF-κB), leading to the upregulation of pro-inflammatory gene expression. S100A12 has several extracellular activities that contribute to the innate immune response, including chemotactic activity and activation of intracellular signaling cascades. It binds to receptors such as GPCR, FGF21, TLR4, and SR to produce cytokines that modulate intracellular inflammation and induce oxidative stress [48,49]. It has been shown that S100A12 is produced by innate immune cells (e.g., granulocytes) and is involved in the chemotaxis of innate immune cells. It can exist as a dimer or oligomer and can bind divalent cations, including zinc, copper, and calcium, to promote “nutritional immunity” to invading microbial pathogens. S100A12 interacts with cell surface membranes as well as RAGE, TLR4, and CD36 receptors to promote pro-inflammatory signaling and disease progression and is a potential biomarker for the early diagnosis of inflammation [50]. In this study, we found that the expression of S100A12 was significantly lower on the NA treatment than on the NAM treatment; the results for ARHGAP24 were opposite, suggesting that the addition of NA reduces inflammation and apoptosis by affecting downstream signaling by decreasing the expression of S100A12 and increasing the expression of ARHGAP24 in the liver of cows.
Methionyl-tRNA synthetase 1 (MARS1) and glycyl-tRNA synthetase 1 (GARS1) both belong to the group of aminoacyl-tRNA synthases (ARSs). ARSs are generally used for protein synthesis and interact with proteins in the mTORC1, GCN2, CDK4, and vascular endothelial growth factor receptor (VEGFR) signaling pathways and are potential markers of pneumonia. Several studies have found that inhibitors of ARSs have been used in therapeutic trials for a variety of diseases [51,52,53]. In this study, MARS1 and GARS1 were found to be significantly downregulated on the NA treatment, suggesting that NA modulates inflammation and other intracellular pathways via tRNA synthase, thereby improving liver metabolism.
In the present study, we also found that the major differential pathways between NA and NAM focused on the processes of steroid catabolism, steroid hydroxylase, monooxygenase activity, oxidoreductase activity, hemoglobin binding, and ferric iron binding, mostly lipid anabolism and redox processes, suggesting that NA was more effective than NAM in regulating these metabolic processes. Due to the fact that NA has its own specific receptor, GPR109A, it directly or indirectly increases hepatic lipid oxidation and reduces the ab initio synthesis of fatty acids, and also non-competitively inhibits the activity of key rate-limiting triglyceride enzymes in the liver to alleviate hepatic lipid deposition. NAM acts more indirectly as a precursor of NAD and NADP, which in turn increases the hepatic expression of the SIRTI, SIRT2, SIRT3, and SIRT6 genes through activation of the NAD-sirtuin pathway. NAM is more efficient than NA under the same conditions [54], maintains the levels of reduced glutathione and thioredoxin in the antioxidant system, and is involved in processes such as cellular energy metabolism [45].

5. Conclusions

In this study, we investigated the effects of RPN and RPM on the liver transcriptome of periparturient dairy cows, identified 1210 DEGs and 33 different KEGG pathways, and 10 significantly differential genes were validated in LO2 cells. Although both NA and NAM can reduce hepatic lipid deposition, they have different mechanisms of trophic action. Compared with the niacinamide group, the NA group could upregulate the expression levels of FADS2, SLC27A6, ARHGAP24, and THRSP, and downregulate the inflammatory oxidative stress-related genes S100A1, 2 MARS1, GARS1, etc. The addition of NA acid may affect glucose and insulin levels and thus the expression of some genes; in addition, NAM can upregulate the expression levels of BCO2 and OSBP11. In summary, compared with RPM, RPN generally directly regulated fatty acid anabolism and transport, inflammatory factor expression and oxidative stress processes, and played a prominent role in liver metabolism. Whereas, RPM acted more as a precursor of NAD and NADP to indirectly participate in biological processes such as ether lipid metabolism, cholesterol metabolism, energy metabolism, and other processes.
In addition, the cell results showed an optimum addition dosage of NAM at a higher level than NA (NAM:NA = 2:1), which means that the cost of adding NAM to dairy cow diets may be higher, but if cost is ignored, NAM is better and more directly effective. Perhaps in the future we will combine the two nutrients to achieve a ratio that is both cost effective and the most beneficial to the nutritional health of the animal.

Supplementary Materials

The following supporting information can be downloaded at: https://www.mdpi.com/article/10.3390/metabo14030150/s1, Supplementary Figure S1: Venn analysis between RPN and RPM group; Supplementary Table S1: Statistics for quality control of sequencing data; Supplementary Table S2: Differential gene statistics of up and down regulation.

Author Contributions

Conceptualization, Y.C., C.C. and J.Y.; methodology, Z.C., X.J. and Y.Z.; software, Y.Z.; formal analysis, Y.Z.; resources, Y.Z.; data curation, Y.Z.; writing—original draft preparation, Y.Z. and R.L.; writing—review and editing, Y.Z., R.L., X.D., L.W., Y.C., C.C., J.Y. and S.L.; supervision, Y.C., C.C., J.W., S.L. and J.Y.; project administration, Y.C.; funding acquisition, Y.C. All authors have read and agreed to the published version of the manuscript.

Funding

This research was funded by the Shaanxi Provincial Science Fund for Distinguished Young Scholars (2024-JC-JCQN-25), National Natural Science Foundation of China (31972592) and the Ningxia Key Project of Research and Development Plan (2023BFC01036).

Institutional Review Board Statement

In this study, all animal procedures were approved by the Institutional Animal Care and Use Committee of Northwest A&F University (Yangling, Shaanxi, China). The protocol of this study was specifically approved with the approval number DK202201 and the approval date of 28 February 2022.

Informed Consent Statement

Not applicable.

Data Availability Statement

All data relevant to the study are included in the article or uploaded as supplementary information.

Conflicts of Interest

The authors declare no conflict of interest.

References

  1. Ishikawa, S.; Ikuta, K.; Obara, Y.; Oka, A.; Otani, Y.; Takahashi, Y.; Bai, H.; Terada, F.; Kushibiki, S. Cluster Analysis to Evaluate Disease Risk in Periparturient Dairy Cattle. Anim. Sci. J. 2020, 91, e13442. [Google Scholar] [CrossRef]
  2. Tsuchiya, Y.; Chiba, E.; Sugino, T.; Kawashima, K.; Kushibiki, S.; Kizaki, K.; Kim, Y.-H.; Sato, S. Liver Transcriptome Response to Periparturient Hormonal and Metabolic Changes Depends on the Postpartum Occurrence of Subacute Ruminal Acidosis in Holstein Cows. Physiol. Genom. 2021, 53, 285–294. [Google Scholar] [CrossRef]
  3. Mellouk, N.; Rame, C.; Naquin, D.; Jaszczyszyn, Y.; Touzé, J.-L.; Briant, E.; Guillaume, D.; Ntallaris, T.; Humblot, P.; Dupont, J. Impact of the Severity of Negative Energy Balance on Gene Expression in the Subcutaneous Adipose Tissue of Periparturient Primiparous Holstein Dairy Cows: Identification of Potential Novel Metabolic Signals for the Reproductive System. PLoS ONE 2019, 14, e0222954. [Google Scholar] [CrossRef]
  4. Wu, Z.-L.; Chen, S.-Y.; Hu, S.; Jia, X.; Wang, J.; Lai, S.-J. Metabolomic and Proteomic Profiles Associated with Ketosis in Dairy Cows. Front. Genet. 2020, 11, 551587. [Google Scholar] [CrossRef]
  5. Luo, Z.; Yong, K.; Du, Z.; Huang, Y.; Zhou, T.; Ma, L.; Yao, X.; Shen, L.; Yu, S.; Yan, Z.; et al. Association between Tryptophan Metabolism and Inflammatory Biomarkers in Dairy Cows with Ketosis. Metabolites 2023, 13, 333. [Google Scholar] [CrossRef]
  6. Niacin for Dairy Cattle: A Review|British Journal of Nutrition|Cambridge Core. Available online: https://www.cambridge.org/core/journals/british-journal-of-nutrition/article/niacin-for-dairy-cattle-a-review/CBDD2F19CE0BF0E5F9A1036CE028E4EB (accessed on 25 July 2023).
  7. Morey, S.D.; Mamedova, L.K.; Anderson, D.E.; Armendariz, C.K.; Titgemeyer, E.C.; Bradford, B.J. Effects of Encapsulated Niacin on Metabolism and Production of Periparturient Dairy Cows. J. Dairy Sci. 2011, 94, 5090–5104. [Google Scholar] [CrossRef]
  8. Chen, J.; Yang, Z.; Dong, G. Niacin Nutrition and Rumen-Protected Niacin Supplementation in Dairy Cows: An Updated Review. Br. J. Nutr. 2019, 122, 1103–1112. [Google Scholar] [CrossRef]
  9. Ye, L.; Cao, Z.; Lai, X.; Wang, W.; Guo, Z.; Yan, L.; Wang, Y.; Shi, Y.; Zhou, N. Niacin Fine-Tunes Energy Homeostasis through Canonical GPR109A Signaling. FASEB J. 2019, 33, 4765–4779. [Google Scholar] [CrossRef] [PubMed]
  10. Dhuguru, J.; Dellinger, R.W.; Migaud, M.E. Defining NAD(P)(H) Catabolism. Nutrients 2023, 15, 3064. [Google Scholar] [CrossRef] [PubMed]
  11. Zhang, W.; Patil, S.; Chauhan, B.; Guo, S.; Powell, D.R.; Le, J.; Klotsas, A.; Matika, R.; Xiao, X.; Franks, R.; et al. FoxO1 Regulates Multiple Metabolic Pathways in the Liver: Effects on Gluconeogenic, Glycolytic, and Lipogenic Gene Expression. J. Biol. Chem. 2006, 281, 10105–10117. [Google Scholar] [CrossRef] [PubMed]
  12. Lukasova, M.; Hanson, J.; Tunaru, S.; Offermanns, S. Nicotinic Acid (Niacin): New Lipid-Independent Mechanisms of Action and Therapeutic Potentials. Trends Pharmacol. Sci. 2011, 32, 700–707. [Google Scholar] [CrossRef]
  13. Kinoshita, A.; Kenéz, Á.; Locher, L.; Meyer, U.; Dänicke, S.; Rehage, J.; Huber, K. Insulin Signaling in Liver and Adipose Tissues in Periparturient Dairy Cows Supplemented with Dietary Nicotinic Acid. PLoS ONE 2016, 11, e0147028. [Google Scholar] [CrossRef]
  14. Wei, X.; Yin, Q.; Zhao, H.; He, J.; Cao, Y.; Yao, J. Nicotinamide Supplementation during Postpartum and Peripartum Modulates Hepatic Energy and Lipid Metabolism, Oxidative Status, and Metabolomics Profile, as Well as Lipids in the Adipose Tissue of Goats. Anim. Feed Sci. Technol. 2021, 274, 114849. [Google Scholar] [CrossRef]
  15. Luo, C.; Yang, C.; Wang, X.; Chen, Y.; Liu, X.; Deng, H. Nicotinamide Reprograms Adipose Cellular Metabolism and Increases Mitochondrial Biogenesis to Ameliorate Obesity. J. Nutr. Biochem. 2022, 107, 109056. [Google Scholar] [CrossRef]
  16. Jaster, E.H.; Ward, N.E. Supplemental Nicotinic Acid or Nicotinamide for Lactating Dairy Cows. J. Dairy Sci. 1990, 73, 2880–2887. [Google Scholar] [CrossRef] [PubMed]
  17. Aragona, K.M.; Rice, E.M.; Engstrom, M.; Erickson, P.S. Supplementation of Nicotinic Acid to Prepartum Holstein Cows Increases Colostral Immunoglobulin G, Excretion of Urinary Purine Derivatives, and Feed Efficiency in Calves. J. Dairy Sci. 2020, 103, 2287–2302. [Google Scholar] [CrossRef] [PubMed]
  18. Petrović, K.; Djoković, R.; Cincović, M.; Hristovska, T.; Lalović, M.; Petrović, M.; Majkić, M.; Došenović Marinković, M.; Anđušić, L.; Devečerski, G.; et al. Niacin Status Indicators and Their Relationship with Metabolic Parameters in Dairy Cows during Early Lactation. Animals 2022, 12, 1524. [Google Scholar] [CrossRef] [PubMed]
  19. Yuan, K.; Shaver, R.D.; Bertics, S.J.; Espineira, M.; Grummer, R.R. Effect of Rumen-Protected Niacin on Lipid Metabolism, Oxidative Stress, and Performance of Transition Dairy Cows. J. Dairy Sci. 2012, 95, 2673–2679. [Google Scholar] [CrossRef] [PubMed]
  20. Zhou, M.; Li, Y.; Che, H.; Sun, Y.; Wang, S.; Zhan, Y.; Cai, D.; Chen, S. Metabolic Engineering of Bacillus Licheniformis for the Bioproduction of Nicotinamide Riboside from Nicotinamide and Glucose. ACS Sustain. Chem. Eng. 2023, 11, 6201–6210. [Google Scholar] [CrossRef]
  21. Shen, T.; Xu, F.; Fang, Z.; Loor, J.J.; Ouyang, H.; Chen, M.; Jin, B.; Wang, X.; Shi, Z.; Zhu, Y.; et al. Hepatic Autophagy and Mitophagy Status in Dairy Cows with Subclinical and Clinical Ketosis. J. Dairy Sci. 2021, 104, 4847–4857. [Google Scholar] [CrossRef]
  22. Love, M.I.; Huber, W.; Anders, S. Moderated estimation of fold change and dispersion for RNA-seq data with DESeq2. Genome Biol. 2014, 15, 550. [Google Scholar] [CrossRef]
  23. Klopfenstein, D.V.; Zhang, L.; Pedersen, B.S.; Ramírez, F.; Vesztrocy, A.W.; Naldi, A.; Mungall, C.J.; Yunes, J.M.; Botvinnik, O.; Weigel, M.; et al. GOATOOLS: A Python library for Gene Ontology analyses. Sci. Rep. 2018, 8, 10872. [Google Scholar] [CrossRef] [PubMed]
  24. Weigel, N.L.; Moore, N.L. Kinases and Protein Phosphorylation as Regulators of Steroid Hormone Action. Nucl Recept Signal 2007, 5, nrs.05005. [Google Scholar] [CrossRef]
  25. Hayaishi, O. Oxygenases. In Encyclopedia of Biological Chemistry, 2nd ed.; Lennarz, W.J., Lane, M.D., Eds.; Academic Press: Waltham, MA, USA, 2013; pp. 371–374. ISBN 978-0-12-378631-9. [Google Scholar]
  26. Ren, J.; Xu, N.; Zheng, H.; Tian, W.; Li, H.; Li, Z.; Wang, Y.; Tian, Y.; Kang, X.; Liu, X. Expression of Thyroid Hormone Responsive SPOT 14 Gene Is Regulated by Estrogen in Chicken (Gallus Gallus). Sci. Rep. 2017, 7, 10243. [Google Scholar] [CrossRef]
  27. Tsatsos, N.G.; Augustin, L.B.; Anderson, G.W.; Towle, H.C.; Mariash, C.N. Hepatic Expression of the SPOT 14 (S14) Paralog S14-Related (Mid1 Interacting Protein) Is Regulated by Dietary Carbohydrate. Endocrinology 2008, 149, 5155–5161. [Google Scholar] [CrossRef]
  28. Zeng, N.; Huang, R.; Li, N.; Jiang, H.; Li, R.; Wang, F.; Chen, W.; Xia, M.; Wang, Q. MiR-451a Attenuates Free Fatty Acids–Mediated Hepatocyte Steatosis by Targeting the Thyroid Hormone Responsive Spot 14 Gene. Mol. Cell. Endocrinol. 2018, 474, 260–271. [Google Scholar] [CrossRef] [PubMed]
  29. Gudas, L.J. Retinoid Metabolism: New Insights. J. Mol. Endocrinol. 2022, 69, T37–T49. [Google Scholar] [CrossRef]
  30. Strychalski, J.; Gugołek, A.; Antoszkiewicz, Z.; Fopp-Bayat, D.; Kaczorek-Łukowska, E.; Snarska, A.; Zwierzchowski, G.; Król-Grzymała, A.; Matusevičius, P. The Effect of the BCO2 Genotype on the Expression of Genes Related to Carotenoid, Retinol, and α-Tocopherol Metabolism in Rabbits Fed a Diet with Aztec Marigold Flower Extract. Int. J. Mol. Sci. 2022, 23, 10552. [Google Scholar] [CrossRef] [PubMed]
  31. Lim, J.Y.; Liu, C.; Hu, K.-Q.; Smith, D.E.; Wang, X.-D. Ablation of Carotenoid Cleavage Enzymes (BCO1 and BCO2) Induced Hepatic Steatosis by Altering the Farnesoid X Receptor/miR-34a/Sirtuin 1 Pathway. Arch. Biochem. Biophys. 2018, 654, 1–9. [Google Scholar] [CrossRef]
  32. Tian, R.; Cullen, N.G.; Morris, C.A.; Fisher, P.J.; Pitchford, W.S.; Bottema, C.D.K. Major Effect of Retinal Short-Chain Dehydrogenase Reductase (RDHE2) on Bovine Fat Colour. Mamm. Genome 2012, 23, 378–386. [Google Scholar] [CrossRef]
  33. Wu, L.; Lu, P.; Guo, X.; Song, K.; Lyu, Y.; Bothwell, J.; Wu, J.; Hawkins, O.; Clarke, S.L.; Lucas, E.A.; et al. β-Carotene Oxygenase 2 Deficiency-Triggered Mitochondrial Oxidative Stress Promotes Low-Grade Inflammation and Metabolic Dysfunction. Free Radic. Biol. Med. 2021, 164, 271–284. [Google Scholar] [CrossRef]
  34. Zachut, M.; Contreras, G.A. Symposium Review: Mechanistic Insights into Adipose Tissue Inflammation and Oxidative Stress in Periparturient Dairy Cows. J. Dairy Sci. 2022, 105, 3670–3686. [Google Scholar] [CrossRef]
  35. Dong, X.; Tan, P.; Cai, Z.; Xu, H.; Li, J.; Ren, W.; Xu, H.; Zuo, R.; Zhou, J.; Mai, K.; et al. Regulation of FADS2 Transcription by SREBP-1 and PPAR-α Influences LC-PUFA Biosynthesis in Fish. Sci. Rep. 2017, 7, 40024. [Google Scholar] [CrossRef]
  36. Young, R.S.E.; Bowman, A.P.; Williams, E.D.; Tousignant, K.D.; Bidgood, C.L.; Narreddula, V.R.; Gupta, R.; Marshall, D.L.; Poad, B.L.J.; Nelson, C.C.; et al. Apocryphal FADS2 Activity Promotes Fatty Acid Diversification in Cancer. Cell Rep. 2021, 34, 108738. [Google Scholar] [CrossRef]
  37. Walle, P.; Männistö, V.; de Mello, V.D.; Vaittinen, M.; Perfilyev, A.; Hanhineva, K.; Ling, C.; Pihlajamäki, J. Liver DNA Methylation of FADS2 Associates with FADS2 Genotypex. Clin. Epigenetics 2019, 11, 10. [Google Scholar] [CrossRef] [PubMed]
  38. Anderson, C.M.; Stahl, A. SLC27 Fatty Acid Transport Proteins. Mol. Asp. Med. 2013, 34, 516–528. [Google Scholar] [CrossRef] [PubMed]
  39. Korbecki, J.; Kojder, K.; Jeżewski, D.; Simińska, D.; Tomasiak, P.; Tarnowski, M.; Chlubek, D.; Baranowska-Bosiacka, I. Reduced Expression of Very-Long-Chain Acyl-CoA Synthetases SLC27A4 and SLC27A6 in the Glioblastoma Tumor Compared to the Peritumoral Area. Brain Sci. 2023, 13, 771. [Google Scholar] [CrossRef] [PubMed]
  40. Stahl, A. A Current Review of Fatty Acid Transport Proteins (SLC27). Pflug. Arch. Eur. J. Physiol. 2004, 447, 722–727. [Google Scholar] [CrossRef] [PubMed]
  41. Fischer, C.; Wilken-Schmitz, A.; Hernandez-Olmos, V.; Proschak, E.; Stark, H.; Fleming, I.; Weigert, A.; Thurn, M.; Hofmann, M.; Werner, E.R.; et al. AGMO Inhibitor Reduces 3T3-L1 Adipogenesis. Cells 2021, 10, 1081. [Google Scholar] [CrossRef] [PubMed]
  42. Sailer, S.; Lackner, K.; Pras-Raves, M.L.; Wever, E.J.M.; van Klinken, J.B.; Dane, A.D.; Geley, S.; Koch, J.; Golderer, G.; Werner-Felmayer, G.; et al. Adaptations of the 3T3-L1 Adipocyte Lipidome to Defective Ether Lipid Catabolism upon Agmo Knockdown. J. Lipid Res. 2022, 63, 100222. [Google Scholar] [CrossRef] [PubMed]
  43. Sailer, S.; Keller, M.A.; Werner, E.R.; Watschinger, K. The Emerging Physiological Role of AGMO 10 Years after Its Gene Identification. Life 2021, 11, 88. [Google Scholar] [CrossRef]
  44. Vormittag, S.; Hüsler, D.; Haneburger, I.; Kroniger, T.; Anand, A.; Prantl, M.; Barisch, C.; Maaß, S.; Becher, D.; Letourneur, F.; et al. Legionella- and Host-Driven Lipid Flux at LCV-ER Membrane Contact Sites Promotes Vacuole Remodeling. EMBO Rep. 2023, 24, e56007. [Google Scholar] [CrossRef] [PubMed]
  45. Du, X.; Cui, Z.; Zhang, R.; Zhao, K.; Wang, L.; Yao, J.; Liu, S.; Cai, C.; Cao, Y. The Effects of Rumen-Protected Choline and Rumen-Protected Nicotinamide on Liver Transcriptomics in Periparturient Dairy Cows. Metabolites 2023, 13, 594. [Google Scholar] [CrossRef] [PubMed]
  46. Liu, H.; Wang, W.; Shen, W.; Wang, L.; Zuo, Y. ARHGAP24 Ameliorates Inflammatory Response through Inactivating Rac1/Akt/NF-κB Pathway in Acute Pneumonia Model of Rat. Ann. Transl. Med. 2020, 8, 1289. [Google Scholar] [CrossRef]
  47. Sreejit, G.; Flynn, M.C.; Patil, M.; Krishnamurthy, P.; Murphy, A.J.; Nagareddy, P.R. Chapter Six—S100 Family Proteins in Inflammation and Beyond. In Advances in Clinical Chemistry; Makowski, G.S., Ed.; Elsevier: Amsterdam, The Netherlands, 2020; Volume 98, pp. 173–231. [Google Scholar]
  48. Nazari, A.; Khorramdelazad, H.; Hassanshahi, G.; Day, A.S.; Sardoo, A.M.; Fard, E.T.; Abedinzadeh, M.; Nadimi, A.E. S100A12 in Renal and Cardiovascular Diseases. Life Sci. 2017, 191, 253–258. [Google Scholar] [CrossRef] [PubMed]
  49. Yang, Z.; Yan, W.X.; Cai, H.; Tedla, N.; Armishaw, C.; Di Girolamo, N.; Wang, H.W.; Hampartzoumian, T.; Simpson, J.L.; Gibson, P.G.; et al. S100A12 Provokes Mast Cell Activation: A Potential Amplification Pathway in Asthma and Innate Immunity. J. Allergy Clin. Immunol. 2007, 119, 106–114. [Google Scholar] [CrossRef]
  50. Carvalho, A.; Lu, J.; Francis, J.D.; Moore, R.E.; Haley, K.P.; Doster, R.S.; Townsend, S.D.; Johnson, J.G.; Damo, S.M.; Gaddy, J.A. S100A12 in Digestive Diseases and Health: A Scoping Review. Gastroenterol. Res. Pract. 2020, 2020, e2868373. [Google Scholar] [CrossRef] [PubMed]
  51. Jang, S.I.; Kwon, N.H.; Lim, B.J.; Nahm, J.H.; Park, J.S.; Kang, C.M.; Park, S.R.; Kang, C.M.; Park, S.R.; Lee, S.Y.; et al. New Staining Method Using Methionyl-tRNA Synthetase 1 Antibody for Brushing Cytology of Bile Duct Cancer. Gastrointest. Endosc. 2020, 92, 310–319. [Google Scholar] [CrossRef]
  52. Nie, J.; Liu, T.; Mao, T.; Yang, H.; Deng, W.; Liu, X.; Fu, B. Transcriptome Sequencing and Single-Cell Sequencing Analysis Identify GARS1 as a Potential Prognostic and Immunotherapeutic Biomarker for Multiple Cancers, Including Bladder Cancer. Front. Immunol. 2023, 14, 1169588. [Google Scholar] [CrossRef]
  53. Oprescu, S.N.; Griffin, L.B.; Beg, A.A.; Antonellis, A. Predicting the Pathogenicity of Aminoacyl-tRNA Synthetase Mutations. Methods 2017, 113, 139–151. [Google Scholar] [CrossRef]
  54. Yang, S.J.; Choi, J.M.; Kim, L.; Park, S.E.; Rhee, E.J.; Lee, W.Y.; Oh, K.W.; Park, S.W.; Park, C.-Y. Nicotinamide Improves Glucose Metabolism and Affects the Hepatic NAD-Sirtuin Pathway in a Rodent Model of Obesity and Type 2 Diabetes. J. Nutr. Biochem. 2014, 25, 66–72. [Google Scholar] [CrossRef] [PubMed]
Figure 1. Volcano plot of DEGs. The corrected p-value is p-adjust. Each dot represents a gene in which red represents significant upregulation of gene expression and blue represents significant downregulation of gene expression. The closer the point is to the two sides and the upper side, the more significant the difference is.
Metabolites 14 00150 g001
Figure 2. Cluster heatmap of DEGs in different samples. Different colors represent the expression value of the gene after standardization in each sample. On the left side is the tree diagram of the gene cluster and the module diagram of the sub cluster. The closer the two gene branches are, the closer their expression amounts are. The upper side in this graph is the tree diagram of the sample cluster. The closer the two samples branch, the closer the expression patterns of all genes in the two samples are. RPN = rumen-protected niacin group; RPM = rumen-protected nicotinamide group.
Metabolites 14 00150 g002
Figure 3. OPLS-DA score plot of different samples. RPN = rumen-protected niacin group; RPM = rumen-protected nicotinamide group.
Metabolites 14 00150 g003
Figure 4. Top 20 GO terms in gene abundance. The ordinate in the graph represents the GO’s secondary classification term, the lower abscissa represents the number of genes/transcripts for that secondary classification on the alignment.
Metabolites 14 00150 g004
Figure 5. Enriched KEGG pathway of DEGs. The rich factor is the ratio of differentially methylated and expressed gene numbers annotated in this pathway term to all gene numbers annotated in this pathway term. The size of the dot represents the number of genes in the path, and the color of the dot corresponds to different p-value ranges.
Metabolites 14 00150 g005
Figure 6. Verification of gene expression in LO2 cells. (A) mRNA expression of S100A12. (B) mRNA expression of FADS2. (C) mRNA expression of SLC27A6. (D) mRNA expression of ARHGAP24. (E) mRNA expression of BCO2. (F) mRNA expression of MARS1. (G) mRNA expression of AGMO. (H) mRNA expression of OSBPL11. (I) mRNA expression of GARS1. (J) mRNA expression of THRSP. ** indicates p < 0.01, *** indicates p < 0.001.
Metabolites 14 00150 g006
Table 1. Ingredient composition of the diets fed during the prepartum and postpartum periods.
PrepartumPostpartum
Ingredients, DM%
Corn silage22.6730.36
Oat hay8.124.55
Straw39.350.00
Alfalfa hay0.0014.43
Flaking corn0.0015.92
Soybean meal0.003.06
Cottonseed meal0.004.54
NaHCO30.000.95
1512 129.860.00
1818 20.0016.10
1979 30.0010.08
4 Chemical composition, DM%
NEL (Mcal/kg)1.301.69
CP10.9717.49
EE3.484.22
Ash8.118.71
NDF52.1036.39
ADF28.3420.53
Starch14.0025.00
Ca0.870.93
p0.560.57
1 A total of 1512 concentrate supplements are available to the TMR per kg (dry matter base): 286.35 mg Fe, 33.64 mg Cu, 205.65 mg Zn, 162.57 mg Mn, 1.06 mg Se, 102 mg Co, 1.83 mg I, 19.27 IU vitamin A, 6.64 IU vitamin D, and 82.14 IU vitamin E. 2 A total of 1818 concentrate supplements are available to the TMR per kg (dry matter base): 349.23 mg Fe, 61.42 mg Cu, 319.01 mg Zn, 278.59 mg Mn, 1.83 mg Se, 201 mg Co, 3.57 mg I, 27.87 IU vitamin A, 9.89 IU vitamin D, and 95.73 IU vitamin E. 3 A total of 1979 concentrate supplements are available to the TMR per kg (dry material base): 141.04 mg Fe, 67.58 mg Cu, 304.56 mg Zn, 284.77 mg Mn, 1.79 mg Se, 100.6 mg Co, 3.57 mg I, 27.01 IU vitamin A, 9.92 IU vitamin D, and 183.35 IU vitamin E. 4 All values are measured, except for net lactation energy and starch values, which are calculated values.
Table 2. Sequences of primers for PCR.
Target GeneForward (5′-3′)Forward (5′-3′)
S100A12GCTCAGTGCCCTTCACCACT AGCCTTCAGCGCAATGGCTA
FADS2ACCGTGACTGGTTCAGTAGCCGGGGCGATCTTGTGTAAGT
SLC27A6GAAGAGAAGGACGCTGGTGGAAGTGCAGGACGACCATTCC
ARHGAP24GTATCGCCAATGCAGGATGCCGTGGGCATGGTTTAGCAAG
BCO2GGCTGATGGAACGATCTGGTCCCCACTAAATGCCGAAAGC
MARS1TCCATGCTGACATCTACCGCCAGTGCTCACATCGCAGTTG
AGMOACTACATTCTGGGCCACACCGGGAACTTCTTTGCCGGTGA
OSBPL11ATGAAGCTGGGCTGTTGGAGGTGCTGTCGCTCTTTTGCAT
GARS1TCTCCCCTCGATCTGGACTGTGACCTGGGCTTTTGCTGAA
GAPDHAAGGTCGGAGTGAACGGATTCATTGATGGCGACGATGTCCA
THRSPTGAGGCCCCTGATCTCTACACTTCCTCTGTCTCTGCGGTT
The 2−∆∆Ct method was used to determine the relatively quantitative gene expression levels, normalized by GAPDH.
Table 3. The top 30 DEGs identified in the RPN and RPM treatments.
Gene NameGene DescriptionLog2FC (RPN/RPM)p-Value
THRSPThyroid hormone responsive5.77937.50 × 10−17
CYP26A1Cytochrome P450, family 26, subfamily A, Polypeptide 13.63862.23 × 10−16
MT1EMetallothionein 1E−2.65491.84 × 10−12
ARMH1Armadillo like helical domain containing 1−2.10661.98 × 10−11
CYP2C19Cytochrome P450, family 2, subfamily C, Polypeptide 192.69073.39 × 10−11
SEC14L3SEC14 like lipid binding 34.05991.46 × 10−10
CES1Carboxylesterase 1 (monocyte/macrophage serine esterase 1)1.40393.15 × 10−10
KCNN2Potassium calcium-activated channel Subfamily N member 22.20393.52 × 10−10
S100A12S100 calcium binding protein A12−3.29759.00 × 10−10
ATP6V1C2ATPase H+ transporting V1 subunit C2−3.72039.22 × 10−9
PLXNB1plexin B1−1.54501.12 × 10−8
FADS2Fatty acid desaturase 22.72831.18 × 10−8
SLC27A6Solute carrier family 27 member 61.62321.86 × 10−8
HSD17B6Hydroxysteroid (17-beta) dehydrogenase 61.17922.40 × 10−8
ARHGAP24Rho gtpase activating protein 241.16796.69 × 10−8
MUSTN1Musculoskeletal, embryonic nuclear protein 1−2.24571.30 × 10−7
BCO2Beta-carotene oxygenase 21.22561.45 × 10−7
ANO1Anoctamin 11.38741.72 × 10−7
TRPM2Transient receptor potential cation channel subfamily M member 21.67551.87 × 10−7
NT5DC25’-nucleotidase domain containing 2−1.27622.71 × 10−7
ECDEcdysoneless cell cycle regulator−1.31133.05 × 10−7
MARS1Methionyl-trna synthetase 1−2.09296.92 × 10−7
BACE1Beta-secretase 1−1.34407.30 × 10−7
AGMOAlkylglycerol monooxygenase1.33668.96 × 10−7
ODF2LOuter dense fiber of sperm tails 2 like1.67411.00 × 10−6
OSBPL11Oxysterol binding protein like 112.24861.08 × 10−6
WFS1Wolframin ER transmembrane glycoprotein−1.65811.24 × 10−6
JARID2Jumonji and AT-rich interaction domain containing 21.90521.31 × 10−6
GARS1Glycyl-trna synthetase 1−1.02041.79 × 10−6
SPOCK1SPARC (osteonectin), cwcv and kazal like domains proteoglycan 12.48191.97 × 10−6
RPN = rumen-protected niacin; RPM = rumen-protected nicotinamide.
Table 4. The top 20 enriched GO terms among DEGs.
GO IDCategoryDescriptionp-ValueCounts
GO:0006706BPSteroid catabolic process1.29 × 10−76
GO:0006805BPXenobiotic metabolic process3.08 × 10−711
GO:0008395MFSteroid hydroxylase activity1.43 × 10−710
GO:0004497MFMonooxygenase activity1.80 × 10−715
GO:0020037MFHeme binding2.34 × 10−716
GO:0005506MFIron ion binding3.34 × 10−717
GO:0046906MFTetrapyrrole binding4.29 × 10−716
GO:0016705MFOxidoreductase activity, acting on paired Donors, with incorporation or reduction in molecular oxygen4.77 × 10−718
GO:0008202BPSteroid metabolic process8.64 × 10−713
GO:0120254BPOlefinic compound metabolic process1.16 × 10−610
GO:0016491MFOxidoreductase activity2.03 × 10−636
GO:0044281BPSmall molecule metabolic process4.08 × 10−640
GO:0044237BPCellular metabolic process5.54 × 10−6145
GO:0001523BPRetinoid metabolic process5.76 × 10−67
GO:0016101BPDiterpenoid metabolic process7.35 × 10−67
GO:0070988BPDemethylation8.27 × 10−67
GO:0008152BPMetabolic process1.03 × 10−5157
GO:0046872MFMetal ion binding1.02 × 10−587
GO:0016712MFOxidoreductase activity, acting on paired donors, with incorporation or reduction in Molecular oxygen, reduced flavin or flavoprotein as one donor, and incorporation of one atom of oxygen1.03 × 10−56
GO:0006721BPTerpenoid metabolic process1.77 × 10−57
BP = biological process; CC = cellular component; MF = molecular function.
Table 5. The top 20 enriched KEGG pathways of DEGs.
Pathway IDKEGG Pathwayp-ValueCounts
map00830Retinol metabolism3.12 × 10−911
map00140Steroid hormone biosynthesis2.66 × 10−69
map05204Chemical carcinogenesis-DNA adducts3.54 × 10−57
map05207Chemical carcinogenesis-receptor activation7.76 × 10−512
map00982Drug metabolism-cytochrome P4500.000246
map00980Metabolism of xenobiotics by cytochrome P4500.000396
map00591Linoleic acid metabolism0.000485
map00380Tryptophan metabolism0.000705
map04976Bile secretion0.000837
map00232Caffeine metabolism0.001092
map00120Primary bile acid biosynthesis0.001243
map03010Ribosome0.0016814
map04213Longevity regulating pathway-multiple species0.001945
map05208Chemical carcinogenesis-reactive oxygen species0.0023612
map04913Ovarian steroidogenesis0.003635
map04212Longevity regulating pathway-worm0.004127
map00983Drug metabolism-other enzymes0.005875
map01040Biosynthesis of unsaturated fatty acids0.009323
map04923Regulation of lipolysis in adipocytes0.009644
map04978Mineral absorption0.011555
Disclaimer/Publisher’s Note: The statements, opinions and data contained in all publications are solely those of the individual author(s) and contributor(s) and not of MDPI and/or the editor(s). MDPI and/or the editor(s) disclaim responsibility for any injury to people or property resulting from any ideas, methods, instructions or products referred to in the content.

