
Baseline Serum Biomarkers Predict Response to a Weight Loss Intervention in Older Adults with Obesity: A Pilot Study
 , , , ,
Abstract
:1. Introduction
2. Methods
2.1. Study Design
2.2. Metabolomics Sample Preparation
2.3. UHPLC-HRMS Data Acquisition
2.4. Metabolomics Data Preprocessing
2.5. Compound Identification and Annotation
2.6. Statistical Analysis
2.7. Pathway Analysis
3. Results
4. Discussion
Supplementary Materials
Author Contributions
Funding
Institutional Review Board Statement
Informed Consent Statement
Data Availability Statement
Acknowledgments
Conflicts of Interest
References
- McKee, A.M.; Morley, J.E. Obesity in the Elderly. In Endotext; Feingold, K.R., Anawalt, B., Blackman, M.R., Boyce, A., Chrousos, G., Corpas, E., de Herder, W.W., Dhatariya, K., Dungan, K., Hofland, J., et al., Eds.; MDText.com, Inc. Copyright © 2000–2023, MDText.com, Inc.: South Dartmouth, MA, USA, 2000. [Google Scholar]
- Batsis, J.A.; Petersen, C.L.; Clark, M.M.; Cook, S.B.; Kotz, D.; Gooding, T.L.; Roderka, M.N.; Al-Nimr, R.I.; Pidgeon, D.; Haedrich, A.; et al. Feasibility and acceptability of a technology-based, rural weight management intervention in older adults with obesity. BMC Geriatr. 2021, 21, 44. [Google Scholar] [CrossRef]
- Orces, C.H.; Montalvan, M.; Tettamanti, D. Prevalence of abdominal obesity and its association with cardio metabolic risk factors among older adults in Ecuador. Diabetes Metab. Syndr. 2017, 11 (Suppl. 2), S727–S733. [Google Scholar] [CrossRef]
- Kachur, S.; Lavie, C.J.; de Schutter, A.; Milani, R.V.; Ventura, H.O. Obesity and cardiovascular diseases. Minerva Med. 2017, 108, 212–228. [Google Scholar] [CrossRef]
- Batsis, J.A.; Villareal, D.T. Sarcopenic obesity in older adults: Aetiology, epidemiology and treatment strategies. Nat. Rev. Endocrinol. 2018, 14, 513–537. [Google Scholar] [CrossRef]
- Bruci, A.; Tuccinardi, D.; Tozzi, R.; Balena, A.; Santucci, S.; Frontani, R.; Mariani, S.; Basciani, S.; Spera, G.; Gnessi, L.; et al. Very Low-Calorie Ketogenic Diet: A Safe and Effective Tool for Weight Loss in Patients with Obesity and Mild Kidney Failure. Nutrients 2020, 12, 333. [Google Scholar] [CrossRef] [PubMed] [Green Version]
- Gordon-Larsen, P. Heterogeneity in Obesity: More Research Needed to Improve Precision Weight Loss Treatment. Obesity 2018, 26, 1868. [Google Scholar] [CrossRef] [PubMed] [Green Version]
- Gordon-Larsen, P.; Heymsfield, S.B. Obesity as a Disease, Not a Behavior. Circulation 2018, 137, 1543–1545. [Google Scholar] [CrossRef] [PubMed]
- Sacoto, D.; Hurtado, M.D.; Acosta, A. Precision Medicine and Obesity. Springer International Publishing: Berlin/Heidelberg, Germany, 2022; pp. 467–485. [Google Scholar]
- König, I.R.; Fuchs, O.; Hansen, G.; Von Mutius, E.; Kopp, M.V. What is precision medicine? Eur. Respir. J. 2017, 50, 1700391. [Google Scholar] [CrossRef] [Green Version]
- Beil, M.; Flaatten, H.; Guidet, B.; Sviri, S.; Jung, C.; De Lange, D.; Leaver, S.; Fjølner, J.; Szczeklik, W.; Van Heerden, P.V. The management of multi-morbidity in elderly patients: Ready yet for precision medicine in intensive care? Crit. Care 2021, 25, 330. [Google Scholar] [CrossRef]
- Hurtado, A.M.; Acosta, A. Precision Medicine and Obesity. Gastroenterol. Clin. N. Am. 2021, 50, 127–139. [Google Scholar] [CrossRef]
- Lynch, D.H.; Spangler, H.B.; Franz, J.R.; Krupenevich, R.L.; Kim, H.; Nissman, D.; Zhang, J.; Li, Y.-Y.; Sumner, S.; Batsis, J.A. Multimodal Diagnostic Approaches to Advance Precision Medicine in Sarcopenia and Frailty. Nutrients 2022, 14, 1384. [Google Scholar] [CrossRef]
- Schrimpe-Rutledge, A.C.; Codreanu, S.G.; Sherrod, S.D.; McLean, J.A. Untargeted Metabolomics Strategies—Challenges and Emerging Directions. J. Am. Soc. Mass Spectrom. 2016, 27, 1897–1905. [Google Scholar] [CrossRef] [Green Version]
- Khoramipour, K.; Sandbakk, Ø.; Keshteli, A.H.; Gaeini, A.A.; Wishart, D.S.; Chamari, K. Metabolomics in Exercise and Sports: A Systematic Review. Sports Med. 2022, 52, 547–583. [Google Scholar] [CrossRef] [PubMed]
- Wang, R.; Li, B.; Lam, S.M.; Shui, G. Integration of lipidomics and metabolomics for in-depth understanding of cellular mechanism and disease progression. J. Genet. Genom. 2020, 47, 69–83. [Google Scholar] [CrossRef] [PubMed]
- Wood, B.S.; Lynch, D.H.; Spangler, H.B.; Roderka, M.; Petersen, C.L.; Batsis, J.A. Long-term weight change after a technology-based weight loss intervention. J. Am. Geriatr. Soc. 2022, 71, 981–985. [Google Scholar] [CrossRef] [PubMed]
- Välikangas, T.; Suomi, T.; Elo, L.L. A systematic evaluation of normalization methods in quantitative label-free proteomics. Brief. Bioinform. 2018, 19, 1–11. [Google Scholar] [CrossRef] [PubMed]
- Eriksson, L.; Byrne, T.; Johansson, E.; Trygg, J.; Vikström, C. Multi- and Megavariate Data Analysis Basic Principles and Applications; Umetrics Academy: Umeå, Sweden, 2013. [Google Scholar]
- Chan, E.C.Y.; Pasikanti, K.K.; Nicholson, J.K. Global urinary metabolic profiling procedures using gas chromatography–mass spectrometry. Nature Protocols 2011, 6, 1483–1499. [Google Scholar] [CrossRef]
- Rothman, K.J. No adjustments are needed for multiple comparisons. Epidemiology 1990, 1, 43–46. [Google Scholar] [CrossRef] [Green Version]
- Xi, B.; Gu, H.; Baniasadi, H.; Raftery, D. Statistical Analysis and Modeling of Mass Spectrometry-Based Metabolomics Data; Springer: New York, NY, USA, 2014; pp. 333–353. [Google Scholar]
- Pang, Z.; Chong, J.; Zhou, G.; de Lima Morais, D.A.; Chang, L.; Barrette, M.; Gauthier, C.; Jacques, P.; Li, S.; Xia, J. MetaboAnalyst 5.0: Narrowing the gap between raw spectra and functional insights. Nucleic Acids Res. 2021, 49, W388–W396. [Google Scholar] [CrossRef]
- Li, S.; Park, Y.; Duraisingham, S.; Strobel, F.H.; Khan, N.; Soltow, Q.A.; Jones, D.P.; Pulendran, B. Predicting Network Activity from High Throughput Metabolomics. PLoS Comput. Biol. 2013, 9, e1003123. [Google Scholar] [CrossRef] [Green Version]
- Amorello, D.; Indelicato, R.; Barreca, S.; Orecchio, S.; Orecchio, S. Analytical Method for Quantification of Several Phthalate Acid Esters by Gas Chromatography-Mass Spectrometry in Coffee Brew Samples. ChemistryOpen 2022, 11, e202200082. [Google Scholar] [CrossRef] [PubMed]
- Tabrizi, R.; Saneei, P.; Lankarani, K.B.; Akbari, M.; Kolahdooz, F.; Esmaillzadeh, A.; Nadi-Ravandi, S.; Mazoochi, M.; Asemi, Z. The effects of caffeine intake on weight loss: A systematic review and dos-response meta-analysis of randomized controlled trials. Crit. Rev. Food Sci. Nutr. 2019, 59, 2688–2696. [Google Scholar] [CrossRef]
- Acheson, K.J.; Gremaud, G.; Meirim, I.; Montigon, F.; Krebs, Y.; Fay, L.B.; Gay, L.J.; Schneiter, P.; Schindler, C.; Tappy, L. Metabolic effects of caffeine in humans: Lipid oxidation or futile cycling? Am. J. Clin. Nutr. 2004, 79, 40–46. [Google Scholar] [CrossRef] [PubMed] [Green Version]
- Costill, D.L.; Dalsky, G.P.; Fink, W.J. Effects of caffeine ingestion on metabolism and exercise performance. Med. Sci. Sports 1978, 10, 155–158. [Google Scholar] [PubMed]
- Van Schaik, L.; Kettle, C.; Green, R.; Wundersitz, D.; Gordon, B.; Irving, H.R.; Rathner, J.A. Both caffeine and Capsicum annuum fruit powder lower blood glucose levels and increase brown adipose tissue temperature in healthy adult males. Front. Physiol. 2022, 13, 870154. [Google Scholar] [CrossRef] [PubMed]
- Yang, A.; Palmer, A.A.; De Wit, H. Genetics of caffeine consumption and responses to caffeine. Psychopharmacology 2010, 211, 245–257. [Google Scholar] [CrossRef] [Green Version]
- Acheson, K.J.; Zahorska-Markiewicz, B.; Pittet, P.; Anantharaman, K.; Jéquier, E. Caffeine and coffee: Their influence on metabolic rate and substrate utilization in normal weight and obese individuals. Am. J. Clin. Nutr. 1980, 33, 989–997. [Google Scholar] [CrossRef] [Green Version]
- Goldstein, E.R.; Ziegenfuss, T.; Kalman, D.; Kreider, R.; Campbell, B.; Wilborn, C.; Taylor, L.; Willoughby, D.; Stout, J.; Graves, B.S.; et al. International society of sports nutrition position stand: Caffeine and performance. J. Int. Soc. Sports Nutr. 2010, 7, 5. [Google Scholar] [CrossRef] [Green Version]
- Fujita, T.; Hada, T.; Higashino, K. Origin of D- and L-pipecolic acid in human physiological fluids: A study of the catabolic mechanism to pipecolic acid using the lysine loading test. Clin. Chim. Acta 1999, 287, 145–156. [Google Scholar] [CrossRef]
- Rechner, A.R.; Spencer, J.P.; Kuhnle, G.; Hahn, U.; Rice-Evans, C.A. Novel biomarkers of the metabolism of caffeic acid derivatives in vivo. Free Radic. Biol. Med. 2001, 30, 1213–1222. [Google Scholar] [CrossRef]
- Desmarchelier, A.; Hamel, J.; Delatour, T. Sources of overestimation in the analysis of acrylamide-in coffee by liquid chromatography mass spectrometry. J. Chromatogr. A 2020, 1610, 460566. [Google Scholar] [CrossRef] [PubMed]


| Subject Characteristic at Baseline | Weight Loss Non-Responder (n = 20) * | Weight Loss Responder (n = 22) * | p-Value ** |
|---|---|---|---|
| Weight Change (kg) from Baseline | −2.0 (2.0) | −7.2 (2.5) | 4.2 × 10⁻⁹ |
| % Weight Change from Baseline | −2.1 (2.2) | −7.3 (2.2) | 4.1 × 10⁻⁹ |
| Baseline Subject Characteristics | |||
| Age (years) | 73.9 (3.9) | 72.5 (3.9) | 0.3 |
| Married (Yes) | 13 (65.0%) | 14 (64.6%) | 0.9 |
| Female | 16 (80.0%) | 14 (63.6%) | 0.2 |
| BMI (kg/m2) | 36.7 (4.5) | 36.3 (6.06) | 0.8 |
| Education: High School, No College | 4 (20.0%) | 3 (13.6%) | 0.7 |
| Income Less than $25,000/year | 4 (20.0%) | 3 (13.6%) | 0.7 |
| Waist-Hip Ratio | 0.93 (0.1) | 0.93 (0.1) | 0.9 |
| Gait Speed (s) | 1.05 (0.2) | 1.06 (0.2) | 0.8 |
| Grip Strength (kg) | 24.3 (7.62) | 25.7 (11.9) | 0.6 |
| 30-Second Sit-to-Stand (repetitions) | 12.7 (3.63) | 14.5 (7.19) | 0.3 |
| Six-Minute Walk (m) | 372.0 (81.3) | 403.6 (108.9) | 0.3 |
| Depression (Yes) | 6 (30.0%) | 6 (27.3%) | 0.8 |
| Diabetes (Yes) | 6 (30.0%) | 6 (27.3%) | 0.8 |
| Fibromyalgia (Yes) | 6 (30.0%) | 7 (31.8%) | 0.9 |
| Hypertension (Yes) | 5 (25.0%) | 12 (54.6%) | 0.05 |
| Non-Skin Cancer (Yes) | 15 (75.0%) | 15 (68.2%) | 0.6 |
| Rheumatologic (Yes) | 7 (35.0%) | 11 (50.0%) | 0.3 |
| Stroke (Yes) | 9 (45.0%) | 8 (36.4%) | 0.5 |
| Pathway Number | Pathway Name | p-Value |
|---|---|---|
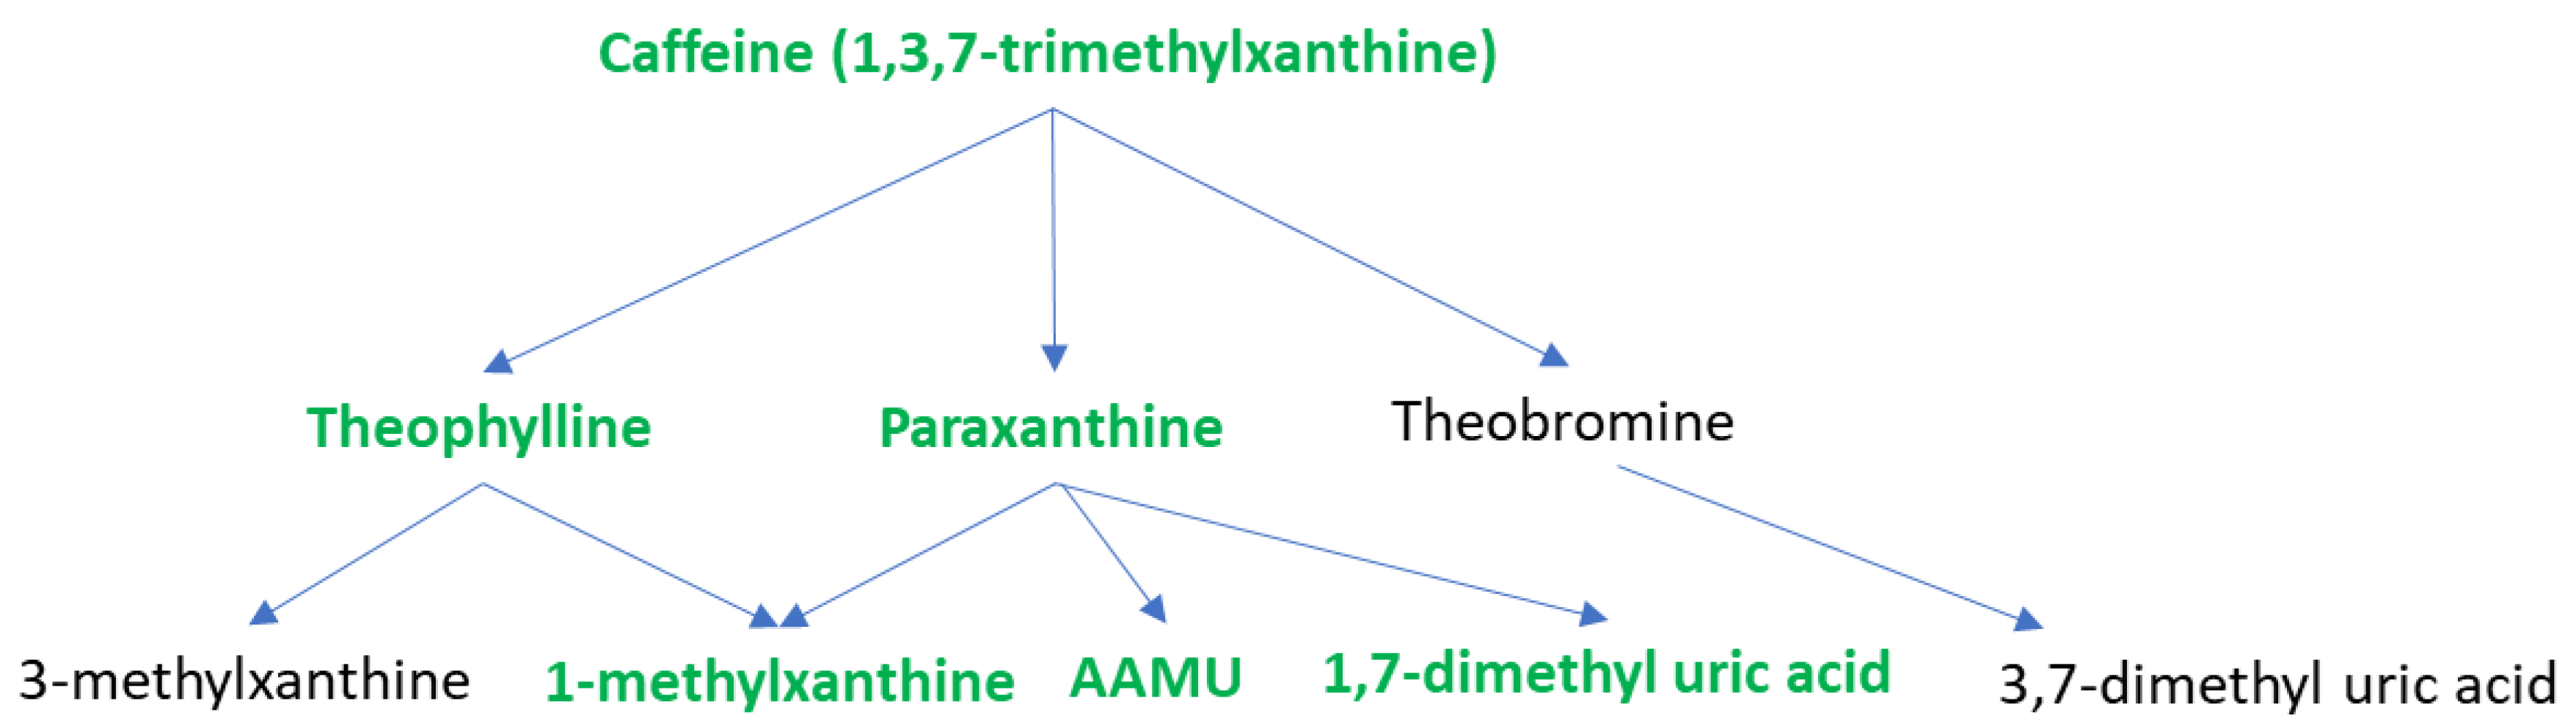
| 1 | Caffeine metabolism | 0.000284 |
| 2 | Valine, leucine, and isoleucine degradation | 0.010064 |
| 3 | Lysine metabolism | 0.013518 |
| 4 | Galactose metabolism | 0.018886 |
| 5 | Starch and Sucrose Metabolism | 0.022688 |
| 6 | Hexose phosphorylation | 0.028288 |
| 7 | Pentose phosphate pathway | 0.039733 |
| 8 | Arginine and Proline Metabolism | 0.056501 |
| 9 | TCA cycle | 0.067128 |
| 10 | Phytanic acid peroxisomal oxidation | 0.067128 |
| 11 | Beta-Alanine metabolism | 0.085587 |
| 12 | Fructose and mannose metabolism | 0.094926 |
| 13 | Glycosphingolipid metabolism | 0.1043 |
| 14 | Leukotriene metabolism | 0.12449 |
| 15 | Keratan sulfate degradation | 0.12534 |
| Caffeine and Its Metabolites | Responder (Mean) | Non-Responder (Mean) | VIP * | p-Value ** | Fold Change *** |
|---|---|---|---|---|---|
| 1,3,7-trimethylxanthine | 336,175.61 | 175,286.29 | 2.0 | 0.033 | 1.9 |
| Theophylline | 16,459.94 | 9,402.76 | 2.0 | 0.024 | 1.8 |
| Paraxanthine | 484,599.90 | 265,153.95 | 2.0 | 0.028 | 1.8 |
| 1-Methylxanthine | 16,403.31 | 7,439.80 | 1.9 | 0.023 | 2.2 |
| 5-Acetylamino-6-amino-3-methyluracil | 29,851.36 | 13,325.84 | 2.2 | 0.025 | 2.2 |
| 1,3-dimethyl uric acid | 1,749.40 | 7,75.29 | 2.1 | 0.023 | 2.3 |
| 1,7-dimethyl uric acid | 9,306.68 | 4,184.77 | 2.0 | 0.035 | 2.2 |
| Compound | Ontology Level | Responder (Mean) | Non-Responder (Mean) | VIP | p-Value | Fold Change | Classification |
|---|---|---|---|---|---|---|---|
| N-Acetyl-Beta-Alanine | OL1 | 30,096 | 22,968 | 1.5 | 0.0448 | 1.3 | Amino acids/peptides |
| L-Ornithine | OL1 | 51,267 | 44,420 | 1.6 | 0.0525 | 1.2 | Amino acids/peptides |
| Dimethylglycine | OL1 | 93,750 | 69,088 | 2.4 | 0.0073 | 1.4 | Amino acids/peptides |
| N6-Acetyl-L-Lysine | OL1 | 20,220 | 22,871 | 1.1 | 0.0873 | −1.1 | Amino acids/peptides |
| Methylcysteine | OL2a | 130 | 184 | 1.4 | 0.0890 | −1.4 | Amino acids/peptides |
| N-Methyl-a-Aminoisobutyric Acid | OL2a | 1,324,135 | 1,191,910 | 1.8 | 0.0640 | 1.1 | Amino acids/peptides |
| Glycyl-Glutamate | OL1 | 49,370 | 36,909 | 1.3 | 0.0868 | 1.3 | Amino acids/peptides |
| Glycyl-Serine | OL2a | 170 | 296 | 1.5 | 0.0587 | −1.7 | Amino acids/peptides |
| Mevalolactone | OL2a | 3,843 | 3,407 | 1.7 | 0.0788 | 1.1 | Carbohydrate |
| Fucose | OL2a | 3,118 | 2,623 | 2.0 | 0.0483 | 1.2 | Carbohydrate |
| Xylose | OL2a | 2,633 | 3,436 | 1.2 | 0.0718 | −1.3 | Carbohydrate |
| Galactitol | OL1 | 745 | 6,671 | 1.2 | 0.0531 | −9.0 | Carbohydrate |
| DL-Glyceraldehyde | OL1 | 428,309 | 516,829 | 1.7 | 0.0448 | −1.2 | Carbohydrate |
| Acetaminophen | OL1 | 311 | 766 | 1.5 | 0.0903 | −2.5 | Drug |
| Monoethyl Phthalate | OL2a | 1,592 | 678 | 1.7 | 0.0273 | 2.3 | Environmentally relevant compound |
| 8-Hydroxyoctanoate | OL2a | 77,724 | 68,981 | 1.8 | 0.0584 | 1.1 | Lipids/Fatty acids |
| Glycerol | OL2a | 79,047 | 68,602 | 1.8 | 0.0677 | 1.2 | Lipids/Fatty acids |
| Octadecanoylcarnitine | OL1 | 19,143 | 23,878 | 1.7 | 0.0263 | −1.2 | Lipids/Fatty acids |
| Glycoursodeoxycholic Acid | OL1 | 63,971 | 25,373 | 1.5 | 0.0448 | 2.5 | Lipids/Fatty acids |
| Dodec-2-Enedioic Acid | OL2a | 7,871 | 6,438 | 1.6 | 0.0703 | 1.2 | Lipids/Fatty acids |
| Palmitoylethanolamide | OL1 | 11,015 | 8,359 | 1.9 | 0.0164 | 1.3 | Lipids/Fatty acids |
| Docosahexaenoate | OL1 | 19,544 | 14,054 | 1.7 | 0.0617 | 1.4 | Lipids/Fatty acids |
| Adenosine | OL1 | 323 | 437 | 1.4 | 0.0235 | −1.4 | Nucleic acids |
| Cytosine | OL1 | 1,123 | 1,542 | 1.0 | 0.0967 | −1.4 | Nucleic acids |
| Pipecolate | OL1 | 126,578 | 42,799 | 1.6 | 0.0246 | 3.0 | Phytochemical/microbiome-related |
| Pipecolinic Acid | OL1 | 717,629 | 582,803 | 2.0 | 0.0451 | 1.2 | Phytochemical/microbiome-related |
| Dihydroferulic Acid | OL1 | 1,206 | 182 | 1.5 | 0.0671 | 6.6 | Phytochemical/microbiome-related |
| 3-(3-Hydroxyphenyl)-3-Hydroxypropanoic Acid | OL1 | 3,256 | 1,675 | 2.0 | 0.0253 | 1.9 | Phytochemical/microbiome-related |
| 3,4-Dimethoxyphenylpropanoic Acid | OL1 | 5,496 | 1,421 | 2.4 | 0.0031 | 3.9 | Phytochemical/microbiome-related |
| 3,5-Dihydroxybenzaldehyde | OL2a | 1,697 | 812 | 1.8 | 0.0588 | 2.1 | Phytochemical/microbiome-related |
| 5-Hydroxypipecolic Acid | OL2a | 664 | 956 | 1.6 | 0.0711 | −1.4 | Phytochemical/microbiome-related |
| 3-Hydroxyhippuric Acid | OL1 | 8,526 | 3,771 | 1.8 | 0.0745 | 2.3 | Phytochemical/microbiome-related |
| 24,25-Dihydroxyvitamin D | OL2a | 1,491 | 1,970 | 1.3 | 0.0833 | −1.3 | Vitamin |
Disclaimer/Publisher’s Note: The statements, opinions and data contained in all publications are solely those of the individual author(s) and contributor(s) and not of MDPI and/or the editor(s). MDPI and/or the editor(s) disclaim responsibility for any injury to people or property resulting from any ideas, methods, instructions or products referred to in the content. |
© 2023 by the authors. Licensee MDPI, Basel, Switzerland. This article is an open access article distributed under the terms and conditions of the Creative Commons Attribution (CC BY) license (https://creativecommons.org/licenses/by/4.0/).
Share and Cite
Lynch, D.H.; Rushing, B.R.; Pathmasiri, W.; McRitchie, S.; Batchek, D.J.; Petersen, C.L.; Gross, D.C.; Sumner, S.C.J.; Batsis, J.A. Baseline Serum Biomarkers Predict Response to a Weight Loss Intervention in Older Adults with Obesity: A Pilot Study. Metabolites 2023, 13, 853. https://doi.org/10.3390/metabo13070853
Lynch DH, Rushing BR, Pathmasiri W, McRitchie S, Batchek DJ, Petersen CL, Gross DC, Sumner SCJ, Batsis JA. Baseline Serum Biomarkers Predict Response to a Weight Loss Intervention in Older Adults with Obesity: A Pilot Study. Metabolites. 2023; 13(7):853. https://doi.org/10.3390/metabo13070853
Chicago/Turabian StyleLynch, David H., Blake R. Rushing, Wimal Pathmasiri, Susan McRitchie, Dakota J. Batchek, Curtis L. Petersen, Danae C. Gross, Susan C. J. Sumner, and John A. Batsis. 2023. "Baseline Serum Biomarkers Predict Response to a Weight Loss Intervention in Older Adults with Obesity: A Pilot Study" Metabolites 13, no. 7: 853. https://doi.org/10.3390/metabo13070853