
Exploring the Potential Performance of Fibroscan for Predicting and Evaluating Metabolic Syndrome using a Feature Selected Strategy of Machine Learning

 ,
,
Abstract
:1. Introduction
2. Materials and Methods
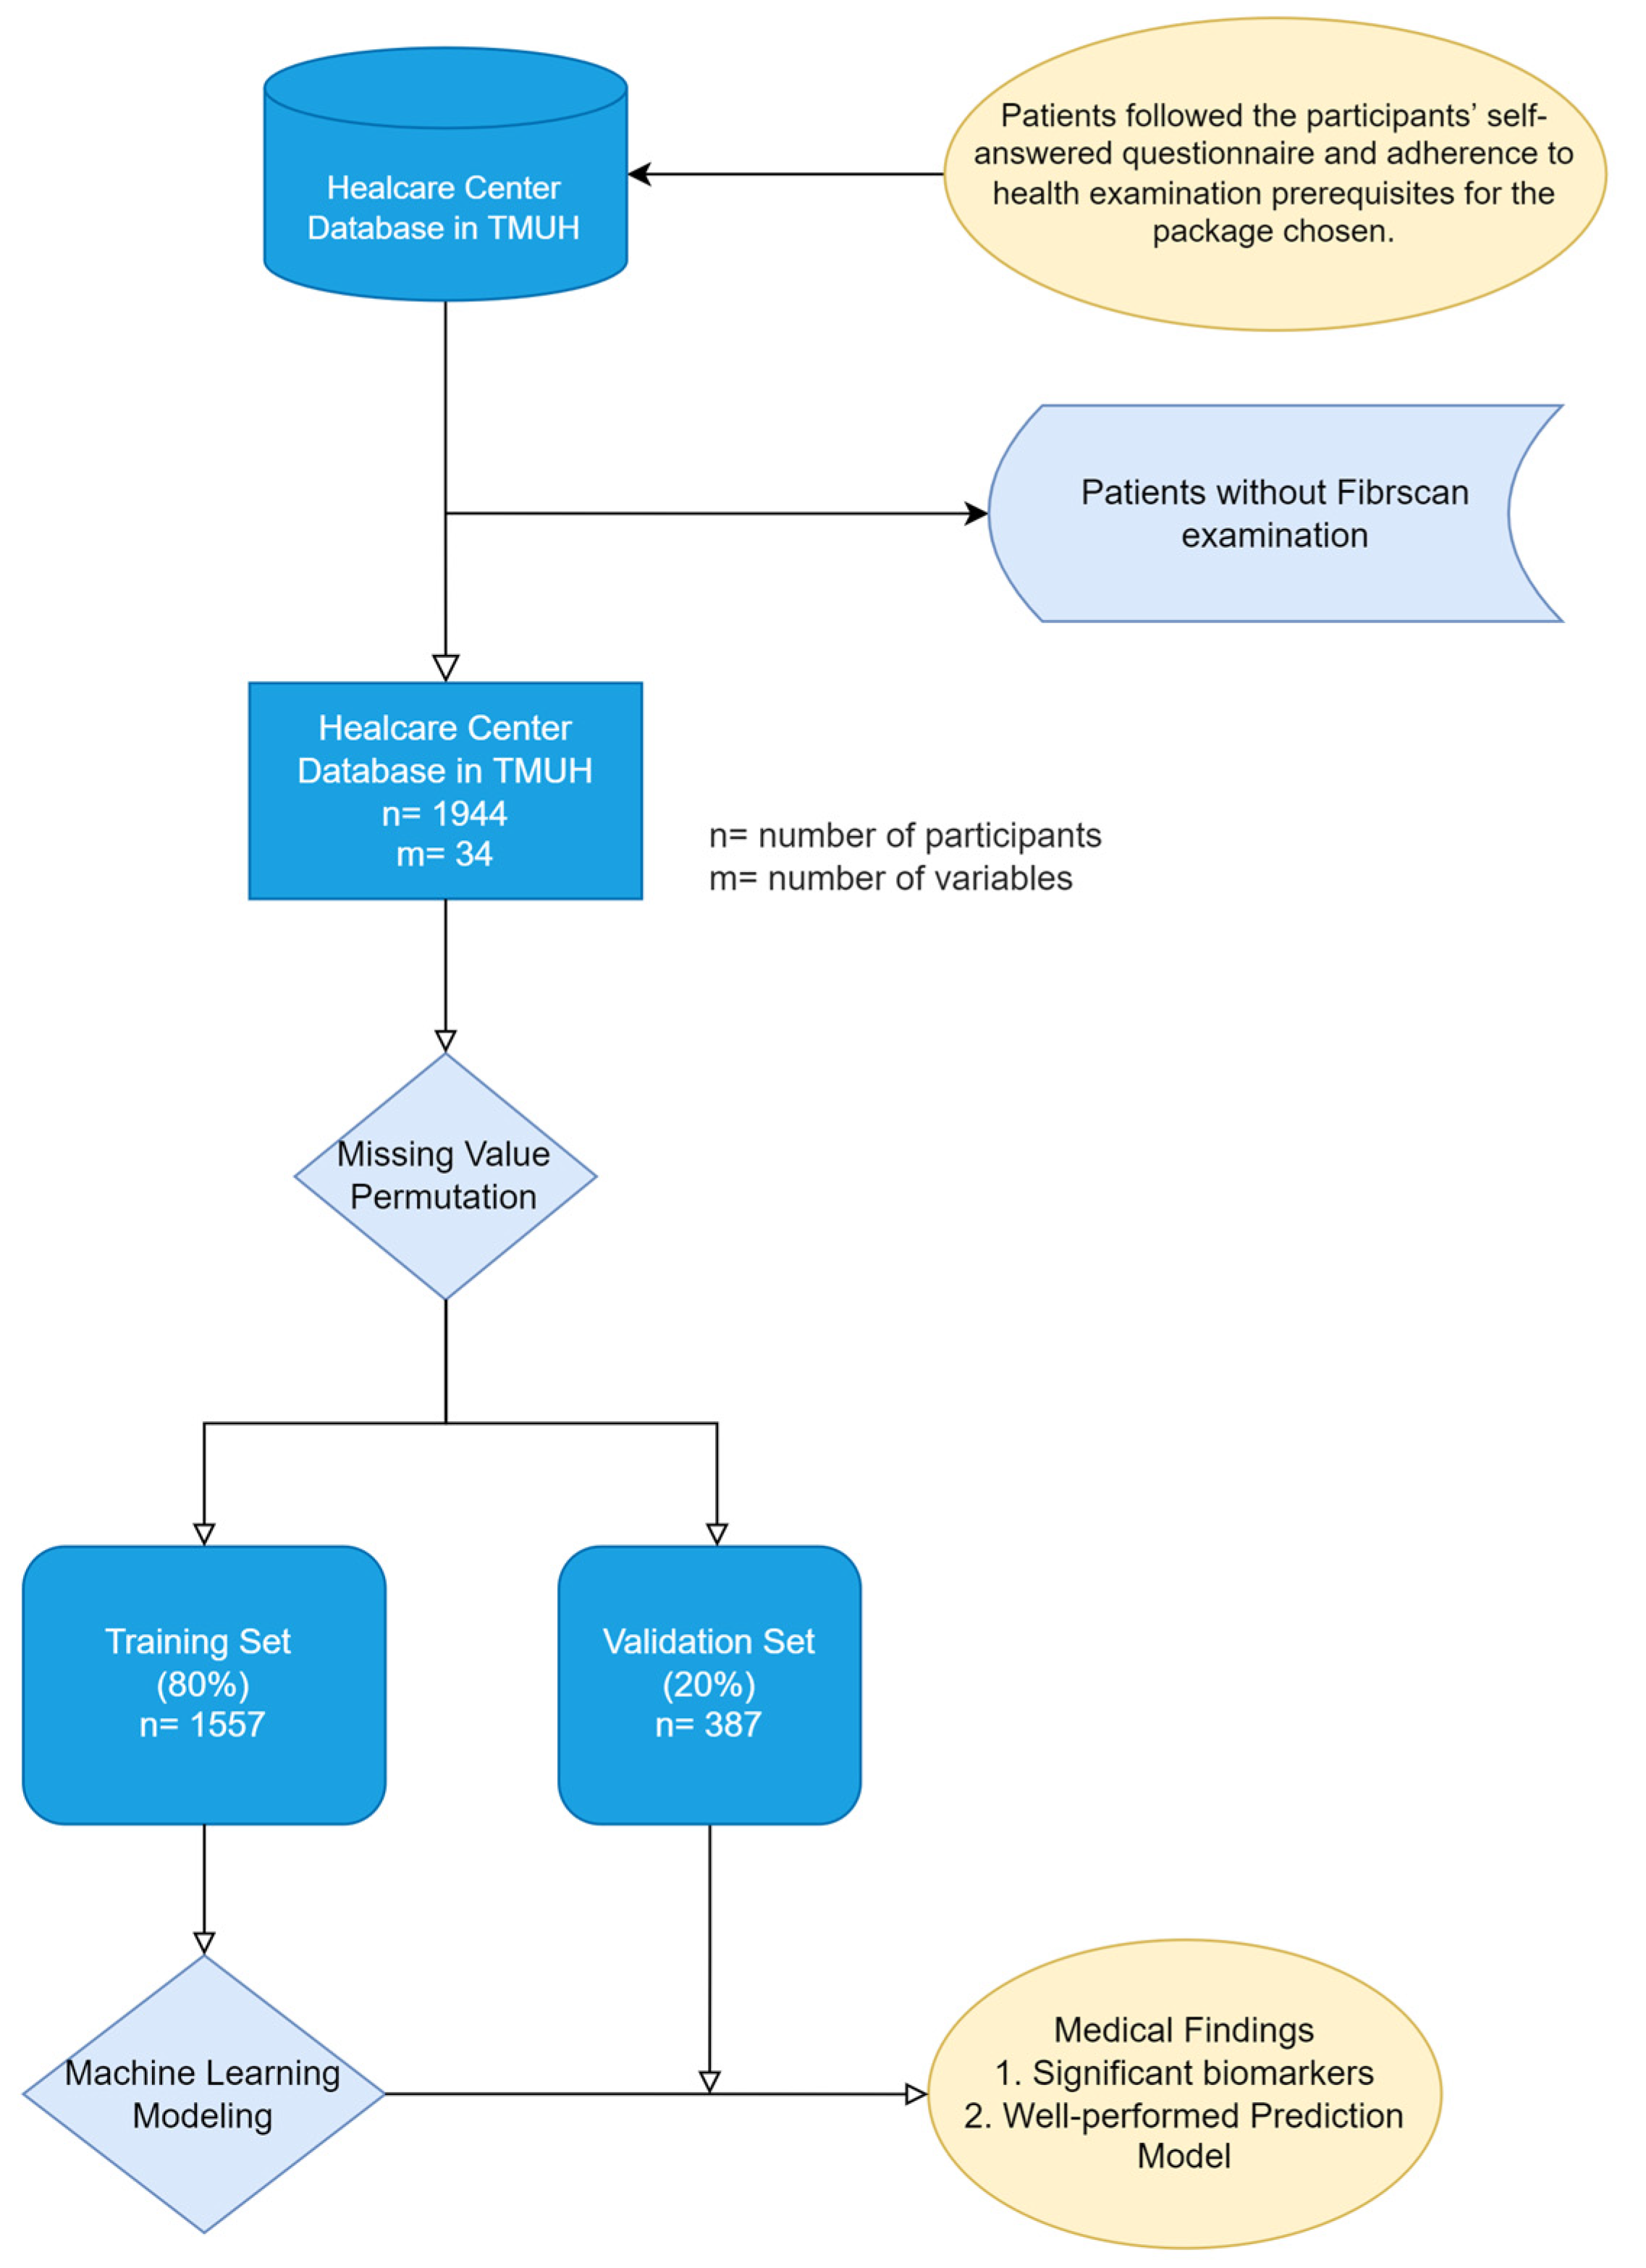
2.1. Study Design and Setting
2.2. Patient and Data Selection Criteria
2.3. Definitions of Measurement Cutoffs and Calculations
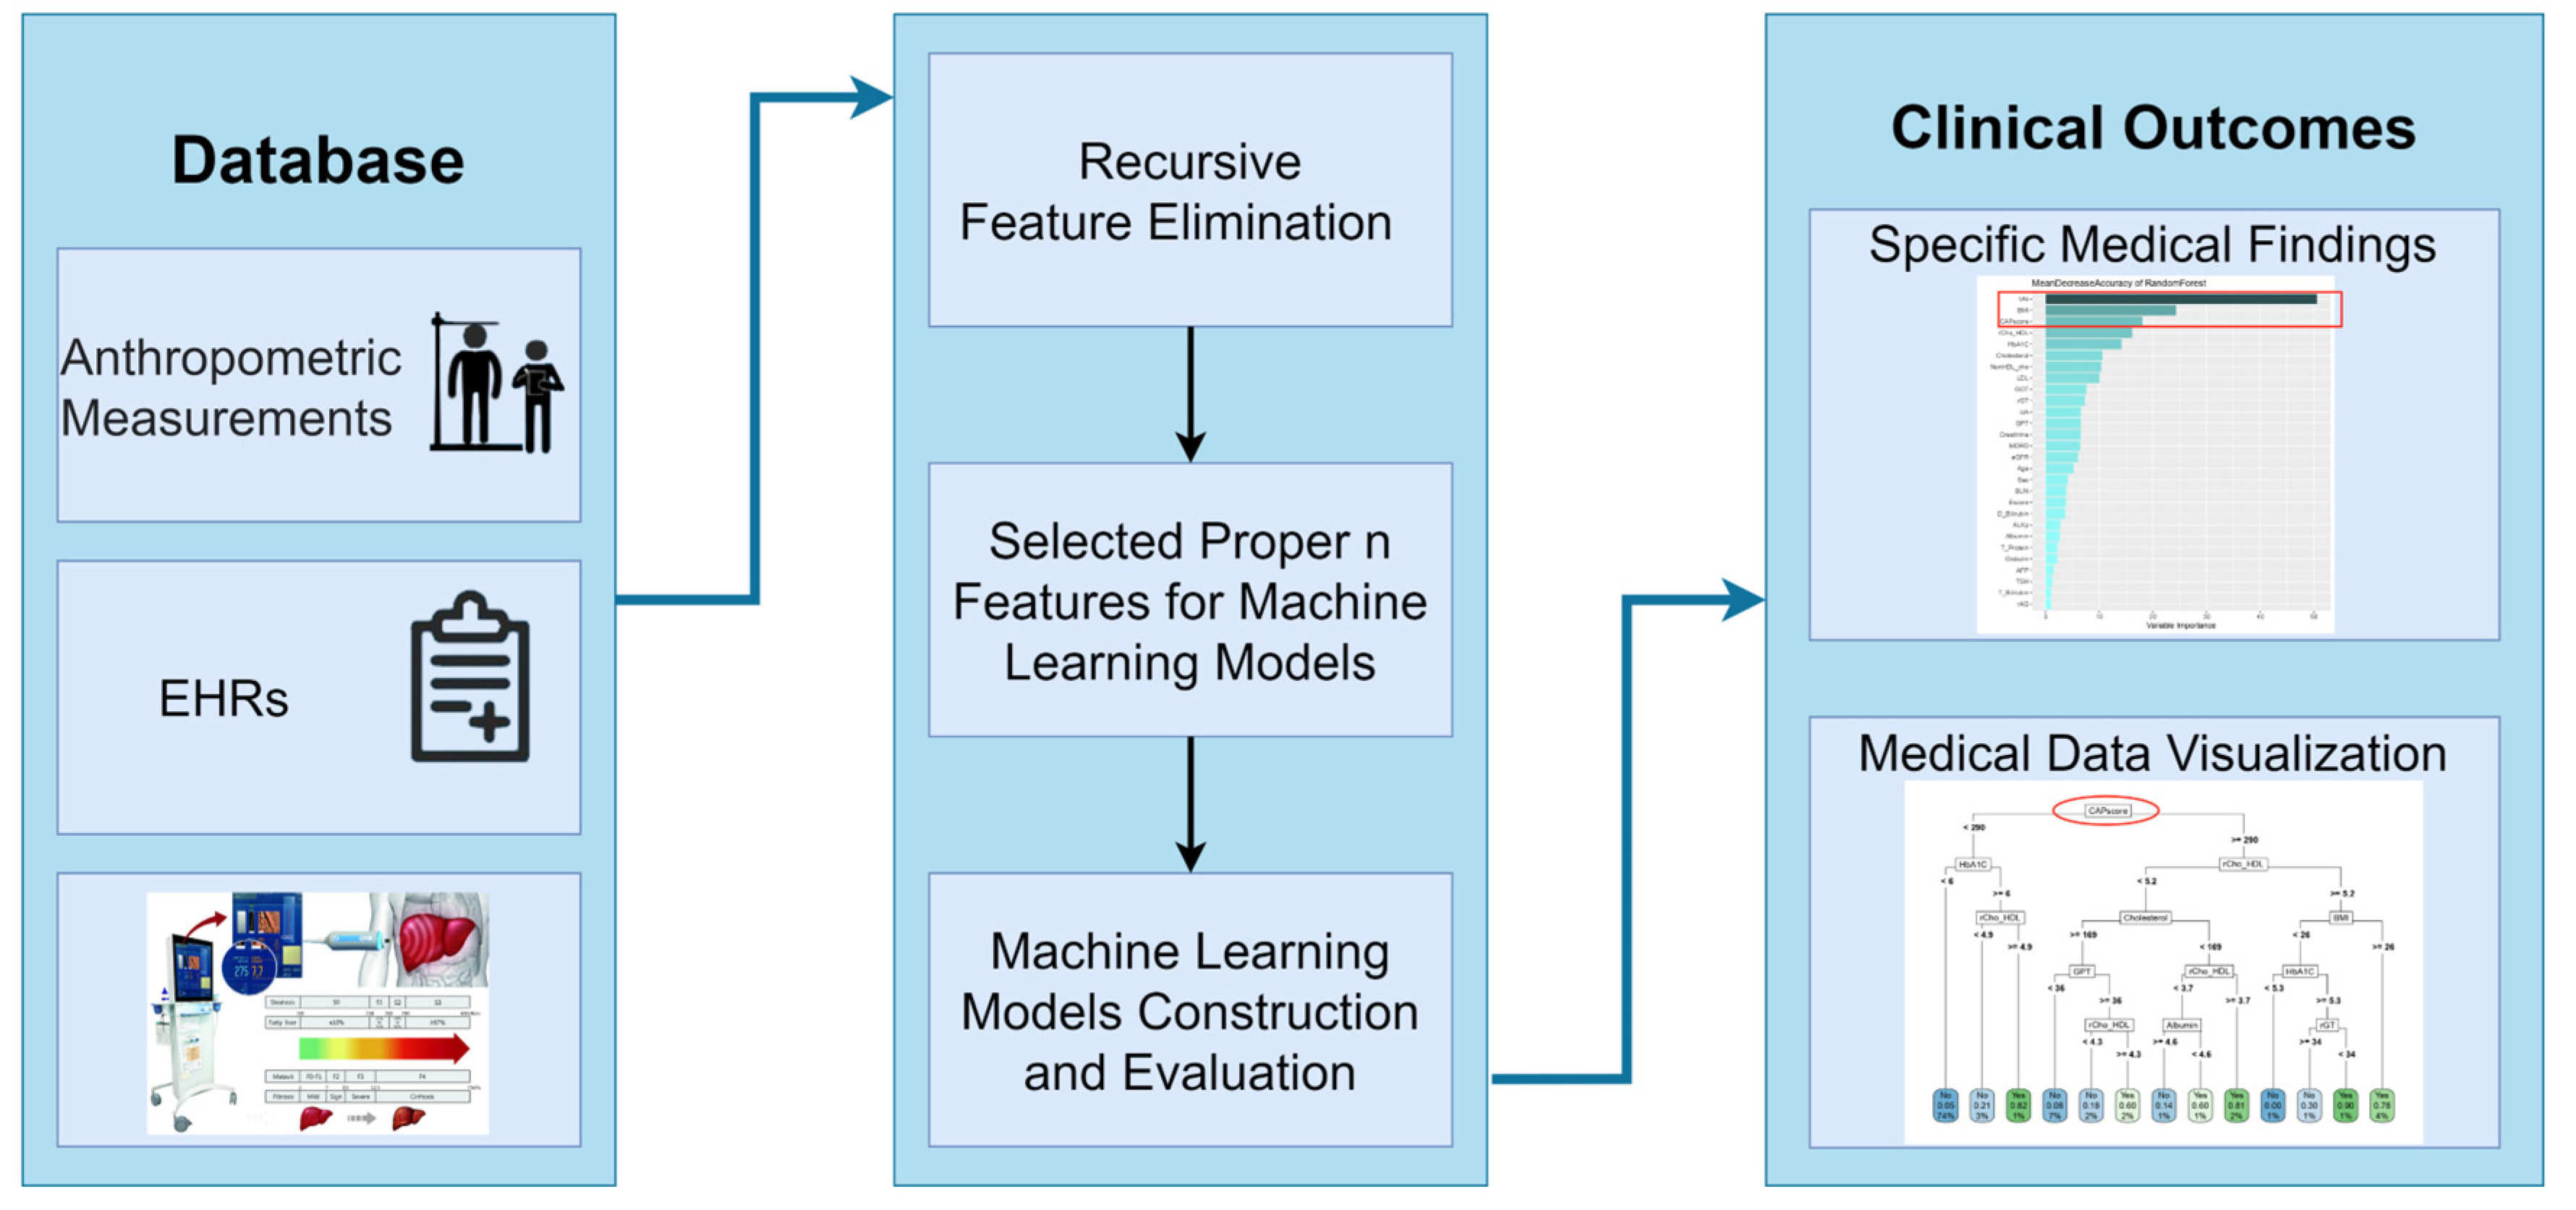
2.4. Statistical Analysis and Machine Learning
3. Results
4. Discussion
5. Limitations
6. Conclusions
Supplementary Materials
Author Contributions
Funding
Institutional Review Board Statement
Informed Consent Statement
Data Availability Statement
Acknowledgments
Conflicts of Interest
References
- Flisiak-Jackiewicz, M.; Bobrus-Chociej, A.; Wasilewska, N.; Lebensztejn, D.M. From Nonalcoholic Fatty Liver Disease (NAFLD) to Metabolic Dysfunction-Associated Fatty Liver Disease (MAFLD)-New Terminology in Pediatric Patients as a Step in Good Scientific Direction? J. Clin. Med. 2021, 10, 924. [Google Scholar] [CrossRef] [PubMed]
- Adams, L.A.; Lymp, J.F.; St Sauver, J.; Sanderson, S.O.; Lindor, K.D.; Feldstein, A.; Angulo, P. The natural history of nonalcoholic fatty liver disease: A population-based cohort study. Gastroenterology 2005, 129, 113–121. [Google Scholar] [CrossRef] [PubMed]
- Marchesini, G.; Brizi, M.; Bianchi, G.; Tomassetti, S.; Bugianesi, E.; Lenzi, M.; McCullough, A.J.; Natale, S.; Forlani, G.; Melchionda, N. Nonalcoholic fatty liver disease: A feature of the metabolic syndrome. Diabetes 2001, 50, 1844–1850. [Google Scholar] [CrossRef] [PubMed] [Green Version]
- Williams, C.D.; Stengel, J.; Asike, M.I.; Torres, D.M.; Shaw, J.; Contreras, M.; Landt, C.L.; Harrison, S.A. Prevalence of nonalcoholic fatty liver disease and nonalcoholic steatohepatitis among a largely middle-aged population utilizing ultrasound and liver biopsy: A prospective study. Gastroenterology 2011, 140, 124–131. [Google Scholar] [CrossRef] [PubMed]
- Chalasani, N.; Younossi, Z.; Lavine, J.E.; Diehl, A.M.; Brunt, E.M.; Cusi, K.; Charlton, M.; Sanyal, A. The diagnosis and management of non-alcoholic fatty liver disease: Practice guideline by the American Gastroenterological Association, American Association for the Study of Liver Diseases, and American College of Gastroenterology. J. Gastroenterol. 2012, 142, 1592–1609. [Google Scholar]
- Nalbantoglu, I.L.; Brunt, E.M. Role of liver biopsy in nonalcoholic fatty liver disease. World J. Gastroenterol. 2014, 20, 9026–9037. [Google Scholar] [CrossRef]
- Norman Oneil, M. Complications of Liver Biopsy—Risk Factors, Management and Recommendations. In Liver Biopsy; Hirokazu, T., Ed.; IntechOpen: Rijeka, Croatia, 2011; p. 25. [Google Scholar]
- Castera, L. Noninvasive Evaluation of Nonalcoholic Fatty Liver Disease. Semin. Liver Dis. 2015, 35, 291–303. [Google Scholar] [CrossRef]
- Pu, K.; Wang, Y.; Bai, S.; Wei, H.; Zhou, Y.; Fan, J.; Qiao, L. Diagnostic accuracy of controlled attenuation parameter (CAP) as a non-invasive test for steatosis in suspected non-alcoholic fatty liver disease: A systematic review and meta-analysis. BMC Gastroenterol. 2019, 19, 51. [Google Scholar] [CrossRef] [Green Version]
- Nallagangula, K.S.; Nagaraj, S.K.; Venkataswamy, L.; Chandrappa, M. Liver fibrosis: A compilation on the biomarkers status and their significance during disease progression. Future Sci. OA 2018, 4, Fso250. [Google Scholar] [CrossRef] [Green Version]
- Fatourou, E.M.; Tsochatzis, E.A. Management of metabolic syndrome and cardiovascular risk after liver transplantation. Lancet. Gastroenterol. Hepatol. 2019, 4, 731–741. [Google Scholar] [CrossRef]
- National Cholesterol Education Program (NCEP) Expert Panel on Detection, Evaluation, and Treatment of High Blood Cholesterol in Adults (Adult Treatment Panel III). Third Report of the National Cholesterol Education Program (NCEP) Expert Panel on Detection, Evaluation, and Treatment of High Blood Cholesterol in Adults (Adult Treatment Panel III) final report. Circulation 2002, 106, 3143–3421. [Google Scholar] [CrossRef]
- Dimitrijevic-Sreckovic, V.; Petrovic, H.; Dobrosavljevic, D.; Colak, E.; Ivanovic, N.; Gostiljac, D.; Ilic, S.; Nikolic, D.; Gacic, J.; Soldatovic, I. siMS score-method for quantification of metabolic syndrome, confirms co-founding factors of metabolic syndrome. Front. Genet. 2023, 13, 1041383. [Google Scholar] [CrossRef] [PubMed]
- Soldatovic, I.; Vukovic, R.; Culafic, D.; Gajic, M.; Dimitrijevic-Sreckovic, V. siMS score: Simple method for quantifying metabolic syndrome. PLoS ONE 2016, 11, e0146143. [Google Scholar] [CrossRef] [PubMed]
- Fujiyoshi, A.; Murad, M.H.; Luna, M.; Rosario, A.; Ali, S.; Paniagua, D.; Molina, J.; Lopez, M.; Jacobs, S.; Lopez-Jimenez, F. Metabolic syndrome and its components are underdiagnosed in cardiology clinics. J. Eval. Clin. Pract. 2011, 17, 78–83. [Google Scholar] [CrossRef]
- Ono, M.; Imamura, Y.; Irie, Y.; Aritsune, M.; Nishioka, S.; Horikita, T. Transient elastography: A novel, non-invasive method for the evaluation of liver stiffness and controlled attenuation parameter in cows. J. Vet. Med. Sci. 2020, 82, 559–565. [Google Scholar] [CrossRef] [Green Version]
- Benedito, J.; Carcel, J.; Clemente, G.; Mulet, A. Cheese maturity assessment using ultrasonics. J. Dairy Sci. 2000, 83, 248–254. [Google Scholar] [CrossRef]
- Sandrin, L.; Fourquet, B.; Hasquenoph, J.M.; Yon, S.; Fournier, C.; Mal, F.; Christidis, C.; Ziol, M.; Poulet, B.; Kazemi, F.; et al. Transient elastography: A new noninvasive method for assessment of hepatic fibrosis. Ultrasound Med. Biol. 2003, 29, 1705–1713. [Google Scholar] [CrossRef]
- Zeng, J.; Zhang, X.; Sun, C.; Pan, Q.; Lu, W.-Y.; Chen, Q.; Huang, L.-S.; Fan, J.-G. Feasibility study and reference values of FibroScan 502 with M probe in healthy preschool children aged 5 years. BMC Pediatr. 2019, 19, 129. [Google Scholar] [CrossRef]
- Oeda, S.; Tanaka, K.; Oshima, A.; Matsumoto, Y.; Sueoka, E.; Takahashi, H. Diagnostic Accuracy of FibroScan and Factors Affecting Measurements. Diagnostics 2020, 10, 940. [Google Scholar] [CrossRef]
- Chan, Y.J.; Chang, S.S.; Wu, J.L.; Wang, S.T.; Yu, C.S. Association between liver stiffness measurement by transient elastography and chronic kidney disease. Medicine 2022, 101, e28658. [Google Scholar] [CrossRef]
- Yu, C.S.; Chen, Y.D.; Chang, S.S.; Tang, J.H.; Wu, J.L.; Lin, C.H. Exploring and predicting mortality among patients with end-stage liver disease without cancer: A machine learning approach. Eur. J. Gastroenterol. Hepatol. 2021, 33, 1117–1123. [Google Scholar] [CrossRef] [PubMed]
- Yu, C.S.; Lin, C.H.; Lin, Y.J.; Lin, S.Y.; Wang, S.T.; Wu, J.L.; Tsai, M.H.; Chang, S.S. Clustering Heatmap for Visualizing and Exploring Complex and High-dimensional Data Related to Chronic Kidney Disease. J. Clin. Med. 2020, 9, 403. [Google Scholar] [CrossRef] [PubMed] [Green Version]
- Lin, Y.J.; Chen, R.J.; Tang, J.H.; Yu, C.S.; Wu, J.L.; Chen, L.C.; Chang, S.S. Machine-Learning Monitoring System for Predicting Mortality Among Patients with Noncancer End-Stage Liver Disease: Retrospective Study. JMIR Med. Inform. 2020, 8, e24305. [Google Scholar] [CrossRef] [PubMed]
- Huang, S.; Cai, N.; Pacheco, P.P.; Narrandes, S.; Wang, Y.; Xu, W. Applications of Support Vector Machine (SVM) Learning in Cancer Genomics. Cancer Genom. Proteom. 2018, 15, 41–51. [Google Scholar] [CrossRef] [Green Version]
- Tran, K.A.; Kondrashova, O.; Bradley, A.; Williams, E.D.; Pearson, J.V.; Waddell, N. Deep learning in cancer diagnosis, prognosis and treatment selection. Genome Med. 2021, 13, 152. [Google Scholar] [CrossRef]
- Yu, C.S.; Lin, Y.J.; Lin, C.H.; Wang, S.T.; Lin, S.Y.; Lin, S.H.; Wu, J.L.; Chang, S.S. Predicting Metabolic Syndrome with Machine Learning Models Using a Decision Tree Algorithm: Retrospective Cohort Study. JMIR Med. Inform. 2020, 8, e17110. [Google Scholar] [CrossRef]
- Yu, C.-S.; Lin, Y.-J.; Lin, C.-H.; Lin, S.-Y.; Wu, J.L.; Chang, S.-S. Development of an Online Health Care Assessment for Preventive Medicine: A Machine Learning Approach. J. Med. Internet Res. 2020, 22, e18585. [Google Scholar] [CrossRef]
- Yu, C.S.; Chang, S.S.; Lin, C.H.; Lin, Y.J.; Wu, J.L.; Chen, R.J. Identify the Characteristics of Metabolic Syndrome and Non-obese Phenotype: Data Visualization and a Machine Learning Approach. Front. Med. 2021, 8, 626580. [Google Scholar] [CrossRef]
- Chambers, J.M.; Freeny, A.E.; Heiberger, R.M. Analysis of variance; designed experiments. In Statistical Models in S.; Routledge: New York, NY, USA, 2017; pp. 145–193. [Google Scholar]
- Max, K.; Wing, J.; Weston, S.; Williams, A.; Keefer, C.; Engelhardt, A.; Cooper, T.; Mayer, Z.; Ziem, A.; Scrucca, L. Caret: Classification and Regression Training R Package Version 6.0–86. Available online: https://cran.r-project.org/web/packages/caret/caret.pdf (accessed on 6 April 2023).
- Kuhn, M. 20 Recursive Feature Elimination|The Caret Package. Available online: https://topepo.github.io/caret/recursive-feature-elimination.html (accessed on 6 April 2023).
- Kuhn, M. Building predictive models in R using the caret package. J. Stat. Softw. 2008, 28, 1–26. [Google Scholar] [CrossRef] [Green Version]
- Altman, D.G.; Bland, J.M. Diagnostic tests. 1: Sensitivity and specificity. BMJ 1994, 308, 1552. [Google Scholar] [CrossRef] [Green Version]
- Altman, D.G.; Bland, J.M. Statistics Notes: Diagnostic tests 2: Predictive values. BMJ 1994, 309, 102. [Google Scholar] [CrossRef] [PubMed] [Green Version]
- Velez, D.R.; White, B.C.; Motsinger, A.A.; Bush, W.S.; Ritchie, M.D.; Williams, S.M.; Moore, J.H. A balanced accuracy function for epistasis modeling in imbalanced datasets using multifactor dimensionality reduction. Genet. Epidemiol. Off. Publ. Int. Genet. Epidemiol. Soc. 2007, 31, 306–315. [Google Scholar] [CrossRef] [PubMed]
- Hu, Y.Y.; Dong, N.L.; Qu, Q.; Zhao, X.F.; Yang, H.J. The correlation between controlled attenuation parameter and metabolic syndrome and its components in middle-aged and elderly nonalcoholic fatty liver disease patients. Medicine 2018, 97, e12931. [Google Scholar] [CrossRef]
- Kotronen, A.; Yki-Järvinen, H. Fatty liver: A novel component of the metabolic syndrome. Arterioscler. Thromb. Vasc. Biol. 2008, 28, 27–38. [Google Scholar] [CrossRef] [PubMed] [Green Version]
- Amato, M.C.; Giordano, C.; Galia, M.; Criscimanna, A.; Vitabile, S.; Midiri, M.; Galluzzo, A. Visceral Adiposity Index: A reliable indicator of visceral fat function associated with cardiometabolic risk. Diabetes Care 2010, 33, 920–922. [Google Scholar] [CrossRef] [PubMed] [Green Version]
- Martínez-Sánchez, F.D.; Vargas-Abonce, V.P.; Rocha-Haro, A.; Flores-Cardenas, R.; Fernández-Barrio, M.; Guerrero-Castillo, A.P.; Meza-Arana, C.E.; Gulias-Herrero, A.; Gómez-Sámano, M.Á. Visceral adiposity index is associated with insulin resistance, impaired insulin secretion, and β-cell dysfunction in subjects at risk for type 2 diabetes. Diabetes Epidemiol. Manag. 2021, 2, 100013. [Google Scholar] [CrossRef]
- Bijari, M.; Jangjoo, S.; Emami, N.; Raji, S.; Mottaghi, M.; Moallem, R.; Jangjoo, A.; Saberi, A. The Accuracy of Visceral Adiposity Index for the Screening of Metabolic Syndrome: A Systematic Review and Meta-Analysis. Int. J. Endocrinol. 2021, 2021, 6684627. [Google Scholar] [CrossRef]
- Fabbrini, E.; Sullivan, S.; Klein, S. Obesity and nonalcoholic fatty liver disease: Biochemical, metabolic, and clinical implications. Hepatology 2010, 51, 679–689. [Google Scholar] [CrossRef] [Green Version]
- Falkner, B.; Cossrow, N.D. Prevalence of metabolic syndrome and obesity-associated hypertension in the racial ethnic minorities of the United States. Curr. Hypertens. Rep. 2014, 16, 449. [Google Scholar] [CrossRef] [Green Version]
- Bozkurt, B.; Coats, A.J.S.; Tsutsui, H.; Abdelhamid, C.M.; Adamopoulos, S.; Albert, N.; Anker, S.D.; Atherton, J.; Böhm, M.; Butler, J.; et al. Universal definition and classification of heart failure: A report of the Heart Failure Society of America, Heart Failure Association of the European Society of Cardiology, Japanese Heart Failure Society and Writing Committee of the Universal Definition of Heart Failure. J. Card. Fail. 2021, 23, 352–380. [Google Scholar] [CrossRef]
- Sasso, M.; Miette, V.; Sandrin, L.; Beaugrand, M. The controlled attenuation parameter (CAP): A novel tool for the non-invasive evaluation of steatosis using Fibroscan®. Clin. Res. Hepatol. Gastroenterol. 2012, 36, 13–20. [Google Scholar] [CrossRef] [PubMed]
- Kotronen, A.; Westerbacka, J.; Bergholm, R.; Pietiläinen, K.H.; Yki-Järvinen, H. Liver fat in the metabolic syndrome. J. Clin. Endocrinol. Metab. 2007, 92, 3490–3497. [Google Scholar] [CrossRef] [PubMed]
- Blaton, V. How is the Metabolic Syndrome Related to the Dyslipidemia? Ejifcc 2007, 18, 15–22. [Google Scholar] [CrossRef]
- Laws, A.; Reaven, G. Evidence for an independent relationship between insulin resistance and fasting plasma HDL-cholesterol, triglyceride and insulin concentrations. J. Intern. Med. 1992, 231, 25–30. [Google Scholar] [CrossRef] [PubMed]
- McLaughlin, T.; Abbasi, F.; Cheal, K.; Chu, J.; Lamendola, C.; Reaven, G. Use of metabolic markers to identify overweight individuals who are insulin resistant. Ann. Intern. Med. 2003, 139, 802–809. [Google Scholar] [CrossRef]
- Huang, G.; Xu, J.; Zhang, Z.; Cai, L.; Liu, H.; Yu, X. Total cholesterol and high density lipoprotein cholesterol ratio is associated with metabolic syndrome in a very elderly Chinese population. Sci. Rep. 2022, 12, 15212. [Google Scholar] [CrossRef]
- Khan, S.H.; Asif, N.; Ijaz, A.; Manzoor, S.M.; Niazi, N.K.; Fazal, N. Status of non-HDL-cholesterol and LDL-cholesterol among subjects with and without metabolic syndrome. J. Pak. Med. Assoc. 2018, 2, 15. [Google Scholar]
- Gaede, P.; Vedel, P.; Larsen, N.; Jensen, G.V.; Parving, H.H.; Pedersen, O. Multifactorial intervention and cardiovascular disease in patients with type 2 diabetes. New Engl. J. Med. 2003, 348, 383–393. [Google Scholar] [CrossRef] [Green Version]
- Simon, K.; Wittmann, I. Can blood glucose value really be referred to as a metabolic parameter? Rev. Endocr. Metab. Disord. 2019, 20, 151–160. [Google Scholar] [CrossRef] [Green Version]
- Peterson, K.P.; Pavlovich, J.G.; Goldstein, D.; Little, R.; England, J.; Peterson, C.M. What is hemoglobin A1c? An analysis of glycated hemoglobins by electrospray ionization mass spectrometry. Clin. Chem. 1998, 44, 1951–1958. [Google Scholar] [CrossRef] [Green Version]
- Blake, G.J.; Pradhan, A.D.; Manson, J.E.; Williams, G.R.; Buring, J.; Ridker, P.M.; Glynn, R.J. Hemoglobin A1c level and future cardiovascular events among women. Arch. Intern. Med. 2004, 164, 757–761. [Google Scholar] [CrossRef]
- Sung, K.; Rhee, E. Glycated haemoglobin as a predictor for metabolic syndrome in non-diabetic Korean adults. Diabet. Med. 2007, 24, 848–854. [Google Scholar] [CrossRef] [Green Version]
- Lee, D.H.; Silventoinen, K.; Jacobs, D.R., Jr.; Jousilahti, P.; Tuomileto, J. γ-Glutamyltransferase, obesity, and the risk of type 2 diabetes: Observational cohort study among 20,158 middle-aged men and women. J. Clin. Endocrinol. Metab. 2004, 89, 5410–5414. [Google Scholar] [CrossRef] [PubMed] [Green Version]
- Kim, D.; Noh, J.; Cho, N.; Lee, B.; Choi, Y.; Jung, J.; Min, Y.; Lee, M.; Lee, M.; Kim, K. Serum γ-glutamyltransferase within its normal concentration range is related to the presence of diabetes and cardiovascular risk factors. Diabet. Med. 2005, 22, 1134–1140. [Google Scholar] [CrossRef] [PubMed]
- André, P.; Balkau, B.; Vol, S.; Charles, M.A.; Eschwege, E.; Group, D.S. γ-glutamyltransferase activity and development of the metabolic syndrome (International Diabetes Federation Definition) in middle-aged men and women: Data from the Epidemiological Study on the Insulin Resistance Syndrome (DESIR) cohort. Diabetes Care 2007, 30, 2355–2361. [Google Scholar] [CrossRef] [PubMed] [Green Version]
- Lee, M.; Koh, S.; Koh, J.; Nam, S.; Shin, J.; Shin, Y.; Kong, I.; Ryu, S.; Lee, T.; Park, J. Relationship between γ-glutamyltransferase and metabolic syndrome in a Korean population. Diabet. Med. 2008, 25, 469–475. [Google Scholar] [CrossRef] [PubMed]
- Bo, S.; Gambino, R.; Durazzo, M.; Guidi, S.; Tiozzo, E.; Ghione, F.; Gentile, L.; Cassader, M.; Pagano, G.F. Associations between γ-glutamyl transferase, metabolic abnormalities and inflammation in healthy subjects from a population-based cohort: A possible implication for oxidative stress. World J. Gastroenterol. 2005, 11, 7109. [Google Scholar] [CrossRef]
- Goyal, R.; Mallick, S.R.; Mahanta, M.; Kedia, S.; Shalimar; Dhingra, R.; Sharma, H.; Das, P.; Datta Gupta, S.; Panda, S.; et al. Fibroscan can avoid liver biopsy in Indian patients with chronic hepatitis B. J. Gastroenterol. Hepatol. 2013, 28, 1738–1745. [Google Scholar] [CrossRef]
- Castéra, L.; Vergniol, J.; Foucher, J.; Le Bail, B.; Chanteloup, E.; Haaser, M.; Darriet, M.; Couzigou, P.; De Lédinghen, V. Prospective comparison of transient elastography, Fibrotest, APRI, and liver biopsy for the assessment of fibrosis in chronic hepatitis C. Gastroenterology 2005, 128, 343–350. [Google Scholar] [CrossRef]


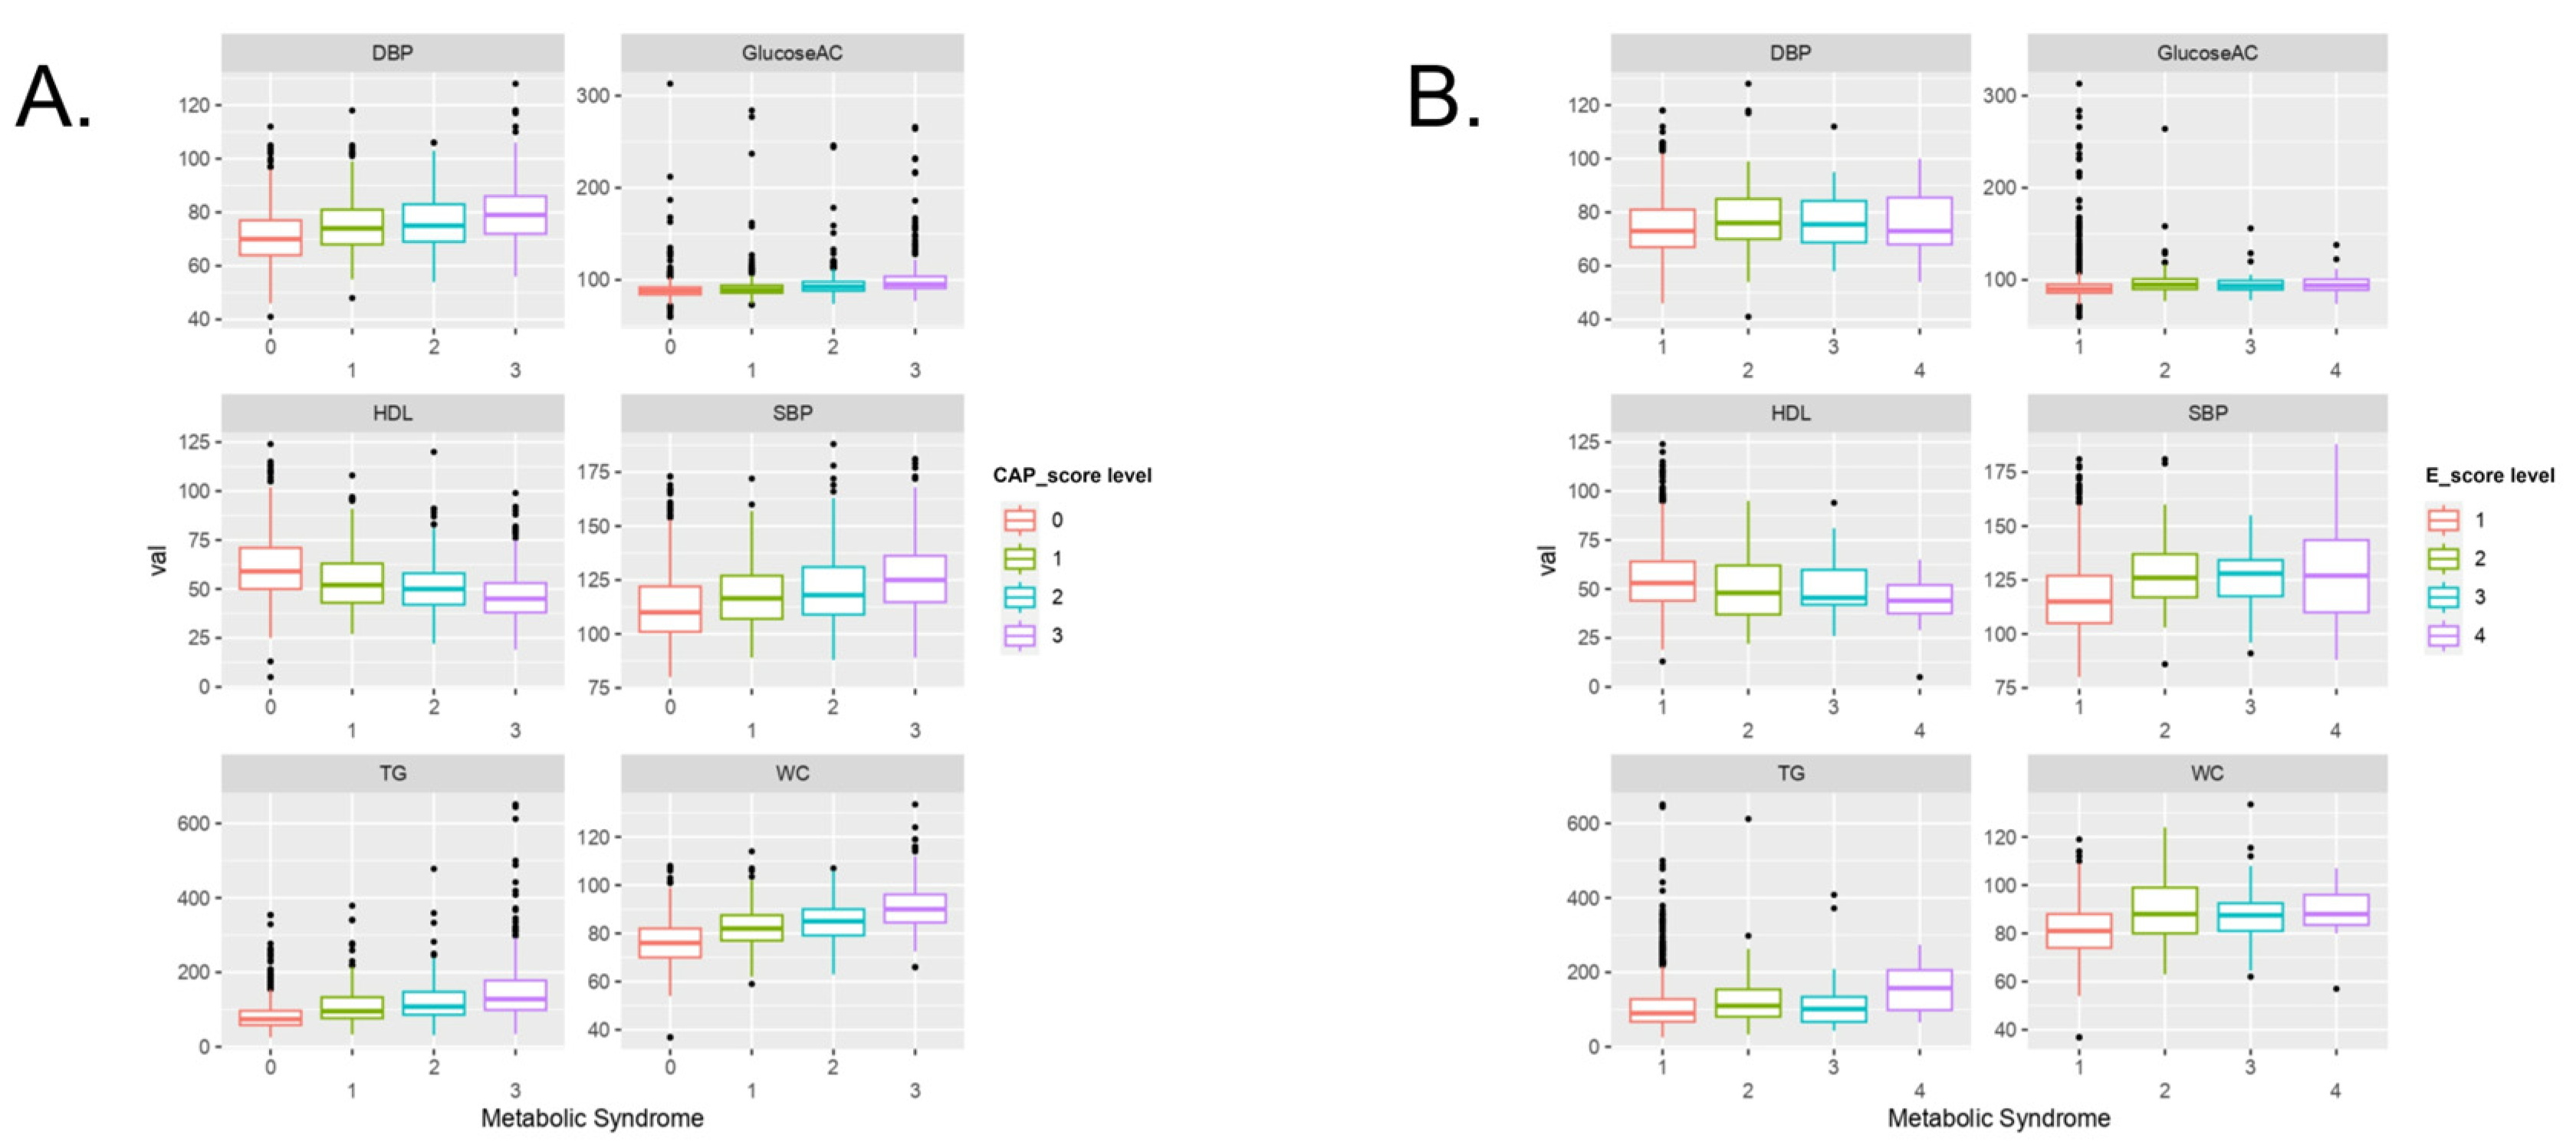
| CAP Score | |||||
|---|---|---|---|---|---|
| S0 (739) | S1 (245) | S2 (252) | S3 (320) | p-Value | |
| DBP, mmHg | 71.2 | 74.6 | 75.9 | 79.8 | <0.001 * |
| 70 (64–77) | 74 (68–81) | 75 (69–83) | 79 (72–86) | ||
| SBP, mmHg | 112.5 | 121.1 | 121.1 | 126 | <0.001 * |
| 110 (101–122) | 118 (109–131) | 118 (109–131) | 125 (115–136) | ||
| HDL, mg/dL | 61 | 54.3 | 51.2 | 46.7 | <0.001 * |
| 59 (50–71) | 52 (43–63) | 50 (42–58) | 45 (38–53) | ||
| Glucose AC, mg/dL | 89.2 | 92.6 | 95.5 | 101.4 | <0.001 * |
| 88 (84–92) | 89 (86–94) | 92 (88–98) | 95 (91–104) | ||
| TG, mg/dL | 83.4 | 108.7 | 119.3 | 149.7 | <0.001 * |
| 74 (58–97) | 95 (77–133) | 108 (86–148) | 128 (99–178) | ||
| WC, cm | 76.2 | 82.3 | 85.2 | 91 | <0.001* |
| 76 (70–82) | 82 (77–87.5) | 85 (79–90) | 90 (84.5–96) | ||
| E score | |||||
| F0–F1 (1462) | F2 (50) | F3 (19) | F4 (25) | p-value | |
| DBP, mmHg | 74.1 | 77.8 | 77.2 | 75.8 | 0.0162 |
| 73 (67–81) | 76 (70–85) | 76 (69–84) | 73 (68–86) | ||
| SBP, mmHg | 117 | 127.9 | 126.7 | 127.9 | <0.001 * |
| 115 (105–127) | 126 (117–137) | 128 (118–134) | 127 (110–144) | ||
| HDL, mg/dL | 55.7 | 50 | 50.9 | 44.9 | <0.001 * |
| 53 (44–64) | 48 (37–62) | 46 (42–60) | 44 (38–52) | ||
| Glucose AC, mg/dL | 93 | 99.2 | 98 | 96.9 | 0.0069 |
| 90 (86–95) | 95 (90–101) | 94 (90–99) | 94 (89–101) | ||
| TG, mg/dL | 105.5 | 128.1 | 125.8 | 161.1 | <0.001 * |
| 90 (67–128) | 110 (81–154) | 101 (67–134) | 157 (99–206) | ||
| WC, cm | 81.2 | 89.9 | 89 | 89.6 | <0.001 * |
| 81 (74–88) | 88 (80–99) | 87.5 (81–92.5) | 88 (83.5–96) | ||
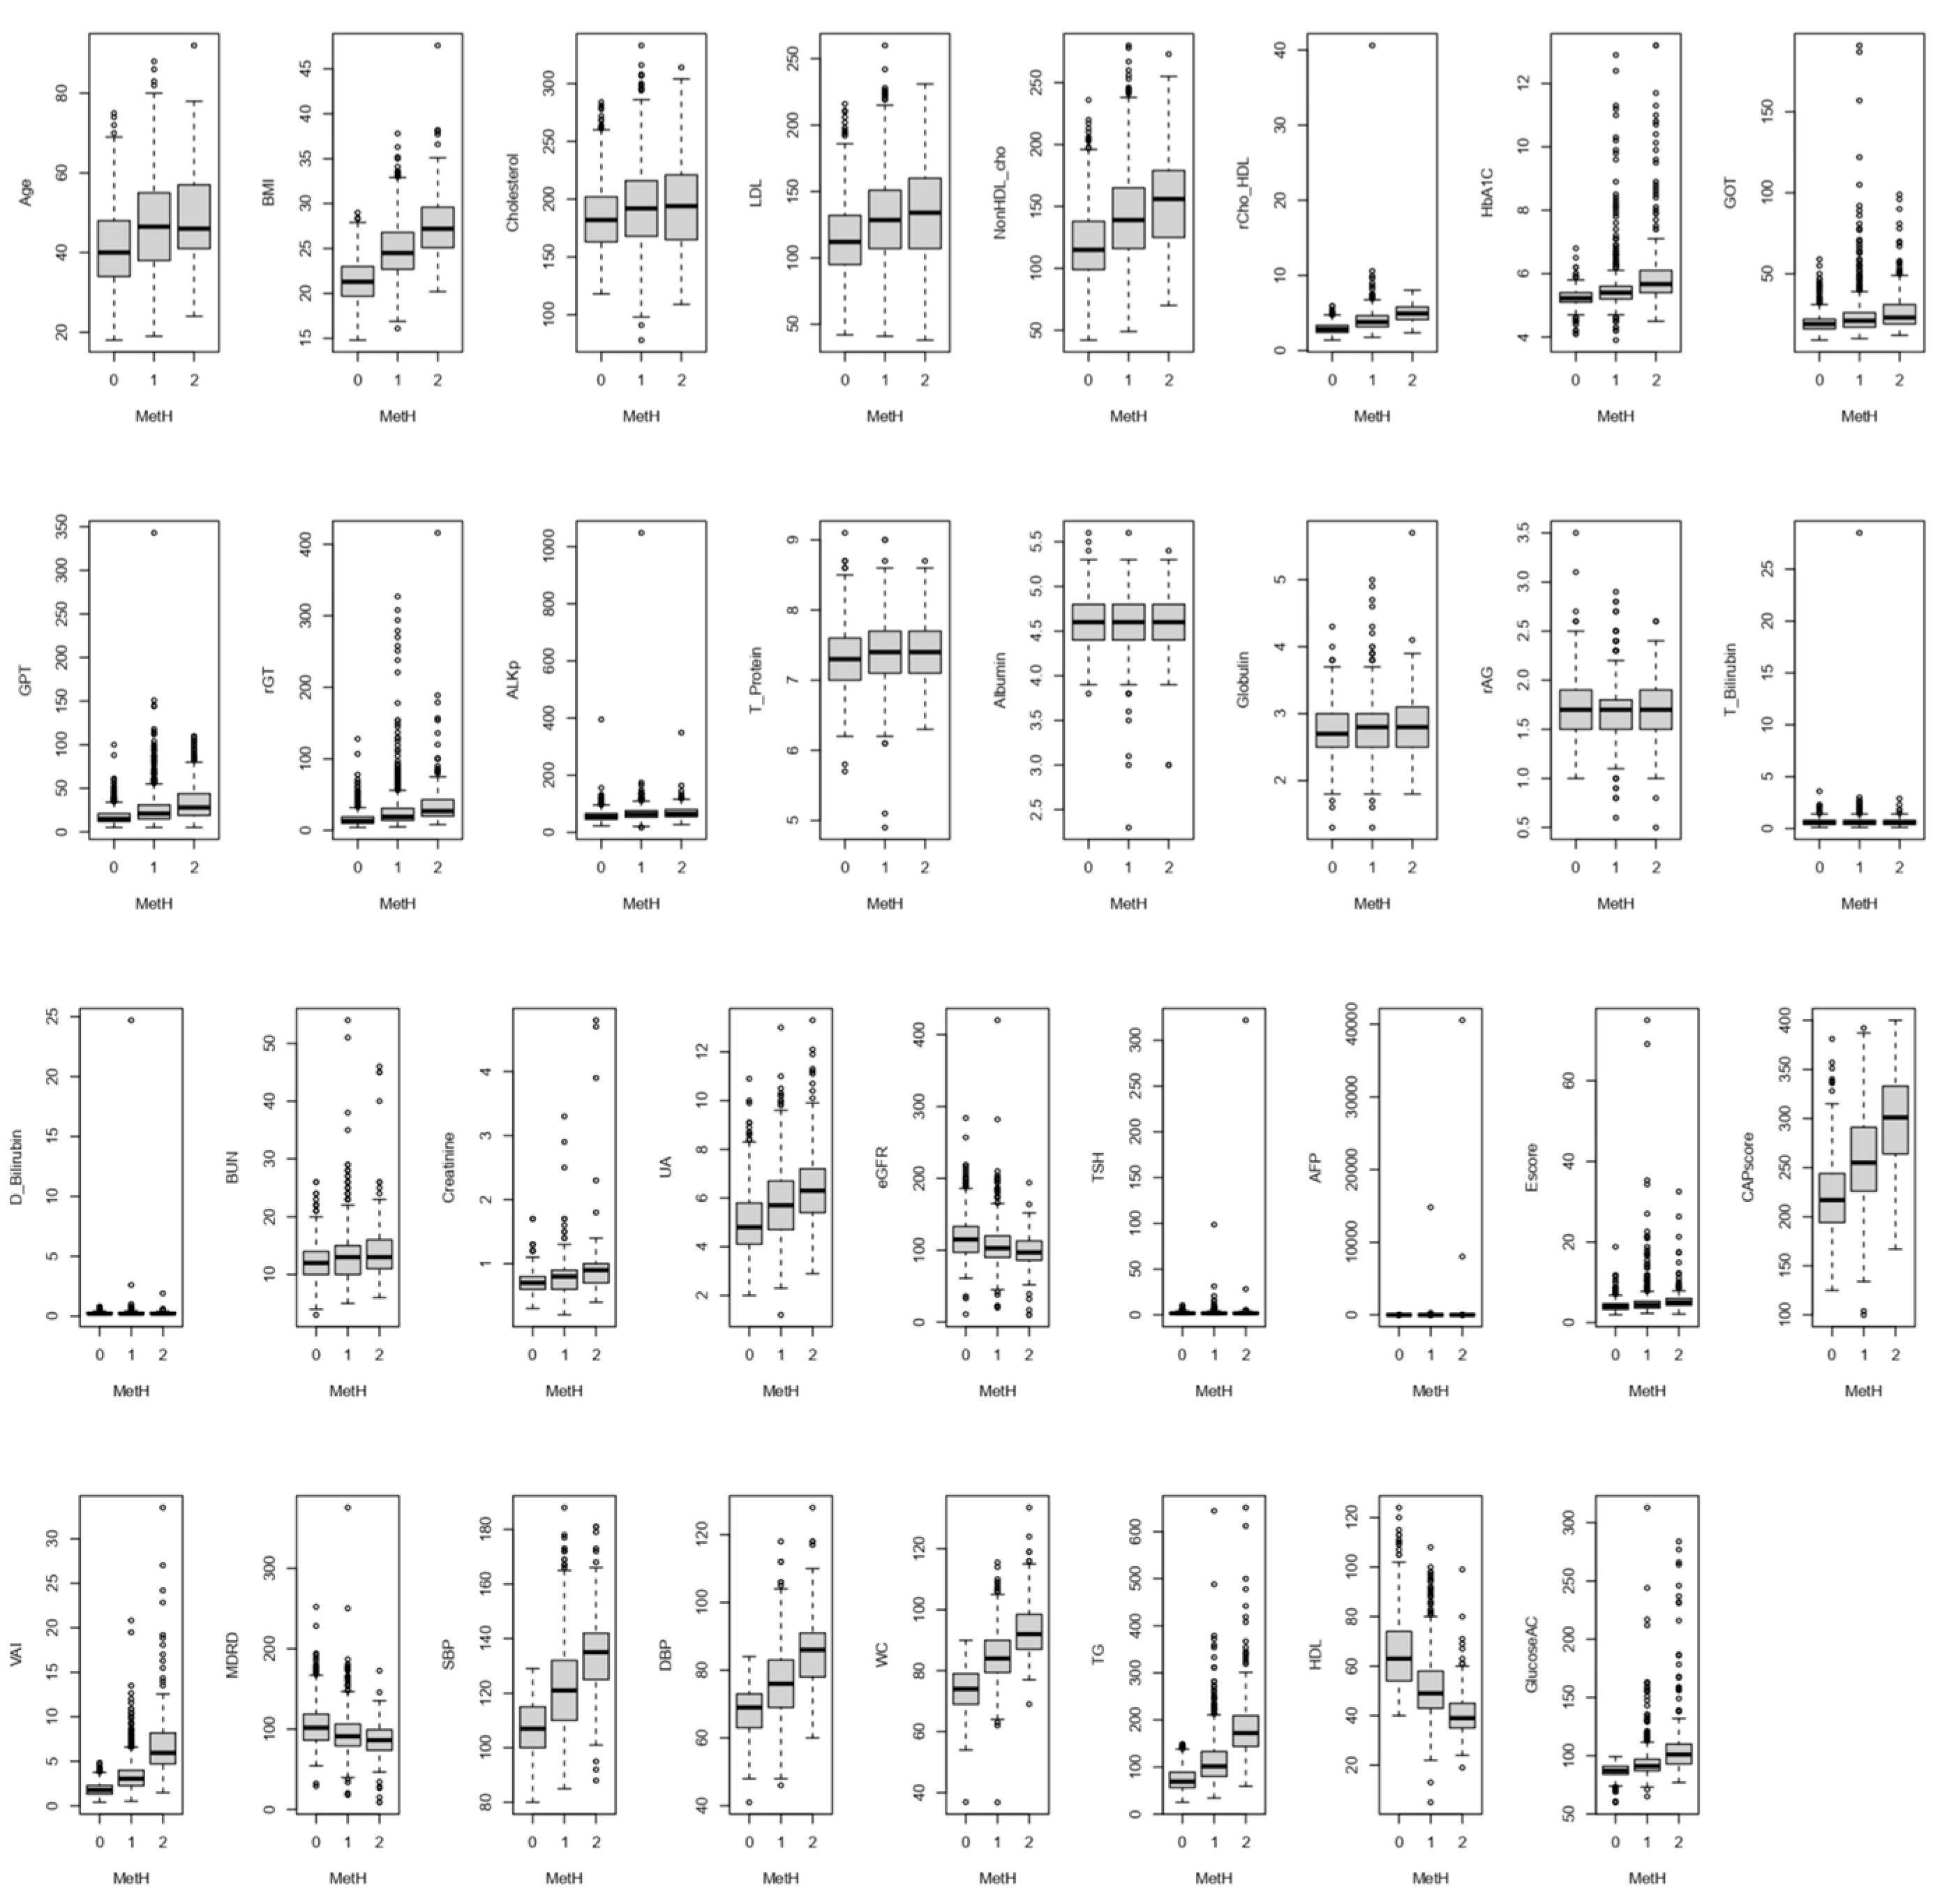
| Metabolic Syndrome Health Conditions | ||||
|---|---|---|---|---|
| C (5, 0); N1 = 753 | C (5, 1 and 2); N2 = 938 | C (5, 3, 4, and 5); N3 = 253 | p-Value | |
| Age, years | 40.7; 40 (34–48) | 47; 47 (38–55) | 48.7; 46 (41–57) | <0.001 * |
| BMI, kg/m2 | 21.4; 21.3 (19.7–23) | 24.9; 24.5 (22.7–26.8) | 27.6; 27.2 (25.1–29.6) | <0.001 * |
| Cholesterol, mg/dL | 184.2; 182 (163–202) | 193.1; 192 (168–216) | 194.3; 194 (165–221) | <0.001 * |
| LDL, mg/dL | 114.9; 112 (95–132) | 129.9; 129 (107–151) | 132.4; 134 (107–160) | <0.001 * |
| non-HDL, mg/dL | 119.2; 115 (99–138) | 141.6; 139 (116–165) | 153.9; 156 (125–179) | <0.001 * |
| Chol/HDL | 2.95; 2.83 (2.42–3.35) | 3.99; 3.79 (3.15–4.64) | 4.98; 4.93 (4.11–5.81) | <0.001 * |
| HbA1c, % | 5.2; 5.2 (5.1–5.4) | 5.5; 5.4 (5.2–5.6) | 6.1; 5.7 (5.4–6.1) | <0.001 * |
| GOT, U/L | 19.9; 19 (16–22) | 23.8; 21 (17–26) | 27.1; 23 (19–31) | <0.001 * |
| GPT, U/L | 17.9; 15 (12–21) | 26.5; 21 (15–31) | 35.3; 28 (19–44) | <0.001 * |
| γGT, U/L | 16.2; 13 (10–19) | 28.3; 19 (14–31) | 36.8; 27 (20–43) | <0.001 * |
| ALKp, IU/L | 58; 55 (46–66) | 67.6; 64 (53–76) | 69.8; 65 (55–80) | <0.001* |
| T_Protein, g/dL | 7.4; 7.3 (7–7.6) | 7.4; 7.4 (7.1–7.7) | 7.42; 7.4 (7.1–7.7) | 0.0259 |
| Albumin, g/dL | 4.6; 4.6 (4.4–4.8) | 4.6; 4.6 (4.4–4.8) | 4.6; 4.6 (4.4–4.8) | 0.157 |
| Globulin, g/dL | 2.73; 2.7 (2.5–3.0) | 2.79; 2.8 (2.5–3.0) | 2.82; 2.8 (2.5–3.1) | 0.0006 |
| Alb/Glb | 1.73; 1.7 (1.5–1.9) | 1.69; 1.7 (1.5–1.8) | 1.68; 1.7 (1.5–1.9) | 0.00265 |
| T_Bilirubin, mg/dL | 0.64; 0.6 (0.4–0.8) | 0.68; 0.6 (0.4–0.8) | 0.67; 0.6 (0.4–0.8) | 0.319 |
| D_Bilirubin, mg/dL | 0.23; 0.2 (0.2–0.3) | 0.26; 0.2 (0.2–0.3) | 0.24; 0.2 (0.2–0.3) | 0.561 |
| BUN, mg/dL | 12.2; 12 (10–14) | 13.4; 13 (10–15) | 14; 13 (11–16) | <0.001 * |
| Creatinine, mg/dL | 0.70; 0.7 (0.6–0.8) | 0.78; 0.8 (0.6–0.9) | 0.89; 0.9 (0.7–1.0) | <0.001 * |
| UA, mg/dL | 5.02; 4.8 (4.1–5.8) | 5.78; 5.7 (4.7–6.7) | 6.4; 6.3 (5.4–7.2) | <0.001 * |
| eGFR, ml/min/1.73 m2 | 117.4; 115 (97–133) | 107.1; 102.9 (90–120) | 99.1; 97 (86–113) | <0.001 * |
| TSH, mU/L | 2.00; 1.80 (1.23–2.49) | 2.25; 1.77 (1.21–2.48) | 3.36; 1.75 (1.28–2.42) | 0.0328 |
| AFP, ng/mL | 2.60; 2.26 (1.59–3.11) | 18.98; 2.41 (1.69–3.36) | 194.93;2.43 (1.74–3.19) | 0.0272 |
| E score, kPa | 4.2; 4.0 (3.3–4.7) | 5.0; 4.4 (3.6–5.3) | 5.6; 5.0 (4.3–6.0) | <0.001 * |
| CAP score, dB/m | 220.1; 217 (194–244) | 259; 255 (226–291) | 298.3; 301 (264–333) | <0.001 * |
| VAI | 1.88; 1.77 (1.32–2.30) | 3.41;3.05 (2.27–4.00) | 6.94; 5.95 (4.73–8.19) | <0.001 * |
| MDRD | 104; 102 (86–119) | 95;91 (79–106) | 87; 86 (74–99) | <0.001 * |
| SBP, mmHg | 107.2; 107 (100–115) | 121.6; 121 (110–132) | 134; 135 (125–142) | <0.001 * |
| DBP, mmHg | 68.3; 69 (63–73) | 76.3; 76 (69–83) | 84.9; 86 (78–91) | <0.001 * |
| WC, cm | 74.2; 74 (69–79) | 84.7; 84 (79–90) | 93.2; 92 (87–98.5) | <0.001 * |
| TG, mg/dL | 73.7; 69 (56–89) | 112.8; 101 (80–133) | 187.4; 172 (144–209) | <0.001 * |
| HDL, mg/dL | 65.1; 63 (54–74) | 51.5; 49 (43–58) | 40.4; 39 (35–45) | <0.001 * |
| Glucose AC, mg/dL | 87.3; 87 (84–91) | 93.9; 91 (87–97) | 109.5; 101 (93–110) | <0.001 * |
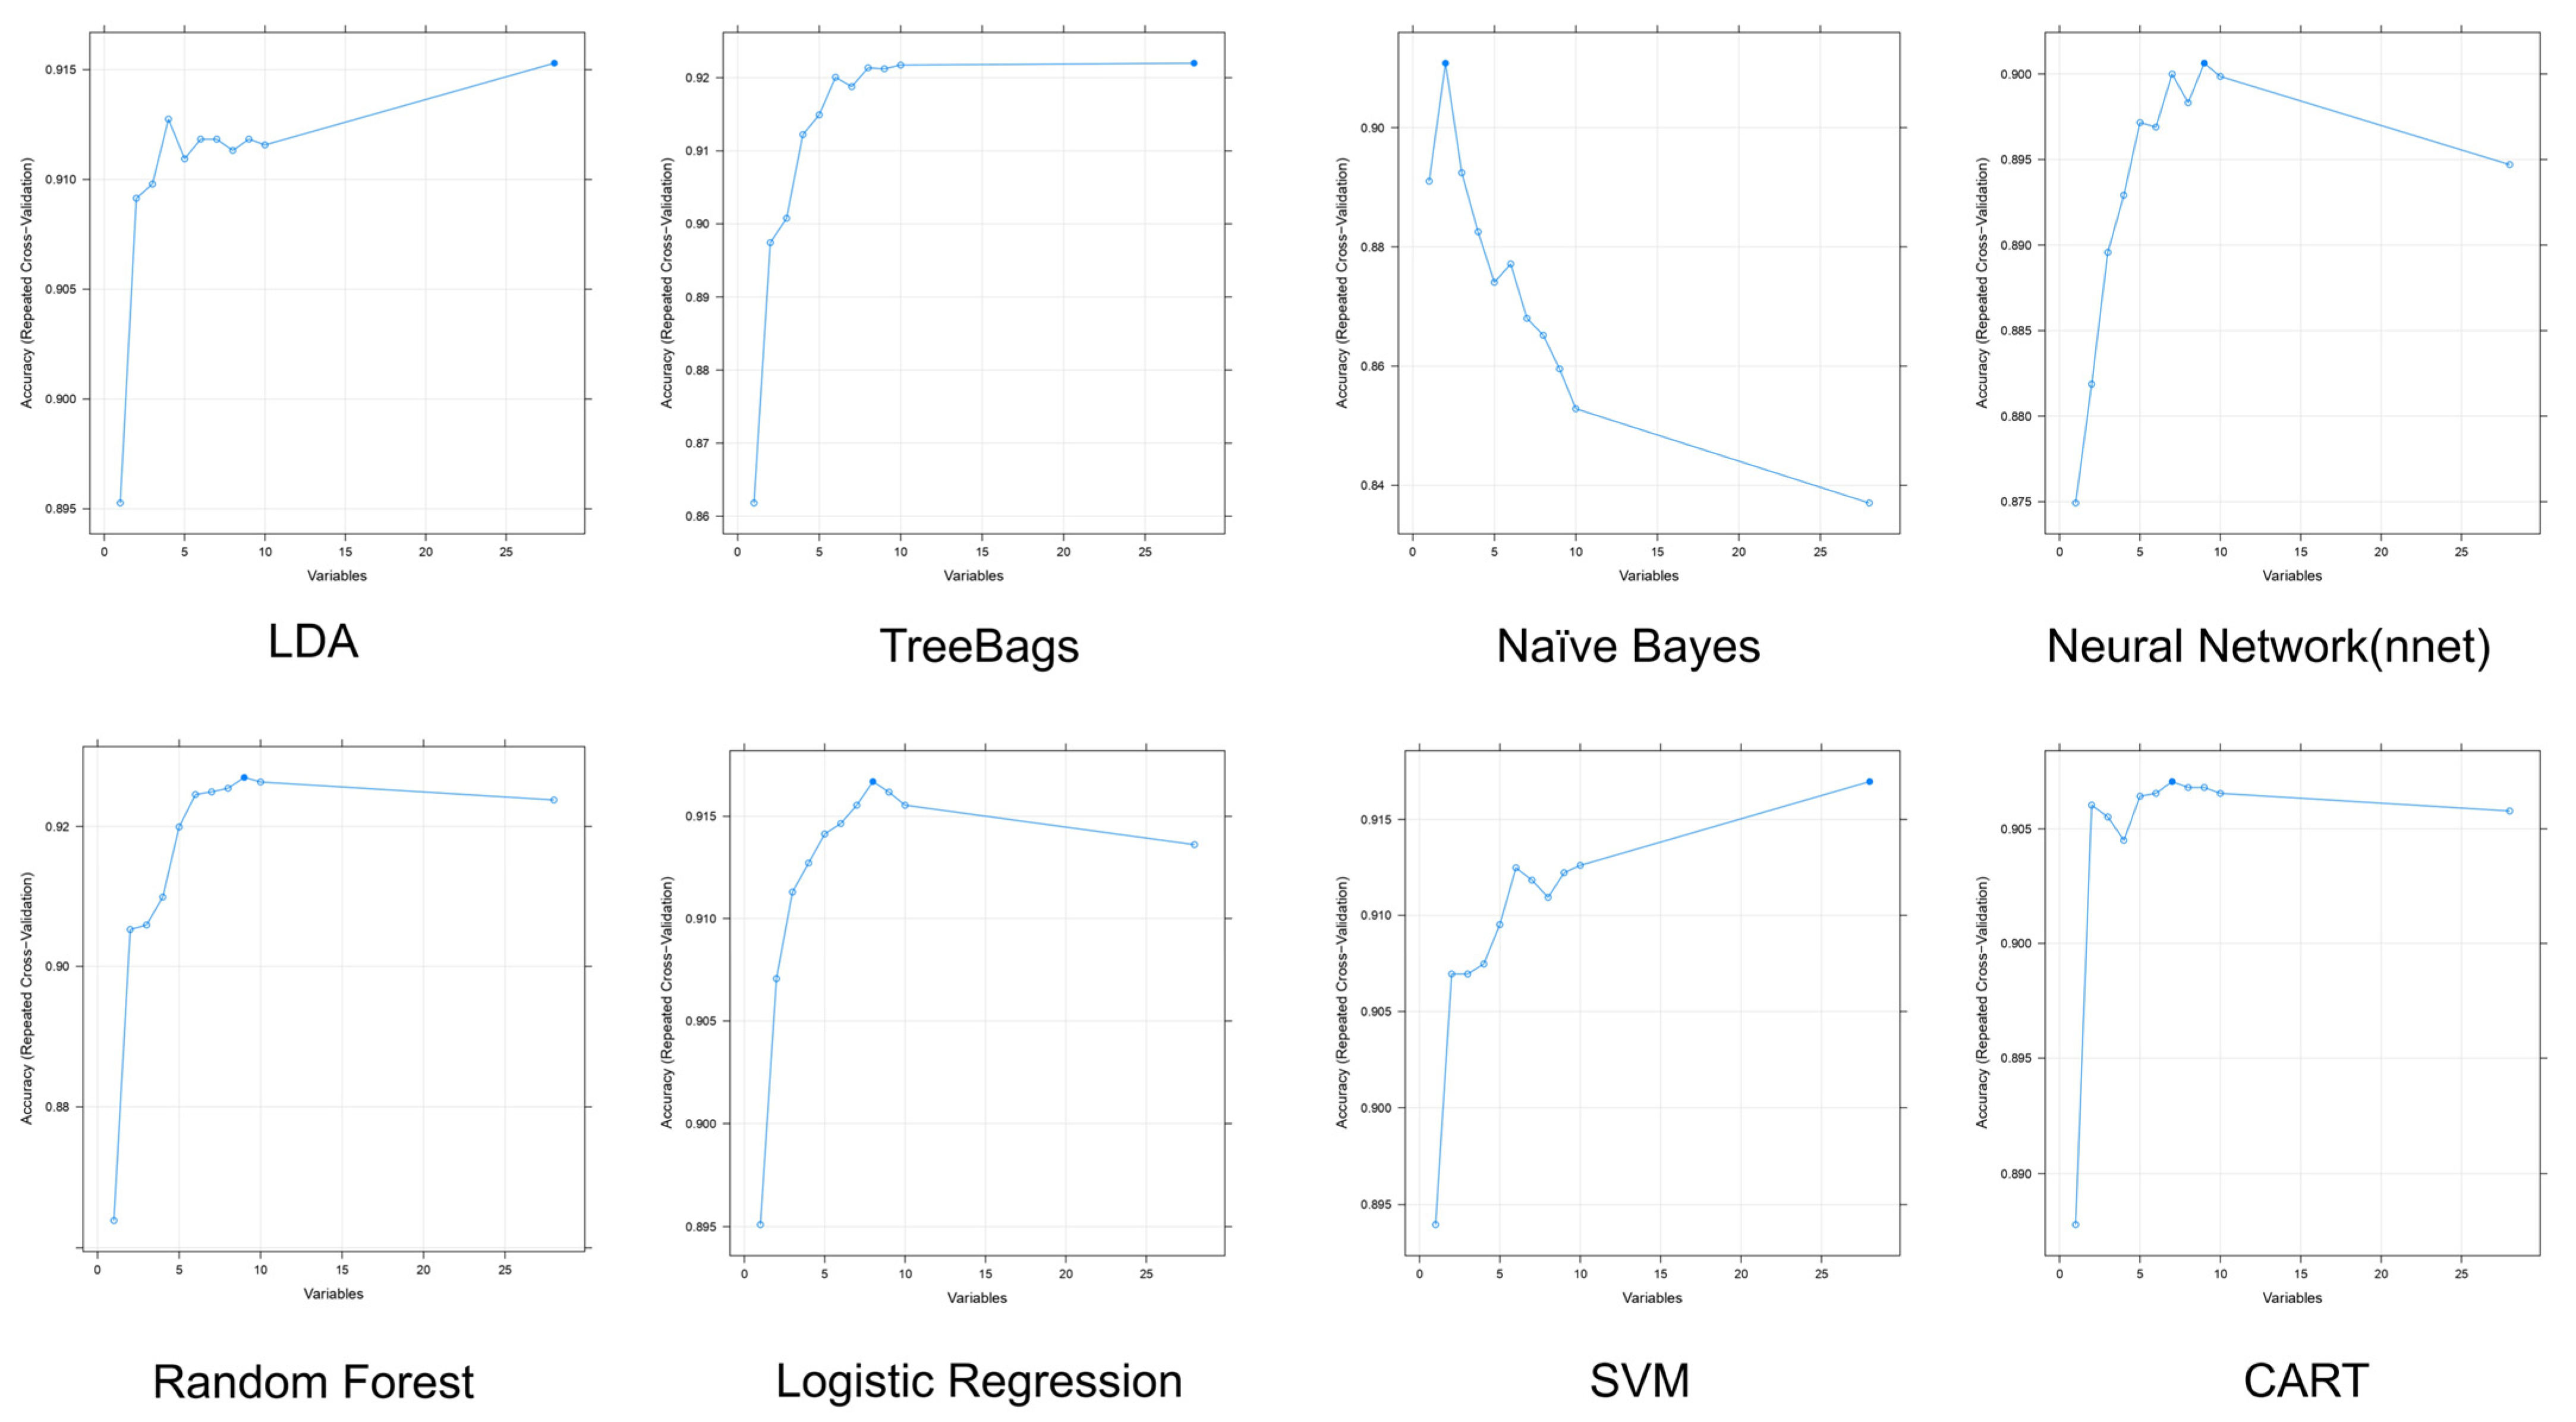
| Model | # of Variables | Accuracy | Kappa | Accuracy SD | Kappa SD | Lists of Variables by Order * |
|---|---|---|---|---|---|---|
| LDA | 28 | 0.9153 | 0.5772 | 0.01792 | 0.1005 | VAI, BMI, Chol/HDL, CAP score, γGT, HbA1C, GPT, E score, UA, non-HDL, etc. |
| TreeBags | 28 | 0.9220 | 0.6439 | 0.01827 | 0.0807 | VAI, BMI, CAP score, HbA1C, Chol/HDL, cholesterol, non-HDL, LDL, Age, γGT, etc. |
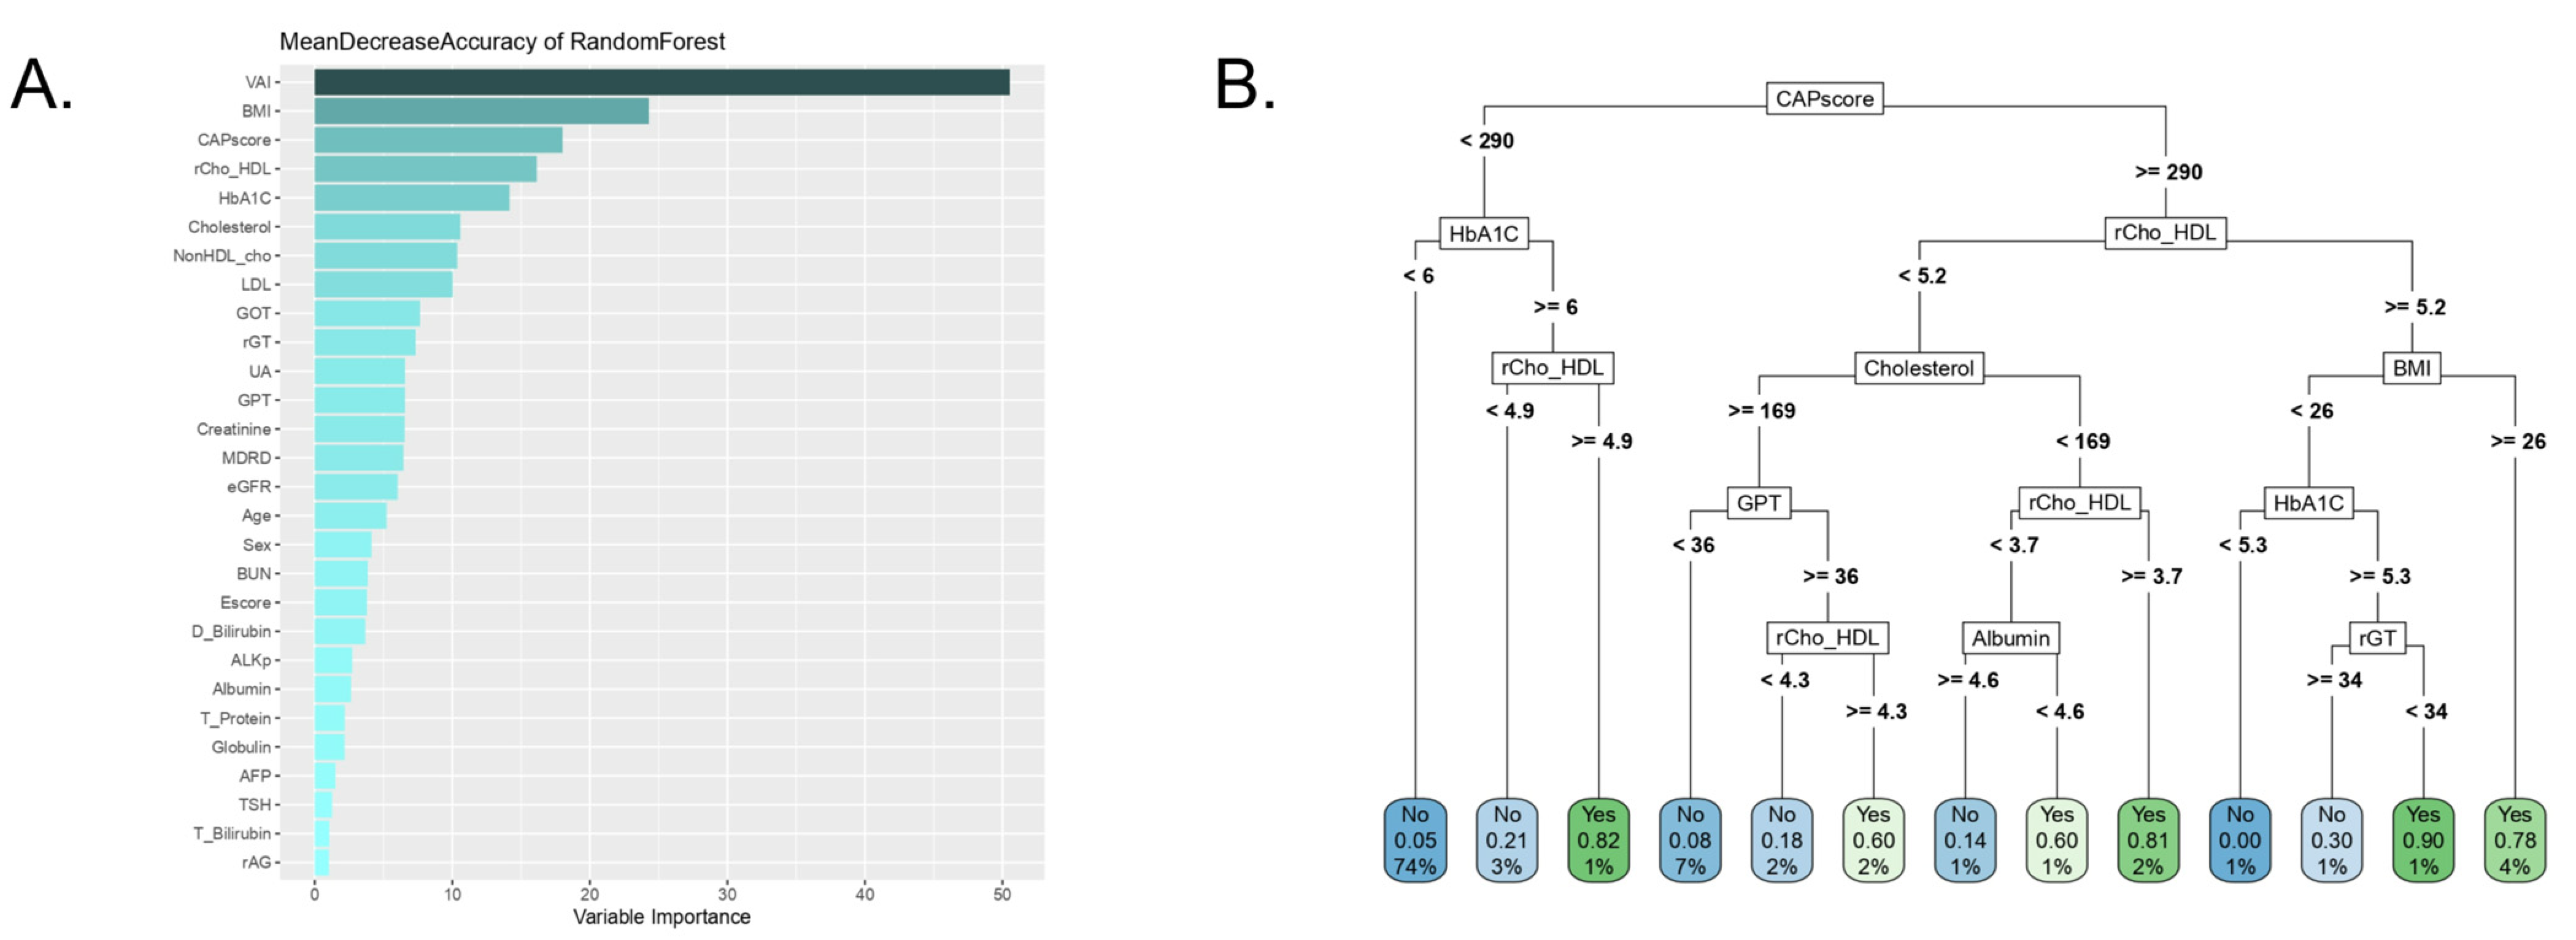
| Random forest | 9 | 0.9270 | 0.6533 | 0.01722 | 0.08523 | VAI, BMI, CAP score, Chol/HDL, HbA1C, cholesterol, γGT, non-HDL, LDL |
| Logistic | 8 | 0.9167 | 0.5928 | 0.01645 | 0.08558 | VAI, BMI, Age, HbA1C, cholesterol, CAP score, non-HDL, GOT |
| Naïve Bayes | 2 | 0.9108 | 0.4622 | 0.01693 | 0.09379 | VAI, BMI |
| nnet | 9 | 0.9006 | 0.5141 | 0.02340 | 0.1743 | CAP score, VAI, AFP, cholesterol, Chol/HDL, non-HDL, γGT, eGFR, TSH |
| SVM | 28 | 0.9170 | 0.5902 | 0.01638 | 0.08548 | VAI, BMI, Chol/HDL, CAP score, γGT, HbA1C, GPT, E score, UA, non-HDL, etc. |
| CART | 7 | 0.9071 | 0.5216 | 0.01864 | 0.1141 | VAI, BMI, CAP score, Chol/HDL, HbA1C, γGT, E score |
| Model | Accuracy | Kappa | Sensitivity | Specificity | F1-Score | Precision |
|---|---|---|---|---|---|---|
| LDA | 0.8892 | 0.4747 | 0.5319 | 0.9384 | 0.5376 | 0.5435 |
| TreeBags | 0.8995 | 0.5322 | 0.5957 | 0.9414 | 0.5895 | 0.5833 |
| Random forest | 0.9046 | 0.5480 | 0.5957 | 0.9472 | 0.6022 | 0.6087 |
| Logistic | 0.8969 | 0.5068 | 0.5532 | 0.9443 | 0.5652 | 0.5778 |
| Naïve Bayes | 0.8686 | 0.4297 | 0.5532 | 0.9120 | 0.5049 | 0.4643 |
| nnet | 0.8918 | 0.5181 | 0.6170 | 0.9296 | 0.5800 | 0.5472 |
| SVM | 0.9072 | 0.5103 | 0.4894 | 0.9648 | 0.5610 | 0.6571 |
| CART | 0.8995 | 0.4640 | 0.4468 | 0.9619 | 0.5185 | 0.6177 |
Disclaimer/Publisher’s Note: The statements, opinions and data contained in all publications are solely those of the individual author(s) and contributor(s) and not of MDPI and/or the editor(s). MDPI and/or the editor(s) disclaim responsibility for any injury to people or property resulting from any ideas, methods, instructions or products referred to in the content. |
© 2023 by the authors. Licensee MDPI, Basel, Switzerland. This article is an open access article distributed under the terms and conditions of the Creative Commons Attribution (CC BY) license (https://creativecommons.org/licenses/by/4.0/).
Share and Cite
Chiu, K.-L.; Chen, Y.-D.; Wang, S.-T.; Chang, T.-H.; Wu, J.L.; Shih, C.-M.; Yu, C.-S. Exploring the Potential Performance of Fibroscan for Predicting and Evaluating Metabolic Syndrome using a Feature Selected Strategy of Machine Learning. Metabolites 2023, 13, 822. https://doi.org/10.3390/metabo13070822
Chiu K-L, Chen Y-D, Wang S-T, Chang T-H, Wu JL, Shih C-M, Yu C-S. Exploring the Potential Performance of Fibroscan for Predicting and Evaluating Metabolic Syndrome using a Feature Selected Strategy of Machine Learning. Metabolites. 2023; 13(7):822. https://doi.org/10.3390/metabo13070822
Chicago/Turabian StyleChiu, Kuan-Lin, Yu-Da Chen, Sen-Te Wang, Tzu-Hao Chang, Jenny L Wu, Chun-Ming Shih, and Cheng-Sheng Yu. 2023. "Exploring the Potential Performance of Fibroscan for Predicting and Evaluating Metabolic Syndrome using a Feature Selected Strategy of Machine Learning" Metabolites 13, no. 7: 822. https://doi.org/10.3390/metabo13070822