
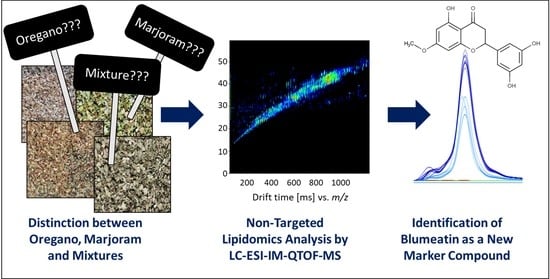
Food Fingerprinting: LC-ESI-IM-QTOF-Based Identification of Blumeatin as a New Marker Metabolite for the Detection of Origanum majorana Admixtures to O. onites/vulgare
 , and
, and
Abstract
:
1. Introduction
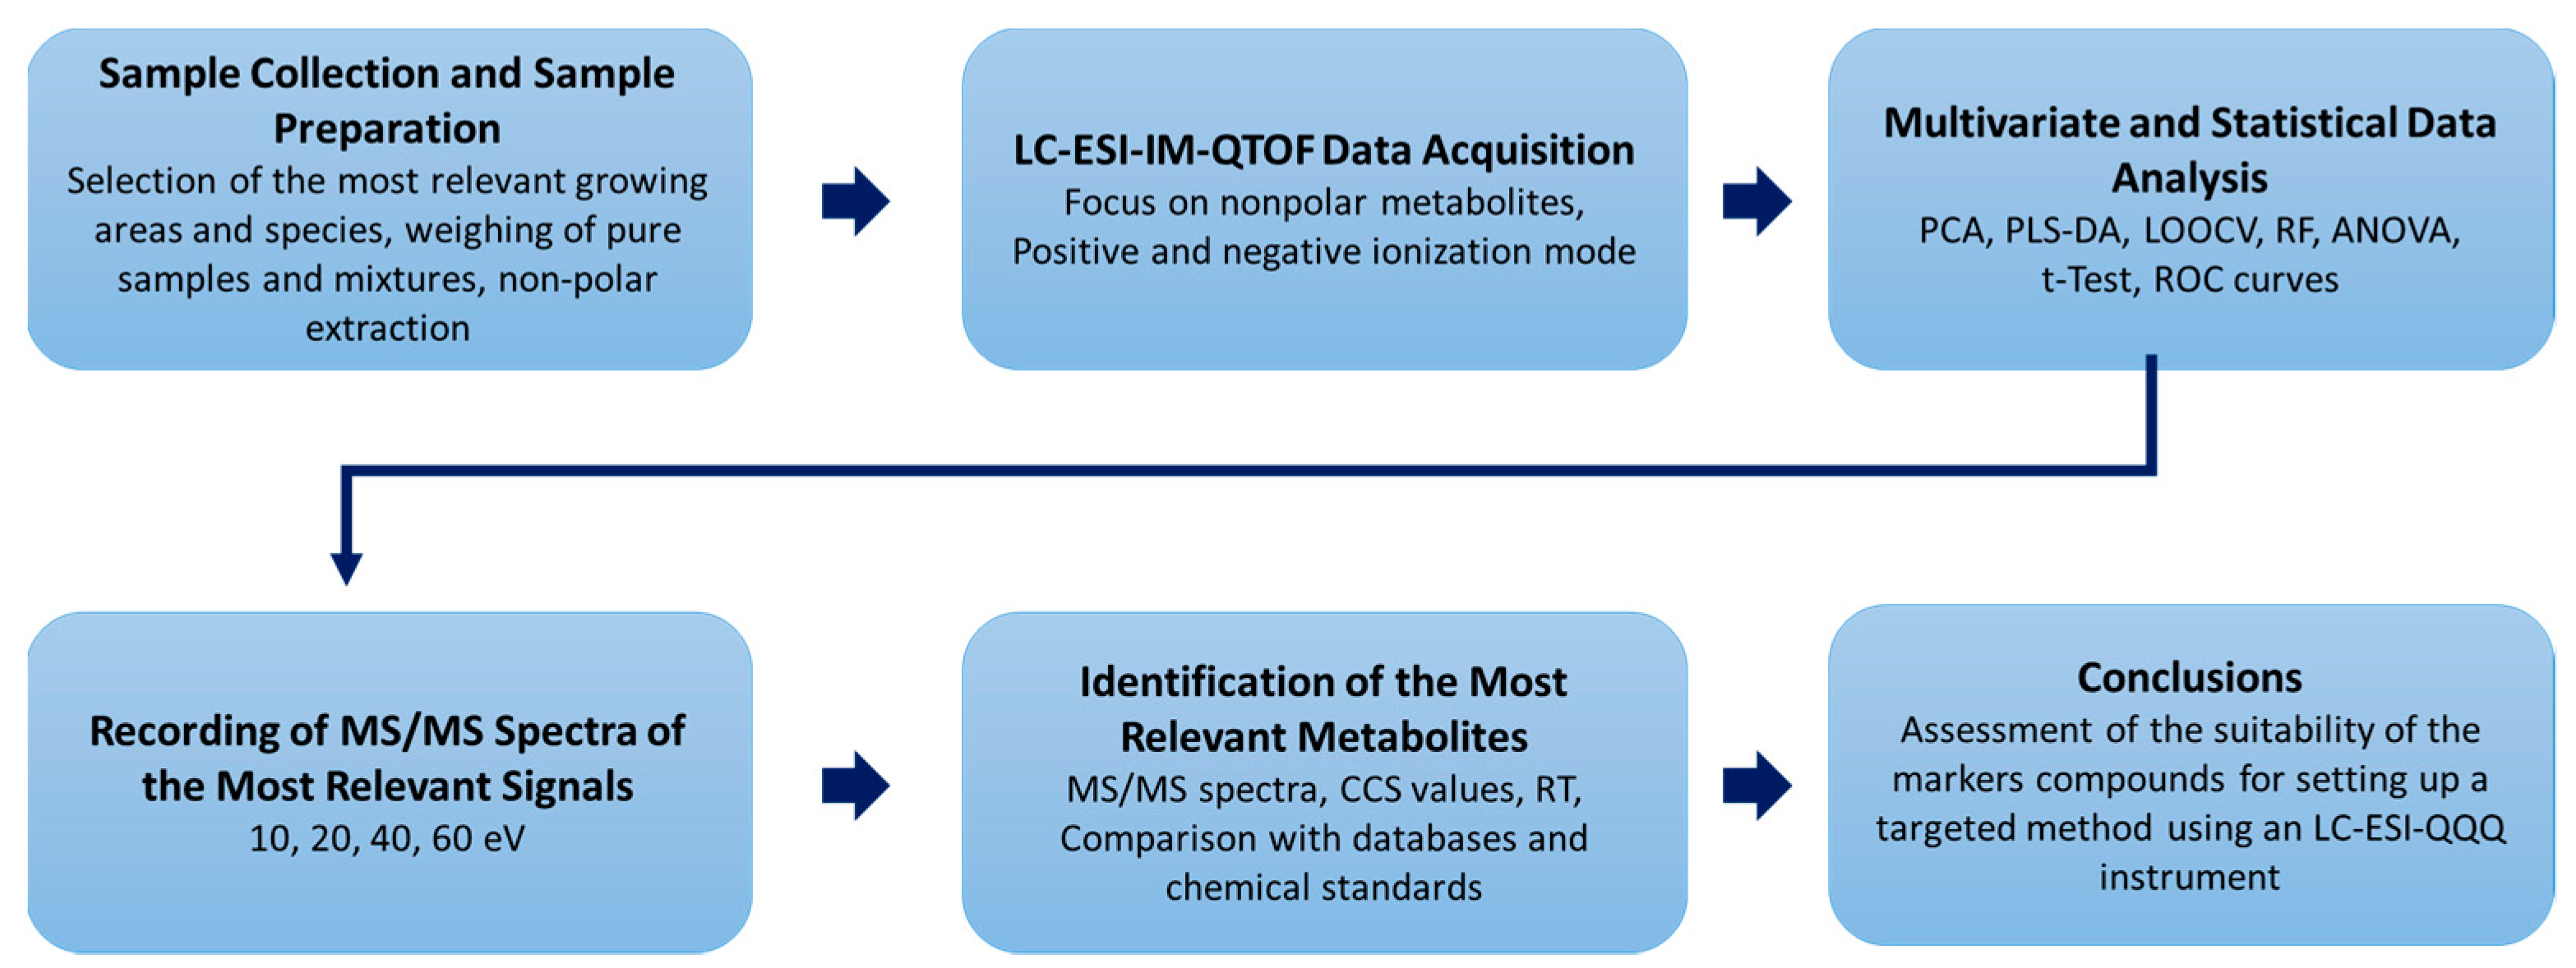
2. Materials and Methods
2.1. Chemicals
2.2. Samples
2.3. Sample Extraction
2.4. LC-ESI-IM-QTOF Analysis
2.5. Data Processing and Multivariate Data Analysis
3. Results
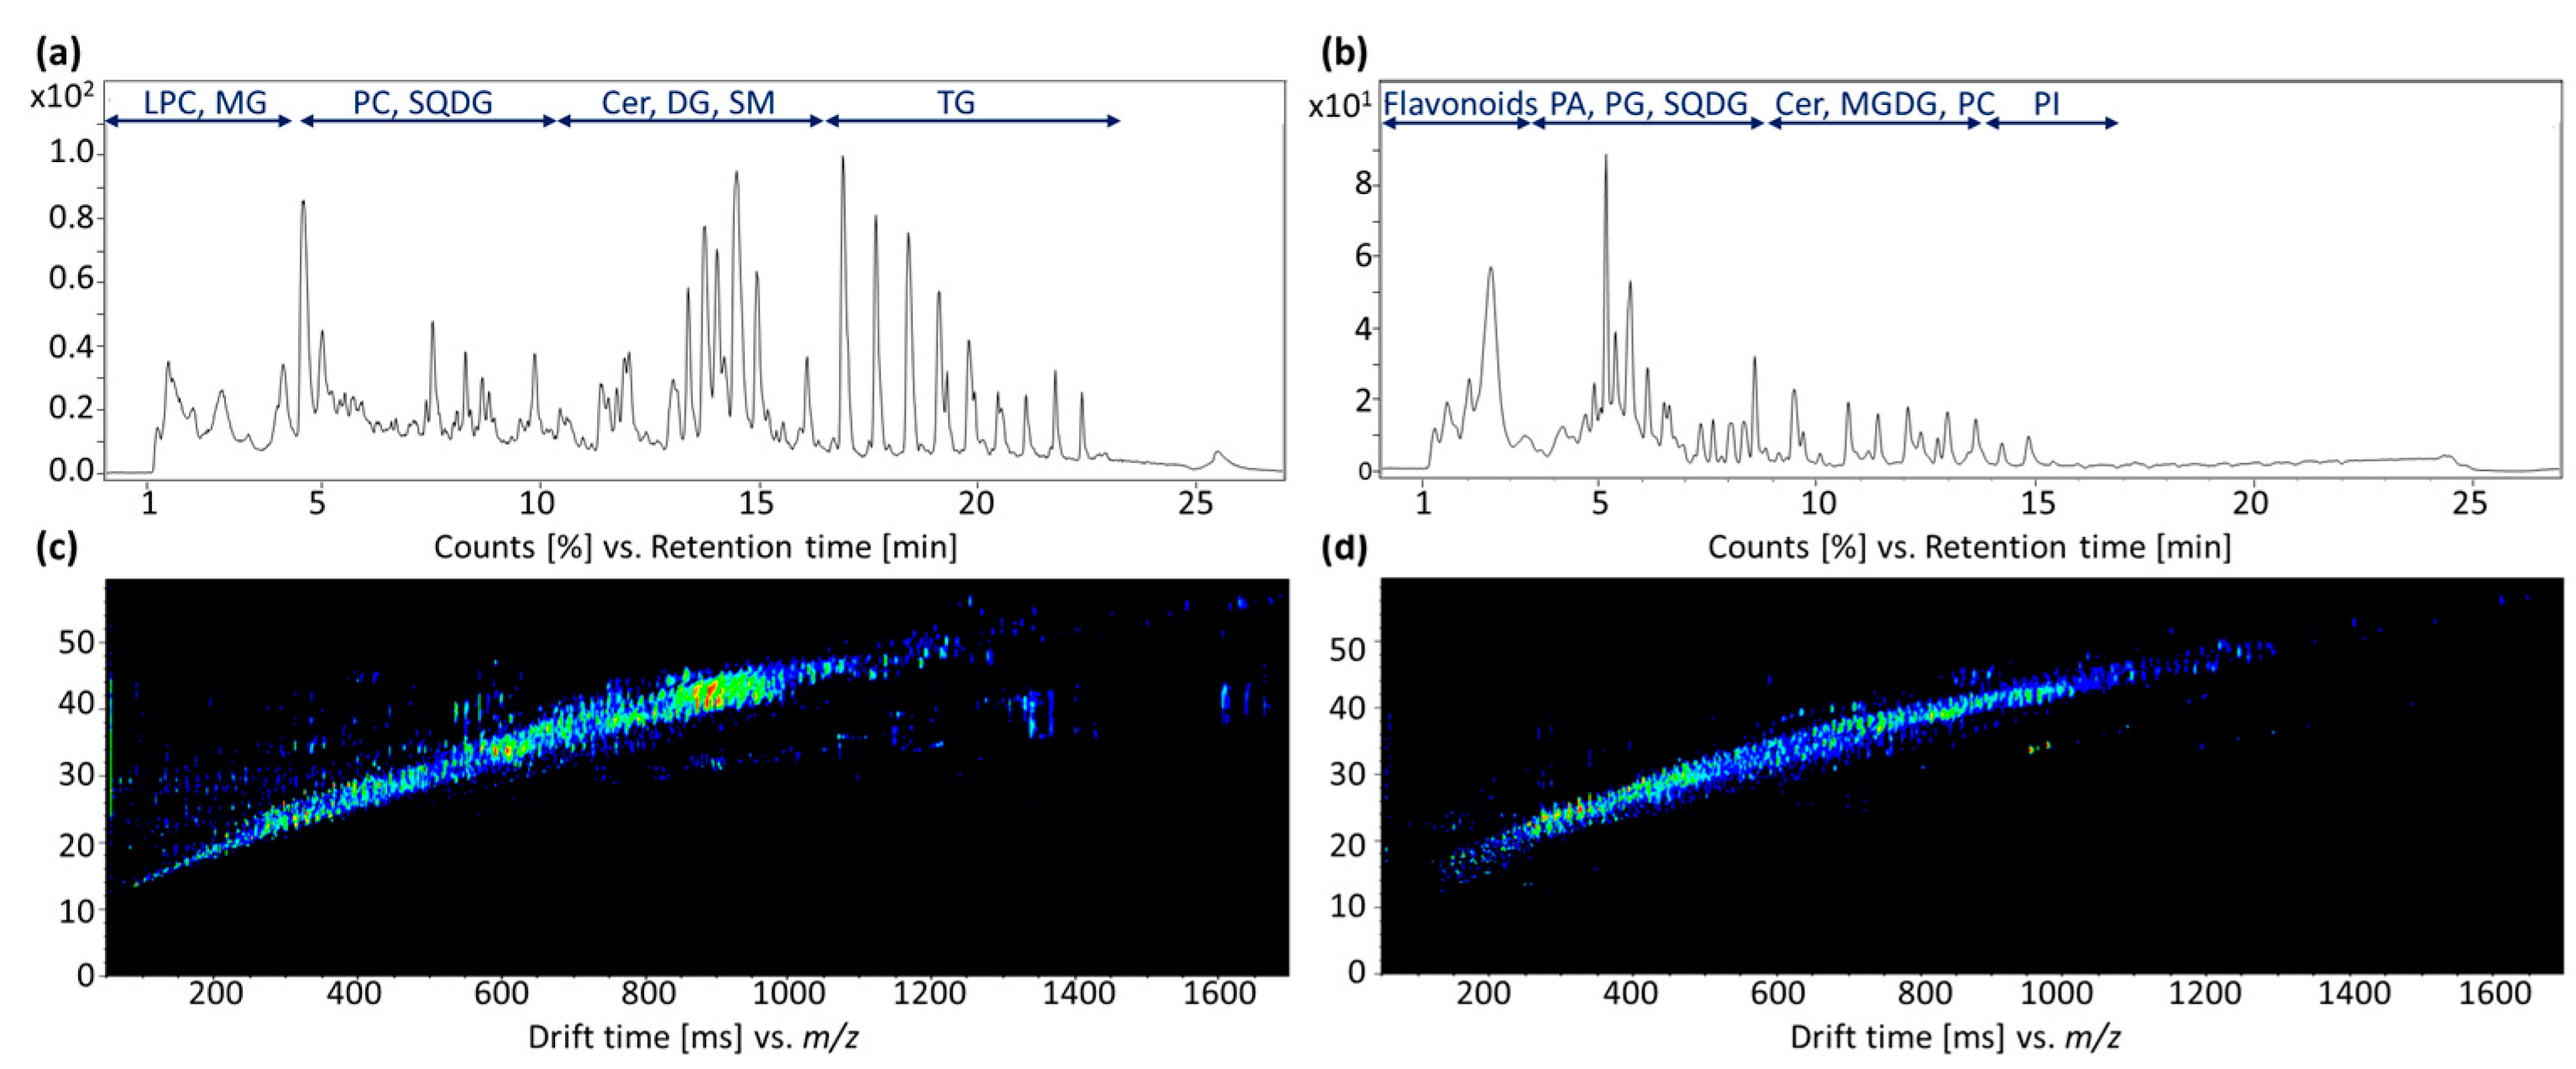
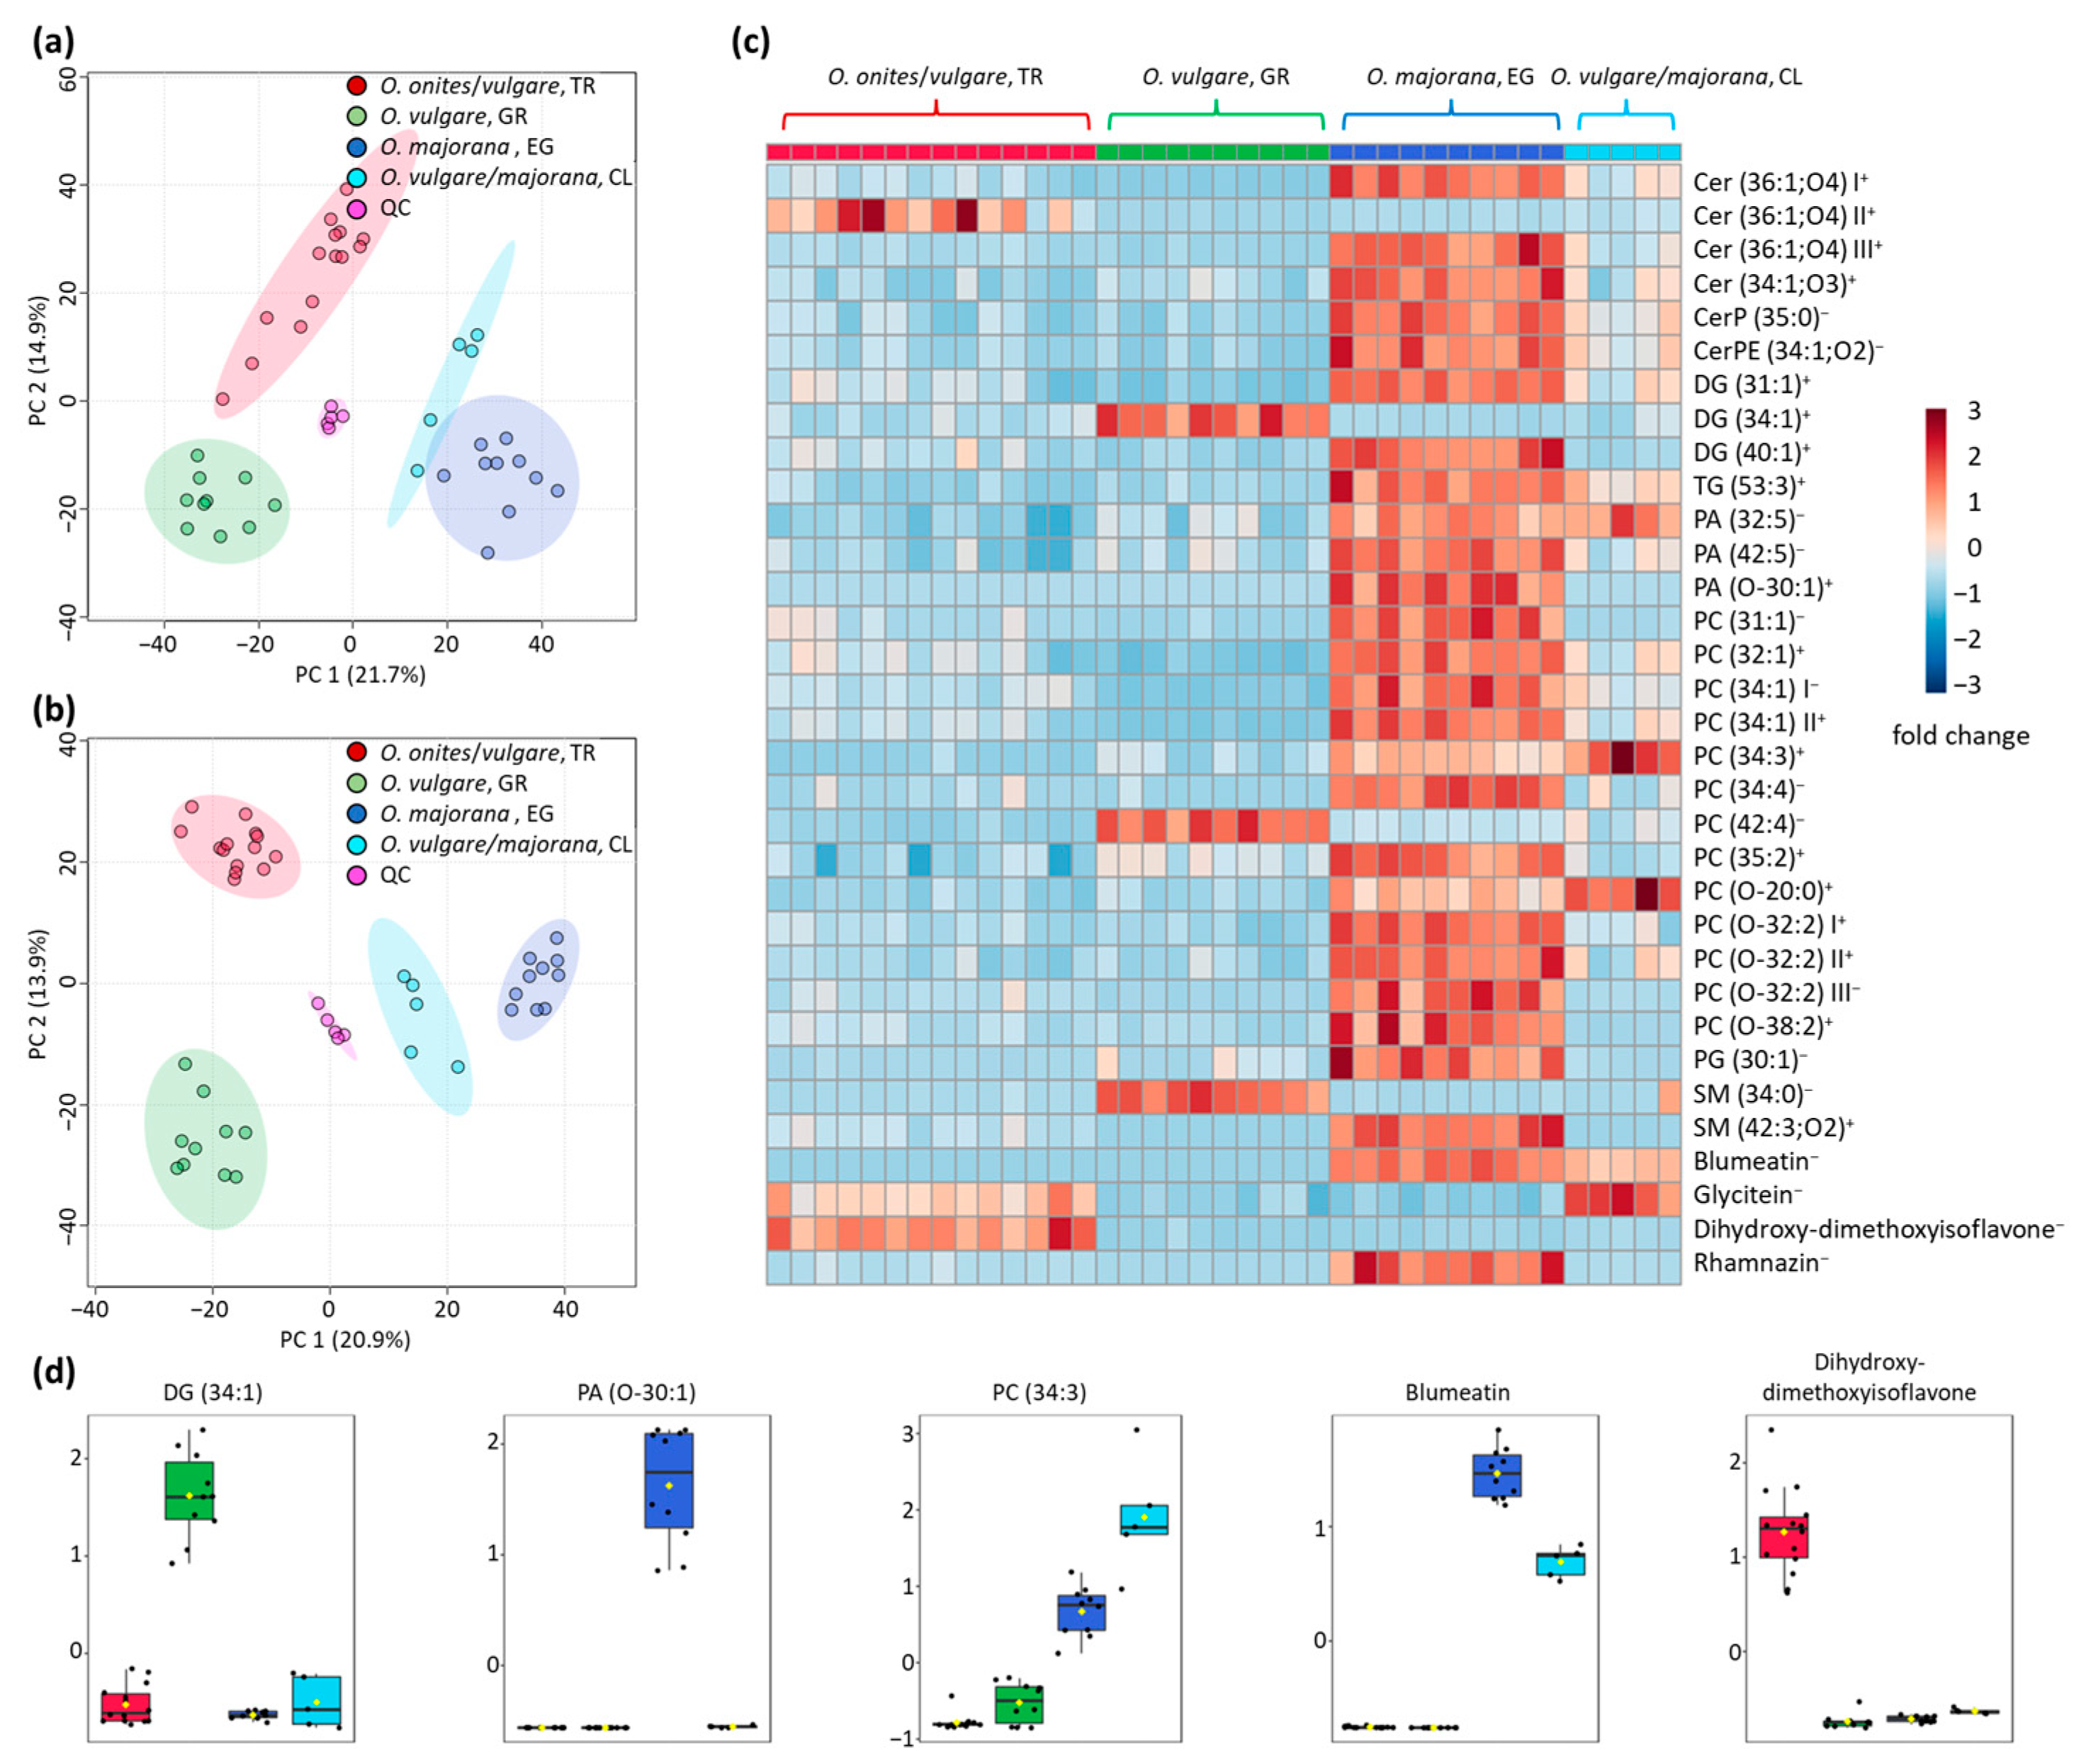
3.1. Differentiation of the Various Species and Geographical Origins
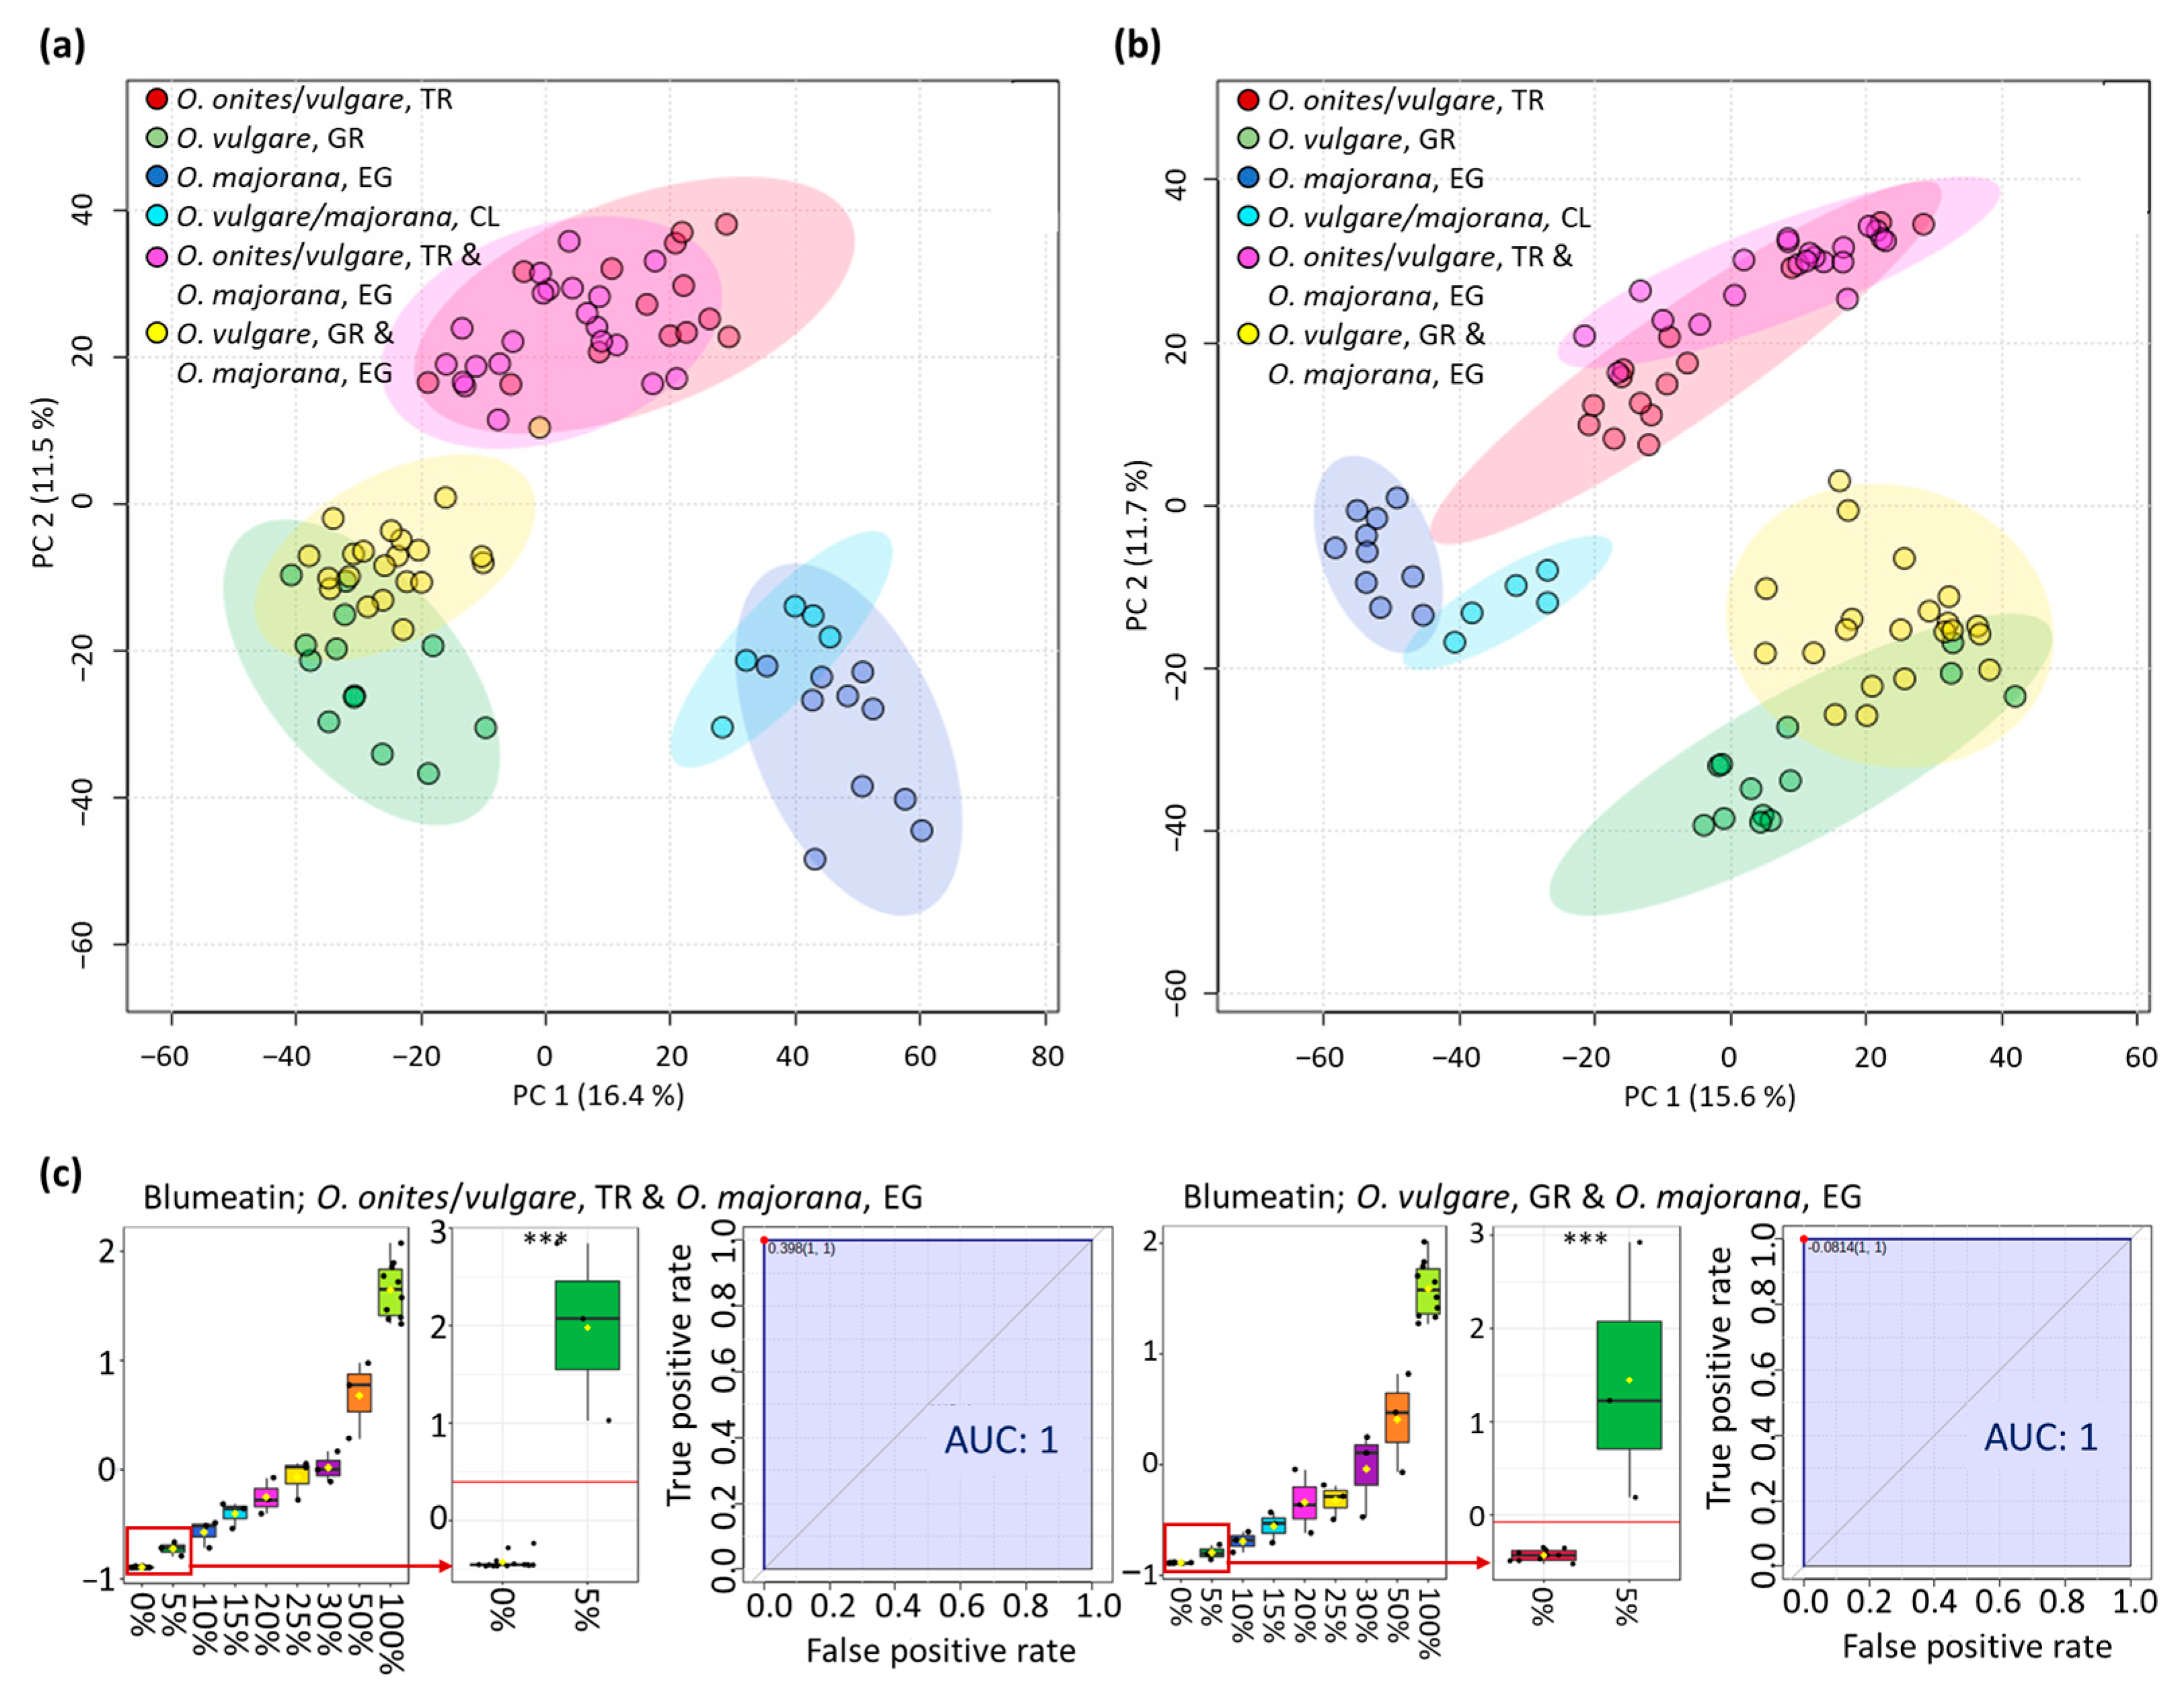
3.2. Analysis of Oregano and Marjoram Mixtures
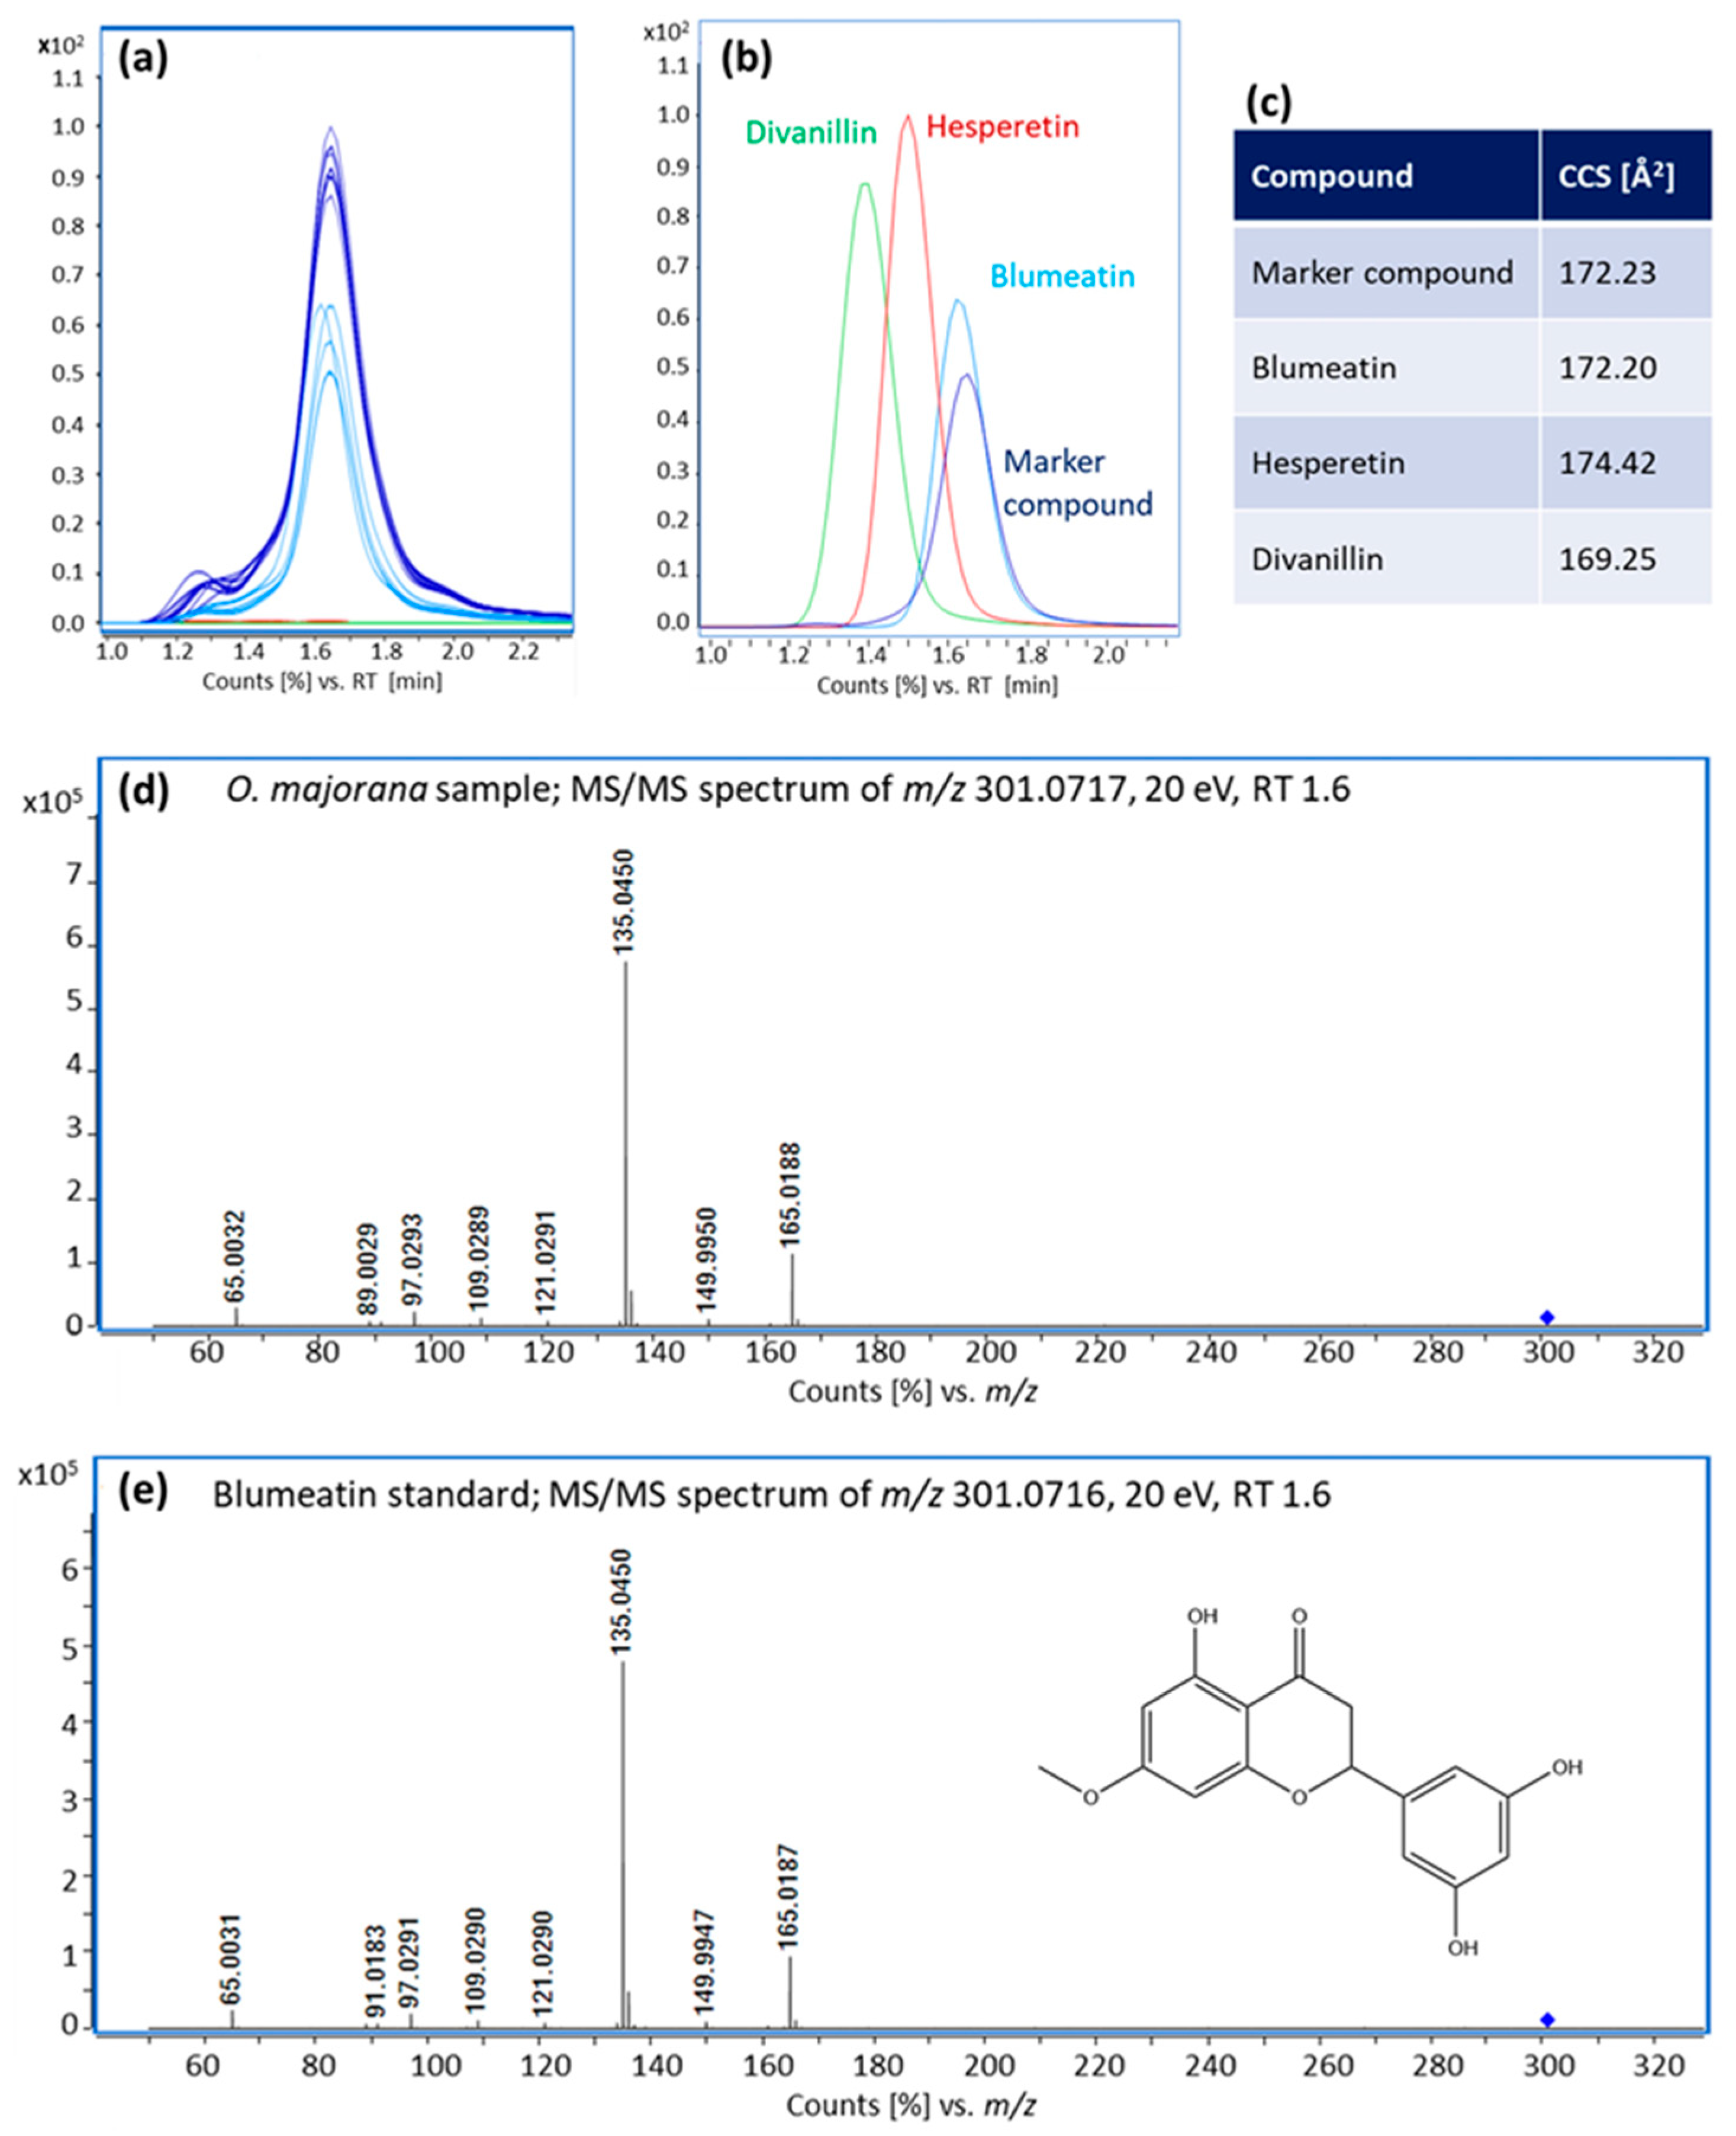
3.3. Identification of Blumeatin as Marker Compound
4. Conclusions
Author Contributions
Funding
Institutional Review Board Statement
Informed Consent Statement
Data Availability Statement
Acknowledgments
Conflicts of Interest
Appendix A

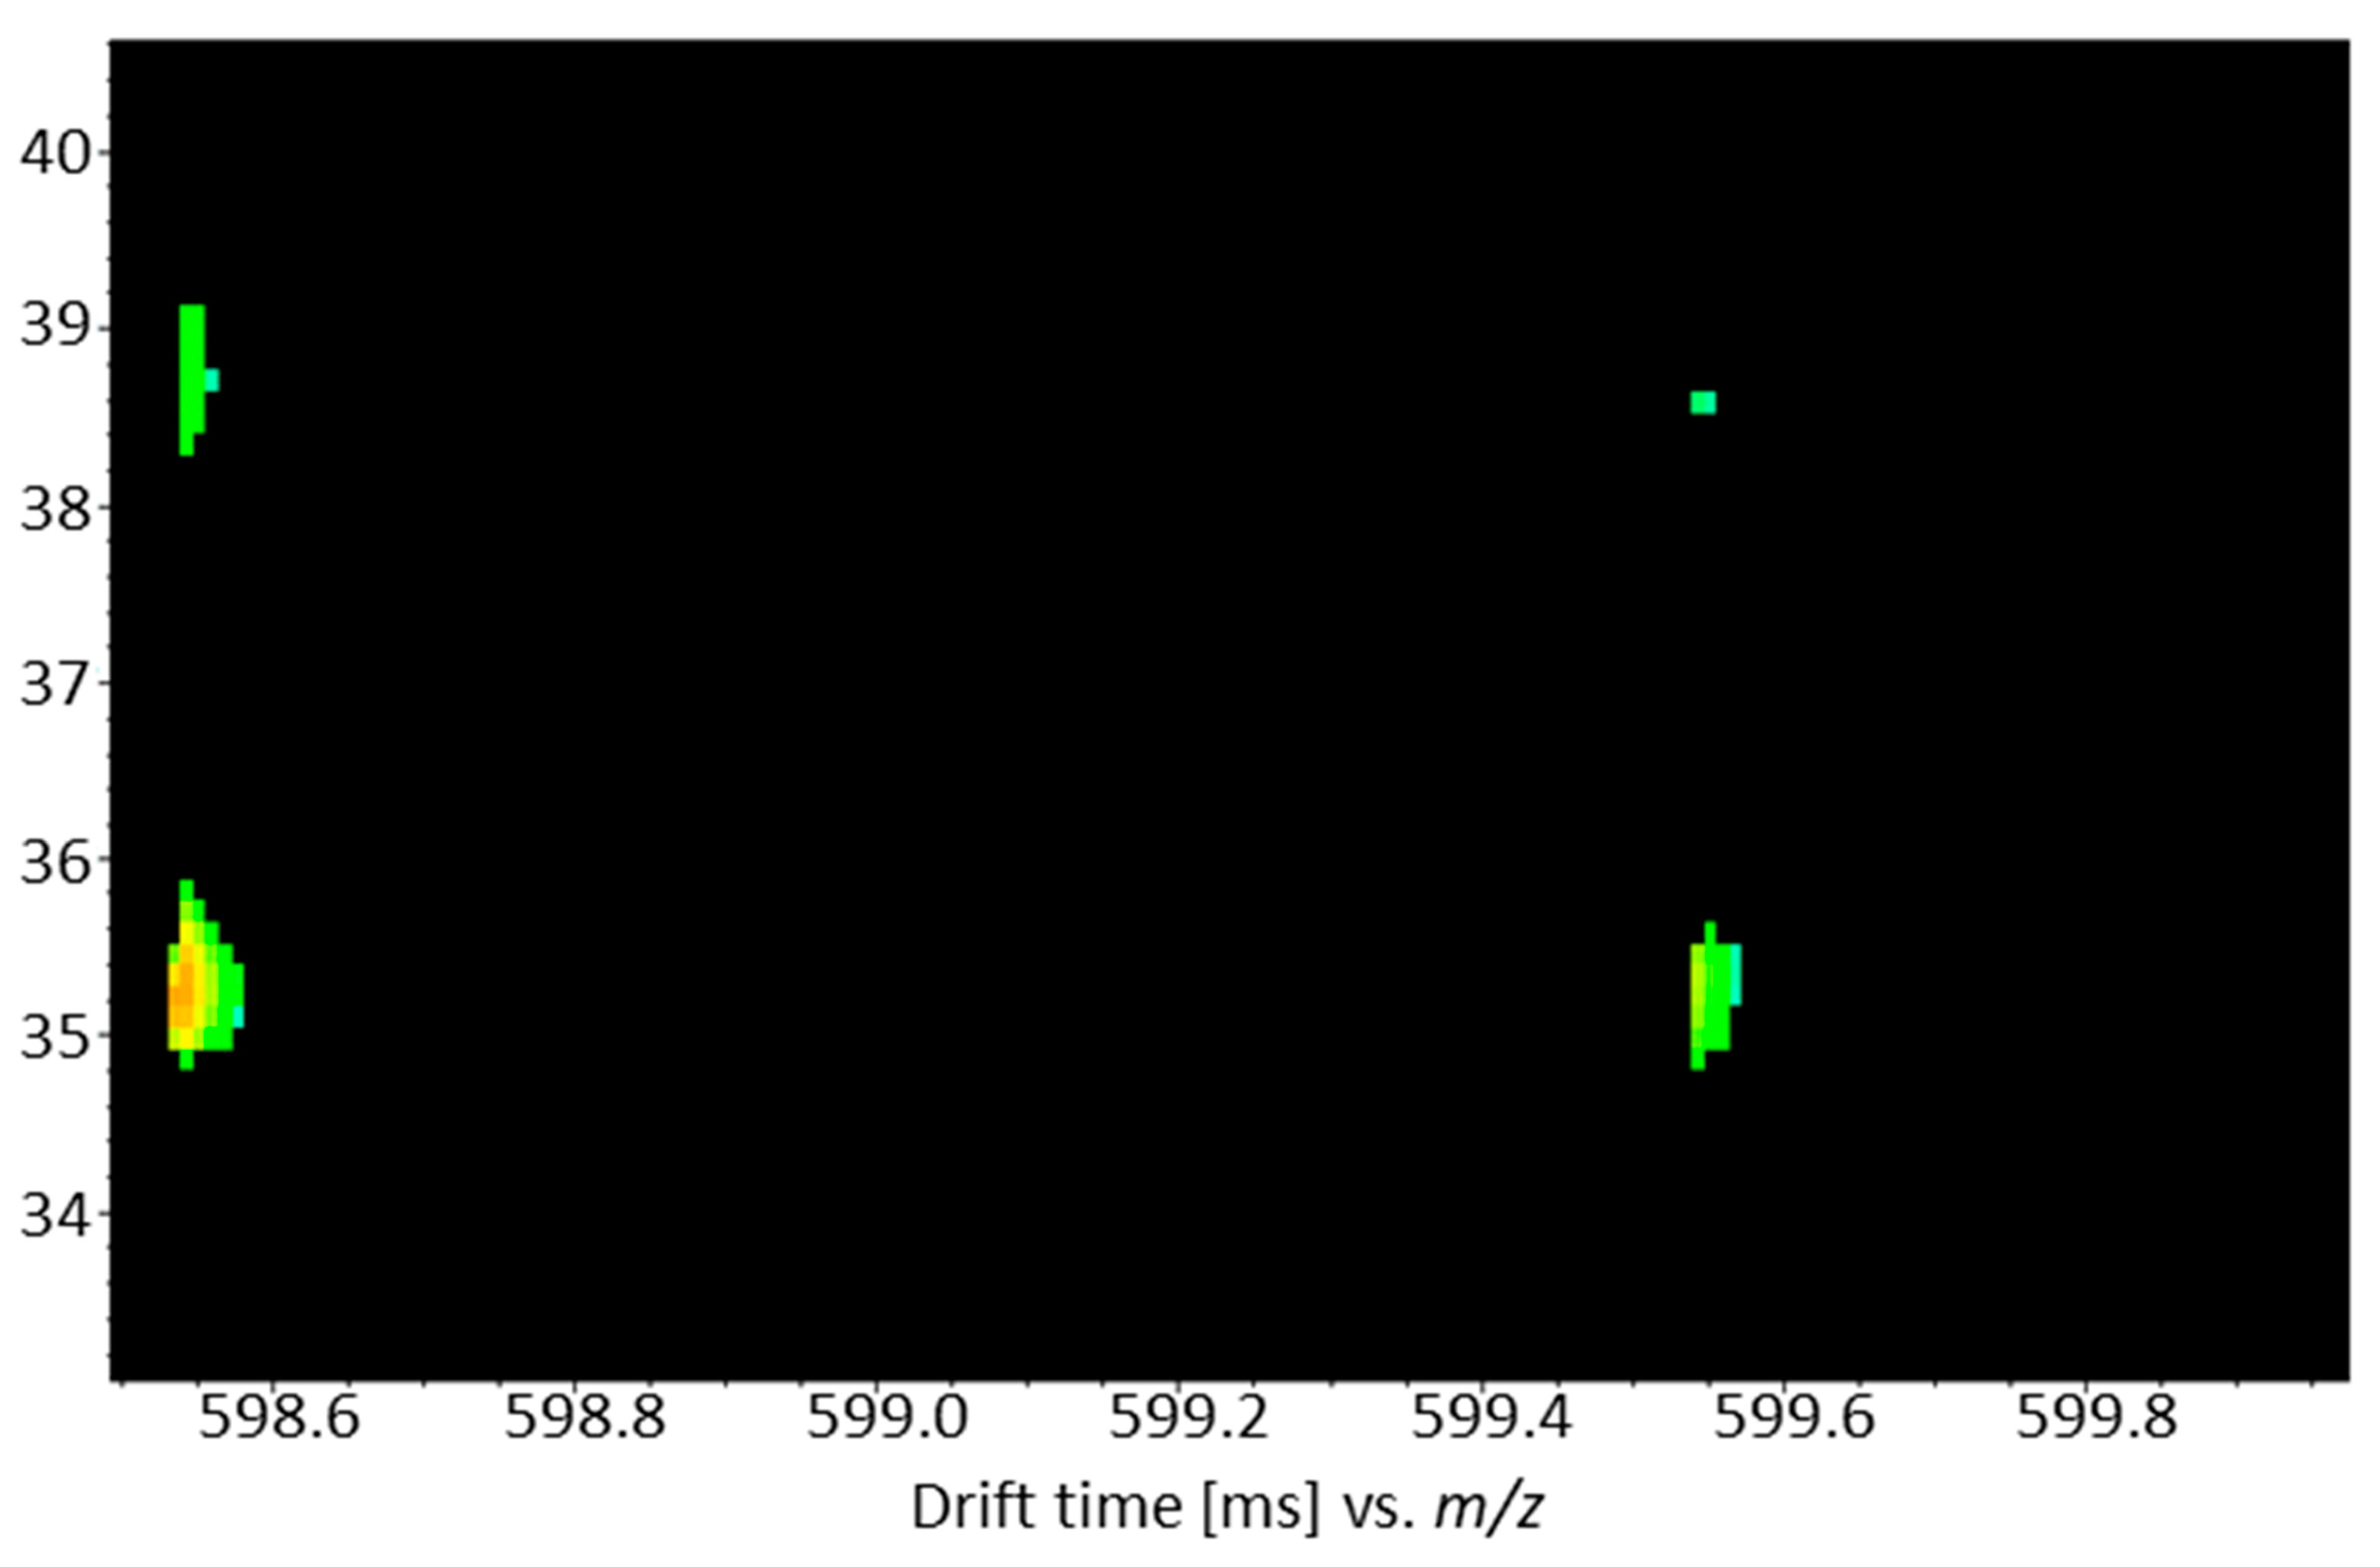
| Tentative Compound | Proposed Formula | RT [min] | Ionization Mode | Adduct | m/z Calculated [Da] | m/z Measured [Da] | Error [ppm] | Relevant Fragments | CCS Value Calculated [Å2] * | CCS Value Measured [Å2] | Delta | FDR |
|---|---|---|---|---|---|---|---|---|---|---|---|---|
| Ceramides | ||||||||||||
| Cer (36:1;O4) | C36H71NO5 | 9.3 | + | [M+H]+ | 598.5405 | 598.5388 | −2.85 | 580.53; 562.52 | / | 262.5 | / | 3.4×10⁻¹⁹ |
| Cer (36:1;O4) | C36H71NO5 | 9.3 | + | [M+H]+ | 598.5405 | 598.5388 | −2.85 | 580.53; 562.52 | / | 287.7 | / | 4.7×10⁻²⁰ |
| Cer (36:1;O4) | C36H71NO5 | 10.2 | + | [M+H]+ | 598.5405 | 598.5389 | −2.68 | 580.53; 562.52 | / | 262.5 | / | 6.1×10⁻¹⁹ |
| Cer (34:1;O3) | C34H67NO4 | 8.6 | + | [M+H]+ | 554.5143 | 554.5122 | −3.77 | 536.50; 518.49 | / | 255.7 | / | 5.5×10⁻¹⁵ |
| CerP (35:0) | C35H72NO6P | 9.8 | - | [M-H]- | 632.5024 | 632.4998 | −4.18 | 614.52; 596.52; 152.99 | / | 260.2 | / | 7.9×10⁻¹⁸ |
| CerPE (34:1;O2) | C36H73N2O6P | 9.7 | - | [M-H]- | 659.5133 | 659.5173 | 5.98 | 641.50; 623.46; 152.99 | 258.5–259.1 | 264.1 | 1.9–2.2 | 2.2×10⁻¹⁶ |
| Glycerolipids | ||||||||||||
| DG (31:1) | C34H64O5 | 8.0 | + | [M+NH4]+ | 570.5092 | 570.5081 | −1.99 | / | 252.2–252.3 | 257.5 | 2.1 | 1.3×10⁻¹⁶ |
| DG (34:1) | C39H68O5 | 12.4 | + | [M+H]+ | 617.5115 | 617.5129 | 2.28 | / | 259.8–263.4 | 259.9 | 0.0–1.3 | 3.5×10⁻¹⁸ |
| DG (40:1) | C43H82O5 | 14.0 | + | [M+NH4]+ | 696.6501 | 696.6533 | 4.79 | / | 282.9 | 284.6 | 0.6 | 1.4×10⁻¹⁶ |
| TG (53:3) | C56H102O6 | 19.6 | + | [M+NH4]+ | 888.8015 | 888.8023 | 0.96 | / | 320.1–322.8 | 337.9 | 4.7–5.5 | 2.1×10⁻¹⁷ |
| Phospholipids | ||||||||||||
| PA (32:5) | C35H59O8P | 4.8 | - | [M+HCOOH-H]- | 683.3930 | 683.3977 | 7.43 | 152.99 | 250.5–251.3 | 253.4 | 0.8–1.2 | 6.1×10⁻¹⁵ |
| PA (42:5) | C45H79O8P | 8.5 | - | [M-H]- | 777.5440 | 777.5442 | 0.28 | 309.28; 152.99 | 276.6–277.2 | 284.2 | 2.5–2.7 | 4.3×10⁻¹⁵ |
| PA (O-30:1) | C33H65O7P | 4.9 | + | [M+H]+ | 605.4564 | 605.4597 | 5.40 | / | 254.3 | 248.2 | 2.4 | 2.0×10⁻¹⁸ |
| PC (31:1) | C39H76NO8P | 7.5 | - | [M-H]- | 716.5236 | 716.5264 | 3.93 | 255.23; 152.99 | 272.8–273.7 | 276.6 | 1.1–1.4 | 5.1×10⁻¹⁷ |
| PC (32:1) | C40H78NO8P | 8.9 | + | [M+H]+ | 732.5538 | 732.5529 | −1.20 | 184.07 | 281.9 | 284.1 | 0.7 | 6.3×10⁻¹⁶ |
| PC (34:1) | C42H82NO8P | 8.8 | - | [M-H]- | 758.5705 | 758.5746 | 5.36 | 283.26; 253.25; 152.99 | 281.9 | 284.5 | 0.9 | 5.1×10⁻¹⁷ |
| PC (34:1) | C42H82NO8P | 10.2 | + | [M+H]+ | 760.5851 | 760.5840 | −1.42 | 184.07 | 288.1–288.2 | 287.8 | 0.1 | 1.5×10⁻¹⁸ |
| PC (34:3) | C42H78NO8P | 8.7 | + | [M+H]+ | 756.5538 | 756.5566 | 3.73 | 184.07 | 283.3–285.4 | 285.5 | 0.1–0.8 | 3.0×10⁻¹⁵ |
| PC (34:4) | C42H76NO8P | 8.5 | - | [M-H]- | 752.5236 | 752.5254 | 2.42 | 152.99 | 276.7–279.2 | 280.0 | 0.3–1.2 | 4.4×10⁻¹⁸ |
| PC (42:4) | C50H92NO8P | 12.3 | - | [M-H]- | 864.6488 | 864.6504 | 1.87 | 152.99 | 299.0–299.8 | 302.2 | 0.8–1.0 | 1.2×10⁻²⁰ |
| PC (35:2) | C43H82NO8P | 9.8 | + | [M+H]+ | 772.5851 | 772.5872 | 2.75 | 184.07 | 287.9–289.1 | 289.2 | 0.0–0.5 | 4.9×10⁻¹⁵ |
| PC (O-20:0) | C28H58NO7P | 6.2 | + | [M+H]+ | 552.4024 | 552.4009 | −2.66 | 184.07 | 243.7–245.0 | 245.0 | 0.0–0.5 | 6.7×10⁻²⁶ |
| PC (O-32:2) | C40H78NO7P | 8.1 | + | [M+H]+ | 716.5589 | 716.5607 | 2.56 | / | 278.2–279.0 | 281.9 | 1.0–1.3 | 2.8×10⁻²⁰ |
| PC (O-32:2) | C40H78NO7P | 8.6 | + | [M+H]+ | 716.5589 | 716.5637 | 6.75 | 184.07 | 278.2–279.0 | 283.3 | 1.5–1.8 | 1.7×10⁻¹⁵ |
| PC (O-32:2) | C40H78NO7P | 8.3 | - | [M-H]- | 714.5443 | 714.5485 | 5.85 | 152.99 | 273.2–274.0 | 276.7 | 1.0–1.3 | 1.5×10⁻¹⁶ |
| PC (O-38:2) | C46H90NO7P | 5.4 | + | [M+H]+ | 800.6528 | 800.6571 | 5.42 | 184.07 | 296.0–297.8 | 297.7 | 0.0–0.6 | 1.1×10⁻¹⁴ |
| PG (30:1) | C36H69O10P | 5.5 | - | [M-H]- | 691.4556 | 691.4528 | −3.98 | 255.23; 225.18 | 256.6 | 261.9 | 3.2 | 9.2×10⁻¹⁵ |
| SM (34:0) | C39H82N2O6P | 12.7 | - | [M-H]- | 704.5838 | 704.5845 | 1.03 | 668.61; 152.99 | / | 276.2 | / | 4.2×10⁻¹⁷ |
| SM (42:3;O2) | C47H91N2O6P | 12.5 | + | [M+NH4]+ | 828.6953 | 828.6943 | −1.23 | 184.07 | 300.7 | 304.4 | 1.2 | 1.9×10⁻²⁰ |
| Flavonoids | ||||||||||||
| Blumeatin | C16H14O6 | 1.6 | - | [M-H]- | 301.0718 | 301.0717 | 0.00 | 165.02; 135.05 | 170.2 | 172.2 | 1.2 | 2.1×10⁻²⁹ |
| Glycitein | C16H12O5 | 2.1 | - | [M-H]- | 283.0612 | 283.0597 | −5.27 | 268.04; 239.03 | 165.3 | 166.0 | 0.4 | 2.6×10⁻¹⁶ |
| 2’,7-Dihydroxy-4’,5’-dimethox-yisoflavone | C17H14O6 | 1.3 | - | [M-H]- | 313.0718 | 313.0696 | −6.88 | 161.02 | 171.9 | 175.2 | 1.9 | 7.9×10⁻¹⁸ |
| Rhamnazin | C17H14O7 | 1.6 | - | [M-H]- | 329.0667 | 329.0648 | −5.68 | 314.04; 299.01; 271.02 | / | 176.9 | / | 1.6×10⁻¹⁸ |

References
- ISO 7925:2015, Dried Oregano (Origanum vulgare L.)—Whole or Ground Leaves—Specification. 2015. Available online: https://www.iso.org/obp/ui/#iso:std:iso:7925:ed-2:v1:en (accessed on 27 October 2022).
- Codex Alimentarius—International Food Standards, Standard for Dried Oregano, CXS 342-2021. 2021. Available online: https://www.fao.org/fao-who-codexalimentarius/sh-proxy/en/?lnk=1&url=https%253A%252F%252Fworkspace.fao.org%252Fsites%252Fcodex%252FStandards%252FCXS%2B342-2021%252FCXS_342e.pdf (accessed on 27 October 2022).
- European Spice Association. List of Culinary Herbs and Spices. 2018. Available online: https://www.esa-spices.org/download/esa-list-of-culinary-herbs-and-spices.pdf (accessed on 27 October 2022).
- European Spice Association. Quality Minima Document. 2015. Available online: https://www.esa-spices.org/download/esa-qmd-rev-5-update-as-per-esa-tc-26-03-18.pdf (accessed on 27 October 2022).
- European Commission. JRC Technical Report, Results of an EU Wide Coordinated Control Plan to Establish the Prevalence of Fraudulent Practices in the Marketing of Herbs and Spices. 2021. Available online: https://publications.jrc.ec.europa.eu/repository/handle/JRC126785 (accessed on 27 October 2022).
- Raclariu-Manolică, A.C.; Anmarkrud, J.A.; Kierczak, M.; Rafati, N.; Thorbek, B.L.G.; Schrøder-Nielsen, A.; de Boer, H.J. DNA metabarcoding for quality control of basil, oregano, and paprika. Front. Plant Sci. 2021, 12, 665618. [Google Scholar] [CrossRef]
- Vannozzi, A.; Lucchin, M.; Barcaccia, G. cpDNA barcoding by combined end-point and real-time PCR analyses to identify and quantify the main contaminants of oregano (Origanum vulgare L.) in commercial batches. Diversity 2018, 10, 98. [Google Scholar] [CrossRef]
- European Spice Association. ESA White Paper on Plant Metabarcoding Next Generation Sequencing (NGS) Analysis Applied to Culinary Herbs and Spices; Version 2, June 2021. Available online: https://www.esa-spices.org/download/esa-white-paper-on-plant-metabarcoding-next-generation-sequencing-ngs-analysis-applied-to-culinary-herbs-and-spices (accessed on 27 October 2022).
- Mandrone, M.; Marincich, L.; Chiocchio, I.; Petroli, A.; Gođevac, D.; Maresca, I.; Poli, F. NMR-based metabolomics for frauds detection and quality control of oregano samples. Food Control 2021, 127, 108141. [Google Scholar] [CrossRef]
- Flügge, F.; Kerkow, T.; Kowalski, P.; Bornhöft, J.; Seemann, E.; Creydt, M.; Schütze, B.; Günther, U.L. Qualitative and quantitative food authentication of oregano using NGS and NMR with chemometrics. Food Control 2023, 145, 109497. [Google Scholar] [CrossRef]
- Black, C.; Haughey, S.A.; Chevallier, O.P.; Galvin-King, P.; Elliott, C.T. A comprehensive strategy to detect the fraudulent adulteration of herbs: The oregano approach. Food Chem. 2016, 210, 551–557. [Google Scholar] [CrossRef] [PubMed]
- Wielogorska, E.; Chevallier, O.; Black, C.; Galvin-King, P.; Delêtre, M.; Kelleher, C.T.; Haughey, S.A.; Elliott, C.T. Development of a comprehensive analytical platform for the detection and quantitation of food fraud using a biomarker approach. The oregano adulteration case study. Food Chem. 2018, 239, 32–39. [Google Scholar] [CrossRef]
- Damiani, T.; Dreolin, N.; Stead, S.; Dall’Asta, C. Critical evaluation of ambient mass spectrometry coupled with chemometrics for the early detection of adulteration scenarios in Origanum vulgare L. Talanta 2021, 227, 122116. [Google Scholar] [CrossRef] [PubMed]
- Massaro, A.; Negro, A.; Bragolusi, M.; Miano, B.; Tata, A.; Suman, M.; Piro, R. Oregano authentication by mid-level data fusion of chemical fingerprint signatures acquired by ambient mass spectrometry. Food Control 2021, 126, 108058. [Google Scholar] [CrossRef]
- Van De Steene, J.; Ruyssinck, J.; Fernandez-Pierna, J.-A.; Vandermeersch, L.; Maes, A.; Van Langenhove, H.; Walgraeve, J.; Demeestere, K.; De Meulenaer, B.; Jacxsens, L.; et al. Authenticity analysis of oregano: Development, validation and fitness for use of several food fingerprinting techniques. Food Res. Int. 2022, 162, 111962. [Google Scholar] [CrossRef]
- Nahar, L.; Al-Groshi, A.; Kumar, A.; Sarker, S.D. Arbutin: Occurrence in plants, and its potential as an anticancer agent. Molecules 2022, 27, 8786. [Google Scholar] [CrossRef]
- Lukas, B.; Schmiderer, C.; Mitteregger, U.; Novak, J. Arbutin in marjoram and oregano. Food Chem. 2010, 121, 185–190. [Google Scholar] [CrossRef]
- Novak, J. Arbutin—A risk substance in herbs? J. Med. Spice Plants 2010, 15, 170–173. [Google Scholar]
- Creydt, M.; Fischer, M. Food authentication: Truffle species classification by non-targeted lipidomics analyses using mass spectrometry assisted by ion mobility separation. Mol. Omi. 2022, 18, 616–626. [Google Scholar] [CrossRef] [PubMed]
- Schütz, D.; Achten, E.; Creydt, M.; Riedl, J.; Fischer, M. Non-targeted LC-MS metabolomics approach towards an authentication of the geographical origin of grain maize (Zea mays L.) samples. Foods 2021, 10, 2160. [Google Scholar] [CrossRef]
- Creydt, M.; Hudzik, D.; Rurik, M.; Kohlbacher, O.; Fischer, M. Food authentication: Small-molecule profiling as a tool for the geographic discrimination of German white asparagus. J. Agric. Food Chem. 2018, 66, 13328–13339. [Google Scholar] [CrossRef] [PubMed]
- Bligh, E.; Dyer, W. A rapid method of total lipid extraction and purification. Can. J. Biochem. Physiol. 1959, 37, 911–917. [Google Scholar] [CrossRef]
- Creydt, M.; Arndt, M.; Hudzik, D.; Fischer, M. Plant metabolomics: Evaluation of different extraction parameters for nontargeted UPLC-ESI-QTOF-mass spectrometry at the example of white Asparagus officinalis. J. Agric. Food Chem. 2018, 66, 12876–12887. [Google Scholar] [CrossRef]
- Reisdorph, R.; Michel, C.; Quinn, K.; Doenges, K.; Reisdorph, N. Untargeted differential metabolomics analysis using drift tube ion mobility-mass spectrometry. In Ion Mobility-Mass Spectrometry: Methods and Protocols; Paglia, G., Astarita, G., Eds.; Springer US: New York, NY, USA, 2020; Volume 2084, pp. 55–78. [Google Scholar] [CrossRef]
- Noonan, M.J.; Tinnesand, H.V.; Buesching, C.D. Normalizing Gas-Chromatography–Mass Spectrometry Data: Method Choice can Alter Biological Inference. BioEssays 2018, 40, 1700210. [Google Scholar] [CrossRef]
- Filzmoser, P.; Walczak, B. What can go wrong at the data normalization step for identification of biomarkers? J. Chromatogr. A 2014, 1362, 194–205. [Google Scholar] [CrossRef] [PubMed]
- Di Guida, R.; Engel, J.; Allwood, J.W.; Weber, R.J.; Jones, M.R.; Sommer, U.; Viant, M.R.; Dunn, W.B. Non-targeted UHPLC-MS metabolomic data processing methods: A comparative investigation of normalisation, missing value imputation, transformation and scaling. Metabolomics 2016, 12, 93. [Google Scholar] [CrossRef]
- Breiman, L. Random forests. Mach. Learn. 2001, 45, 5–32. [Google Scholar] [CrossRef]
- Benjamini, Y.; Hochberg, Y. Controlling the false discovery rate: A practical and powerful approach to multiple testing. J. R. Stat. Soc. 1995, 57, 289–300. [Google Scholar] [CrossRef]
- Armitage, E.G.; Godzien, J.; Alonso-Herranz, V. López-Gonzálvez, Á.; Barbas, C. Missing value imputation strategies for metabolomics data. Electrophoresis 2015, 36, 3050–3060. [Google Scholar] [CrossRef]
- Creydt, M.; Fischer, M. Food metabolomics: Latest hardware—Developments for nontargeted food authenticity and food safety testing. Electrophoresis 2022, 43, 2334–2350. [Google Scholar] [CrossRef] [PubMed]
- Kyle, J.E.; Zhang, X.; Weitz, K.K.; Monroe, M.E.; Ibrahim, Y.M.; Moore, R.J.; Che, J.; Sun, X.; Lovelace, E.S.; Wagoner, J.; et al. Uncovering biologically significant lipid isomers with liquid chromatography, ion mobility spectrometry and mass spectrometry. Analyst 2016, 141, 1649–1659. [Google Scholar] [CrossRef] [PubMed]
- Zhou, Z.; Luo, M.; Chen, X.; Yin, Y.; Xiong, X.; Wang, R.; Zhu, Z.-J. Ion mobility collision cross-section atlas for known and unknown metabolite annotation in untargeted metabolomics. Nat. Commun. 2020, 11, 4334. [Google Scholar] [CrossRef] [PubMed]
- Erenler, R.; Sen, O.; Aksit, H.; Demirtas, I.; Yaglioglu, A.S.; Elmastas, M.; Telci, I. Isolation and identification of chemical constituents from Origanum majorana and investigation of antiproliferative and antioxidant activities. J. Sci. Food Agric. 2015, 96, 822–836. [Google Scholar] [CrossRef]
- Carotenuto, A.; Fattorusso, E.; Lanzotti, V.; Magno, S. Porric acids A-C—New antifungal dibenzofurans from the bulbs of Allium porrum L. Eur. J. Org. Chem. 1998, 4, 661–663. [Google Scholar] [CrossRef]
- Schymanski, E.L.; Jeon, J.; Gulde, R.; Fenner, K.; Ruff, M.; Singer, H.P.; Hollender, J. Identifying small molecules via high resolution mass spectrometry: Communicating confidence. Environ. Sci. Technol. 2014, 48, 2097–2098. [Google Scholar] [CrossRef] [PubMed]
- Nessa, F.; Ismail, Z.; Mohamed, N.; Haris, M.R.H.M. Free radical-scavenging activity of organic extracts and of pure flavonoids of Blumea balsamifera DC leaves. Food Chem. 2004, 88, 243–252. [Google Scholar] [CrossRef]
- Chen, Y.; Zhang, H.; Su, Z. Detailed studies on the anticancer action of Blumeatin flavanone in human oral carcinoma cells: Determining its impact on cellular autophagy, DNA damage and cell migration and invasion. J. BUON 2020, 25, 2011–2016. [Google Scholar] [PubMed]
- Zhou, L.; Wang, S.; Qu, J.; Zhou, H.; Attia, F.A.-Z.; Kang, W.; Xi, X.; Liu, Z. Anti-inflammatory phytoconstituents of Origanum majorana. J. Food Qual. 2022, 2022, 1–7. [Google Scholar] [CrossRef]


Disclaimer/Publisher’s Note: The statements, opinions and data contained in all publications are solely those of the individual author(s) and contributor(s) and not of MDPI and/or the editor(s). MDPI and/or the editor(s) disclaim responsibility for any injury to people or property resulting from any ideas, methods, instructions or products referred to in the content. |
© 2023 by the authors. Licensee MDPI, Basel, Switzerland. This article is an open access article distributed under the terms and conditions of the Creative Commons Attribution (CC BY) license (https://creativecommons.org/licenses/by/4.0/).
Share and Cite
Creydt, M.; Flügge, F.; Dammann, R.; Schütze, B.; Günther, U.L.; Fischer, M. Food Fingerprinting: LC-ESI-IM-QTOF-Based Identification of Blumeatin as a New Marker Metabolite for the Detection of Origanum majorana Admixtures to O. onites/vulgare. Metabolites 2023, 13, 673. https://doi.org/10.3390/metabo13050673
Creydt M, Flügge F, Dammann R, Schütze B, Günther UL, Fischer M. Food Fingerprinting: LC-ESI-IM-QTOF-Based Identification of Blumeatin as a New Marker Metabolite for the Detection of Origanum majorana Admixtures to O. onites/vulgare. Metabolites. 2023; 13(5):673. https://doi.org/10.3390/metabo13050673
Chicago/Turabian StyleCreydt, Marina, Friedemann Flügge, Robin Dammann, Burkhard Schütze, Ulrich L. Günther, and Markus Fischer. 2023. "Food Fingerprinting: LC-ESI-IM-QTOF-Based Identification of Blumeatin as a New Marker Metabolite for the Detection of Origanum majorana Admixtures to O. onites/vulgare" Metabolites 13, no. 5: 673. https://doi.org/10.3390/metabo13050673