
Untargeted UHPLC-TOF/MS Lipidomic Analysis for the Investigation of Egg Yolks after Xylanase Supplementation of the Diet of Laying Hens


 , , , and
Abstract
:1. Introduction
2. Materials and Methods
2.1. Chemicals and Reagents
2.2. Experimental Design and Housing of Animals
2.3. Ethical Considerations
2.4. Sample Preparation
2.5. Lipid Profiling Analysis (UHPC-TOF/MS)
2.6. Data Processing and Chemometrics
3. Results
3.1. UHPLC-TOF/MS Lipidomic Analysis
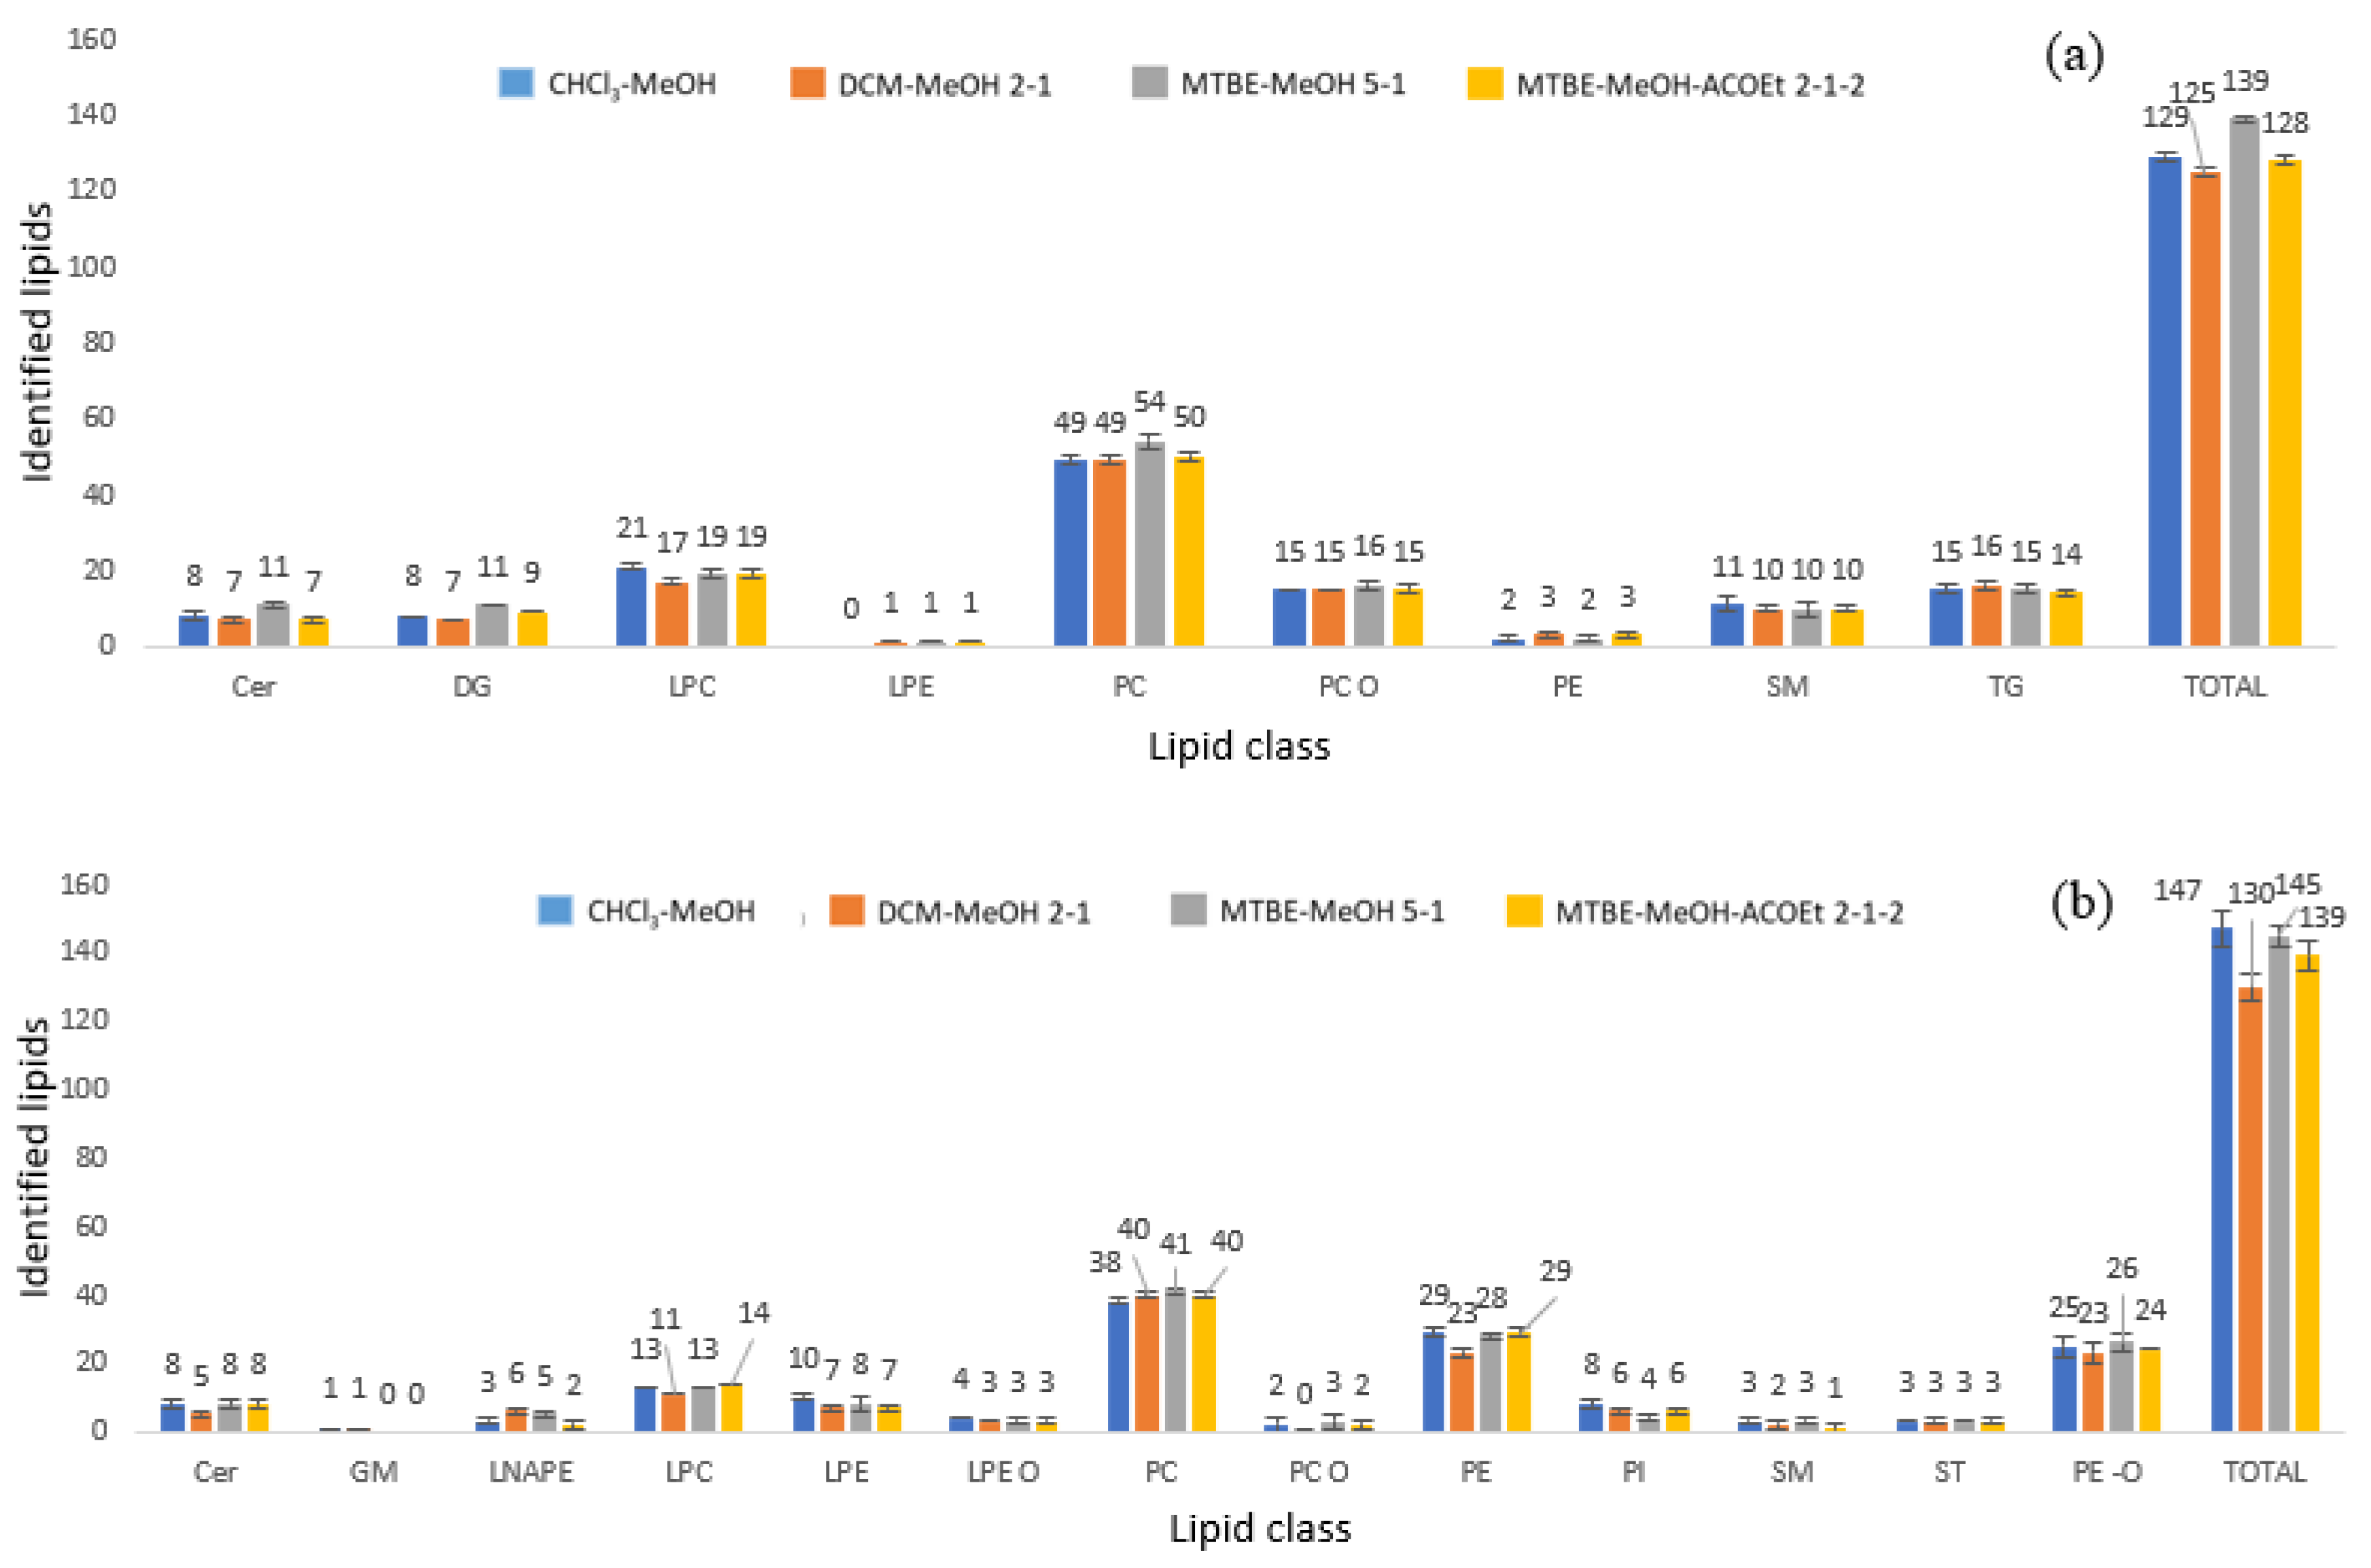
3.2. Sample Preparation Optimisation
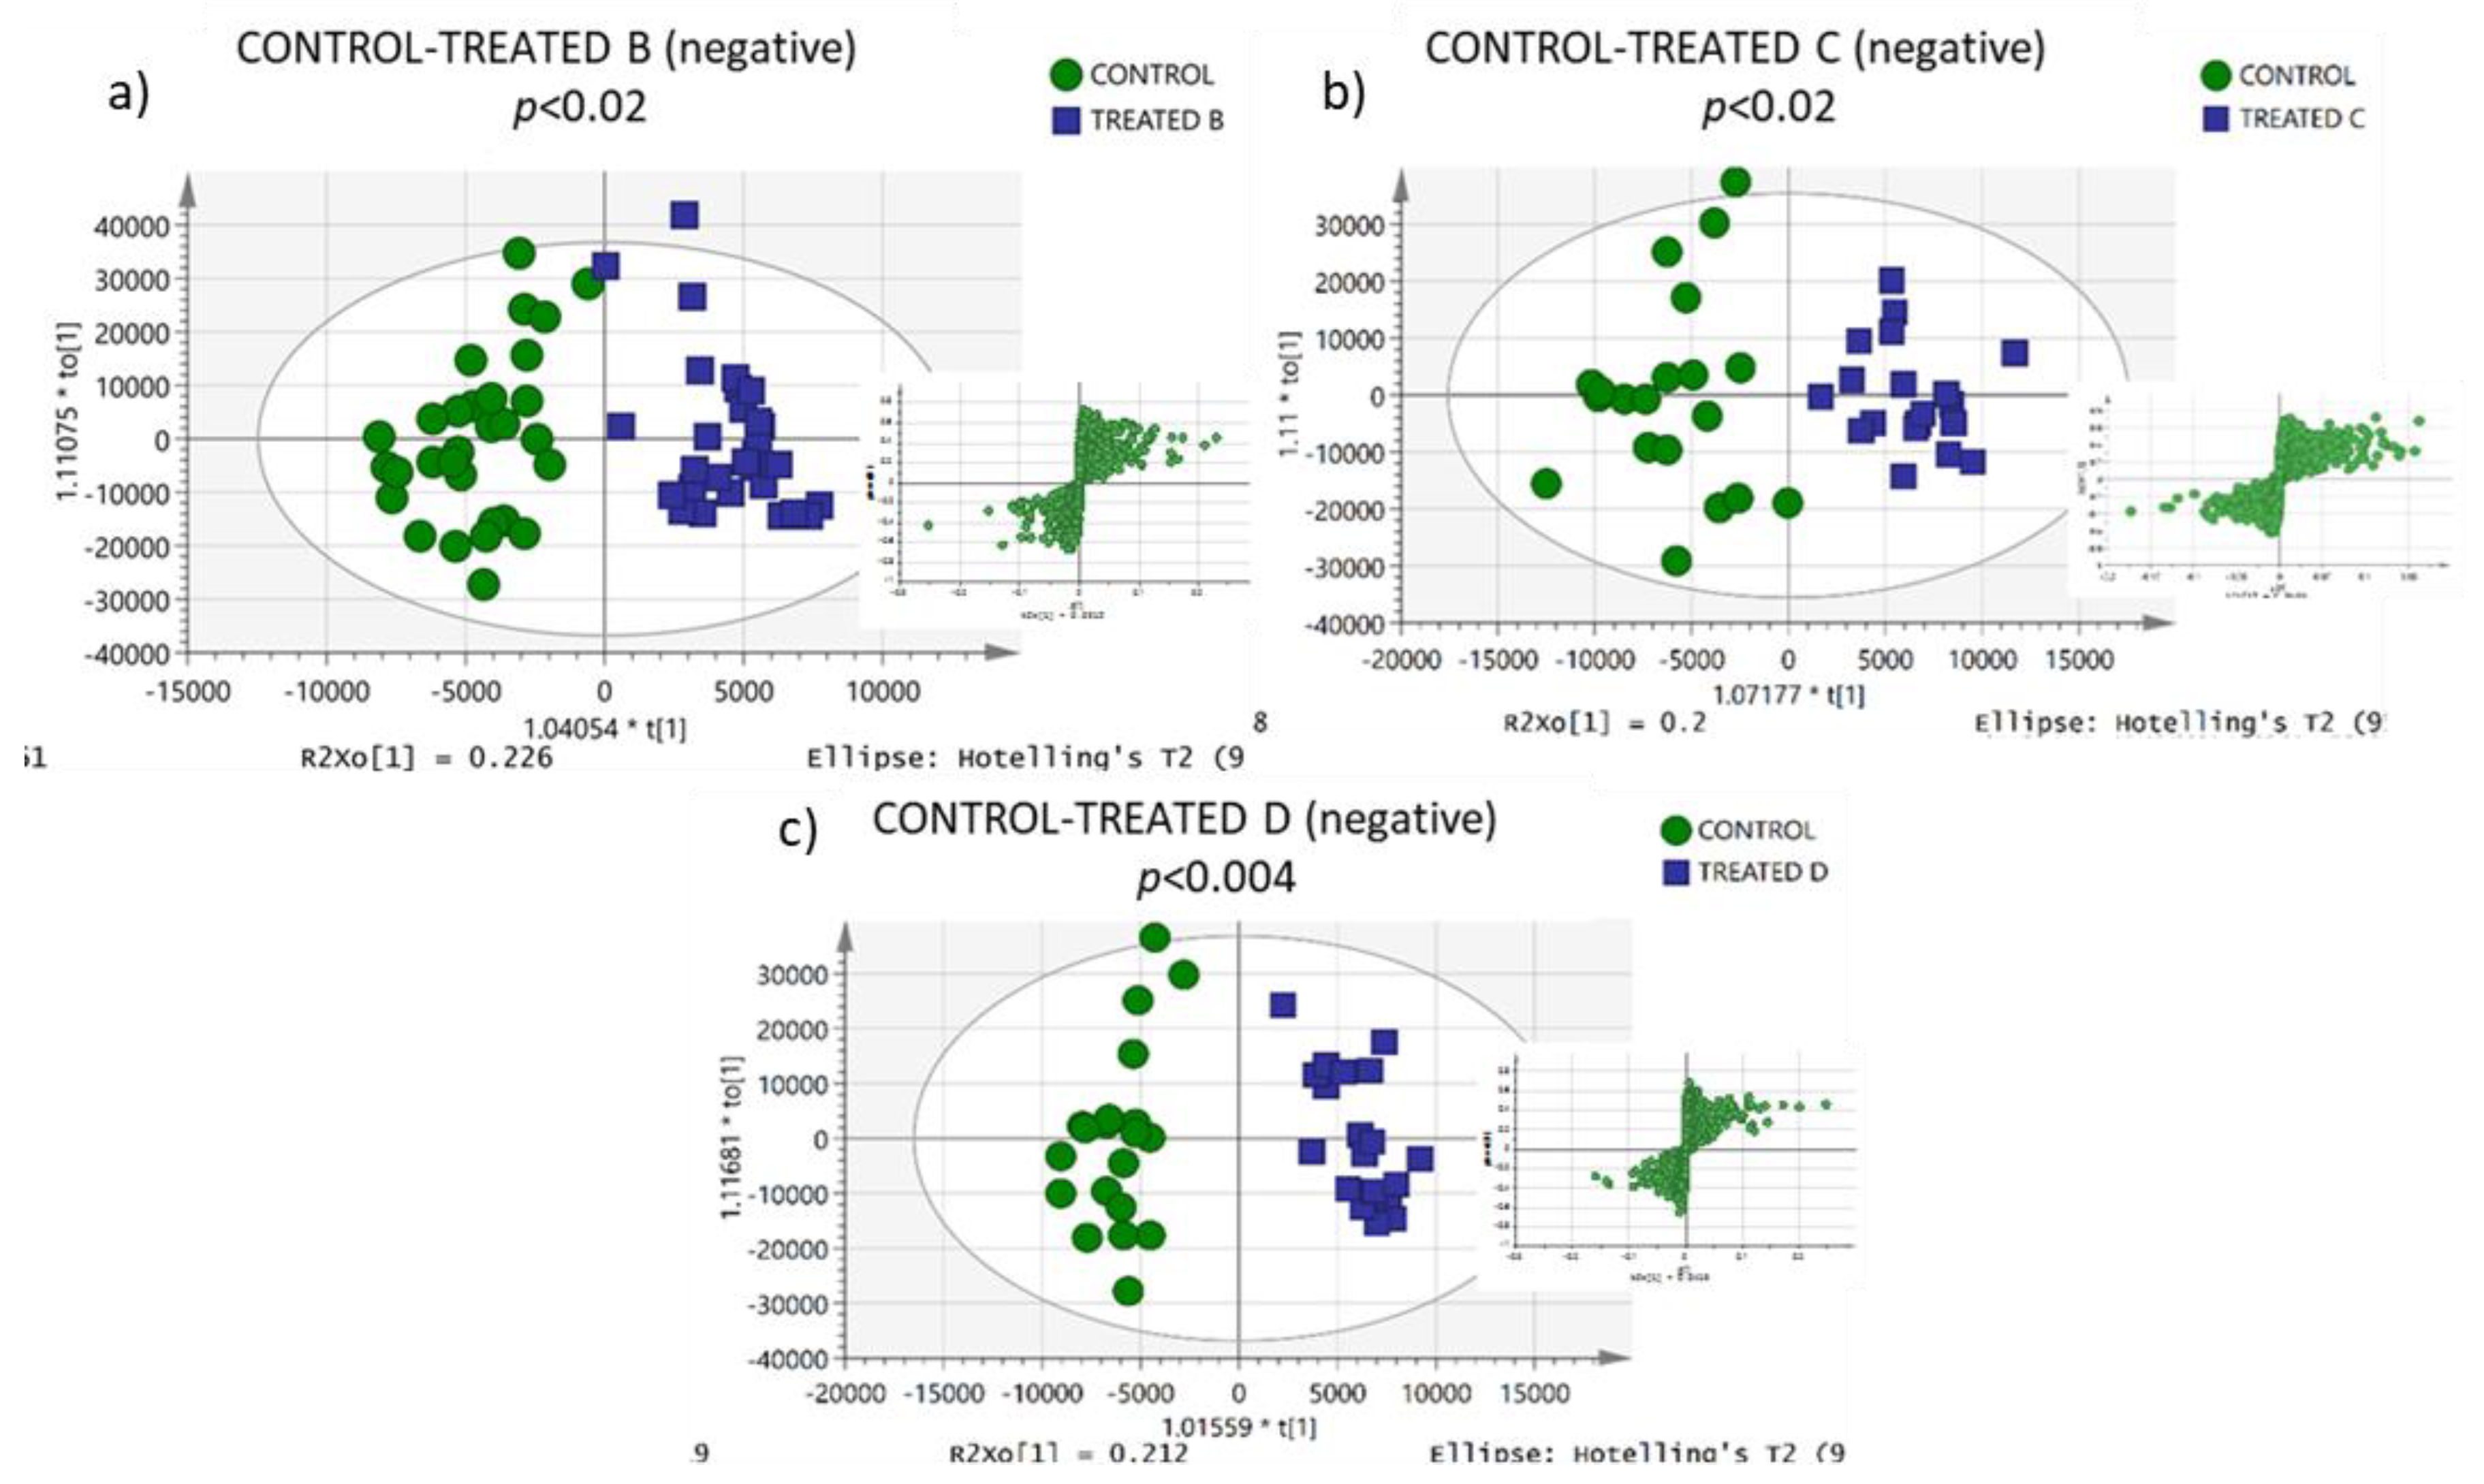
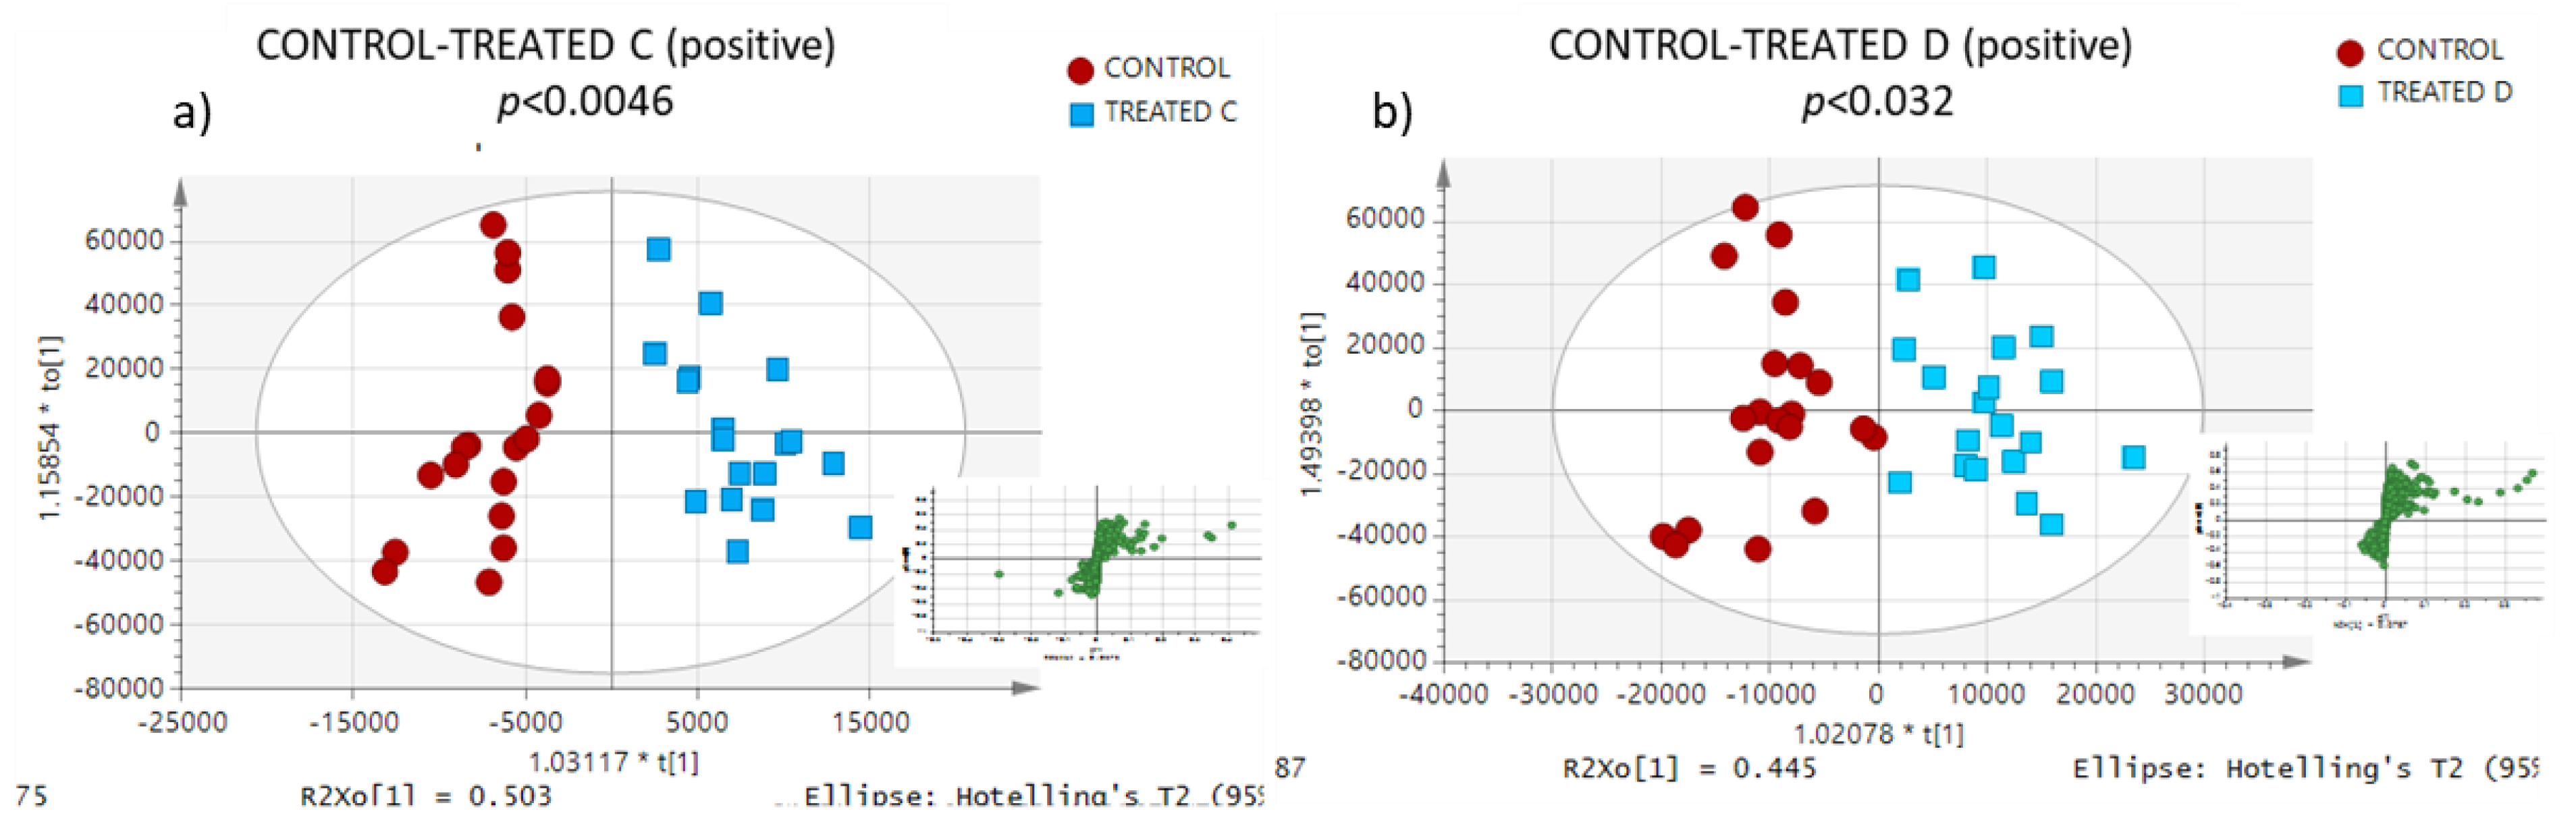
3.3. Lipidomic Profiling
4. Discussion
5. Conclusions
Supplementary Materials
Author Contributions
Funding
Institutional Review Board Statement
Informed Consent Statement
Data Availability Statement
Conflicts of Interest
References
- Pirgozliev, V.; Bedford, M.R.; Acamovic, T. Effect of Dietary Xylanase on Energy, Amino Acid and Mineral Metabolism, and Egg Production and Quality in Laying Hens. Br. Poult. Sci. 2010, 51, 639–647. [Google Scholar] [CrossRef] [PubMed]
- Bobeck, E.A.; Nachtrieb, N.A.; Batal, A.B.; Persia, M.E. Effects of Xylanase Supplementation of Corn-Soybean Meal-Dried Distiller’s Grain Diets on Performance, Metabolizable Energy, and Body Composition When Fed to First-Cycle Laying Hens. J. Appl. Poult. Res. 2014, 23, 174–180. [Google Scholar] [CrossRef]
- Mirzaie, S.; Zaghari, M.; Aminzadeh, S.; Shivazad, M.; Mateos, G.G. Effects of Wheat Inclusion and Xylanase Supplementation of the Diet on Productive Performance, Nutrient Retention, and Endogenous Intestinal Enzyme Activity of Laying Hens. Poult. Sci. 2012, 91, 413–425. [Google Scholar] [CrossRef] [PubMed]
- Taylor, A.E.; Bedford, M.R.; Pace, S.C.; Miller, H.M. The Effects of Phytase and Xylanase Supplementation on Performance and Egg Quality in Laying Hens. Br. Poult. Sci. 2018, 59, 554–561. [Google Scholar] [CrossRef] [PubMed]
- Kiełbowicz, G.; Trziszka, T.; Wawrzeńczyk, C. Separation and Quantification of Phospholipid and Neutral Lipid Classes by HPLC–CAD: Application to Egg Yolk Lipids. J. Liq. Chromatogr. Relat. Technol. 2015, 38, 898–903. [Google Scholar] [CrossRef]
- Gowda, S.G.B.; Yifan, C.; Gowda, D.; Tsuboi, Y.; Chiba, H.; Hui, S.-P. Analysis of Antioxidant Lipids in Five Species of Dietary Seaweeds by Liquid Chromatography/Mass Spectrometry. Antioxidants 2022, 11, 1538. [Google Scholar] [CrossRef] [PubMed]
- Song, Y.; Wang, C.; Wang, Y.; Chai, W.; Zhu, M.; Xue, P.; Liu, B.; Sun, X.; Song, Y.; Cai, C.; et al. A Comprehensive Review of Lipidomics and Its Application to Assess Food Obtained from Farm Animals. Food Sci. Anim. Resour. 2022, 42, 1–17. [Google Scholar] [CrossRef]
- Gowda, S.G.B.; Minami, Y.; Gowda, D.; Chiba, H.; Hui, S.-P. Detection and Characterization of Lipids in Eleven Species of Fish by Non-Targeted Liquid Chromatography/Mass Spectrometry. Food Chem. 2022, 393, 133402. [Google Scholar] [CrossRef]
- Vorkas, P.A. Expanding Lipidome Coverage Using MS/MS-Aided Untargeted Data-Independent RP–UPLC–TOF–MSE Acquisition. Bioanalysis 2018, 10, 307–319. [Google Scholar] [CrossRef]
- Mi, S.; Shang, K.; Zhang, C.-H.; Fan, Y.-Q. Characterization and Discrimination of Selected Chicken Eggs in China’s Retail Market Based on Multi-Element and Lipidomics Analysis. Food Res. Int. 2019, 126, 108668. [Google Scholar] [CrossRef]
- Zhou, L.; Yang, F.; Zhao, M.; Zhang, M.; Liu, J.; Marchioni, E. Determination and Comparison of Phospholipid Profiles in Eggs from Seven Different Species Using UHPLC-ESI-Triple TOF-MS. Food Chem. 2021, 339, 127856. [Google Scholar] [CrossRef] [PubMed]
- Li, C.; Ozturk-Kerimoglu, B.; He, L.; Zhang, M.; Pan, J.; Liu, Y.; Zhang, Y.; Huang, S.; Wu, Y.; Jin, G. Advanced Lipidomics in the Modern Meat Industry: Quality Traceability, Processing Requirement, and Health Concerns. Front. Nutr. 2022, 9, 925846. [Google Scholar] [CrossRef] [PubMed]
- Pacetti, D.; Boselli, E.; Hulan, H.W.; Frega, N.G. High Performance Liquid Chromatography-Tandem Mass Spectrometry of Phospholipid Molecular Species in Eggs from Hens Fed Diets Enriched in Seal Blubber Oil. J. Chromatogr. A 2005, 1097, 66–73. [Google Scholar] [CrossRef] [PubMed]
- Wu, B.; Xie, Y.; Xu, S.; Lv, X.; Yin, H.; Xiang, J.; Chen, H.; Wei, F. Comprehensive Lipidomics Analysis Reveals the Effects of Different Omega-3 Polyunsaturated Fatty Acid-Rich Diets on Egg Yolk Lipids. J. Agric. Food Chem. 2020, 68, 15048–15060. [Google Scholar] [CrossRef]
- Campos, A.M.; Ricardo, F.; Alves, E.; Reis, A.; Couto, D.; Domingues, P.; Domingues, M.R.M. Lipidomic Investigation of Eggs’ Yolk: Changes in Lipid Profile of Eggs from Different Conditions. Food Res. Int. 2016, 89, 177–185. [Google Scholar] [CrossRef]
- EU Directive. Council Directive 1999/74/EC of 19 July 1999 Laying down Minimum Standards for the Protection of Laying Hens. Off. J. Eur. Communities 1999, 203, 53–57.
- Papadopoulos, G.A.; Lioliopoulou, S.; Ordoudi, S.A.; Giannenas, I.; Van Hoeck, V.; Morisset, D.; Arsenos, G.; Fortomaris, P.; Mantzouridou, F.T. Xylanase Supplementation in Wheat-Based Diets of Laying Hens Affects the Egg Yolk Color, Carotenoid and Fatty Acid Profiles. Foods 2022, 11, 2209. [Google Scholar] [CrossRef]
- Folch, J.; Lees, M.; Sloane Stanley, G.H. A Simple Method for the Isolation and Purification of Total Lipides from Animal Tissues. J. Biol. Chem. 1957, 226, 497–509. [Google Scholar] [CrossRef]
- Bligh, E.G.; Dyer, W.J. A Rapid Method of Total Lipid Extraction and Purification. Can. J. Biochem. Physiol. 1959, 37, 911–917. [Google Scholar] [CrossRef]
- Matyash, V.; Liebisch, G.; Kurzchalia, T.V.; Shevchenko, A.; Schwudke, D. Lipid Extraction by Methyl-Tert-Butyl Ether for High-Throughput Lipidomics*s. J. Lipid Res. 2008, 49, 1137–1146. [Google Scholar] [CrossRef]
- Xie, Y.; Wu, B.; Wu, Z.; Tu, X.; Xu, S.; Lv, X.; Yin, H.; Xiang, J.; Chen, H.; Wei, F. Ultrasound-Assisted One-Phase Solvent Extraction Coupled with Liquid Chromatography-Quadrupole Time-of-Flight Mass Spectrometry for Efficient Profiling of Egg Yolk Lipids. Food Chem. 2020, 319, 126547. [Google Scholar] [CrossRef] [PubMed]
- Ryckebosch, E.; Muylaert, K.; Foubert, I. Optimization of an Analytical Procedure for Extraction of Lipids from Microalgae. J. Am. Oil Chem. Soc. 2012, 89, 189–198. [Google Scholar] [CrossRef]
- Ali, A.H.; Zou, X.; Lu, J.; Abed, S.M.; Yao, Y.; Tao, G.; Jin, Q.; Wang, X. Identification of Phospholipids Classes and Molecular Species in Different Types of Egg Yolk by Using UPLC-Q-TOF-MS. Food Chem. 2017, 221, 58–66. [Google Scholar] [CrossRef] [PubMed]
- Andersen, C.J. Bioactive Egg Components and Inflammation. Nutrients 2015, 7, 7889–7913. [Google Scholar] [CrossRef]
- Cohn, J.S.; Kamili, A.; Wat, E.; Chung, R.W.S.; Tandy, S. Dietary Phospholipids and Intestinal Cholesterol Absorption. Nutrients 2010, 2, 116–127. [Google Scholar] [CrossRef] [PubMed]
- Harlina, P.W.; Ma, M.; Shahzad, R. Quantification of Lipidomics Profiling Using UPLC-QE-HESI- Lipid Analysis on the Salted Duck Egg Incorporated with Clove Extract. Eur. J. Lipid Sci. Technol. 2021, 123, 2000284. [Google Scholar] [CrossRef]
- Wood, P.L.; Muir, W.; Christmann, U.; Gibbons, P.; Hancock, C.L.; Poole, C.M.; Emery, A.L.; Poovey, J.R.; Hagg, C.; Scarborough, J.H.; et al. Lipidomics of the Chicken Egg Yolk: High-Resolution Mass Spectrometric Characterization of Nutritional Lipid Families. Poult. Sci. 2021, 100, 887–899. [Google Scholar] [CrossRef]
- Walczak, J.; Bocian, S.; Buszewski, B. Two-Dimensional High Performance Liquid Chromatography-Mass Spectrometry for Phosphatidylcholine Analysis in Egg Yolk. Food Anal. Methods 2015, 8, 661–667. [Google Scholar] [CrossRef]
- Anton, M. Composition and Structure of Hen Egg Yolk. In Bioactive Egg Compounds; Huopalahti, R., López-Fandiño, R., Anton, M., Schade, R., Eds.; Springer: Berlin/Heidelberg, Germany, 2007; pp. 1–6. ISBN 978-3-540-37885-3. [Google Scholar]
- Chen, J.; Lin, S.; Sun, N.; Bao, Z.; Shen, J.; Lu, X. Egg Yolk Phosphatidylcholine: Extraction, Purification and Its Potential Neuroprotective Effect on PC12 Cells. J. Funct. Foods 2019, 56, 372–383. [Google Scholar] [CrossRef]
- Sun, N.; Chen, J.; Bao, Z.; Wang, D.; An, B.; Lin, S. Egg Yolk Phosphatidylethanolamine: Extraction Optimization, Antioxidative Activity, and Molecular Structure Profiling. J. Food Sci. 2019, 84, 1002–1011. [Google Scholar] [CrossRef]
- Effects of Xylanase Enzyme Supplementation to Corn/Wheat-Based Diets on Performance and Egg Quality in Laying Hens. Available online: https://cdnsciencepub.com/doi/10.4141/CJAS09081 (accessed on 13 February 2022).
- De Sousa, L.S.; Carvalho, T.S.M.; Nogueira, F.A.; Saldanha, M.M.; Vaz, D.P.; Bertechini, A.G.; Baião, N.C.; Lara, L.J.C. Fiber Source and Xylanase on Performance, Egg Quality, and Gastrointestinal Tract of Laying Hens. Rev. Bras. Zootec. 2019, 48. [Google Scholar] [CrossRef]
- Nguyen, X.H.; Nguyen, H.T.; Morgan, N.K. Dietary Soluble Non-Starch Polysaccharide Level and Xylanase Supplementation Influence Performance, Egg Quality and Nutrient Utilization in Laying Hens Fed Wheat-Based Diets. Anim. Nutr. 2021, 7, 512–520. [Google Scholar] [CrossRef] [PubMed]
- Liu, Y.; Guo, X.; Wang, N.; Lu, S.; Dong, J.; Qi, Z.; Zhou, J.; Wang, Q. Evaluation of Changes in Egg Yolk Lipids during Storage Based on Lipidomics through UPLC-MS/MS. Food Chem. 2023, 398, 133931. [Google Scholar] [CrossRef] [PubMed]
- Meng, Y.; Qiu, N.; Guyonnet, V.; Keast, R.; Zhu, C.; Mine, Y. UHPLC-Q-Orbitrap-Based Untargeted Lipidomics Reveals the Variation of Yolk Lipids during Egg Storage. J. Sci. Food Agric. 2022, 102, 5690–5699. [Google Scholar] [CrossRef] [PubMed]
- Wang, Y.; Wang, J.; Li, H.; Xiao, Y.; Harlina, P.W.; Geng, F. Quantitative Lipidomic Analysis of Chicken Egg Yolk during Its Formation. J. Sci. Food Agric. 2022, 103, 3997–4005. [Google Scholar] [CrossRef] [PubMed]
- Zhao, Y.Y.; Xiong, Y.; Curtis, J. Measurement of Phospholipids by Hydrophilic Interaction Liquid Chromatography Coupled to Tandem Mass Spectrometry: The Determination of Choline Containing Compounds in Foods. J. Chromatogr. A 2011, 1218, 5470–5479. [Google Scholar] [CrossRef] [PubMed]


| Ingredient (Labeling Information) | kg | % |
|---|---|---|
| Wheat soft | 55.03 | 55.03 |
| Soybean meal (47%) | 15.40 | 15.40 |
| Sunflo.Meal34 | 10.00 | 10.00 |
| Limestone | 9.08 | 9.08 |
| Corn, Yellow Lys | 5.00 | 5.00 |
| Soybean oil | 3.73 | 3.73 |
| Mcp | 0.55 | 0.55 |
| Mineral and vitamin premix a | 0.40 | 0.40 |
| Sodium chloride | 0.29 | 0.29 |
| D,L-Methionine | 0.16 | 0.16 |
| L-Lysine Hcl | 0.15 | 0.15 |
| Phytase 500 | 0.06 | 0.06 |
| Sodium bicarbonate | 0.05 | 0.05 |
| Pigment red | 0.04 | 0.04 |
| L.Threonine | 0.04 | 0.04 |
| L-Valine | 0.02 | 0.02 |
| Total | 100.00 | 100.00 |
| Provision-Nutrient Analysis | UM | %AF |
| Dry matter | % | 89.00 |
| Crude Protein | % | 17.50 |
| Crude Fat | % | 4.99 |
| Crude Fiber | % | 3.99 |
| NSP | % | 14.88 |
| Starch | % | 35.83 |
| Ca | % | 3.90 |
| Phosphorus | % | 0.53 |
| Digestible Phosphorus | % | 0.40 |
| Na | % | 0.17 |
| Cl | % | 0.25 |
| K | % | 0.73 |
| Lysine dig | % | 0.76 |
| Methionine dig | % | 0.41 |
| Cystine dig | % | 0.26 |
| Methionine + Cystine dig | % | 0.67 |
| Tryptophan dig | % | 0.18 |
| Threonine dig | % | 0.53 |
| Ile dig | % | 0.61 |
| Arginine dig | % | 1.00 |
| Valine dig | % | 0.70 |
| Metabolizable energy (ABE poultry based on CVB) | Kcal/ | 2700.00 |
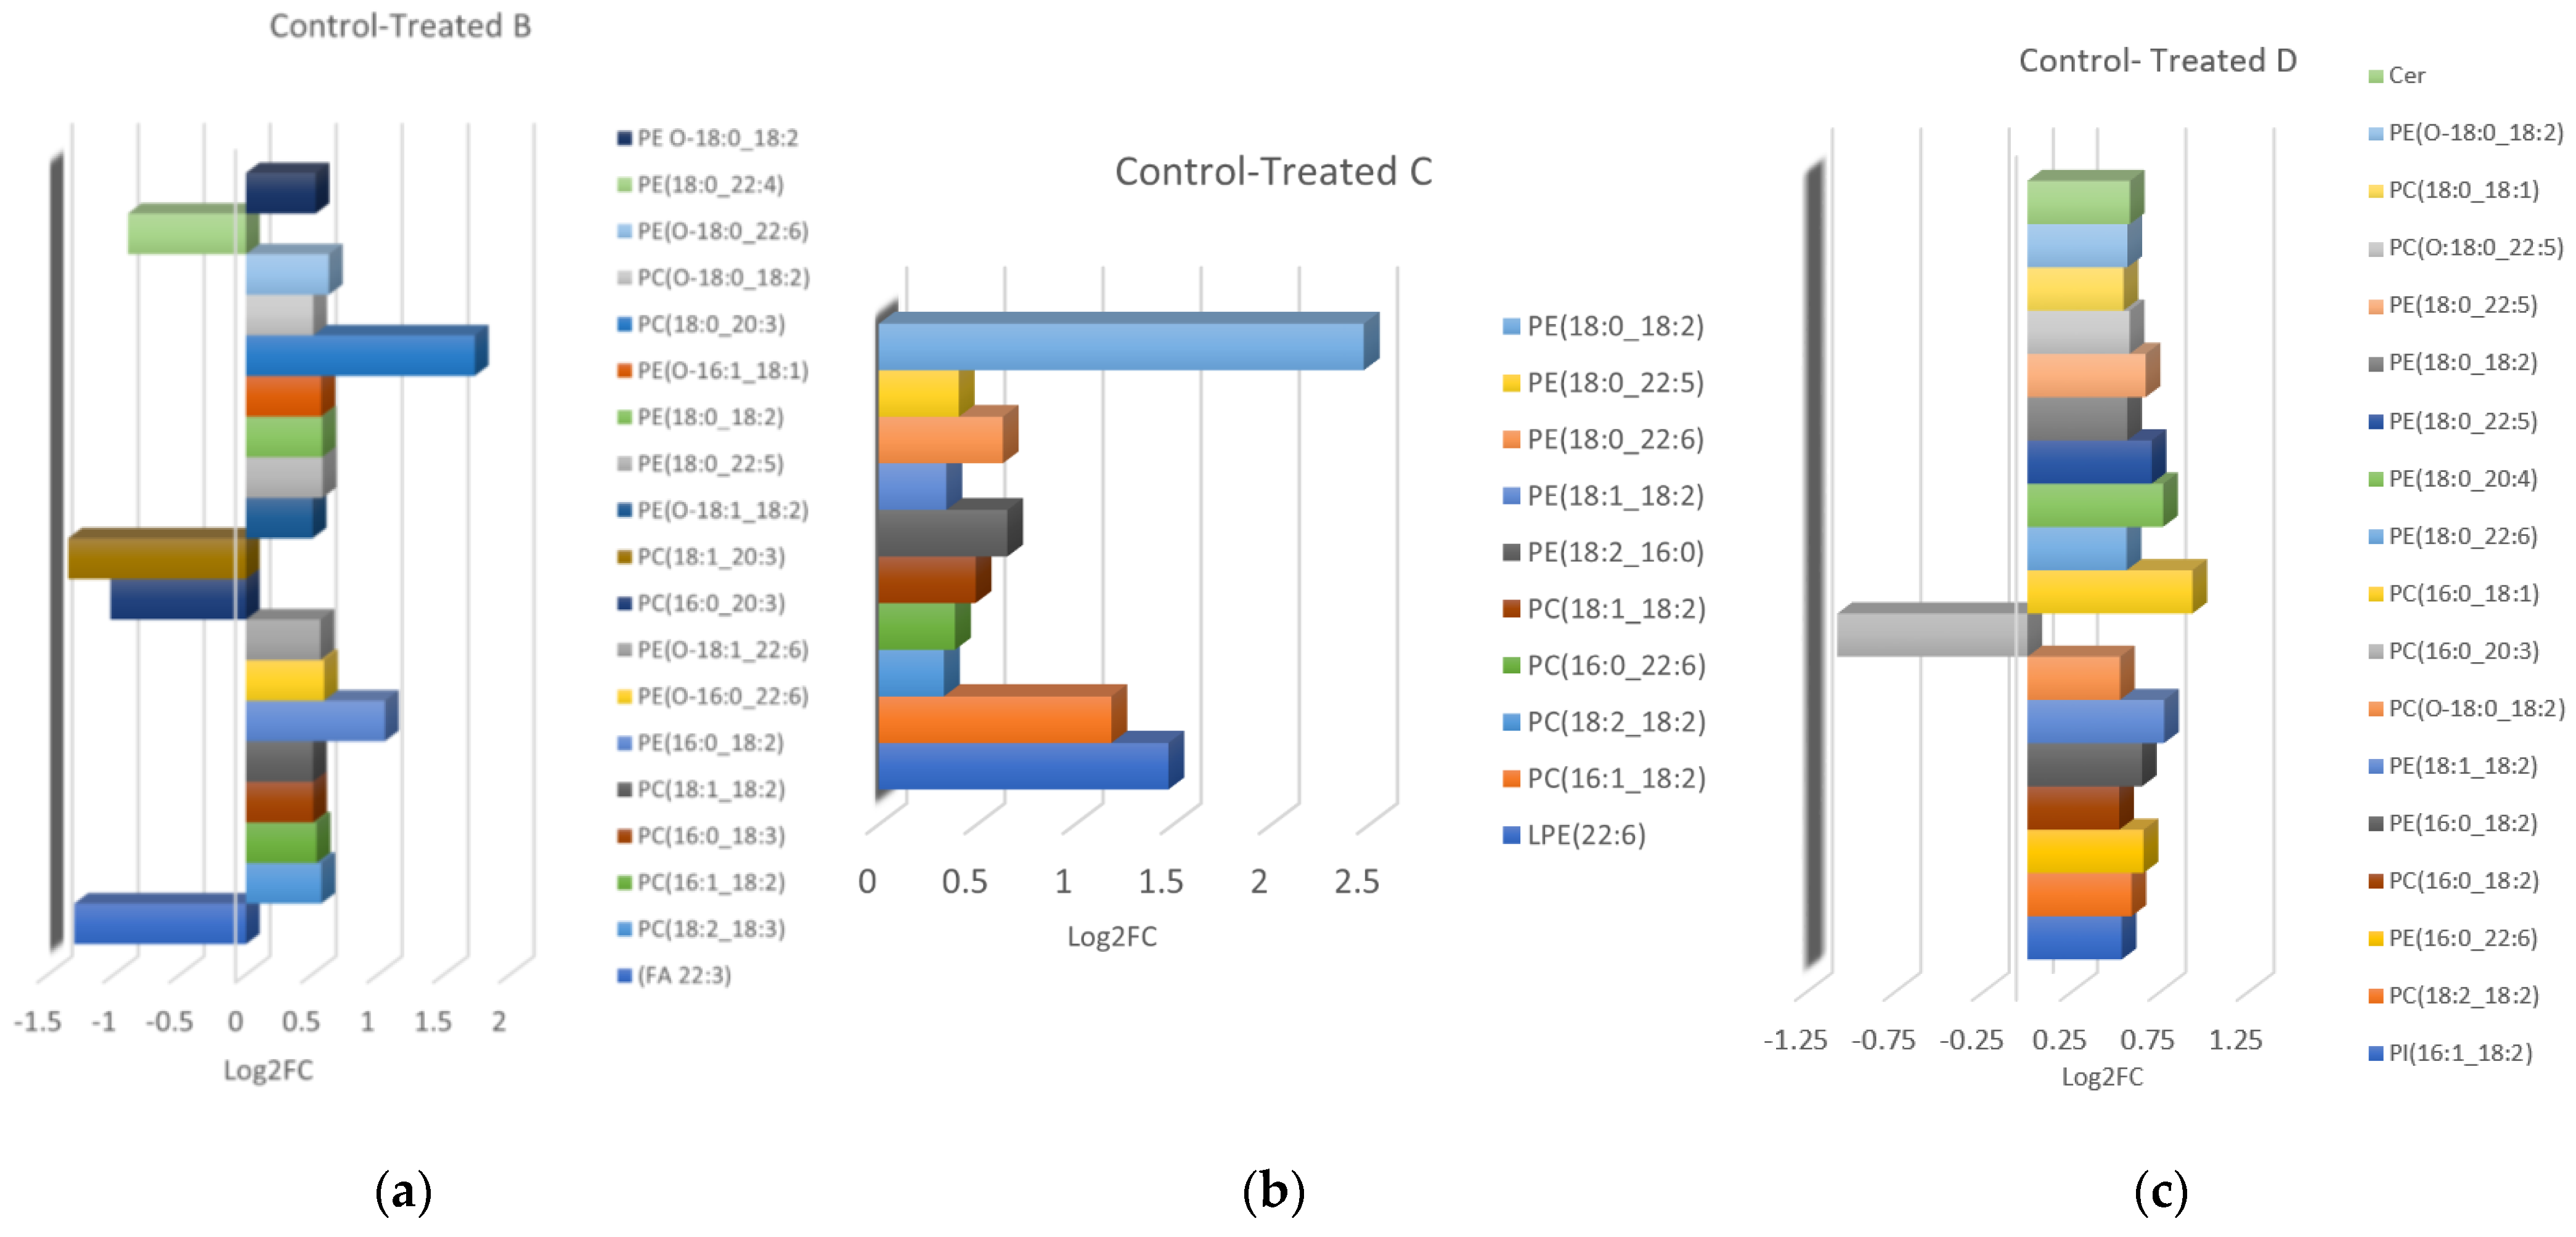
| A/A | VIP | m/z | RT min | p-Value | Log2FC | Annotation | MS DIAL | Mass Error (ppm) |
|---|---|---|---|---|---|---|---|---|
| -ESI | ||||||||
| CONTROL-TREATED B | ||||||||
| 1 | 3.20 | 305.2497 | 2.72 | 5.28 × 10⁻³ | −1.30 | FA 20:3 | FA 20:3 | 3.60 |
| 2 | 1.14 | 824.5457 | 4.76 | 2.84 × 10⁻² | 0.57 | PC(18:2_18:3) | PC(18:2_18:3) | 1.21 |
| 3 | 7.10 | 800.5449 | 5.39 | 4.52 × 10⁻² | 0.53 | PC(16:1_18:2) | PC(16:1_18:2) | 0.25 |
| 4 | 3.15 | 801.5453 | 5.67 | 3.25 × 10⁻² | 0.51 | PC(16:0_18:3) | PC(16:0_18:3) | - |
| 5 | 4.05 | 828.5751 | 7.03 | 4.07 × 10⁻³ | 0.51 | PC(18:1_18:2) | PC(18:1_18:2) | −1.08 |
| 6 | 4.93 | 714.5084 | 7.42 | 4.61 × 10⁻² | 1.05 | PE(16:0_18:2) | PE(16:0_18:2) | 0.69 |
| 7 | 1.40 | 776.5310 | 7.57 | 1.17 × 10-³ | −0.92 | Unknown | - | - |
| 8 | 3.62 | 748.5285 | 7.79 | 1.49 × 10⁻² | 0.59 | PE(O-16:0_22:6) | PE(O-16:0_22:6) | 0.26 |
| 9 | 1.67 | 774.5466 | 7.94 | 2.21 × 10⁻² | 0.56 | PE(O-18:1_22:6) | PE(O-18:1_22:6) | 2.96 |
| 10 | 5.31 | 828.5767 | 8.04 | 6.89 × 10⁻³ | −1.02 | PC(16:0_20:3) | PC(16:0_20:3) | 0.84 |
| 11 | 2.06 | 854.5923 | 8.26 | 3.18 × 10⁻³ | −1.35 | PC(18:1_20:3) | PC(18:1_20:3) | 0.70 |
| 12 | 1.94 | 726.5449 | 9.03 | 2.14 × 10⁻² | 0.50 | PE(O-18:1_18:2) | PE(O-18:1_18:2) | −0.82 |
| 13 | 1.88 | 792.5543 | 9.55 | 6.71 × 10⁻³ | 0.58 | PE(18:0_22:5) | PE(18:0_22:5) | −0.75 |
| 14 | 1.23 | 661.5068 | 9.63 | 3.06 × 10⁻³ | 0.99 | Unknown | - | - |
| 15 | 3.23 | 742.5390 | 9.83 | 4.09 × 10⁻² | 0.58 | PE(18:0_18:2) | PE(18:0_18:2) | −0.26 |
| 16 | 4.64 | 700.5279 | 10.53 | 2.83 × 10⁻² | 0.57 | PE(O-16:1_18:1) | PE(O-16:1_18:1) | −0.99 |
| 17 | 6.97 | 856.6116 | 10.65 | 5.28 × 10⁻⁴ | 1.73 | PC(18:0_20:3) | PC(18:0_20:3) | 5.01 |
| 18 | 1.77 | 816.6139 | 10.71 | 2.79 × 10⁻² | 0.51 | PC(O-18:0_18:2) | PC(O-18:0_18:2) | 1.83 |
| 19 | 1.62 | 686.5746 | 10.73 | 7.90 × 10⁻⁵ | 1.41 | Unknown | - | - |
| 20 | 1.10 | 777.565 | 10.77 | 2.83 × 10⁻³ | 0.63 | PE(O-22:6_18:0) | PE(O-18:1_22:5) | - |
| 21 | 1.19 | 794.5709 | 11.46 | 1.64 × 10⁻² | −0.89 | PE(18:0_22:4) | PE(18:0_22:4) | 0.50 |
| 22 | 4.06 | 728.5594 | 11.69 | 5.88 × 10⁻³ | 0.53 | PE(O-18:0_18:2) | PE(O-18:0_18:2) | −0.68 |
| 23 | 1.26 | 858.624 | 12.43 | 5.77 × 10⁻³ | 1.76 | Unknown | - | - |
| CONTROL-TREATED C | ||||||||
| 1 | 3.36 | 524.2792 | 1.07 | 1.20 × 10⁻³ | 1.47 | LPE 22:6 | LPE 22:6 | 1.71 |
| 2 | 6.19 | 800.5446 | 5.39 | 4.64 × 10⁻³ | 1.18 | PC(16:1_18:2) | PC(16:1_18:2) | −0.12 |
| 3 | 6.47 | 826.5611 | 5.70 | 1.36 × 10⁻³ | 0.53 | PC(18:2_18:2) | PC(18:2_18:2) | 0.84 |
| 4 | 5.24 | 762.5086 | 6.59 | 9.49 × 10⁻⁴ | 0.65 | PE(16:0_22:6) | PE(16:0_22:6) | 0.91 |
| 5 | 5.05 | 828.5761 | 7.04 | 4.85 × 10⁻⁴ | 0.50 | PC(18:1_18:2) | PC(18:1_18:2) | 0.12 |
| 6 | 7.24 | 714.5083 | 7.42 | 6.27 × 10⁻³ | 0.65 | PE(16:0_18:2) | PE(16:0_18:2) | 0.55 |
| 7 | 1.31 | 776.5310 | 7.57 | 1.27 × 10⁻⁴ | 1.06 | Unknown | - | - |
| 8 | 1.87 | 740.5239 | 7.63. | 3.18 × 10⁻³ | 0.54 | PE(18:1_18:2) | PE(18:1_18:2) | 0.40 |
| 9 | 4.40 | 790.5400 | 8.74 | 4.21 × 10⁻³ | 0.63 | PE(18:0_22:6) | PE(18:0_22:6) | 1.01 |
| 10 | 1.52 | 898.5817 | 9.09 | 5.91 × 10⁻³ | −0.66 | Unknown | - | |
| 11 | 1.84 | 792.5543 | 9.55 | 5.45 × 10⁻³ | 0.51 | PE(18:0_22:5) | PE(18:0_22:5) | −0.75 |
| 12 | 5.95 | 742.5391 | 9.84 | 1.76 × 10⁻³ | 2.47 | PE(18:0_18:2) | PE(18:0_18:2) | −0.13 |
| 13 | 1.45 | 686.5746 | 10.73 | 4.79 × 10⁻⁵ | 0.85 | Unknown | - | - |
| CONTROL-TREATED D | ||||||||
| 1 | 12.13 | 540.3319 | 1.32 | 1.08 × 10⁻² | 0.51 | LPC(16:0) | - | 2.22 |
| 2 | 2.79 | 833.5183 | 4.98 | 4.88 × 10⁻³ | 0.53 | PI(16:0_18:2) | PI(16:0_18:2) | −0.35 |
| 3 | 5.51 | 826.5616 | 5.70 | 2.78 × 10³ | 0.59 | PC(18:2_18:2) | PC(18:2_18:2) | 1.45 |
| 4 | 5.29 | 762.5087 | 6.58 | 3.04 × 10⁻⁴ | 0.66 | PE(16:0_22:6) | PE(16:0_22:6) | 1.04 |
| 5 | 12.19 | 802.5607 | 6.84 | 1.49 × 10⁻³ | 0.52 | PC(16:0_18:2) | PC(16:0_18:2) | 0.37 |
| 6 | 7.58 | 714.5083 | 7.42 | 1.15 × 10⁻³ | 0.65 | PE(16:0_18:2) | PE(16:0_18:2) | 0.55 |
| 7 | 5.42 | 740.5239 | 7.62 | 2.63 × 10⁻⁴ | 0.77 | PE(18:1_18:2) | PE(18:1_18:2) | 0.40 |
| 8 | 1.68 | 816.5766 | 7.85 | 1.34 × 10⁻³ | 0.52 | PC(O-18:0_18:2) | PC(17:0_18:2) | - |
| 9 | 1.88 | 828.5771 | 8.04 | 8.51 × 10⁻⁴ | −1.08 | PC(16:0_20:3) | PC(16:0_20:3) | 1.32 |
| 10 | 1.58 | 804.5770 | 8.48 | 2.19 × 10⁻³ | 0.93 | PC(16:0_18:1) | PC(16:0_18:1) | 1.24 |
| 11 | 3.79 | 790.5408 | 8.74 | 4.94 × 10⁻³ | 0.56 | PE(18:0_22:6) | PE(18:0_22:6) | 2.02 |
| 12 | 7.94 | 766.5388 | 9.43 | 9.60 × 10⁻³ | 0.77 | PE(18:0_20:4) | PE(18:0_20:4) | −0.52 |
| 13 | 1.71 | 792.5555 | 9.54 | 4.47 × 10⁻³ | 0.70 | PE(18:0_22:5) | 0.75 | |
| 14 | 1.37 | 661.5068 | 9.62 | 5.74 × 10⁻⁵ | 0.83 | Unknown | - | - |
| 15 | 8.21 | 742.5391 | 9.83 | 7.59 × 10⁻⁴ | 0.56 | PE(18:0_18:2) | PE(18:0_18:2) | −0.13 |
| 16 | 4.32 | 793.5746 | 10.47 | 1.43 × 10⁻³ | 0.67 | PE(18:0_22:5) | - | 0.88 |
| 17 | 1.46 | 776.5607 | 10.77 | 3.12 × 10⁻³ | 0.58 | PC(O:18:0_22:5) | PC(O:18:0_22:5) | - |
| 18 | 16.08 | 832.6080 | 11.17 | 6.65 × 10⁻³ | 0.54 | PC(18:0_18:1) | PC(18:0_18:1) | 0.84 |
| 19 | 3.70 | 728.5599 | 11.68 | 2.28 × 10⁻³ | 0.57 | PE(O-18:0_18:2) | PE(O-18:0_18:2) | 0.00 |
| 20 | 1.39 | 722.6678 | 14.85 | 4.22 × 10⁻⁴ | 0.58 | Unknown Cer | Cer 29:0;2O/15:1 | - |
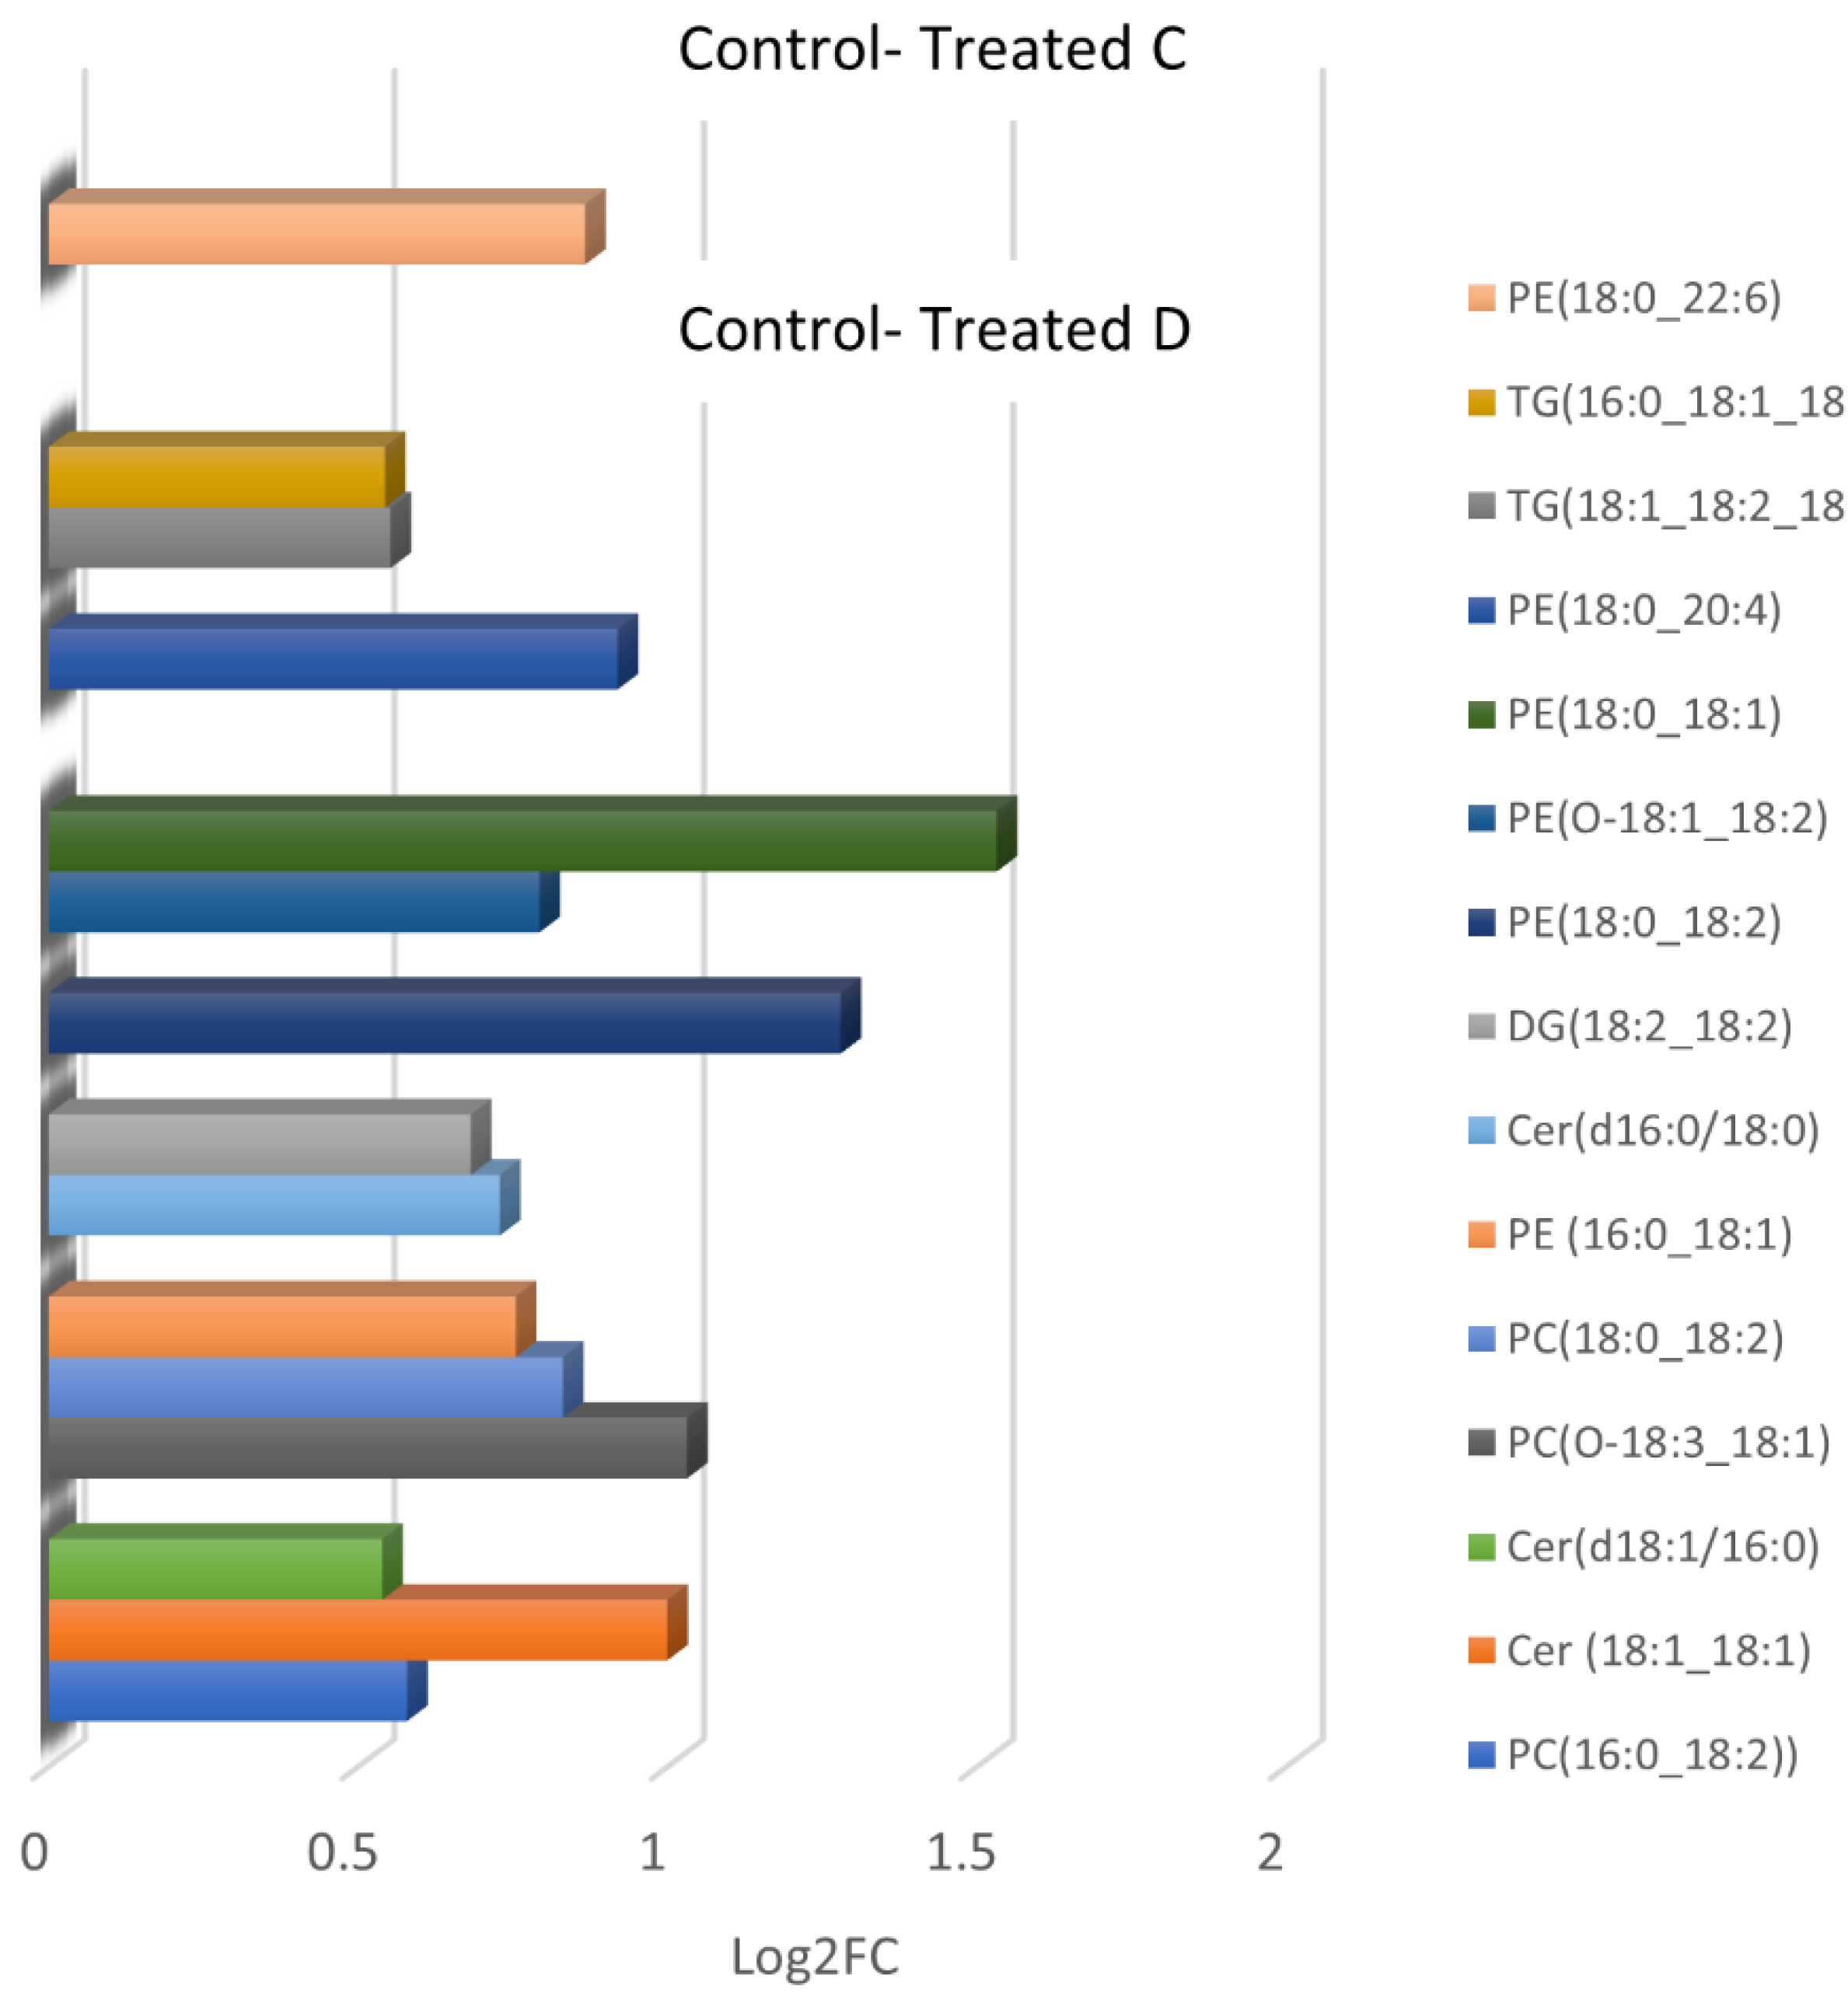
| CONTROL-TREATED C | ||||||||
| 1 | 2.11 | 792.5495 | 8.80 | 1.40 × 10⁻³ | 0.86 | PE(18:0_22:6) | PE(18:0_22:6) | −5.29 |
| 2 | 1.73 | 600.4943 | 9.82 | 4.60 × 10⁻³ | 0.99 | Unknown | - | |
| CONTROL-TREATED D | ||||||||
| 1 | 9.79 | 758.5695 | 6.92 | 2.03 × 10⁻³ | 0.58 | PC(16:0_18:2) | 0.13 | |
| 2 | 1.99 | 564.5344 | 7.47 | 1.31 × 10⁻⁴ | 1.00 | Cer(d18:1_18:1) | −1.06 | |
| 3 | 0.66 | 738.4893 | 7.48 | 5.63 × 10⁻⁴ | 0.83 | Unknown | - | |
| 4 | 0.87 | 520.5087 | 8.78 | 6.12 × 10⁻³ | 0.54 | Cer(d18:1_16:0) | −1.34 | |
| 5 | 1.70 | 793.5402 | 8.80 | 7.09 × 10⁻⁵ | 1.03 | PC(O-18:3_18:1) | - | |
| 6 | 10.03 | 786.6009 | 9.15 | 1.19 × 10⁻³ | 0.83 | PC(18:0_18:2) | PC(18:0_18:2) | 0.25 |
| 7 | 1.11 | 718.5372 | 9.30 | 5.62 × 10⁻³ | 0.75 | PE(16:0_18:1) | PE (18:1_16:0) | −1.25 |
| 8 | 0.89 | 540.5357 | 9.67 | 6.63 × 10⁻³ | 0.73 | Cer(d18:0_16:0) | Cer(d18:0/16:0) | 1.29 |
| 9 | 1.42 | 634.5319 | 9.81 | 1.01 × 10⁻³ | 0.68 | DG(18:2_18:2) | - | 2.20 |
| 10 | 0.80 | 599.4921 | 9.82 | 9.73 × 10⁻⁴ | 0.71 | Unknown | - | - |
| 11 | 0.90 | 617.5026 | 9.82 | 6.37 × 10⁻⁴ | 0.88 | Unknown | - | - |
| 12 | 2.49 | 744.5537 | 9.88 | 2.63 × 10⁻³ | 1.28 | PE(18:0_18:2) | PE(18:0_18:2) | −0.13 |
| 13 | 0.74 | 728.5544 | 11.30 | 2.55 × 10⁻³ | 0.79 | PE(O-18:1_18:2) | PE(O-18:1_18:2) | −6.03 |
| 14 | 2.47 | 746.5712 | 12.24 | 3.50 × 10⁻³ | 1.53 | PE(18:0_18:1) | - | 2.41 |
| 15 | 1.04 | 768.5539 | 12.26 | 1.40 × 10⁻³ | 0.92 | PE(18:0_20:4) | - | 0.13 |
| 16 | 0.70 | 896.7705 | 15.74 | 9.32 × 10⁻⁴ | 0.55 | TG(18:1_18:2_18:3) | - | 0.33 |
| 17 | 2.92 | 874.7860 | 15.95 | 1.17 × 10⁻³ | 0.54 | TG(16:0_18:1_18:2) | TG(16:0_18:1_18:2) | 0.22 |
Disclaimer/Publisher’s Note: The statements, opinions and data contained in all publications are solely those of the individual author(s) and contributor(s) and not of MDPI and/or the editor(s). MDPI and/or the editor(s) disclaim responsibility for any injury to people or property resulting from any ideas, methods, instructions or products referred to in the content. |
© 2023 by the authors. Licensee MDPI, Basel, Switzerland. This article is an open access article distributed under the terms and conditions of the Creative Commons Attribution (CC BY) license (https://creativecommons.org/licenses/by/4.0/).
Share and Cite
Lioupi, A.; Papadopoulos, G.A.; Gallou, D.; Virgiliou, C.; Arsenos, G.I.; Fortomaris, P.; Van Hoeck, V.; Morisset, D.; Theodoridis, G. Untargeted UHPLC-TOF/MS Lipidomic Analysis for the Investigation of Egg Yolks after Xylanase Supplementation of the Diet of Laying Hens. Metabolites 2023, 13, 649. https://doi.org/10.3390/metabo13050649
Lioupi A, Papadopoulos GA, Gallou D, Virgiliou C, Arsenos GI, Fortomaris P, Van Hoeck V, Morisset D, Theodoridis G. Untargeted UHPLC-TOF/MS Lipidomic Analysis for the Investigation of Egg Yolks after Xylanase Supplementation of the Diet of Laying Hens. Metabolites. 2023; 13(5):649. https://doi.org/10.3390/metabo13050649
Chicago/Turabian StyleLioupi, Artemis, Georgios A. Papadopoulos, Domniki Gallou, Christina Virgiliou, Georgios I. Arsenos, Paschalis Fortomaris, Veerle Van Hoeck, Dany Morisset, and Georgios Theodoridis. 2023. "Untargeted UHPLC-TOF/MS Lipidomic Analysis for the Investigation of Egg Yolks after Xylanase Supplementation of the Diet of Laying Hens" Metabolites 13, no. 5: 649. https://doi.org/10.3390/metabo13050649