
High-Intensity Interval Training Induces Protein Lactylation in Different Tissues of Mice with Specificity and Time Dependence

 ,
,
Abstract
:
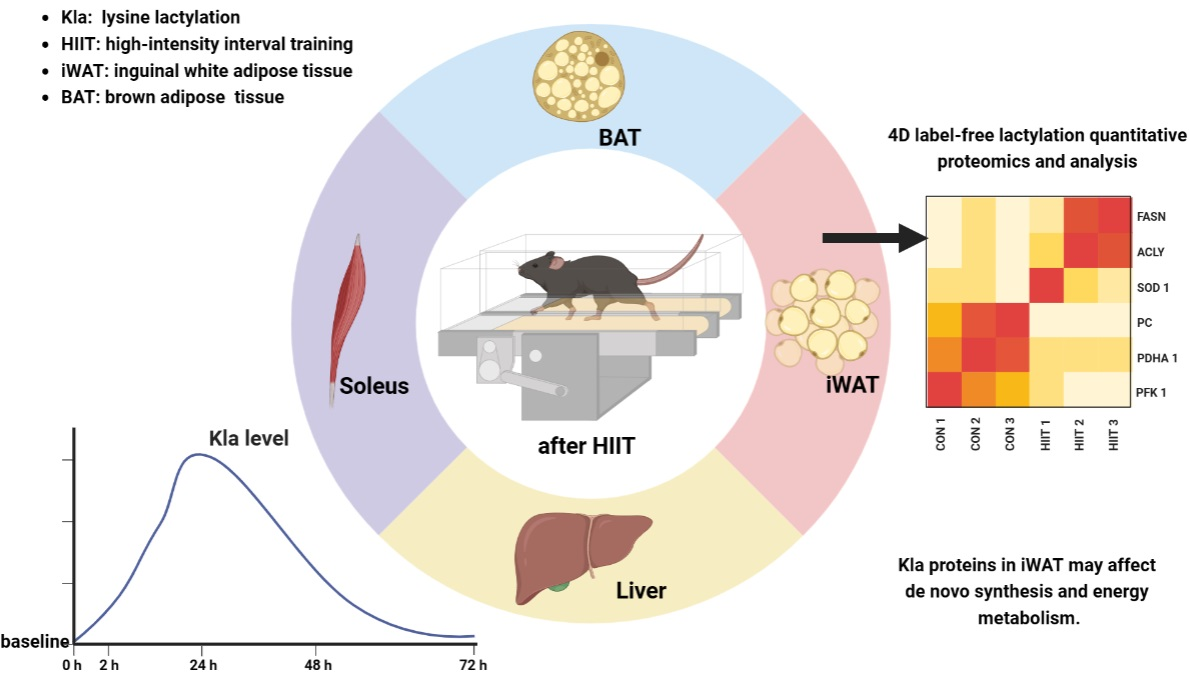
1. Introduction
2. Materials and Methods
2.1. Experimental Animal Grouping
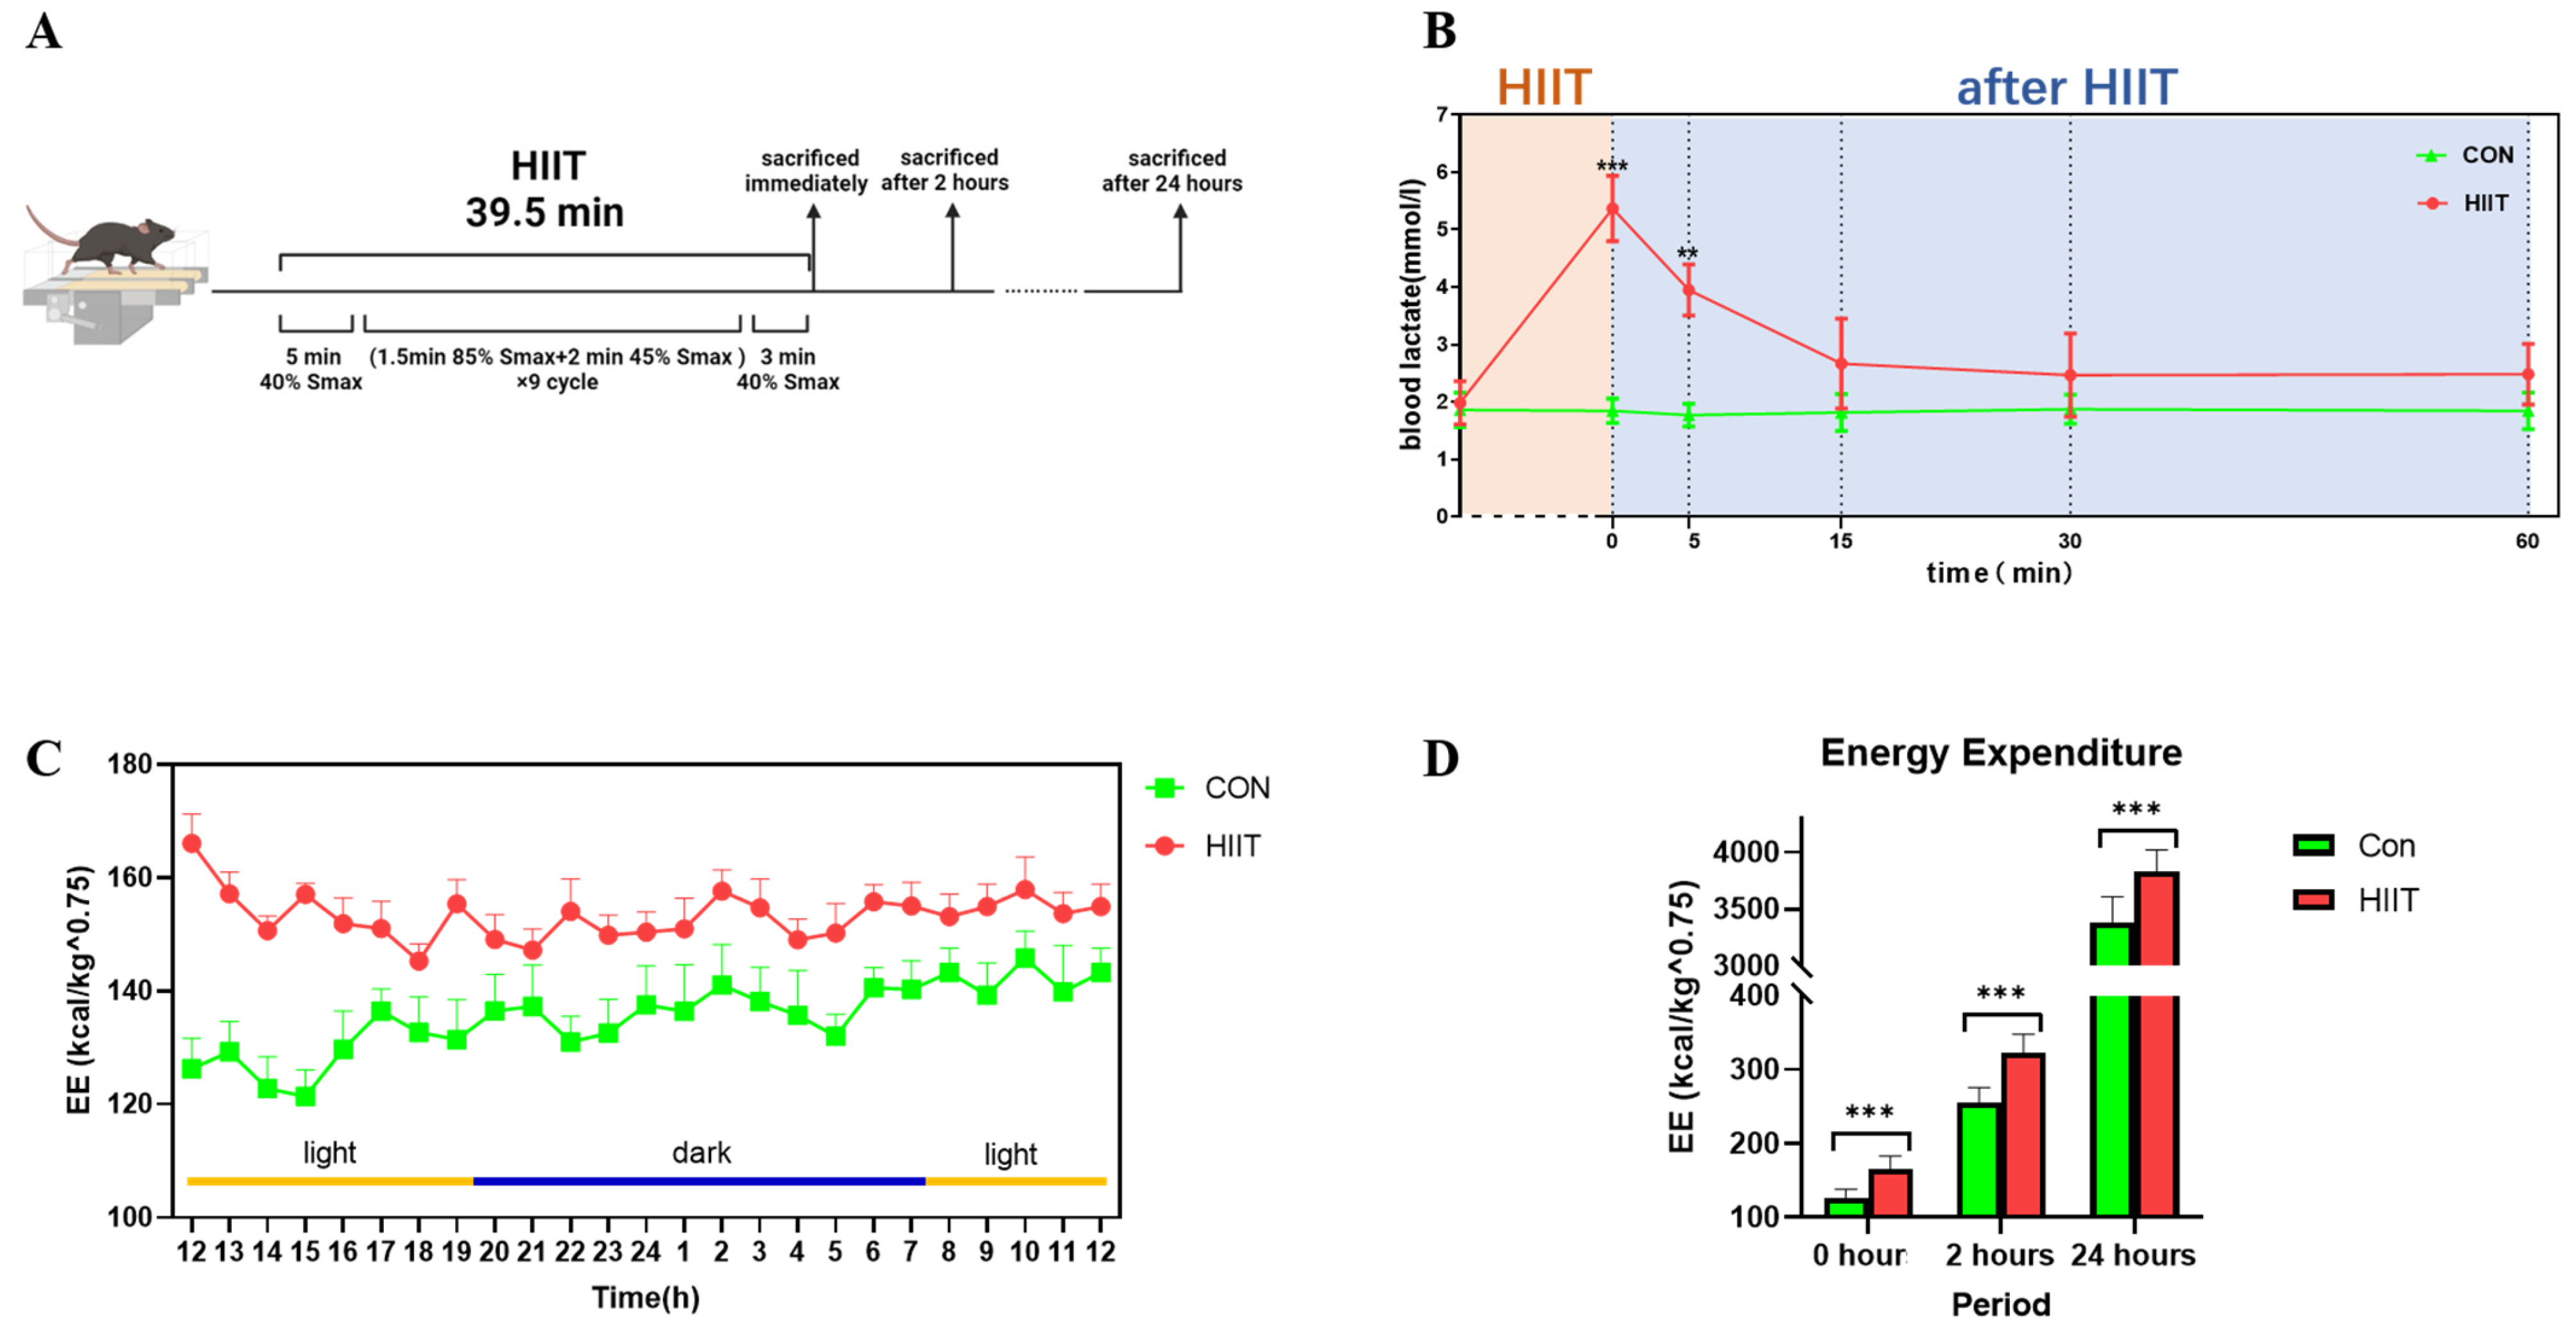
2.2. Exercise Protocol
2.3. Blood Lactate Assay in Mice
2.4. Detection of Energy Expenditure in Mice
2.5. Protein Extraction and Western Blotting
2.6. Four-Dimensional Label-Free Lactylation Quantitative Proteomics and Analysis
2.6.1. Protein Extraction and Trypsin Digestion
2.6.2. Pan-Kla Antibody-Based PTM Enrichment
2.6.3. Quantitative Proteomic Analysis via LC–MS/MS
2.6.4. Bioinformatics Analysis
2.7. Data Analyses and Statistics
3. Results
3.1. Changes in Blood Lactate and Energy Expenditure after HIIT
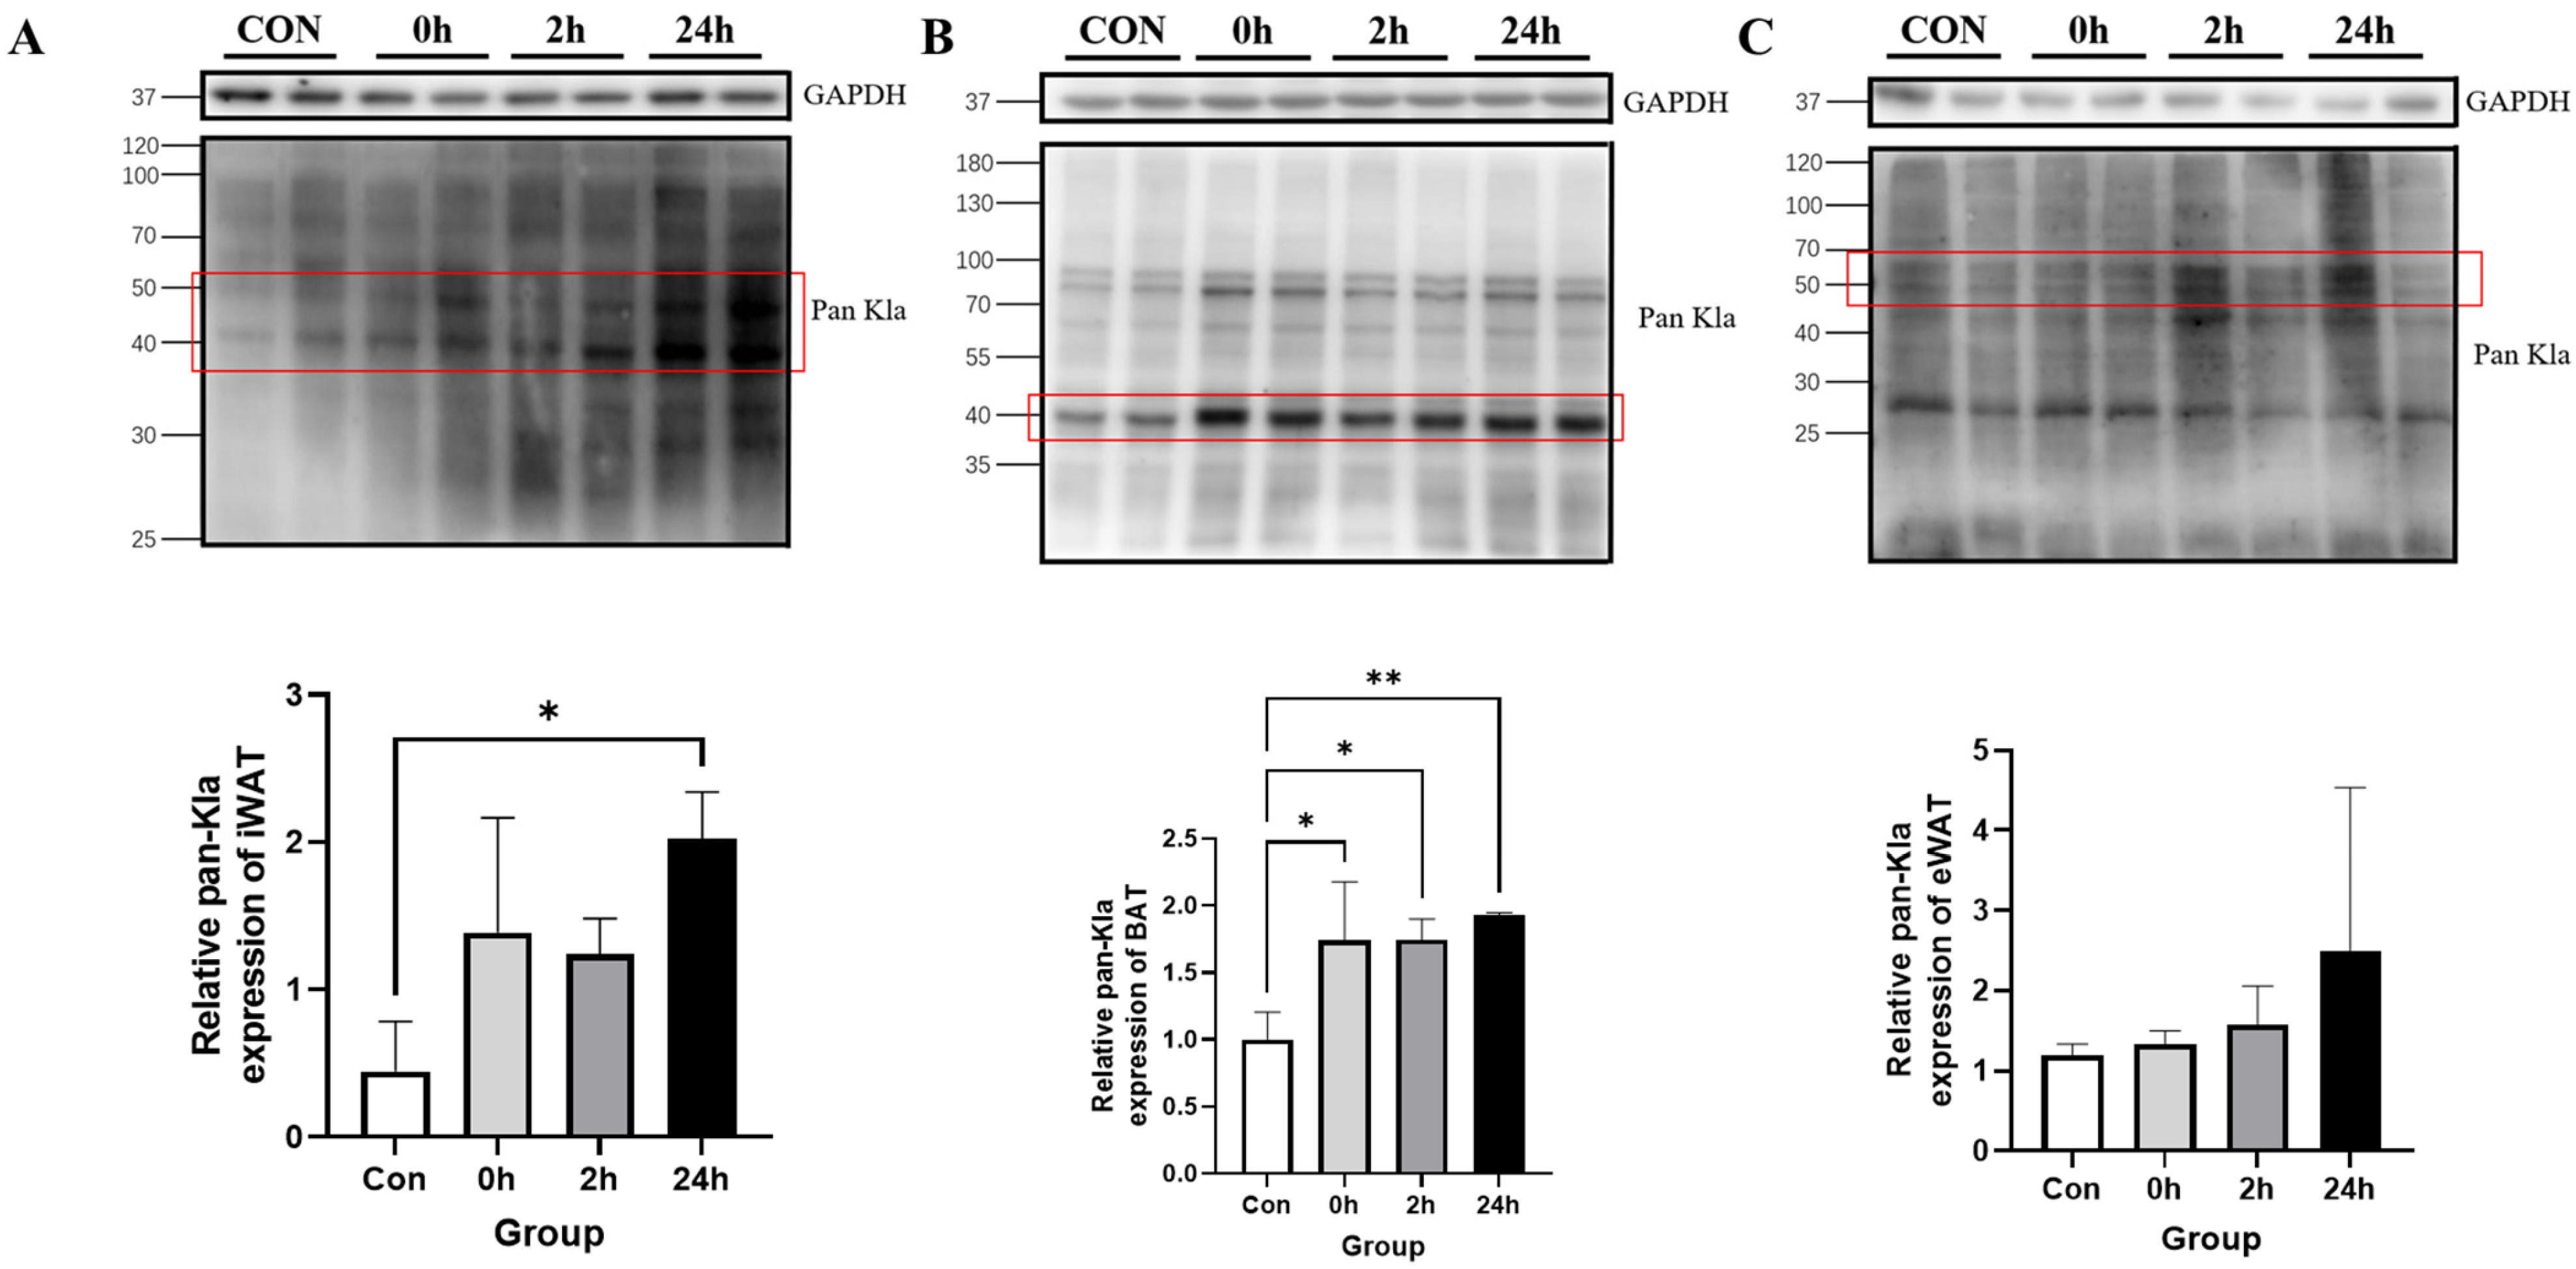
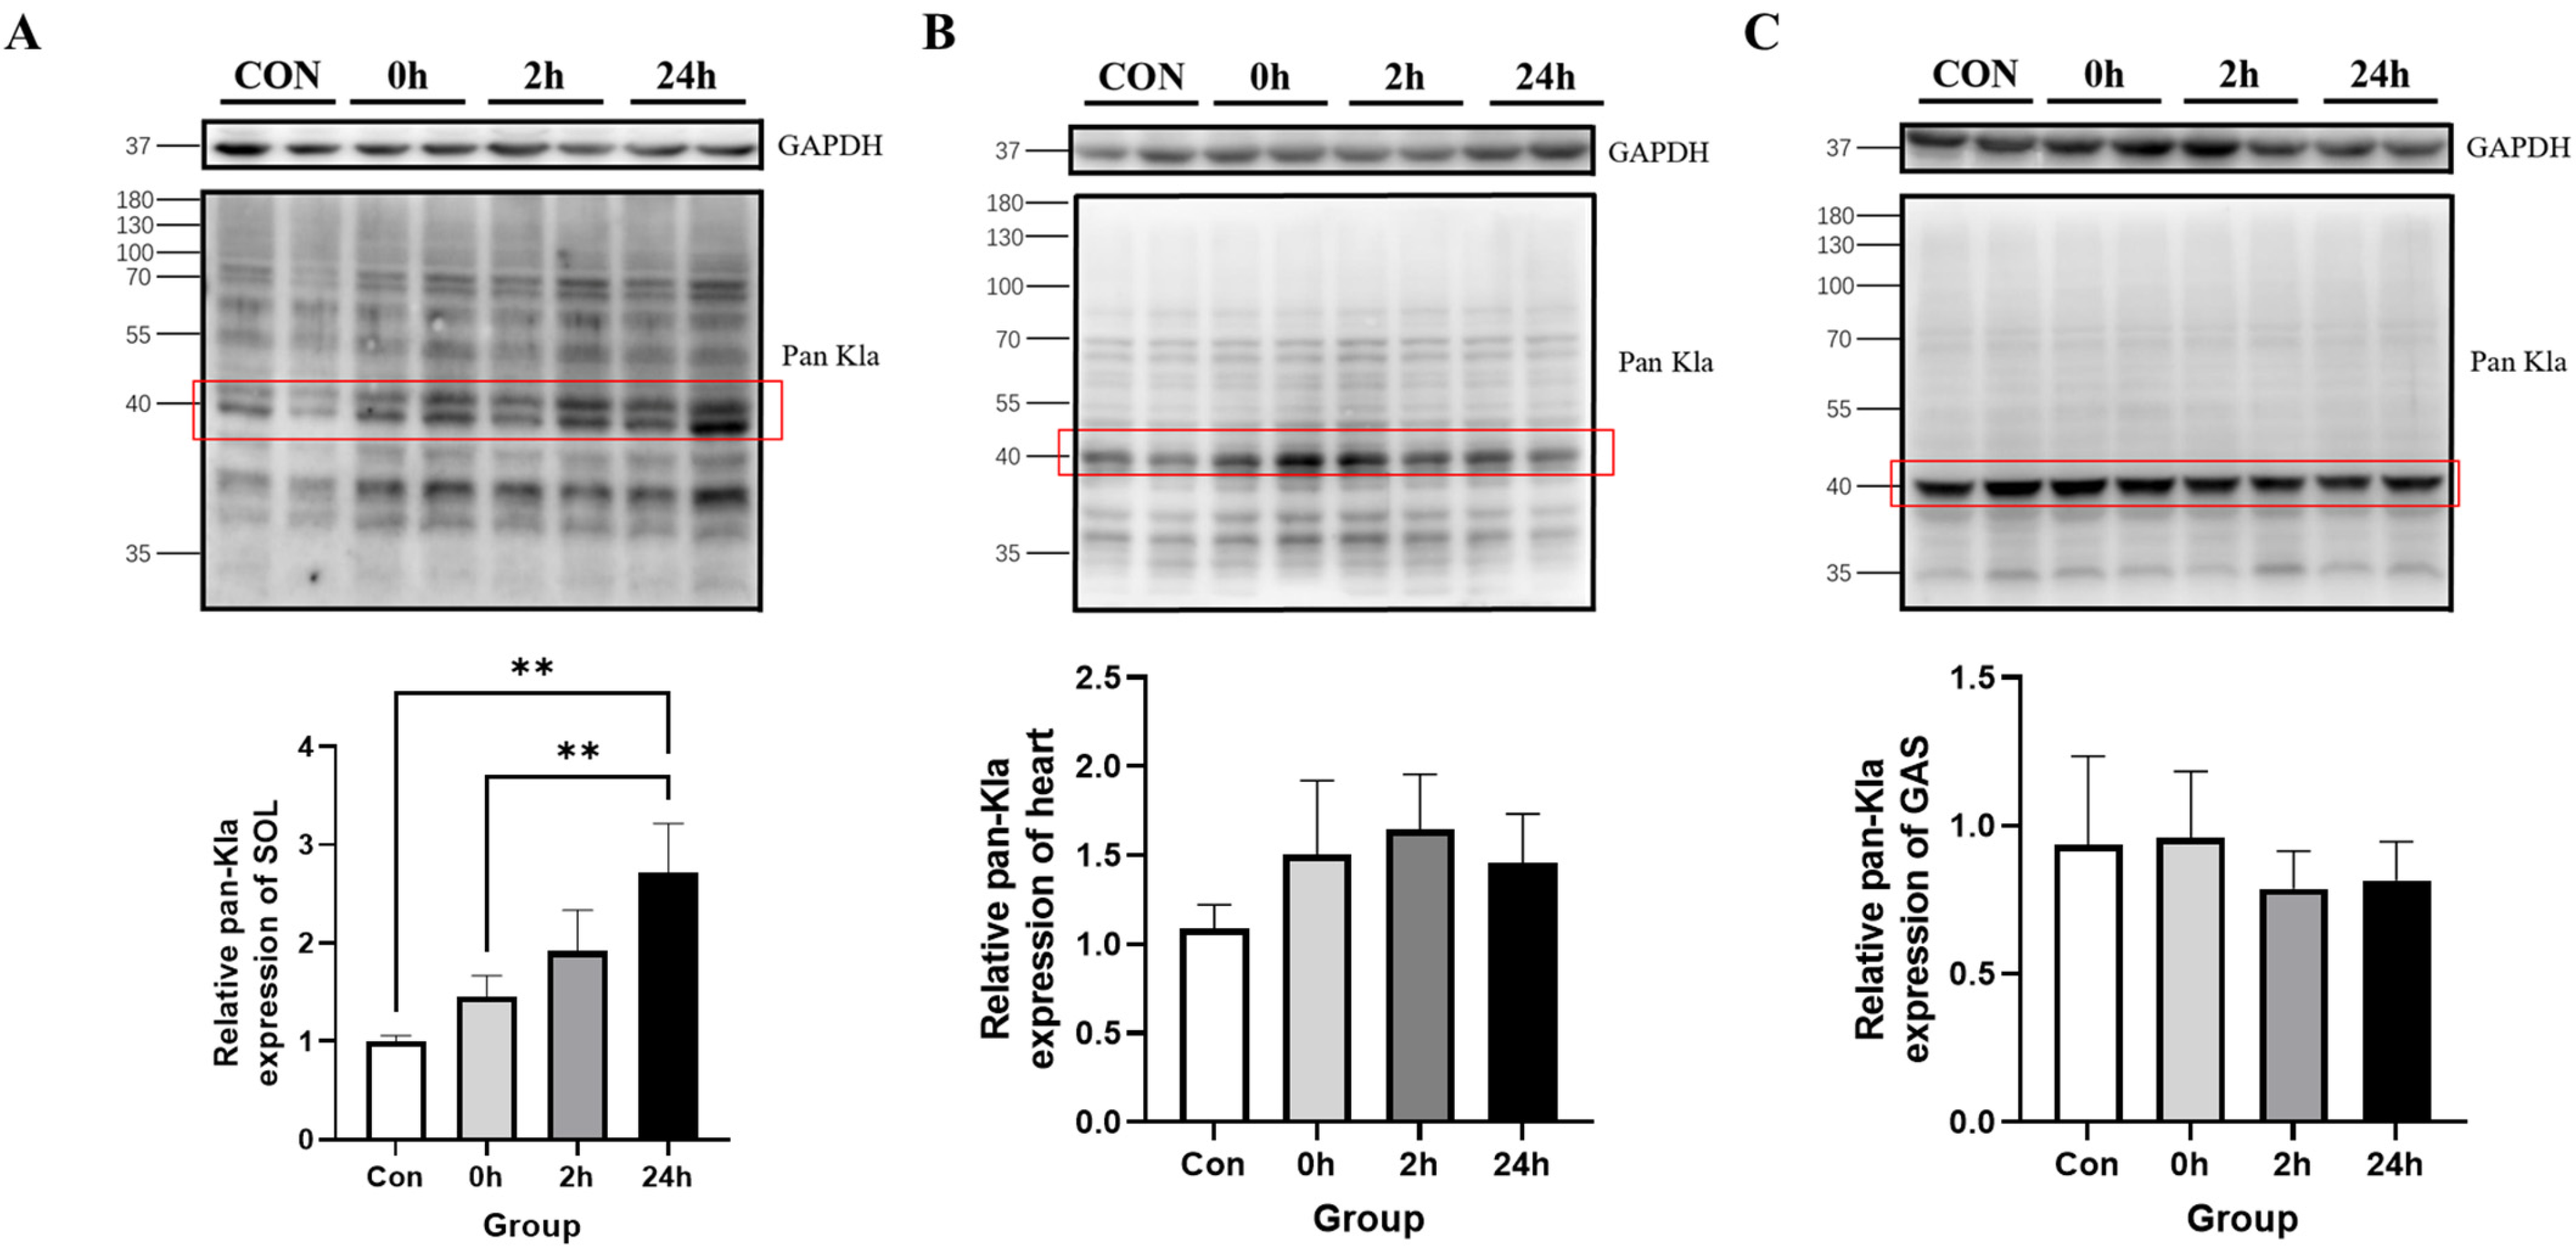
3.2. Effect of HIIT on Lactylation of Proteins from Different Tissues
3.2.1. Effect of HIIT on Lactylation of Adipose Tissue Proteins
3.2.2. Effect of HIIT on Lactylation of Cardiac and Skeletal Muscle Proteins
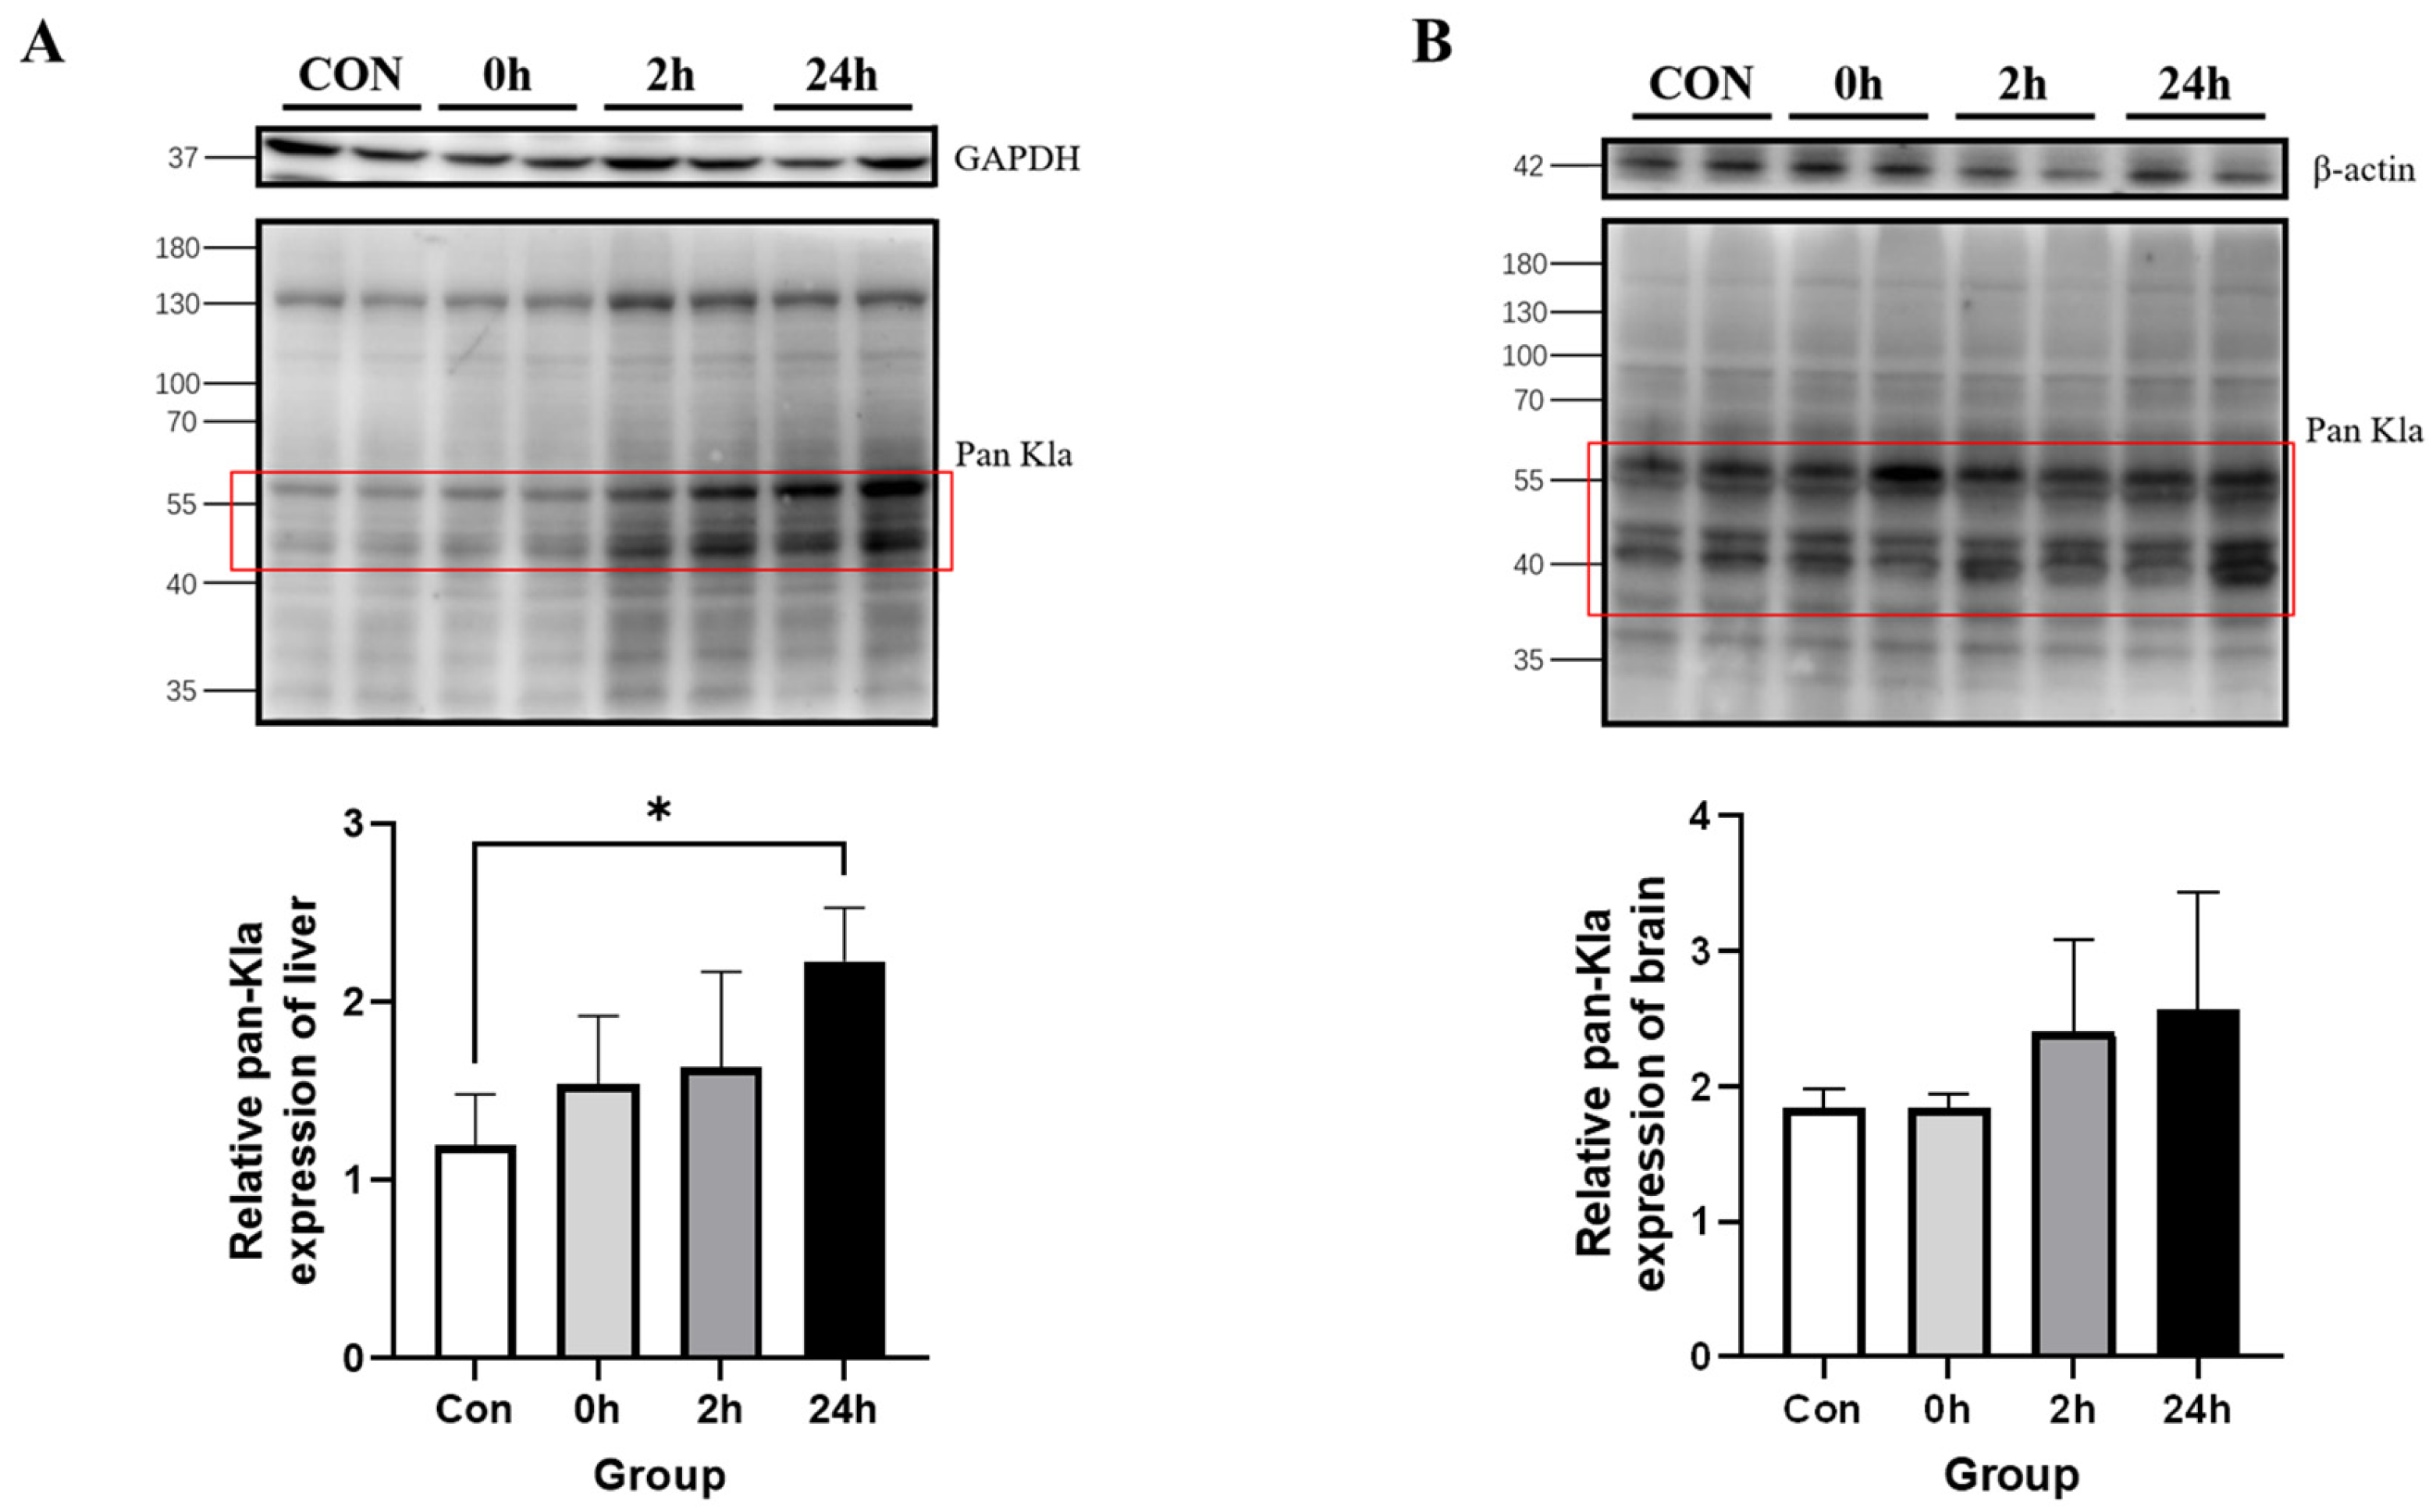
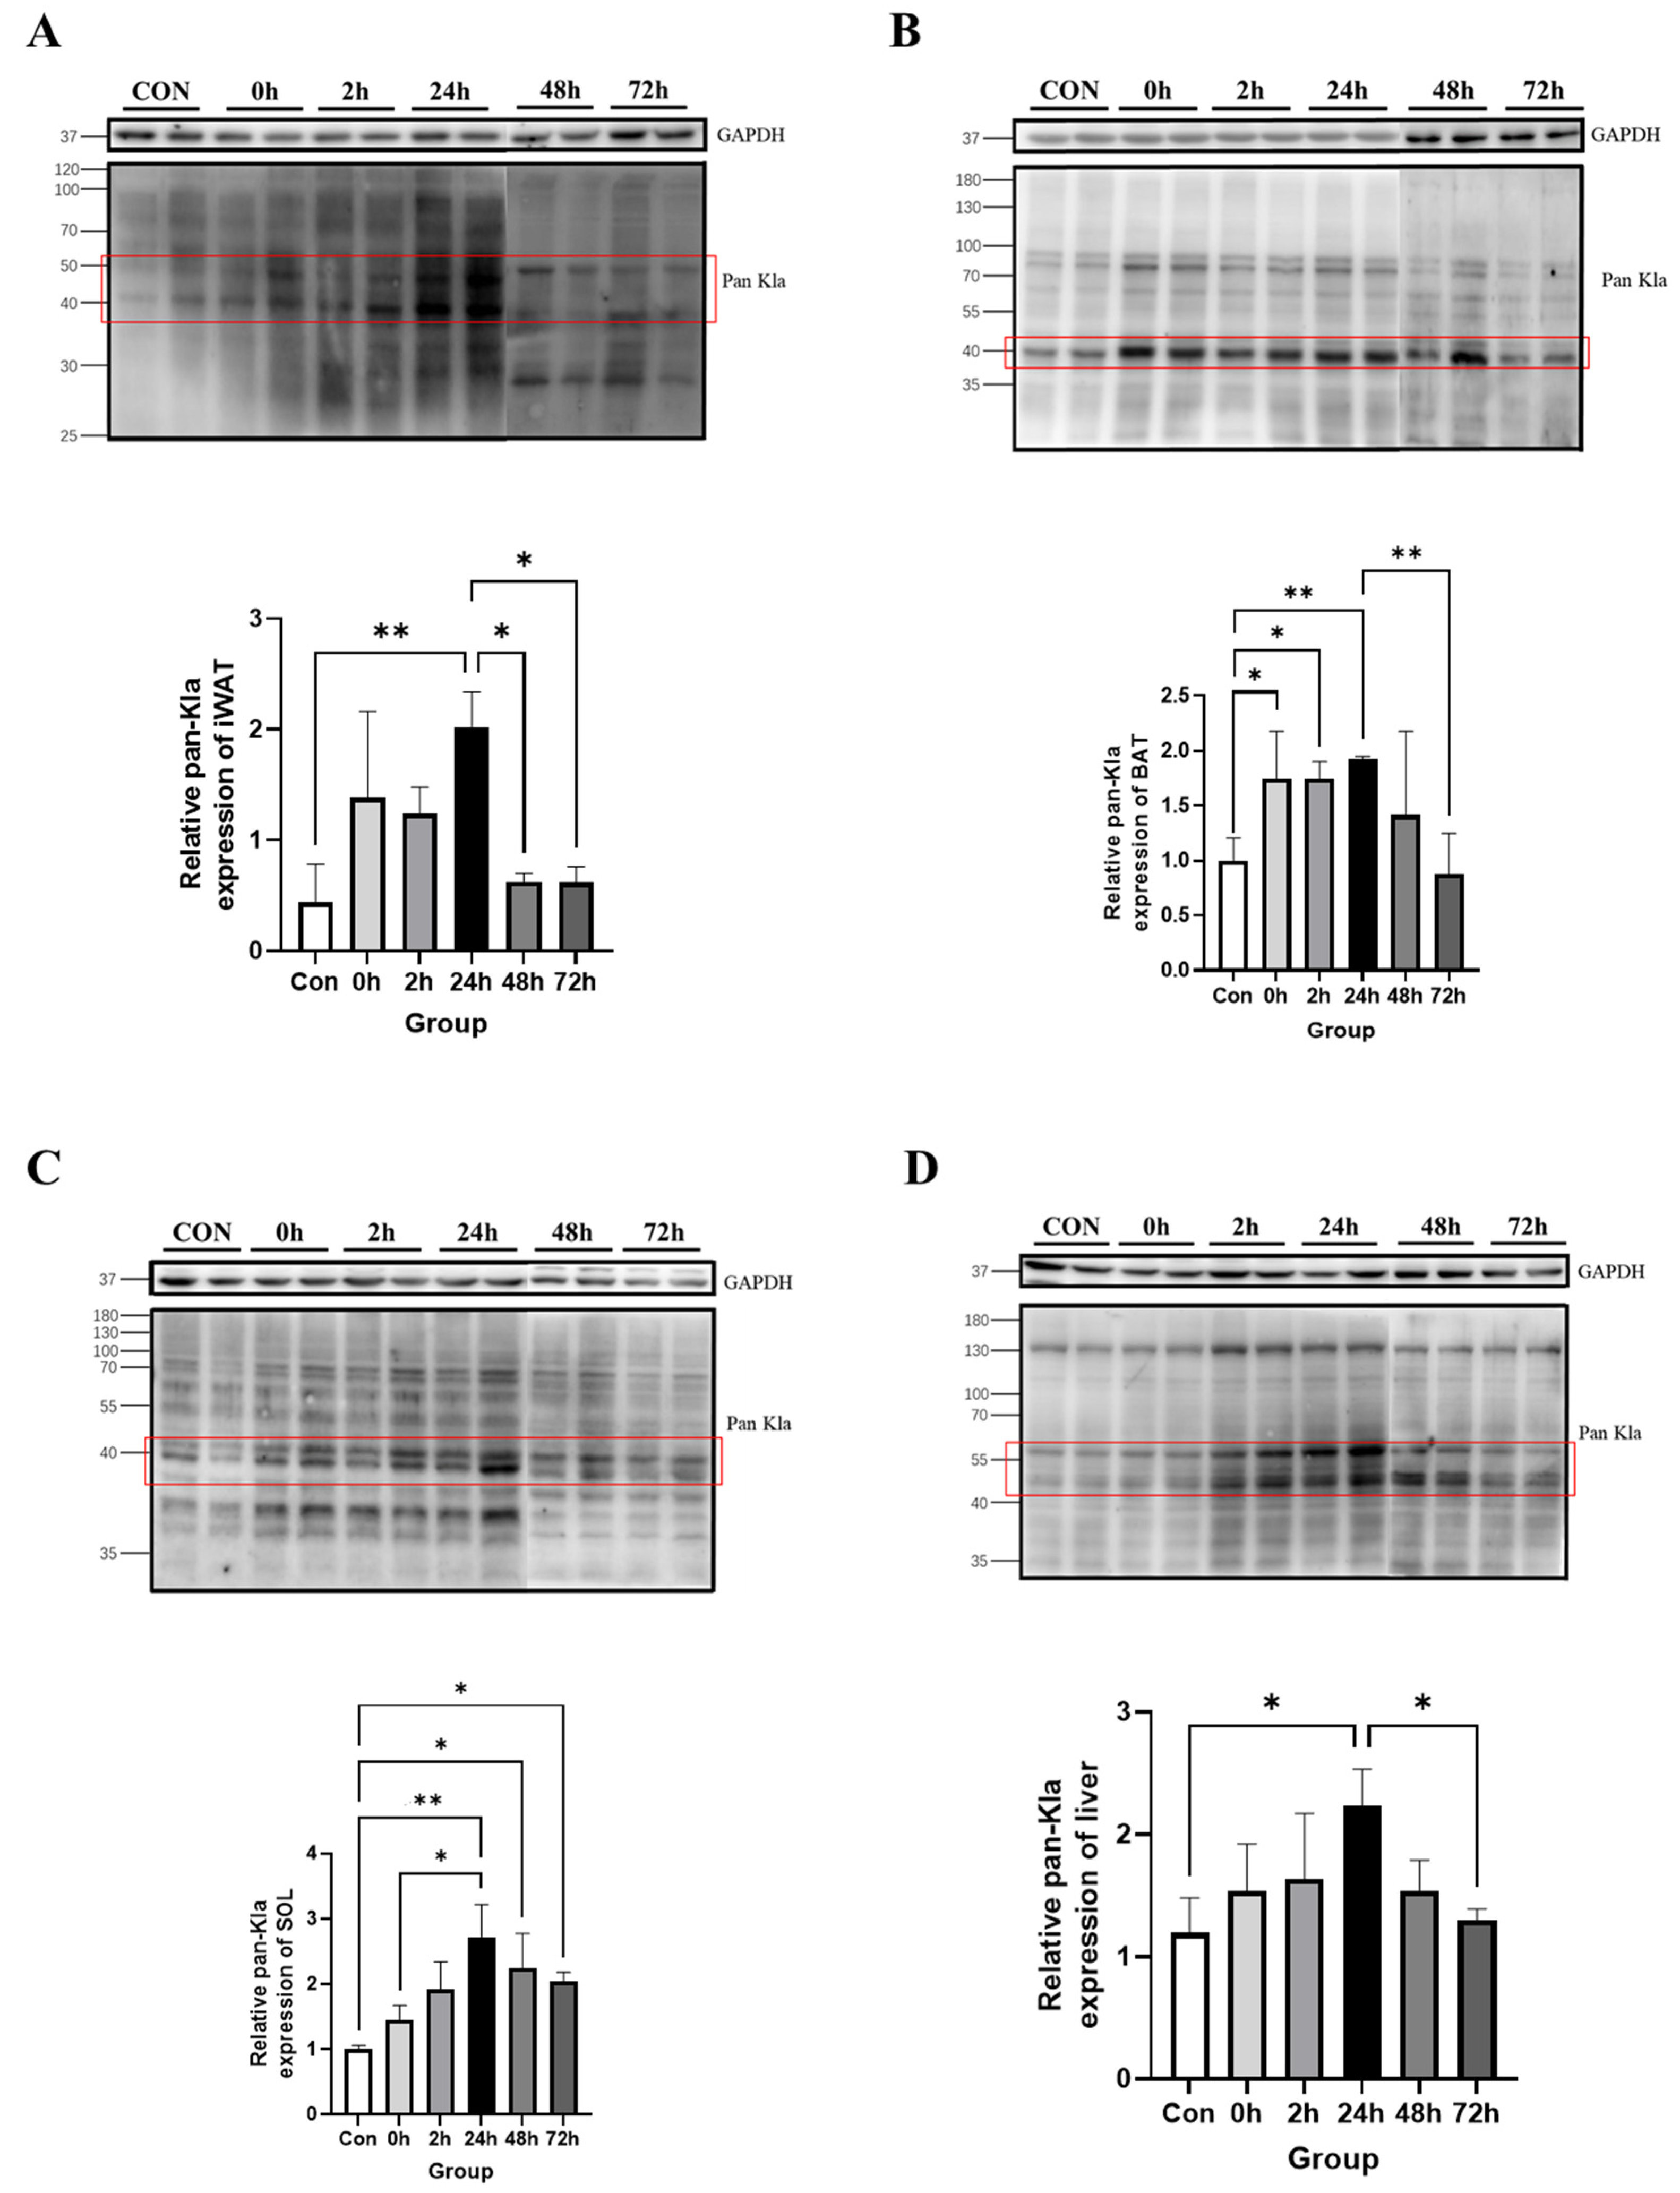
3.2.3. Effect of HIIT on Lactylation of Other Tissue Proteins
3.2.4. Time-Dependent Effect of HIIT on Tissues with Specific Changes in Lactylation
3.3. Quantitative Proteomic Analysis of Lysine Lactylation in Mouse iWAT
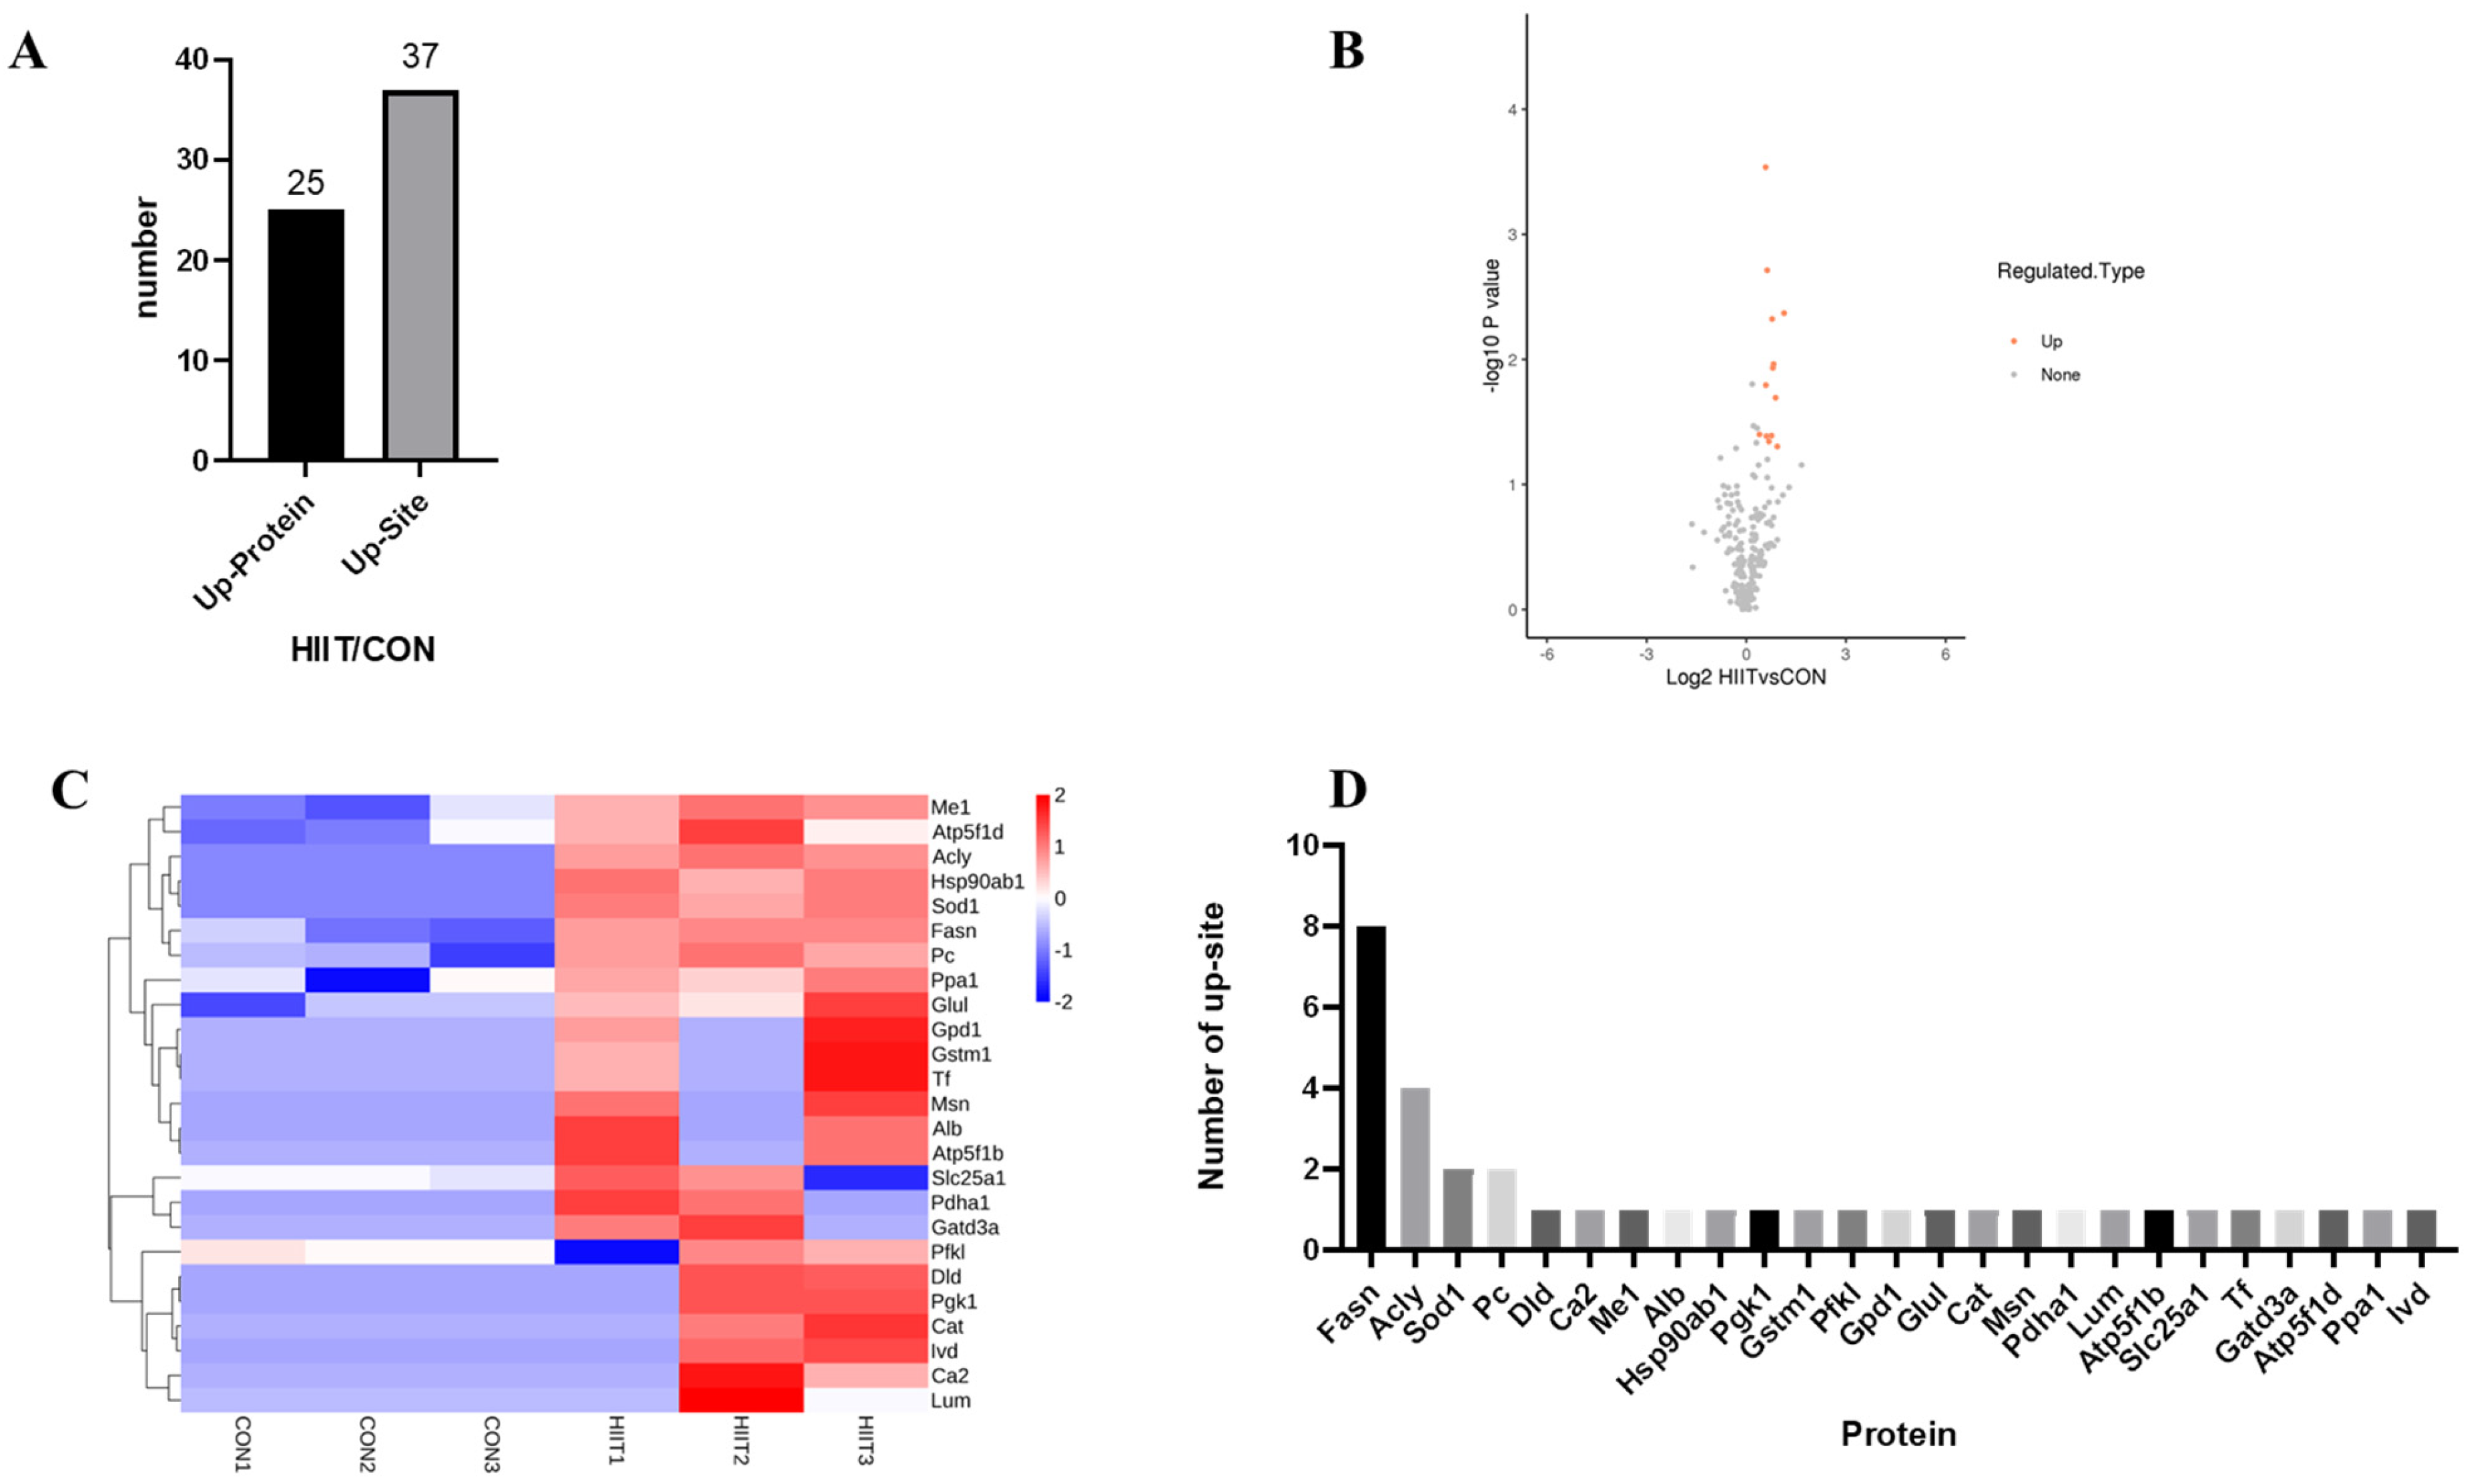
3.3.1. Kla-Upregulated Protein Screening
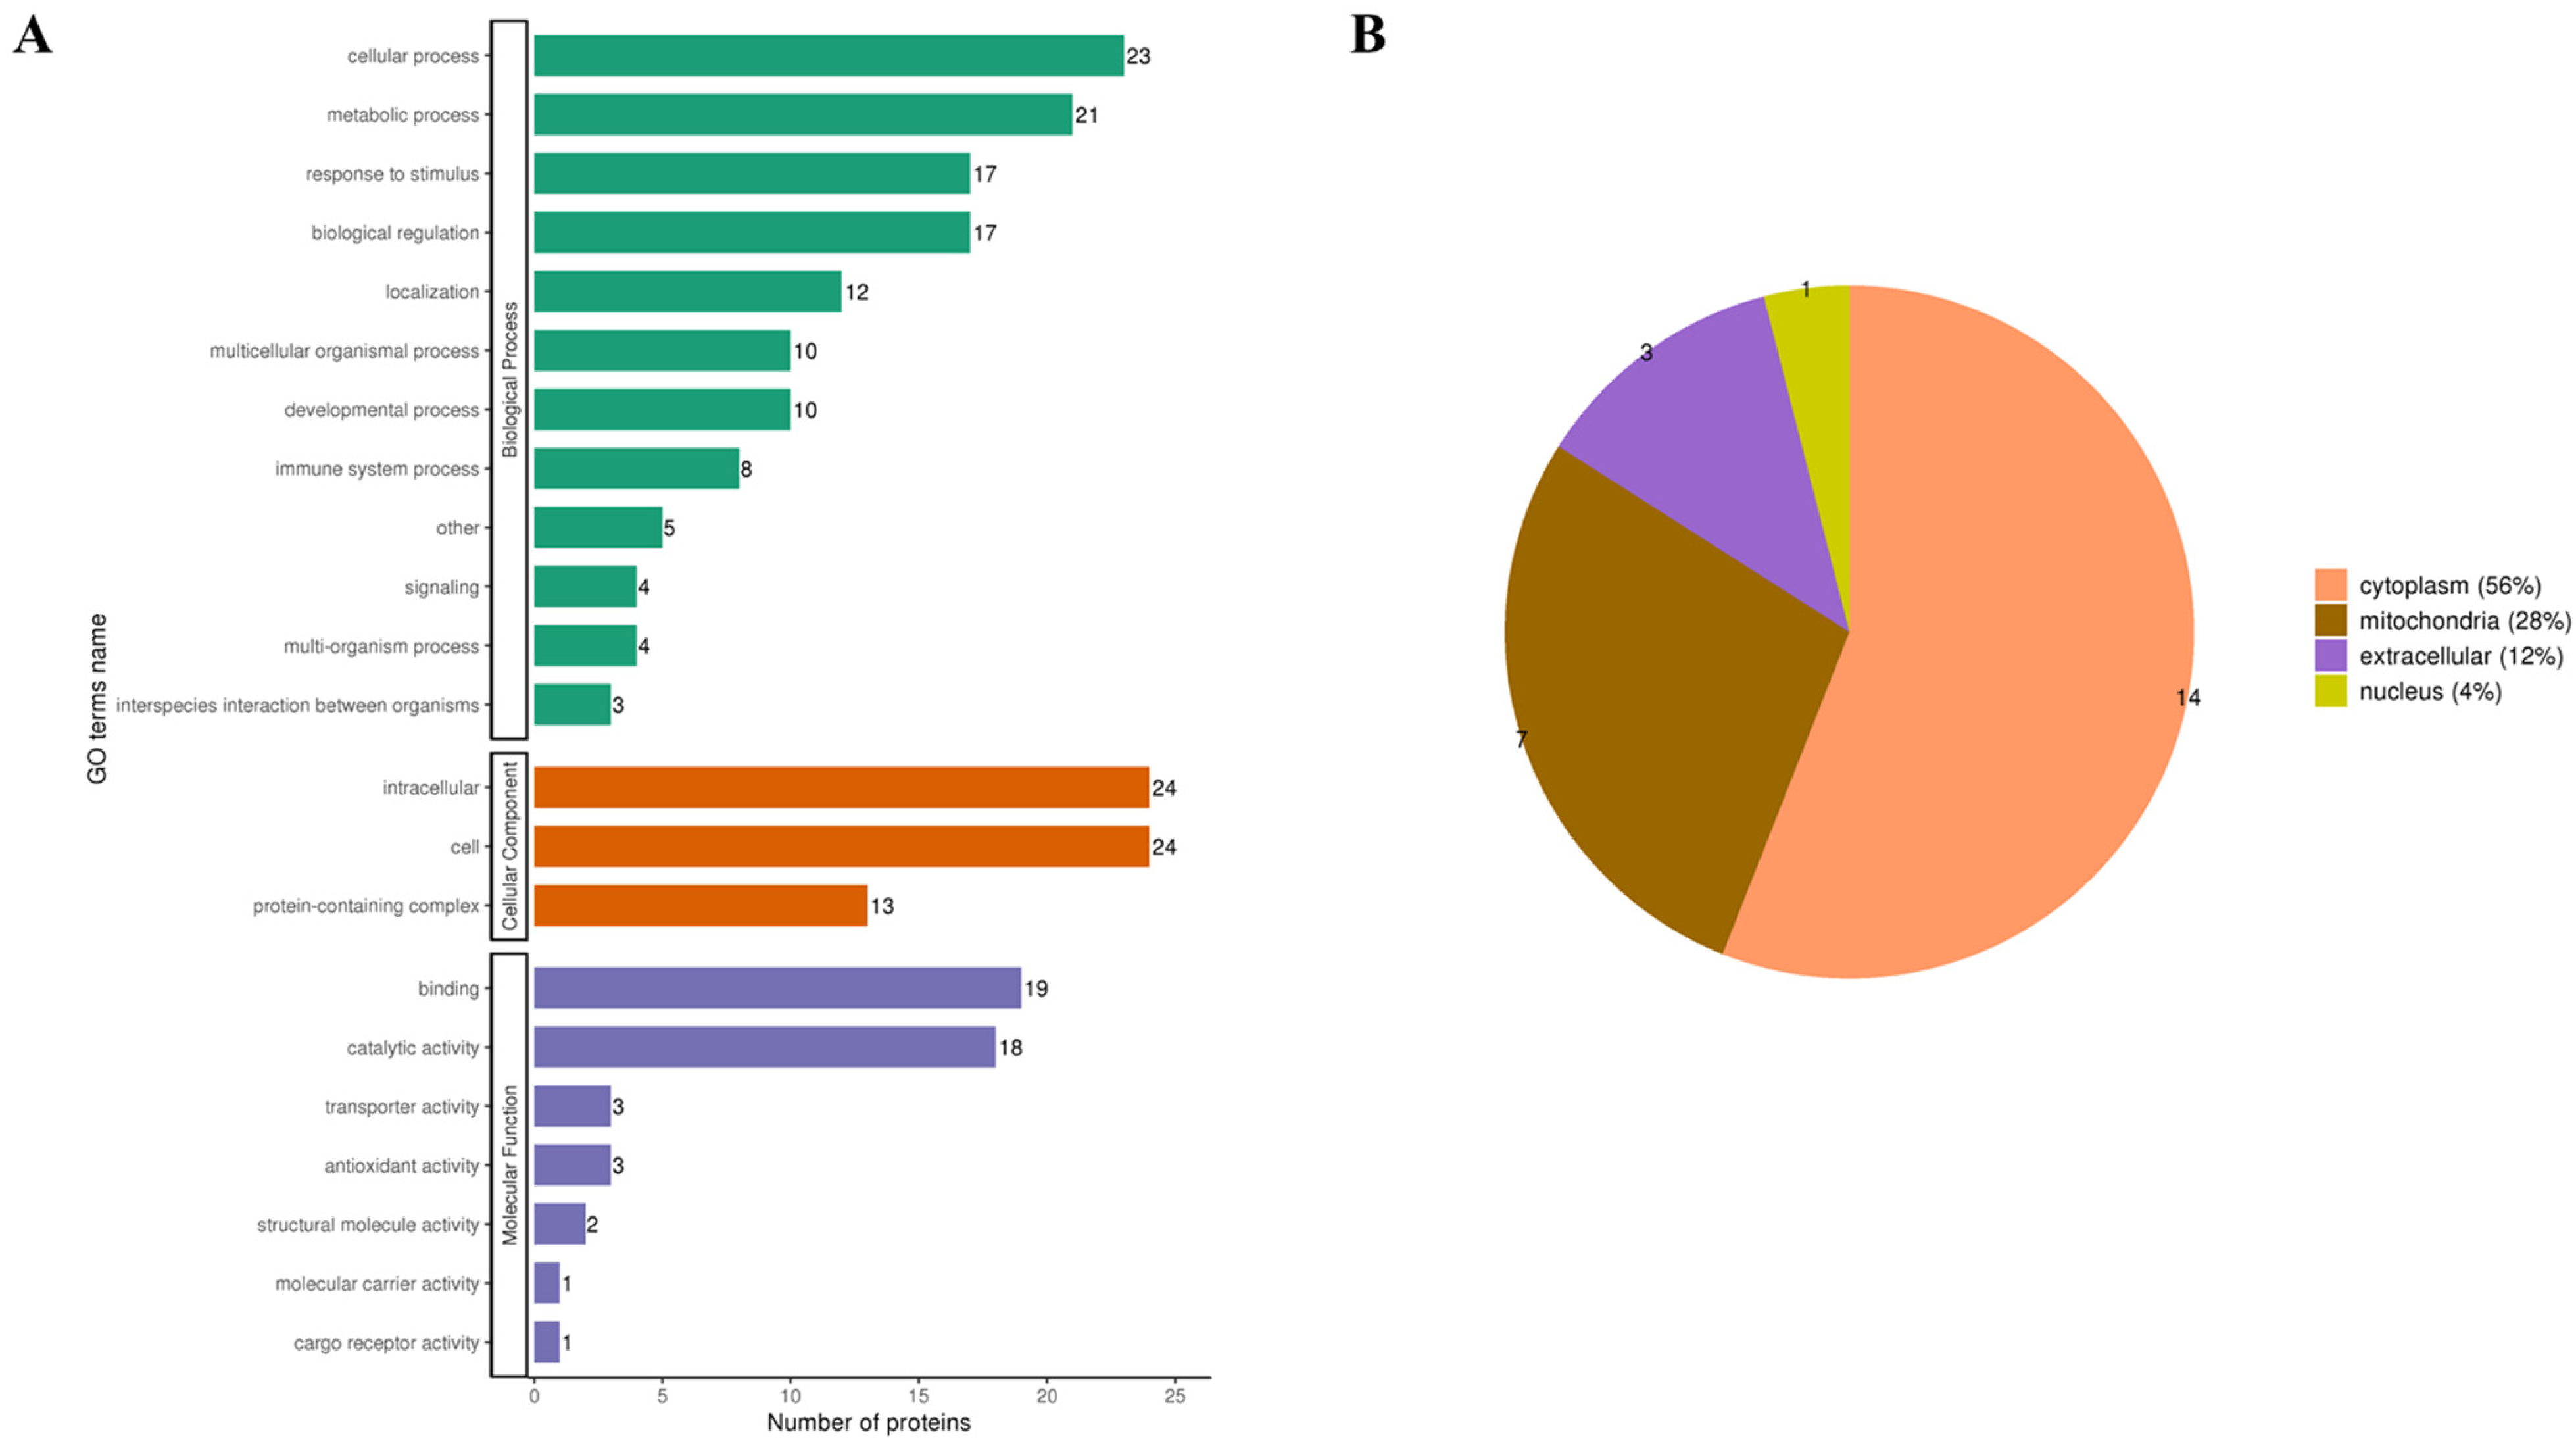
3.3.2. Functional Classification of Kla-Upregulated Proteins
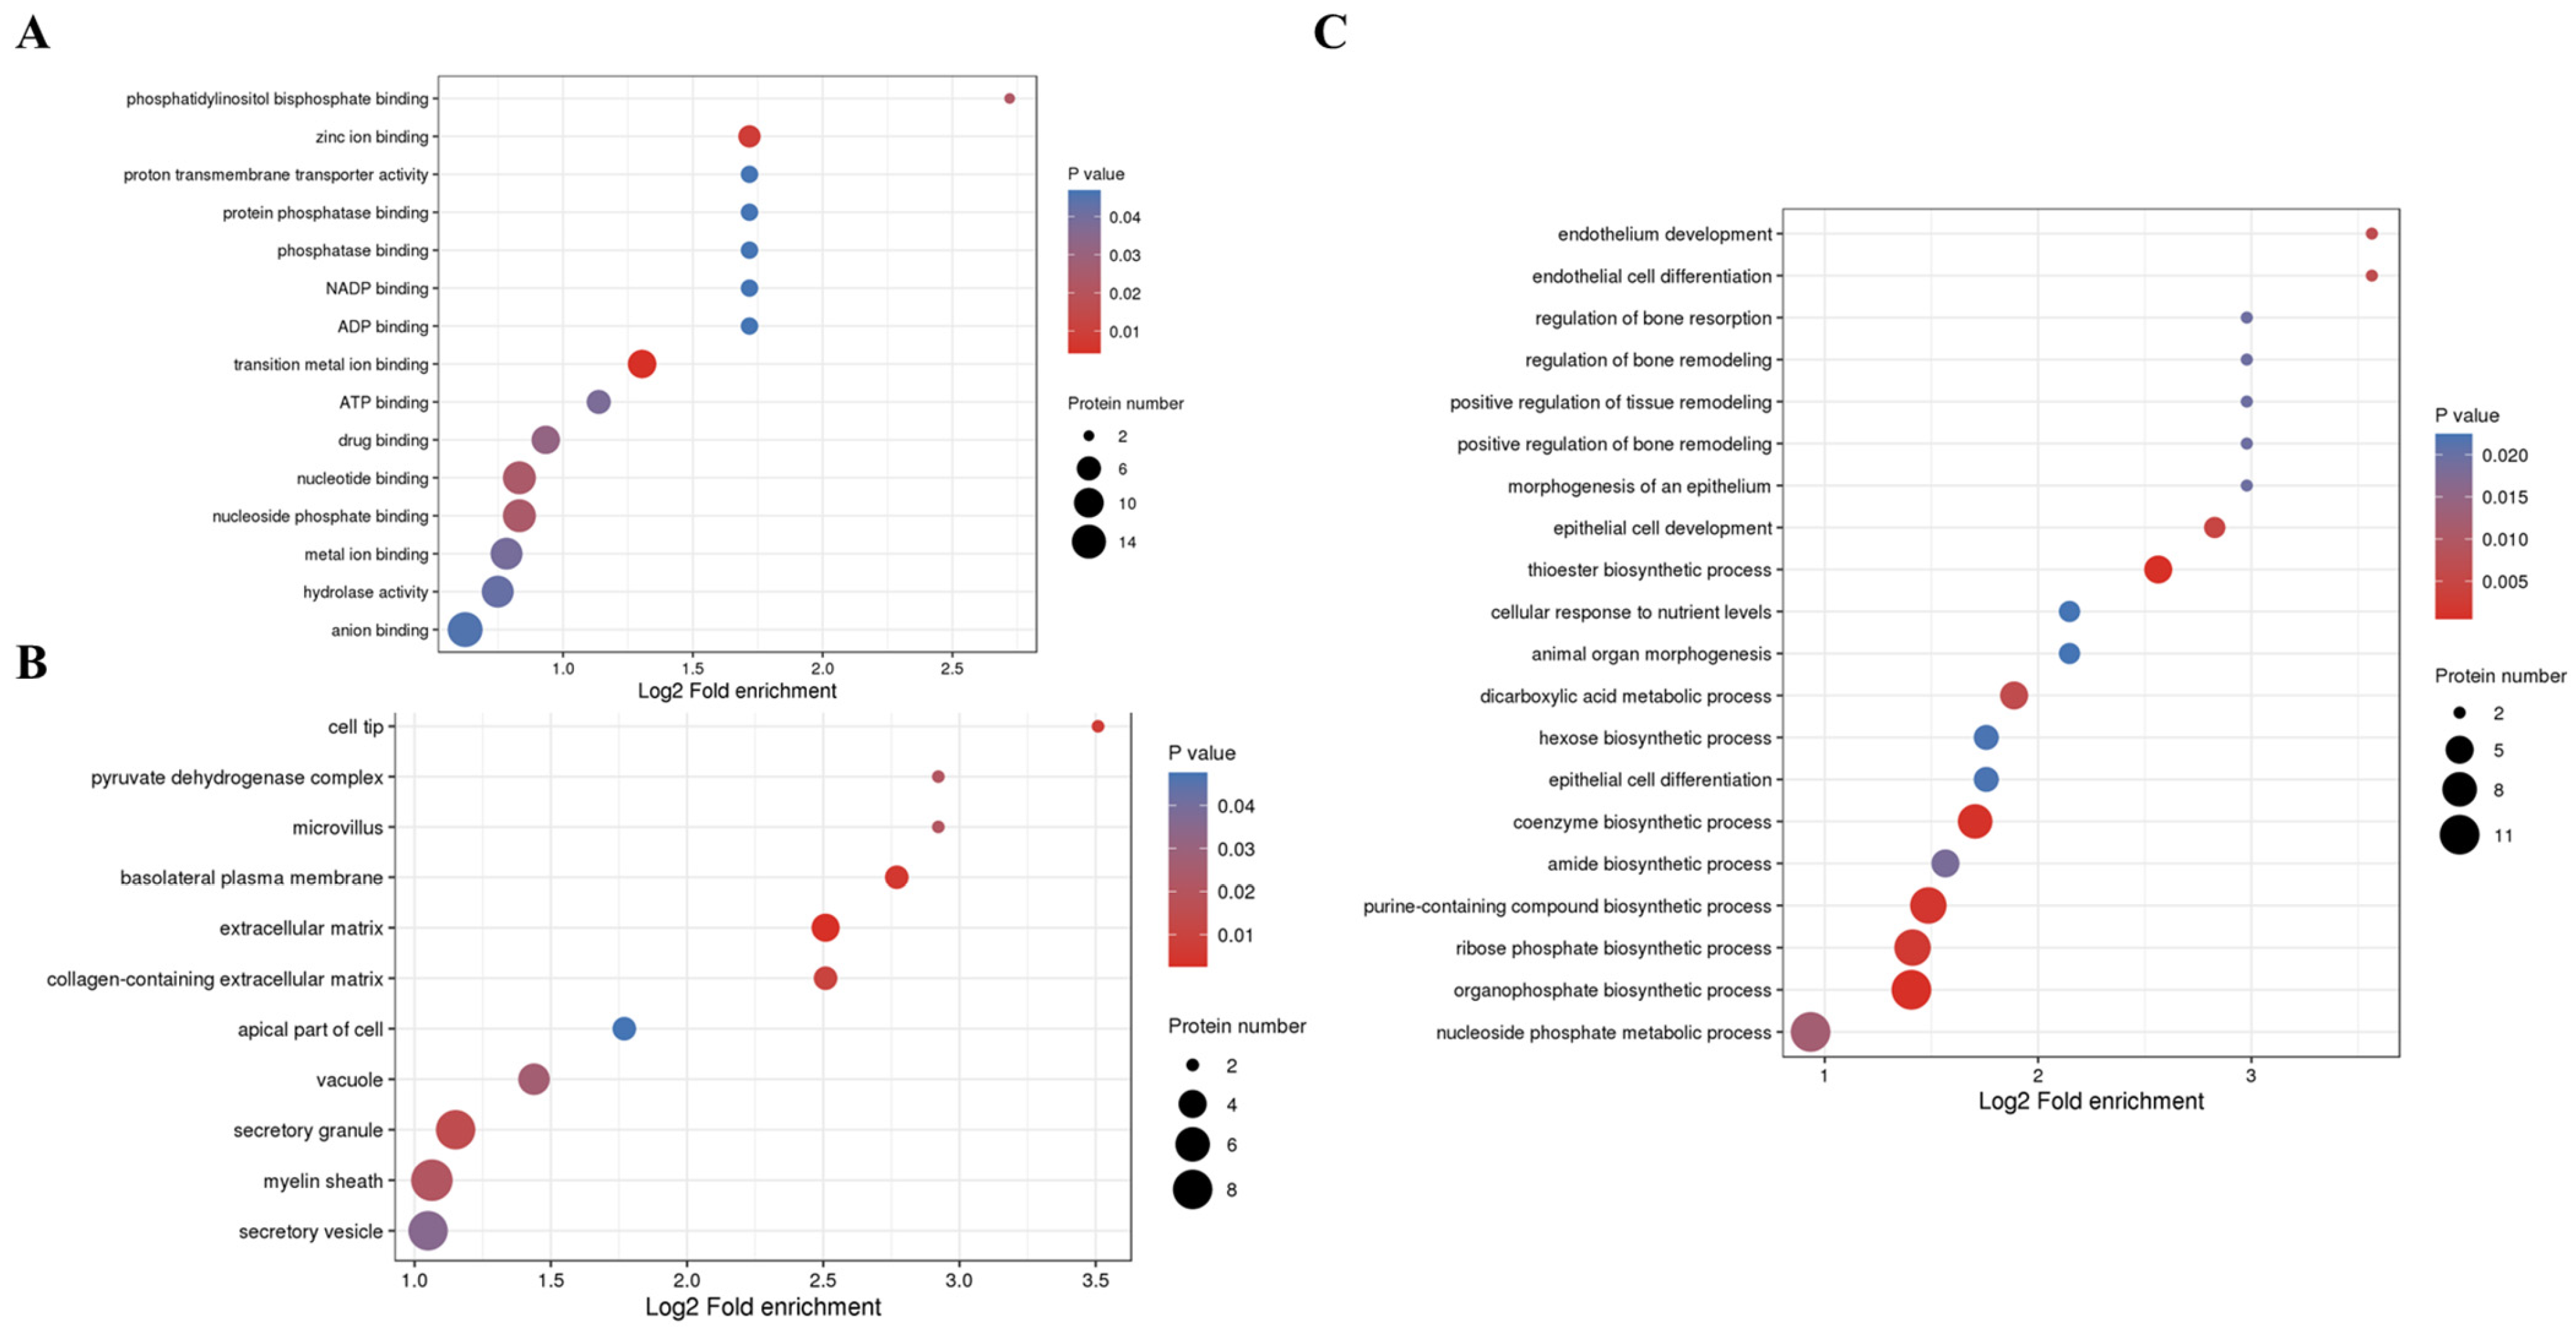
3.3.3. Kla Upregulates Protein GO Enrichment Function
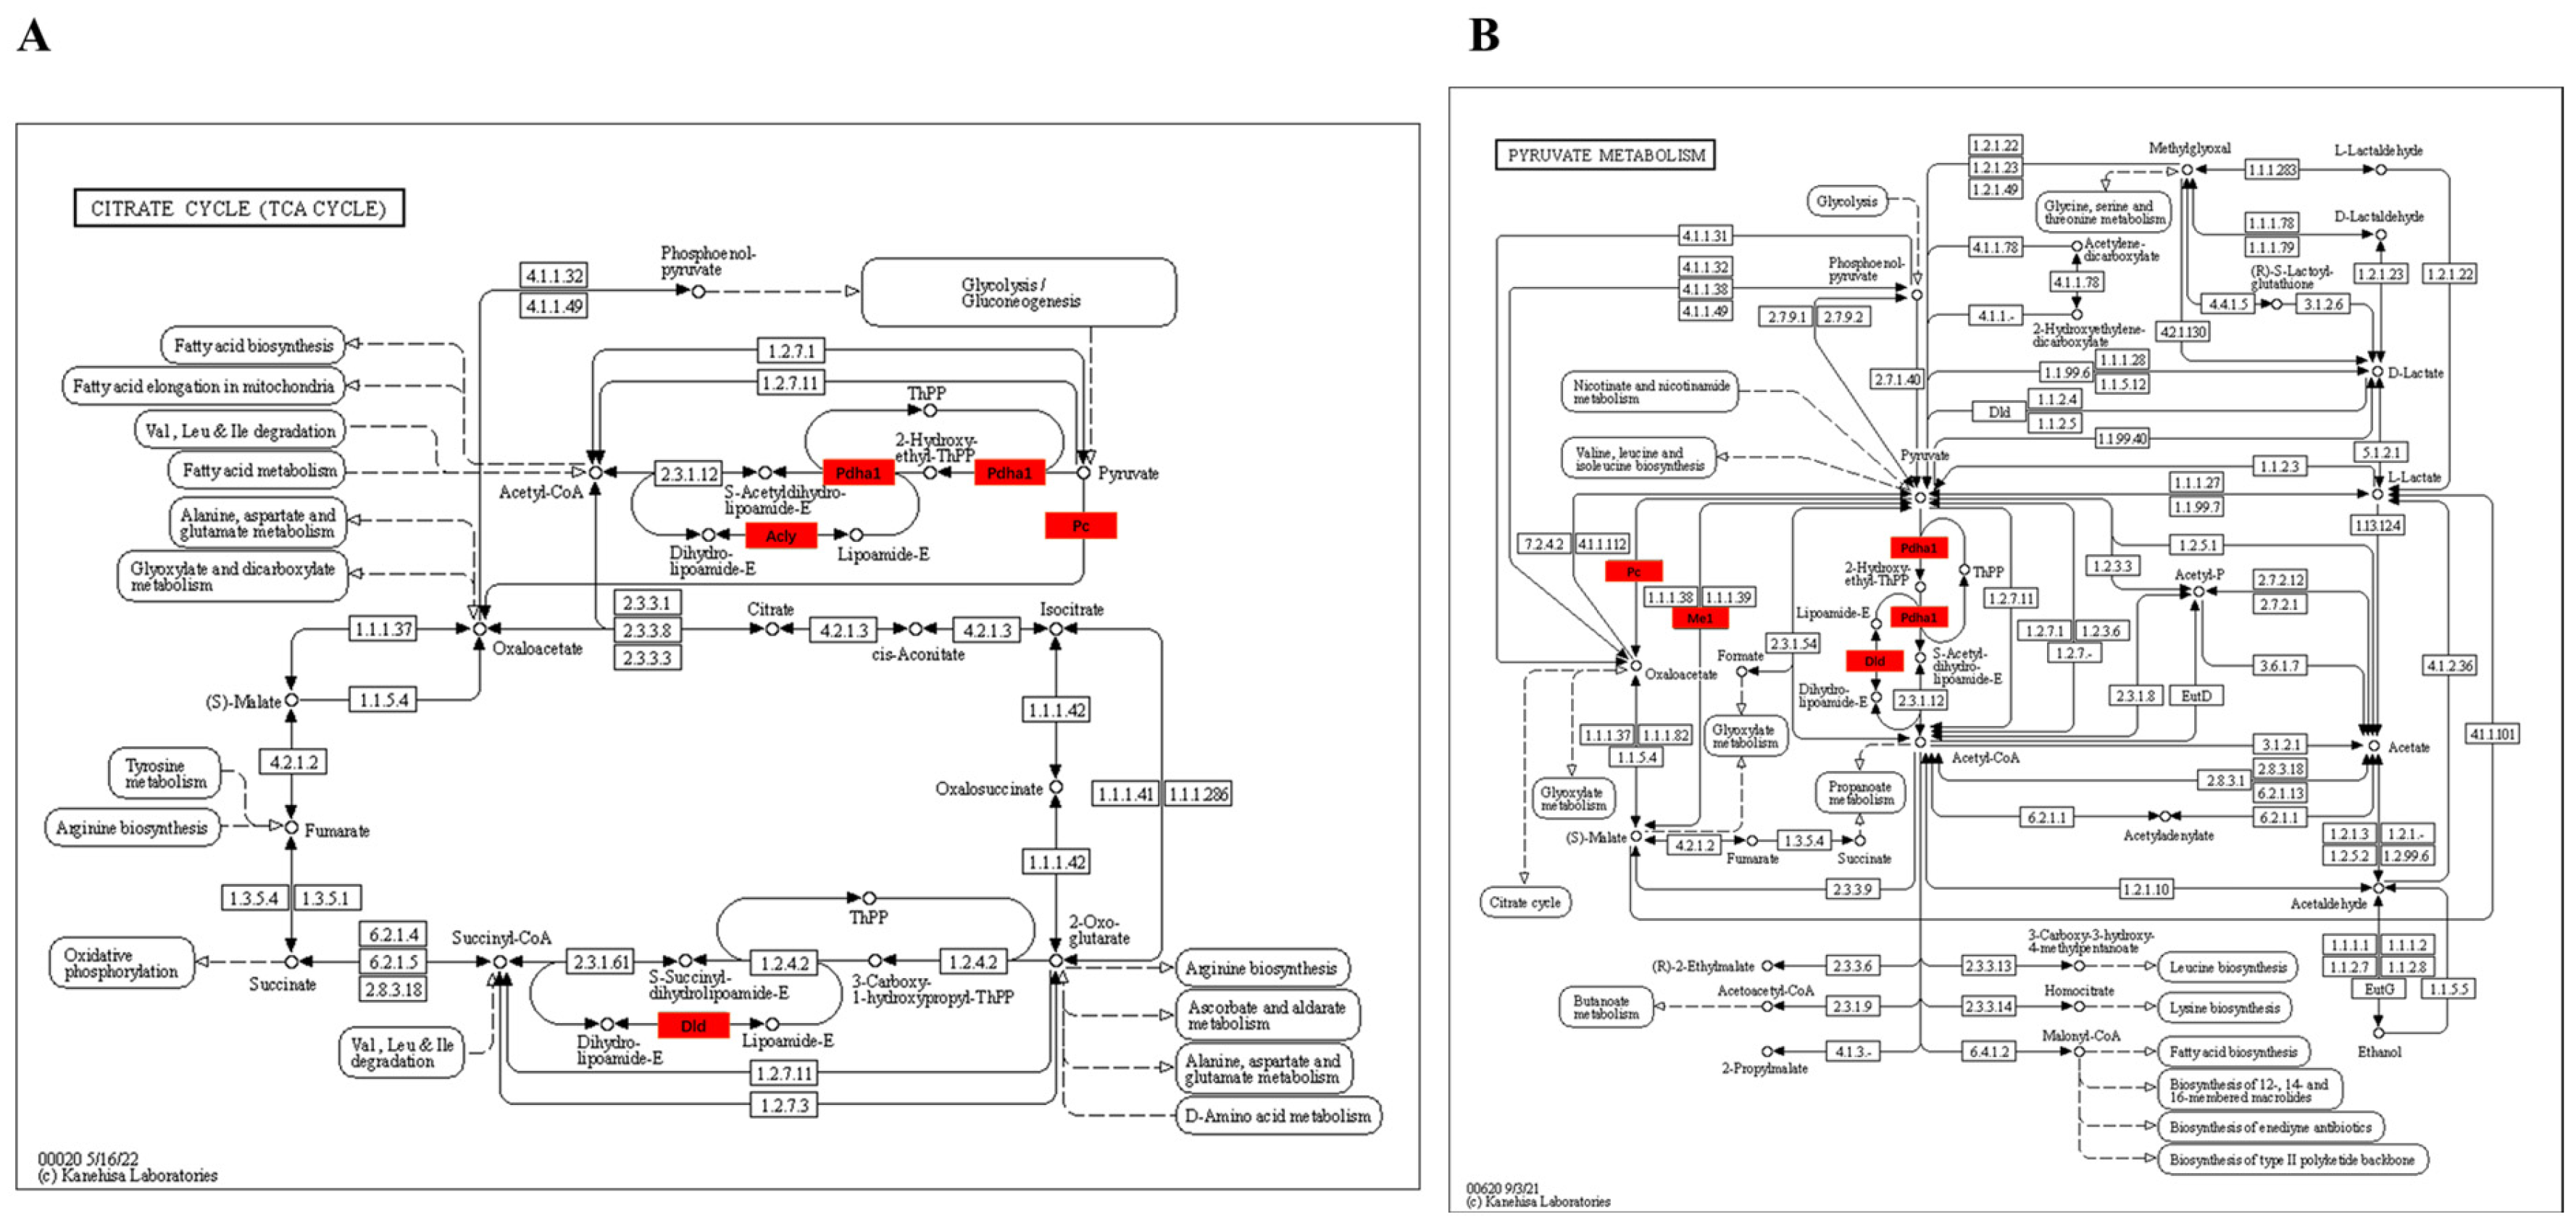
3.3.4. KEGG Enrichment Pathway of Kla-Upregulated Proteins
4. Discussion
4.1. Tissue Specificity of HIIT-Induced Kla
4.2. Time Dependence of HIIT-Induced Kla
4.3. Biological Effects of HIIT-Induced Kla
5. Conclusions
Author Contributions
Funding
Institutional Review Board Statement
Informed Consent Statement
Data Availability Statement
Conflicts of Interest
References
- Zhang, D.; Tang, Z.; Huang, H.; Zhou, G.; Cui, C.; Weng, Y.; Liu, W.; Kim, S.; Lee, S.; Perez-Neut, M.; et al. Metabolic regulation of gene expression by histone lactylation. Nature 2019, 574, 575–580. [Google Scholar] [CrossRef] [PubMed]
- Xiong, J.; He, J.; Zhu, J.; Pan, J.; Liao, W.; Ye, H.; Wang, H.; Song, Y.; Du, Y.; Cui, B.; et al. Lactylation-driven METTL3-mediated RNA m(6)A modification promotes immunosuppression of tumor-infiltrating myeloid cells. Mol. Cell 2022, 82, 1660–1677. [Google Scholar] [CrossRef] [PubMed]
- Yu, J.; Chai, P.; Xie, M.; Ge, S.; Ruan, J.; Fan, X.; Jia, R. Histone lactylation drives oncogenesis by facilitating m(6)A reader protein YTHDF2 expression in ocular melanoma. Genome Biol. 2021, 22, 85. [Google Scholar] [CrossRef] [PubMed]
- Yang, K.; Fan, M.; Wang, X.; Xu, J.; Wang, Y.; Tu, F.; Gill, P.S.; Ha, T.; Liu, L.; Williams, D.L.; et al. Lactate promotes macrophage HMGB1 lactylation, acetylation, and exosomal release in polymicrobial sepsis. Cell Death Differ. 2022, 29, 133–146. [Google Scholar] [CrossRef]
- Hagihara, H.; Shoji, H.; Otabi, H.; Toyoda, A.; Katoh, K.; Namihira, M.; Miyakawa, T. Protein lactylation induced by neural excitation. Cell Rep. 2021, 37, 109820. [Google Scholar] [CrossRef] [PubMed]
- Pan, R.Y.; He, L.; Zhang, J.; Liu, X.; Liao, Y.; Gao, J.; Liao, Y.; Yan, Y.; Li, Q.; Zhou, X.; et al. Positive feedback regulation of microglial glucose metabolism by histone H4 lysine 12 lactylation in Alzheimer’s disease. Cell Metab. 2022, 34, 634–648. [Google Scholar] [CrossRef]
- Logan, G.R.; Harris, N.; Duncan, S.; Schofield, G. A review of adolescent high-intensity interval training. Sport. Med. 2014, 44, 1071–1085. [Google Scholar] [CrossRef]
- Liu, Q.Q.; Xie, W.Q.; Luo, Y.X.; Li, Y.D.; Huang, W.H.; Wu, Y.X.; Li, Y.S. High Intensity Interval Training: A Potential Method for Treating Sarcopenia. Clin. Interv. Aging 2022, 17, 857–872. [Google Scholar] [CrossRef]
- Ross, L.M.; Porter, R.R.; Durstine, J.L. High-intensity interval training (HIIT) for patients with chronic diseases. J. Sport Health Sci. 2016, 5, 139–144. [Google Scholar] [CrossRef]
- Fredrickson, G.; Barrow, F.; Dietsche, K.; Parthiban, P.; Khan, S.; Robert, S.; Demirchian, M.; Rhoades, H.; Wang, H.; Adeyi, O.; et al. Exercise of high intensity ameliorates hepatic inflammation and the progression of NASH. Mol. Metab. 2021, 53, 101270. [Google Scholar] [CrossRef]
- Lovatel, G.A.; Elsner, V.R.; Bertoldi, K.; Vanzella, C.; Moyses, F.S.; Vizuete, A.; Spindler, C.; Cechinel, L.R.; Netto, C.A.; Muotri, A.R.; et al. Treadmill exercise induces age-related changes in aversive memory, neuroinflammatory and epigenetic processes in the rat hippocampus. Neurobiol. Learn. Mem. 2013, 101, 94–102. [Google Scholar] [CrossRef] [PubMed]
- Overmyer, K.A.; Evans, C.R.; Qi, N.R.; Minogue, C.E.; Carson, J.J.; Chermside-Scabbo, C.J.; Koch, L.G.; Britton, S.L.; Pagliarini, D.J.; Coon, J.J.; et al. Maximal oxidative capacity during exercise is associated with skeletal muscle fuel selection and dynamic changes in mitochondrial protein acetylation. Cell Metab. 2015, 21, 468–478. [Google Scholar] [CrossRef] [PubMed]
- Huang, W.H.; Zhang, J.B.; Chen, X.F.; Zhang, J. Research progress of exercise and protein acylation. Prog. Biochem. Biophys. 2022, 49, 454–467. [Google Scholar] [CrossRef]
- Liang, F.; Huang, T.; Li, B.; Zhao, Y.; Zhang, X.; Xu, B. High-intensity interval training and moderate-intensity continuous training alleviate beta-amyloid deposition by inhibiting NLRP3 inflammasome activation in APPswe/PS1dE9 mice. Neuroreport 2020, 31, 425–432. [Google Scholar] [CrossRef] [PubMed]
- Brooks, G.A. The tortuous path of lactate shuttle discovery: From cinders and boards to the lab and ICU. J. Sport Health Sci. 2020, 9, 446–460. [Google Scholar] [CrossRef]
- Fisel, P.; Schaeffeler, E.; Schwab, M. Clinical and Functional Relevance of the Monocarboxylate Transporter Family in Disease Pathophysiology and Drug Therapy. Clin. Transl. Sci. 2018, 11, 352–364. [Google Scholar] [CrossRef]
- Adeva-Andany, M.; Lopez-Ojen, M.; Funcasta-Calderon, R.; Ameneiros-Rodriguez, E.; Donapetry-Garcia, C.; Vila-Altesor, M.; Rodriguez-Seijas, J. Comprehensive review on lactate metabolism in human health. Mitochondrion 2014, 17, 76–100. [Google Scholar] [CrossRef]
- Mu, W.J.; Zhu, J.Y.; Chen, M.; Guo, L. Exercise-Mediated Browning of White Adipose Tissue: Its Significance, Mechanism and Effectiveness. Int. J. Mol. Sci. 2021, 22, 11512. [Google Scholar] [CrossRef]
- Carriere, A.; Lagarde, D.; Jeanson, Y.; Portais, J.C.; Galinier, A.; Ader, I.; Casteilla, L. The emerging roles of lactate as a redox substrate and signaling molecule in adipose tissues. J. Physiol. Biochem. 2020, 76, 241–250. [Google Scholar] [CrossRef]
- Joseph, J.S.; Ayeleso, A.O.; Mukwevho, E. Exercise increases hyper-acetylation of histones on the Cis-element of NRF-1 binding to the Mef2a promoter: Implications on type 2 diabetes. Biochem. Biophys. Res. Commun. 2017, 486, 83–87. [Google Scholar] [CrossRef]
- Masuzawa, R.; Konno, R.; Ohsawa, I.; Watanabe, A.; Kawano, F. Muscle type-specific RNA polymerase II recruitment during PGC-1alpha gene transcription after acute exercise in adult rats. J. Appl. Physiol. 2018, 125, 1238–1245. [Google Scholar] [CrossRef] [PubMed]
- Seaborne, R.A.; Sharples, A.P. The Interplay Between Exercise Metabolism, Epigenetics, and Skeletal Muscle Remodeling. Exerc. Sport Sci. Rev. 2020, 48, 188–200. [Google Scholar] [CrossRef] [PubMed]
- Evans, M.; Cogan, K.E.; Egan, B. Metabolism of ketone bodies during exercise and training: Physiological basis for exogenous supplementation. J. Physiol. 2017, 595, 2857–2871. [Google Scholar] [CrossRef] [PubMed]
- Nasser, S.; Sole, T.; Vega, N.; Thomas, T.; Balcerczyk, A.; Strigini, M.; Pirola, L. Ketogenic diet administration to mice after a high-fat-diet regimen promotes weight loss, glycemic normalization and induces adaptations of ketogenic pathways in liver and kidney. Mol. Metab. 2022, 65, 101578. [Google Scholar] [CrossRef]
- Yao, Y.; Bade, R.; Li, G.; Zhang, A.; Zhao, H.; Fan, L.; Zhu, R.; Yuan, J. Global-Scale Profiling of Differential Expressed Lysine-Lactylated Proteins in the Cerebral Endothelium of Cerebral Ischemia-Reperfusion Injury Rats. Cell. Mol. Neurobiol. 2022. [Google Scholar] [CrossRef]
- Enoki, T.; Yoshida, Y.; Lally, J.; Hatta, H.; Bonen, A. Testosterone increases lactate transport, monocarboxylate transporter (MCT) 1 and MCT4 in rat skeletal muscle. J. Physiol. 2006, 577, 433–443. [Google Scholar] [CrossRef]
- Latham, T.; Mackay, L.; Sproul, D.; Karim, M.; Culley, J.; Harrison, D.J.; Hayward, L.; Langridge-Smith, P.; Gilbert, N.; Ramsahoye, B.H. Lactate, a product of glycolytic metabolism, inhibits histone deacetylase activity and promotes changes in gene expression. Nucleic Acids Res. 2012, 40, 4794–4803. [Google Scholar] [CrossRef]
- Feng, Q.; Liu, Z.; Yu, X.; Huang, T.; Chen, J.; Wang, J.; Wilhelm, J.; Li, S.; Song, J.; Li, W.; et al. Lactate increases stemness of CD8 + T cells to augment anti-tumor immunity. Nat. Commun. 2022, 13, 4981. [Google Scholar] [CrossRef]
- Moreno-Yruela, C.; Zhang, D.; Wei, W.; Baek, M.; Liu, W.; Gao, J.; Dankova, D.; Nielsen, A.L.; Bolding, J.E.; Yang, L.; et al. Class I histone deacetylases (HDAC1-3) are histone lysine delactylases. Sci. Adv. 2022, 8, i6696. [Google Scholar] [CrossRef]
- Diniz, T.A.; Aquino, J.J.; Mosele, F.C.; Cabral-Santos, C.; Lima, J.E.; Teixeira, A.; Lira, F.S.; Rosa, N.J. Exercise-induced AMPK activation and IL-6 muscle production are disturbed in adiponectin knockout mice. Cytokine 2019, 119, 71–80. [Google Scholar] [CrossRef]
- Parker, B.L.; Kiens, B.; Wojtaszewski, J.; Richter, E.A.; James, D.E. Quantification of exercise-regulated ubiquitin signaling in human skeletal muscle identifies protein modification cross talk via NEDDylation. FASEB J. 2020, 34, 5906–5916. [Google Scholar] [CrossRef] [PubMed]
- Peternelj, T.T.; Marsh, S.A.; Strobel, N.A.; Matsumoto, A.; Briskey, D.; Dalbo, V.J.; Tucker, P.S.; Coombes, J.S. Glutathione depletion and acute exercise increase O-GlcNAc protein modification in rat skeletal muscle. Mol. Cell. Biochem. 2015, 400, 265–275. [Google Scholar] [CrossRef] [PubMed]
- Cui, H.; Xie, N.; Banerjee, S.; Ge, J.; Jiang, D.; Dey, T.; Matthews, Q.L.; Liu, R.M.; Liu, G. Lung Myofibroblasts Promote Macrophage Profibrotic Activity through Lactate-induced Histone Lactylation. Am. J. Respir. Cell Mol. Biol. 2021, 64, 115–125. [Google Scholar] [CrossRef]
- Uekawa, A.; Yamanaka, H.; Lieben, L.; Kimira, Y.; Uehara, M.; Yamamoto, Y.; Kato, S.; Ito, K.; Carmeliet, G.; Masuyama, R. Phosphate-dependent luminal ATP metabolism regulates transcellular calcium transport in intestinal epithelial cells. FASEB J. 2018, 32, 1903–1915. [Google Scholar] [CrossRef]
- Hopp, A.K.; Gruter, P.; Hottiger, M.O. Regulation of Glucose Metabolism by NAD(+) and ADP-Ribosylation. Cells 2019, 8, 890. [Google Scholar] [CrossRef]
- Covarrubias, A.J.; Perrone, R.; Grozio, A.; Verdin, E. NAD(+) metabolism and its roles in cellular processes during ageing. Nat. Rev. Mol. Cell Biol. 2021, 22, 119–141. [Google Scholar] [CrossRef]
- Peng, H.; Wang, Y.; Luo, W. Multifaceted role of branched-chain amino acid metabolism in cancer. Oncogene 2020, 39, 6747–6756. [Google Scholar] [CrossRef]
- Yuan, Y.; Xu, P.; Jiang, Q.; Cai, X.; Wang, T.; Peng, W.; Sun, J.; Zhu, C.; Zhang, C.; Yue, D.; et al. Exercise-induced alpha-ketoglutaric acid stimulates muscle hypertrophy and fat loss through OXGR1-dependent adrenal activation. EMBO J. 2021, 40, e108434. [Google Scholar] [CrossRef] [PubMed]
- Acin-Perez, R.; Petcherski, A.; Veliova, M.; Benador, I.Y.; Assali, E.A.; Colleluori, G.; Cinti, S.; Brownstein, A.J.; Baghdasarian, S.; Livhits, M.J.; et al. Recruitment and remodeling of peridroplet mitochondria in human adipose tissue. Redox Biol. 2021, 46, 102087. [Google Scholar] [CrossRef]
- Brooks, G.A. Lactate as a fulcrum of metabolism. Redox Biol. 2020, 35, 101454. [Google Scholar] [CrossRef]
- Colak, E.; Pap, D. The role of oxidative stress in the development of obesity and obesity-related metabolic disorders. J. Med. Biochem. 2021, 40, 1–9. [Google Scholar] [CrossRef] [PubMed]
- Sindorf, M.; Germano, M.D.; Dias, W.G.; Batista, D.R.; Braz, T.V.; Moreno, M.A.; Lopes, C.R. Excess Post-Exercise Oxygen Consumption and Substrate Oxidation Following High-Intensity Interval Training: Effects of Recovery Manipulation. Int. J. Exerc. Sci. 2021, 14, 1151–1165. [Google Scholar] [PubMed]
- Gu, L.; Zhu, Y.; Lin, X.; Lu, B.; Zhou, X.; Zhou, F.; Zhao, Q.; Prochownik, E.V.; Li, Y. The IKKbeta-USP30-ACLY Axis Controls Lipogenesis and Tumorigenesis. Hepatology 2021, 73, 160–174. [Google Scholar] [CrossRef] [PubMed]
- Batchuluun, B.; Pinkosky, S.L.; Steinberg, G.R. Lipogenesis inhibitors: Therapeutic opportunities and challenges. Nat. Rev. Drug Discov. 2022, 21, 283–305. [Google Scholar] [CrossRef]
- Lin, H.P.; Cheng, Z.L.; He, R.Y.; Song, L.; Tian, M.X.; Zhou, L.S.; Groh, B.S.; Liu, W.R.; Ji, M.B.; Ding, C.; et al. Destabilization of Fatty Acid Synthase by Acetylation Inhibits De Novo Lipogenesis and Tumor Cell Growth. Cancer Res. 2016, 76, 6924–6936. [Google Scholar] [CrossRef]
- Lin, R.; Tao, R.; Gao, X.; Li, T.; Zhou, X.; Guan, K.L.; Xiong, Y.; Lei, Q.Y. Acetylation stabilizes ATP-citrate lyase to promote lipid biosynthesis and tumor growth. Mol. Cell. 2013, 51, 506–518. [Google Scholar] [CrossRef]
- Xu, H.; Wu, M.; Ma, X.; Huang, W.; Xu, Y. Function and Mechanism of Novel Histone Posttranslational Modifications in Health and Disease. Biomed. Res. Int. 2021, 2021, 6635225. [Google Scholar] [CrossRef]
- Gao, R.; Li, Y.; Xu, Z.; Zhang, F.; Xu, J.; Hu, Y.; Yin, J.; Yang, K.; Sun, L.; Wang, Q.; et al. Mitochondrial pyruvate carrier 1 regulates fatty acid synthase lactylation and mediates treatment of nonalcoholic fatty liver disease. Hepatology 2023. [Google Scholar] [CrossRef]


Disclaimer/Publisher’s Note: The statements, opinions and data contained in all publications are solely those of the individual author(s) and contributor(s) and not of MDPI and/or the editor(s). MDPI and/or the editor(s) disclaim responsibility for any injury to people or property resulting from any ideas, methods, instructions or products referred to in the content. |
© 2023 by the authors. Licensee MDPI, Basel, Switzerland. This article is an open access article distributed under the terms and conditions of the Creative Commons Attribution (CC BY) license (https://creativecommons.org/licenses/by/4.0/).
Share and Cite
Huang, W.; Su, J.; Chen, X.; Li, Y.; Xing, Z.; Guo, L.; Li, S.; Zhang, J. High-Intensity Interval Training Induces Protein Lactylation in Different Tissues of Mice with Specificity and Time Dependence. Metabolites 2023, 13, 647. https://doi.org/10.3390/metabo13050647
Huang W, Su J, Chen X, Li Y, Xing Z, Guo L, Li S, Zhang J. High-Intensity Interval Training Induces Protein Lactylation in Different Tissues of Mice with Specificity and Time Dependence. Metabolites. 2023; 13(5):647. https://doi.org/10.3390/metabo13050647
Chicago/Turabian StyleHuang, Wenhua, Jie Su, Xuefei Chen, Yanjun Li, Zheng Xing, Lanlan Guo, Shitian Li, and Jing Zhang. 2023. "High-Intensity Interval Training Induces Protein Lactylation in Different Tissues of Mice with Specificity and Time Dependence" Metabolites 13, no. 5: 647. https://doi.org/10.3390/metabo13050647