Article

The Effects of Rumen-Protected Choline and Rumen-Protected Nicotinamide on Liver Transcriptomics in Periparturient Dairy Cows

1
College of Animal Science and Technology, Northwest A&F University, Xianyang 712100, China
2
UWA Institute of Agriculture, The University of Western Australia, Crawley, WA 6009, Australia
*
Authors to whom correspondence should be addressed.
Metabolites 2023, 13(5), 594; https://doi.org/10.3390/metabo13050594
Submission received: 28 March 2023 / Revised: 17 April 2023 / Accepted: 24 April 2023 / Published: 26 April 2023

Abstract

:
To investigate the effects of rumen-protected choline (RPC) and rumen-protected nicotinamide (RPM) on liver metabolic function based on transcriptome in periparturient dairy cows, 10 healthy Holstein dairy cows with similar parity were allocated to RPC and RPM groups (n = 5). The cows were fed experimental diets between 14 days before and 21 days after parturition. The RPC diet contained 60 g RPC per day, and the RPM diet contained 18.7 g RPM per day. Liver biopsies were taken 21 days after calving for the transcriptome analysis. A model of fat deposition hepatocytes was constructed using the LO2 cell line with the addition of NEFA (1.6 mmol/L), and the expression level of genes closely related to liver metabolism was validated and divided into a CHO group (75 μmol/L) and a NAM group (2 mmol/L). The results showed that the expression of a total of 11,023 genes was detected and clustered obviously between the RPC and RPM groups. These genes were assigned to 852 Gene Ontology terms, the majority of which were associated with biological process and molecular function. A total of 1123 differentially expressed genes (DEGs), 640 up-regulated and 483 down-regulated, were identified between the RPC and RPM groups. These DEGs were mainly correlated with fat metabolism, oxidative stress and some inflammatory pathways. In addition, compared with the NAM group, the gene expression level of FGF21, CYP26A1, SLC13A5, SLCO1B3, FBP2, MARS1 and CDH11 in the CHO group increased significantly (p < 0.05). We proposed that that RPC could play a prominent role in the liver metabolism of periparturient dairy cows by regulating metabolic processes such as fatty acid synthesis and metabolism and glucose metabolism; yet, RPM was more involved in biological processes such as the TCA cycle, ATP generation and inflammatory signaling.

1. Introduction

The peripartum period, lasting from 3 weeks before and 3 weeks after parturition, induces remarkable physiological and metabolic adaptations in mammals which are crucial for a good reproductive performance and to ensure the suitable development of the fetus and to provide adequate substrates that are needed in utero and following birth [1]. Simultaneously, cows may face immune system dysfunction and increased inflammatory status, which are important factors limiting their ability to achieve optimal production performance and immune metabolic status and may have a negative impact on the successful transition of offspring from intrauterine to extrauterine [2]. Perinatal cows are subject to the imbalance between energy demand and dietary energy intake, resulting in stimulation of fat mobilization [3] and an elevated level of non-esterified fatty acids (NEFA) in the body. When the elevated NEFA excesses the clearance limit of the body, there will be excessive accumulation of fat and its metabolites in the liver, such as ketone bodies, leading to fatty liver and ketosis [4]. In addition, the excessive NEFA will also lead to oxidative stress [5], rumen acidosis, protein metabolism imbalance and other metabolic syndromes [6]. These metabolic disorders can increase the incidence of other diseases, such as placental retention and endometritis, which will impair the immune system of cows, reduce the milk yield and reproductive efficiency of cows, and cause serious economic losses [7,8,9]. To counteract these negative effects, rumen-protected products are frequently added to the diet of dairy cows during the periparturient period to maintain the physical condition of dairy cows, enhance productivity performance and reduce economic losses.
Choline (2-hydroxyethyl trimethyl ammonium salt) is an essential nutrient for humans and animals which needs to be obtained from the diet in addition to endogenous synthesis. Choline plays a significant role in cell maintenance and growth at various stages of life, including neurotransmission [10], membrane synthesis, lipid transport and one-carbon metabolism [11]. In the liver, choline can be used to synthesize phosphatidylcholine through the cytidine diphosphate–choline pathway and can also be oxidized to betaine, which, through the phosphatidylethanolamine N-methyl transfer pathway, is used to synthesize very-low-density lipoprotein (VLDL) to participate in lipid transport. It has been found that the imbalance between the proportion of phosphatidylcholine and phosphatidylethanolamine in the liver will affect the integrity of the cell membrane, leading to cell damage and inflammatory reactions such as steatohepatitis [12]. In recent years, accumulating evidence suggests that choline can regulate the metabolism and transport of glucose and lipid, as well as the occurrence of oxidative stress in the body by regulating the expression of related genes and activating signal pathways such as AMPK [13,14,15]. Moreover, a large number of animal experiments have shown that adding choline to the diet of periparturient dairy cows could increase the level of VLDL [16,17], regulate fat metabolism [18], relieve metabolic diseases such as fatty liver and ketosis [19,20], increase milk yield [21,22], improve milk quality [23,24], maintain an animal’s physical condition [25,26], boost immune system [27,28], and also promote the growth performance of offspring [29].
Nicotinamide is a member of water-soluble B vitamins, which can be served as a precursor to synthesize nicotinamide adenine dinucleotide (NAD) and nicotinamide adenine dinucleotide phosphate [30,31]. In the liver, nicotinamide can be converted and synthesized from nicotinic acid. In addition, nicotinamide can also be produced through the hydrolysis of nicotinamide adenine dinucleotide (NADH) and NAD+ by coenzyme β—Nicotinamide adenine dinucleotide (NAD+). These metabolites can be directly used for ATP generation, DNA synthesis and repair, as well as other metabolic pathways and cell signal transductions. Moreover, nicotinamide also plays an important role in the regulation of lipid and energy metabolism, oxidative stress, mitochondrial dysfunction and other processes [32,33]. Plenty of studies indicate that the addition of nicotinamide and niacin can reduce the levels of total cholesterol, triglyceride, high-density lipoprotein (HDL) cholesterol, LDL cholesterol and VLDL cholesterol as well as improve dyslipidemia, alleviate adipose tissue inflammation [34,35,36], and increase milk yield and the milk protein content of lactating dairy cows [37,38].
However, the difference between choline and nicotinamide in liver metabolism and its mechanism in periparturient dairy cows is still unclear. Therefore, in this study, we added rumen-protected choline (RPC) and rumen-protected nicotinamide (RPM) to the diet of periparturient dairy cows. We then performed a liver biopsy and explored the effects of choline and nicotinamide on the liver metabolism of periparturient dairy cows and the differences in their mechanisms based on transcriptome.

2. Materials and Methods

2.1. Animals and Sample Acquisition

Ten healthy Chinese Holstein pregnant cows with similar parity were selected and randomly divided into 2 groups: the rumen-protected choline group (60 g/d RPC, active ingredient 15 g/d, purity 65%, the rumen bypass rate 80.3%) and the rumen-protected nicotinamide group (18.7 g/d RPM, active ingredient 9.6 g/d, purity 60%, the rumen bypass rate 85.6%). The experimental period lasted for 35 days, from 14 days before parturition to 21 days after calving. During the monitoring period, the cows in health status and 1–2 parity delivered healthy, viable full-term calves.
The feeding and management of cattle were carried out in accordance with the pasture management system. During the experimental period, two diets were prepared, namely, the pre-partum diet and the post-partum diet. The diets were prepared in the form of total mixed rations (TMR) and offered twice a day, at 07:00 and 16:00, respectively. All experimental animals had free access to food and water. Liver biopsy was performed on the 21st day after delivery (collected at 13:00 each time) by using a biopsy needle, and the liver samples collected were quickly stored at −80 °C. All the experimental procedures in the present study were conducted according to the Animal Protection Law based on the Guide for the Care and Use of Laboratory Animals approved by the Ethics Committee of Northwest A&F University.

2.2. Culture of Human Hepatocyte Line LO2

LO2 cells were cultured in Roswell Park Memorial Institute (RPMI) 1640 medium (HyClone, Logan, UT, USA) containing 10% fetal bovine serum (Gibco BRL, Grand Island, NY, USA), and the culture was performed at 37 °C under 5% CO2. To establish a cell model of fatty liver in periparturient dairy cows, LO2 cells were plated into 6-well culture plates to which was added 1.6 mmol/L NEFA subject to two treatments: CHO and NAM. The CHO group contained 75 μmol/L choline in choline-free RPMI 1640 medium, and the NAM group contained 2 mmol/L nicotinamide in nicotinamide-free medium. Before treatment, cells were starved using choline-free RPMI 1640 medium (Gibco BRL, Grand Island, NY, USA) and nicotinamide-free medium (Coolaber, Beijing, China), respectively, without adding fetal bovine serum for 6 h. After starving, LO2 cells with experimental treatment were incubated for 24 h. NEFA was formulated from palmitic acid (3.19 mmol), palmitoleic acid (0.53 mmol), stearic acid (1.44 mmol), linoleic acid (0.49 mmol) and oleic acid (4.35 mmol). All reagents without instructions were purchased from Sigma-Aldrich.

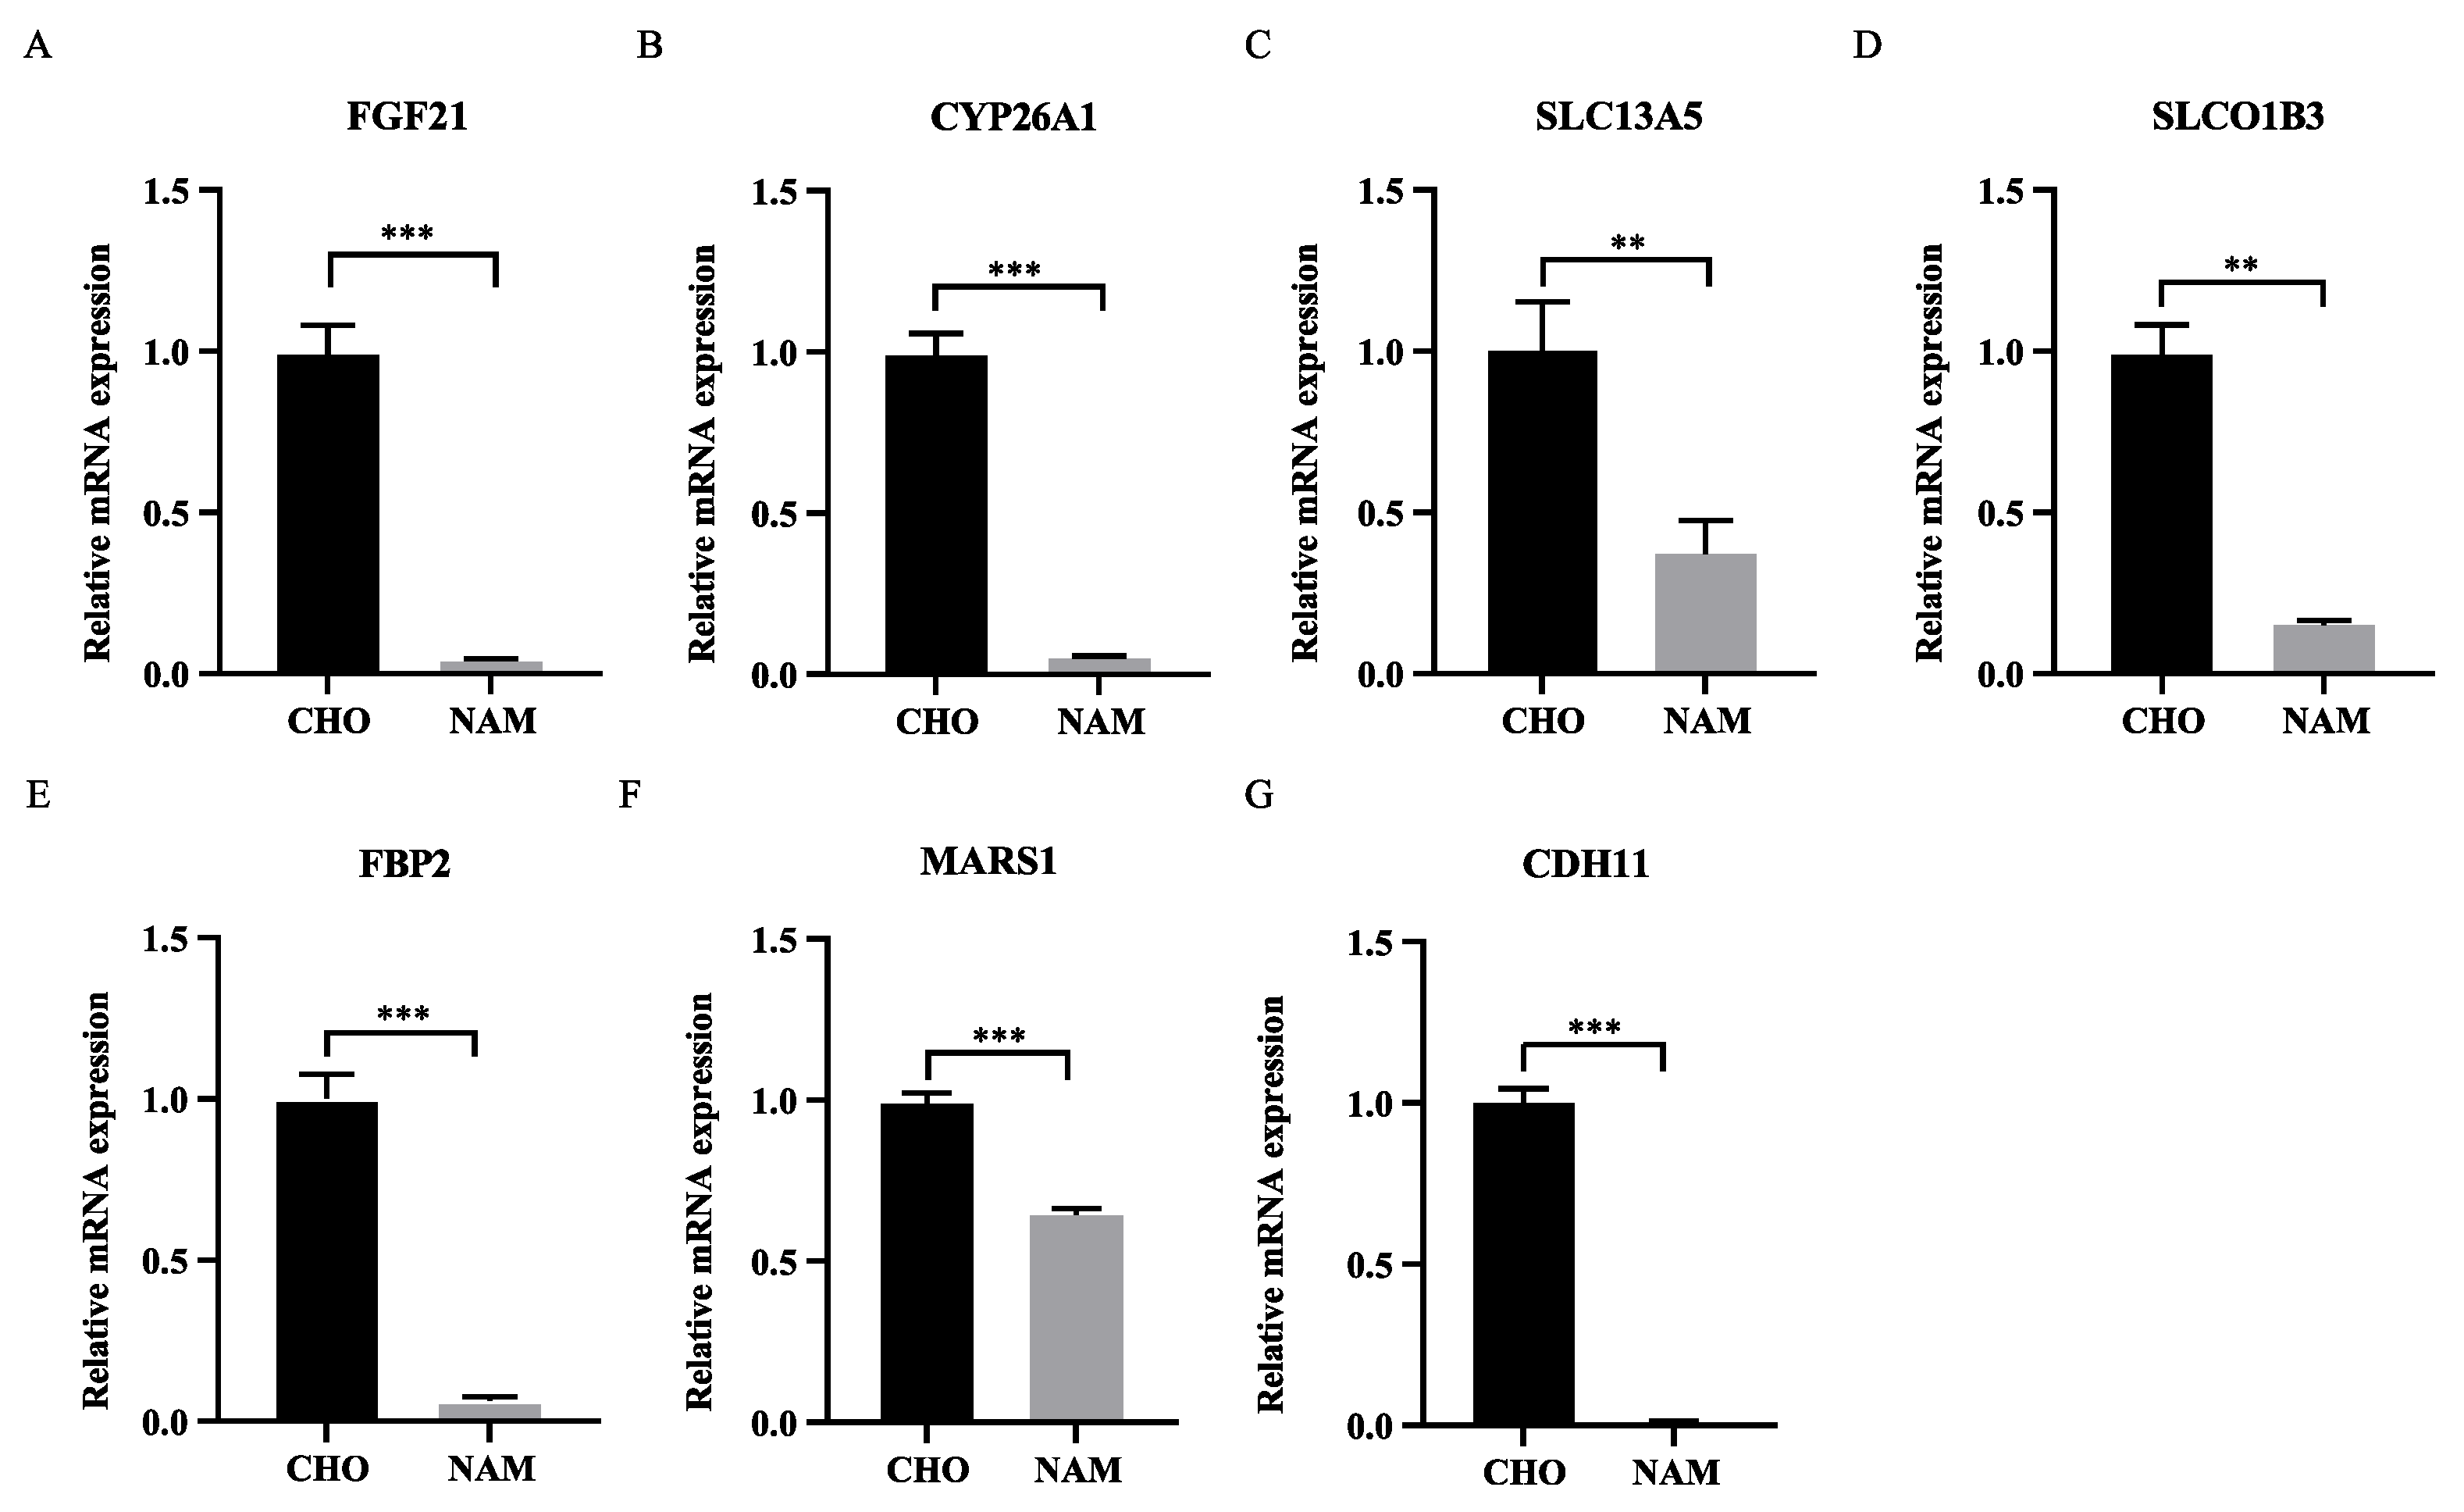
2.3. RNA Isolation and Quantitative Real-Time Polymerase Chain Reaction

Total RNA in cells was isolated with Trizol (Invitrogen). An amount of 1–2 μg of total RNA was treated with DNAse (Invitrogen) and reverse transcribed into cDNA using M-MLV Reverse Transcriptase (Accubate Biology, Changsha, China). Quantitative Real-Time PCR (RT-PCR) was performed using SYBR® Select Master Mix (Accubate Biology, Changsha, China) and the Roche LightCycler® 480 Real-Time PCR System. The 2−ΔΔCt method was used to determine the relative quantitative gene expression levels, normalized by β-actin (Table 1 and Table 2) [39].

2.4. RNA Isolation and cDNA Library Construction

Total RNA in liver biopsies was extracted, and the RNA concentration and purity were determined using a Nanodrop2000 (Thermo Fisher Scientific, US). Agarose gel electrophoresis was used to detect the integrity of RNA. An Agilent 2100 bioanalyzer was used to measure the RNA value. The enriched mRNA was segmented then reverse synthesized to cDNA, which completed the construction of the library to be sequenced. The following conditions must be met for the creation of a single library to be sequenced: the total amount of RNA ≤ 1 µg, the concentration ≥ 35 ng/μL, OD260/280 ≥ 1.8, OD260/230 ≥ 1.0. After passing the quality inspection, the library was sequenced on the IlluminaNovaseq6000 platform, and the database was established by Shanghai Meiji Biomedical Technology Co.

2.5. Analysis of Differential Expression of Genes

The software DESeq2 based on negative binomial distribution was used to analyze the differential expression of genes (DEGs). According to p-value and |log2 FC| as screening conditions, log2 FC > 0 indicates gene expression is up-regulated and log2FC < 0 indicates gene expression is down-regulated.

2.6. Analysis of DEG Enrichment

The software Goatools was used for GO (Gene Ontology) enrichment analysis of genes/transcripts, and R script was used for KEGG (Kyoto encyclopedia of genes and genomes) pathway enrichment analysis of genes/transcripts. Fisher’s Exact Test and the Benjamin–Hochberg method was used to correct the p-value. Significance of GO enrichment and KEGG enrichment was considered as a p-value < 0.05.

2.7. Statistical Analysis

MetaboAnalyst 5.0 (Wishart Research Group, Edmonton, AB, Canada) software was used to perform orthogonal partial least squares-discriminant analysis (OPLS-DA) on the samples from the RPC group and RPM group. A volcano plot was used to analyze DEGs and their changes in each group, and a cluster heatmap was used to analyze the gene expression patterns in each sample. Statistical significance was determined with IBM SPSS Statistics 26.0. Data were represented as an average ± SD and treated with normal distribution test. Student’s t-test was used for two-group comparisons. ** indicates p < 0.01, *** indicates p < 0.001.

3. Results

3.1. Sequencing Data Quality Control

After sequencing data generation, the original sequencing data for each sample was subjected to a quality assessment such as the base group’s error rate and content distribution, and quality control was carried out to obtain high-quality control data (clean data). The Q20 and Q30 quality values were 97.51% and 93.02%, respectively. The GC content ratio was within an acceptable range, which indicated that the sequencing results were reliable and could be used for subsequent results analysis (Supplementary Table S1).

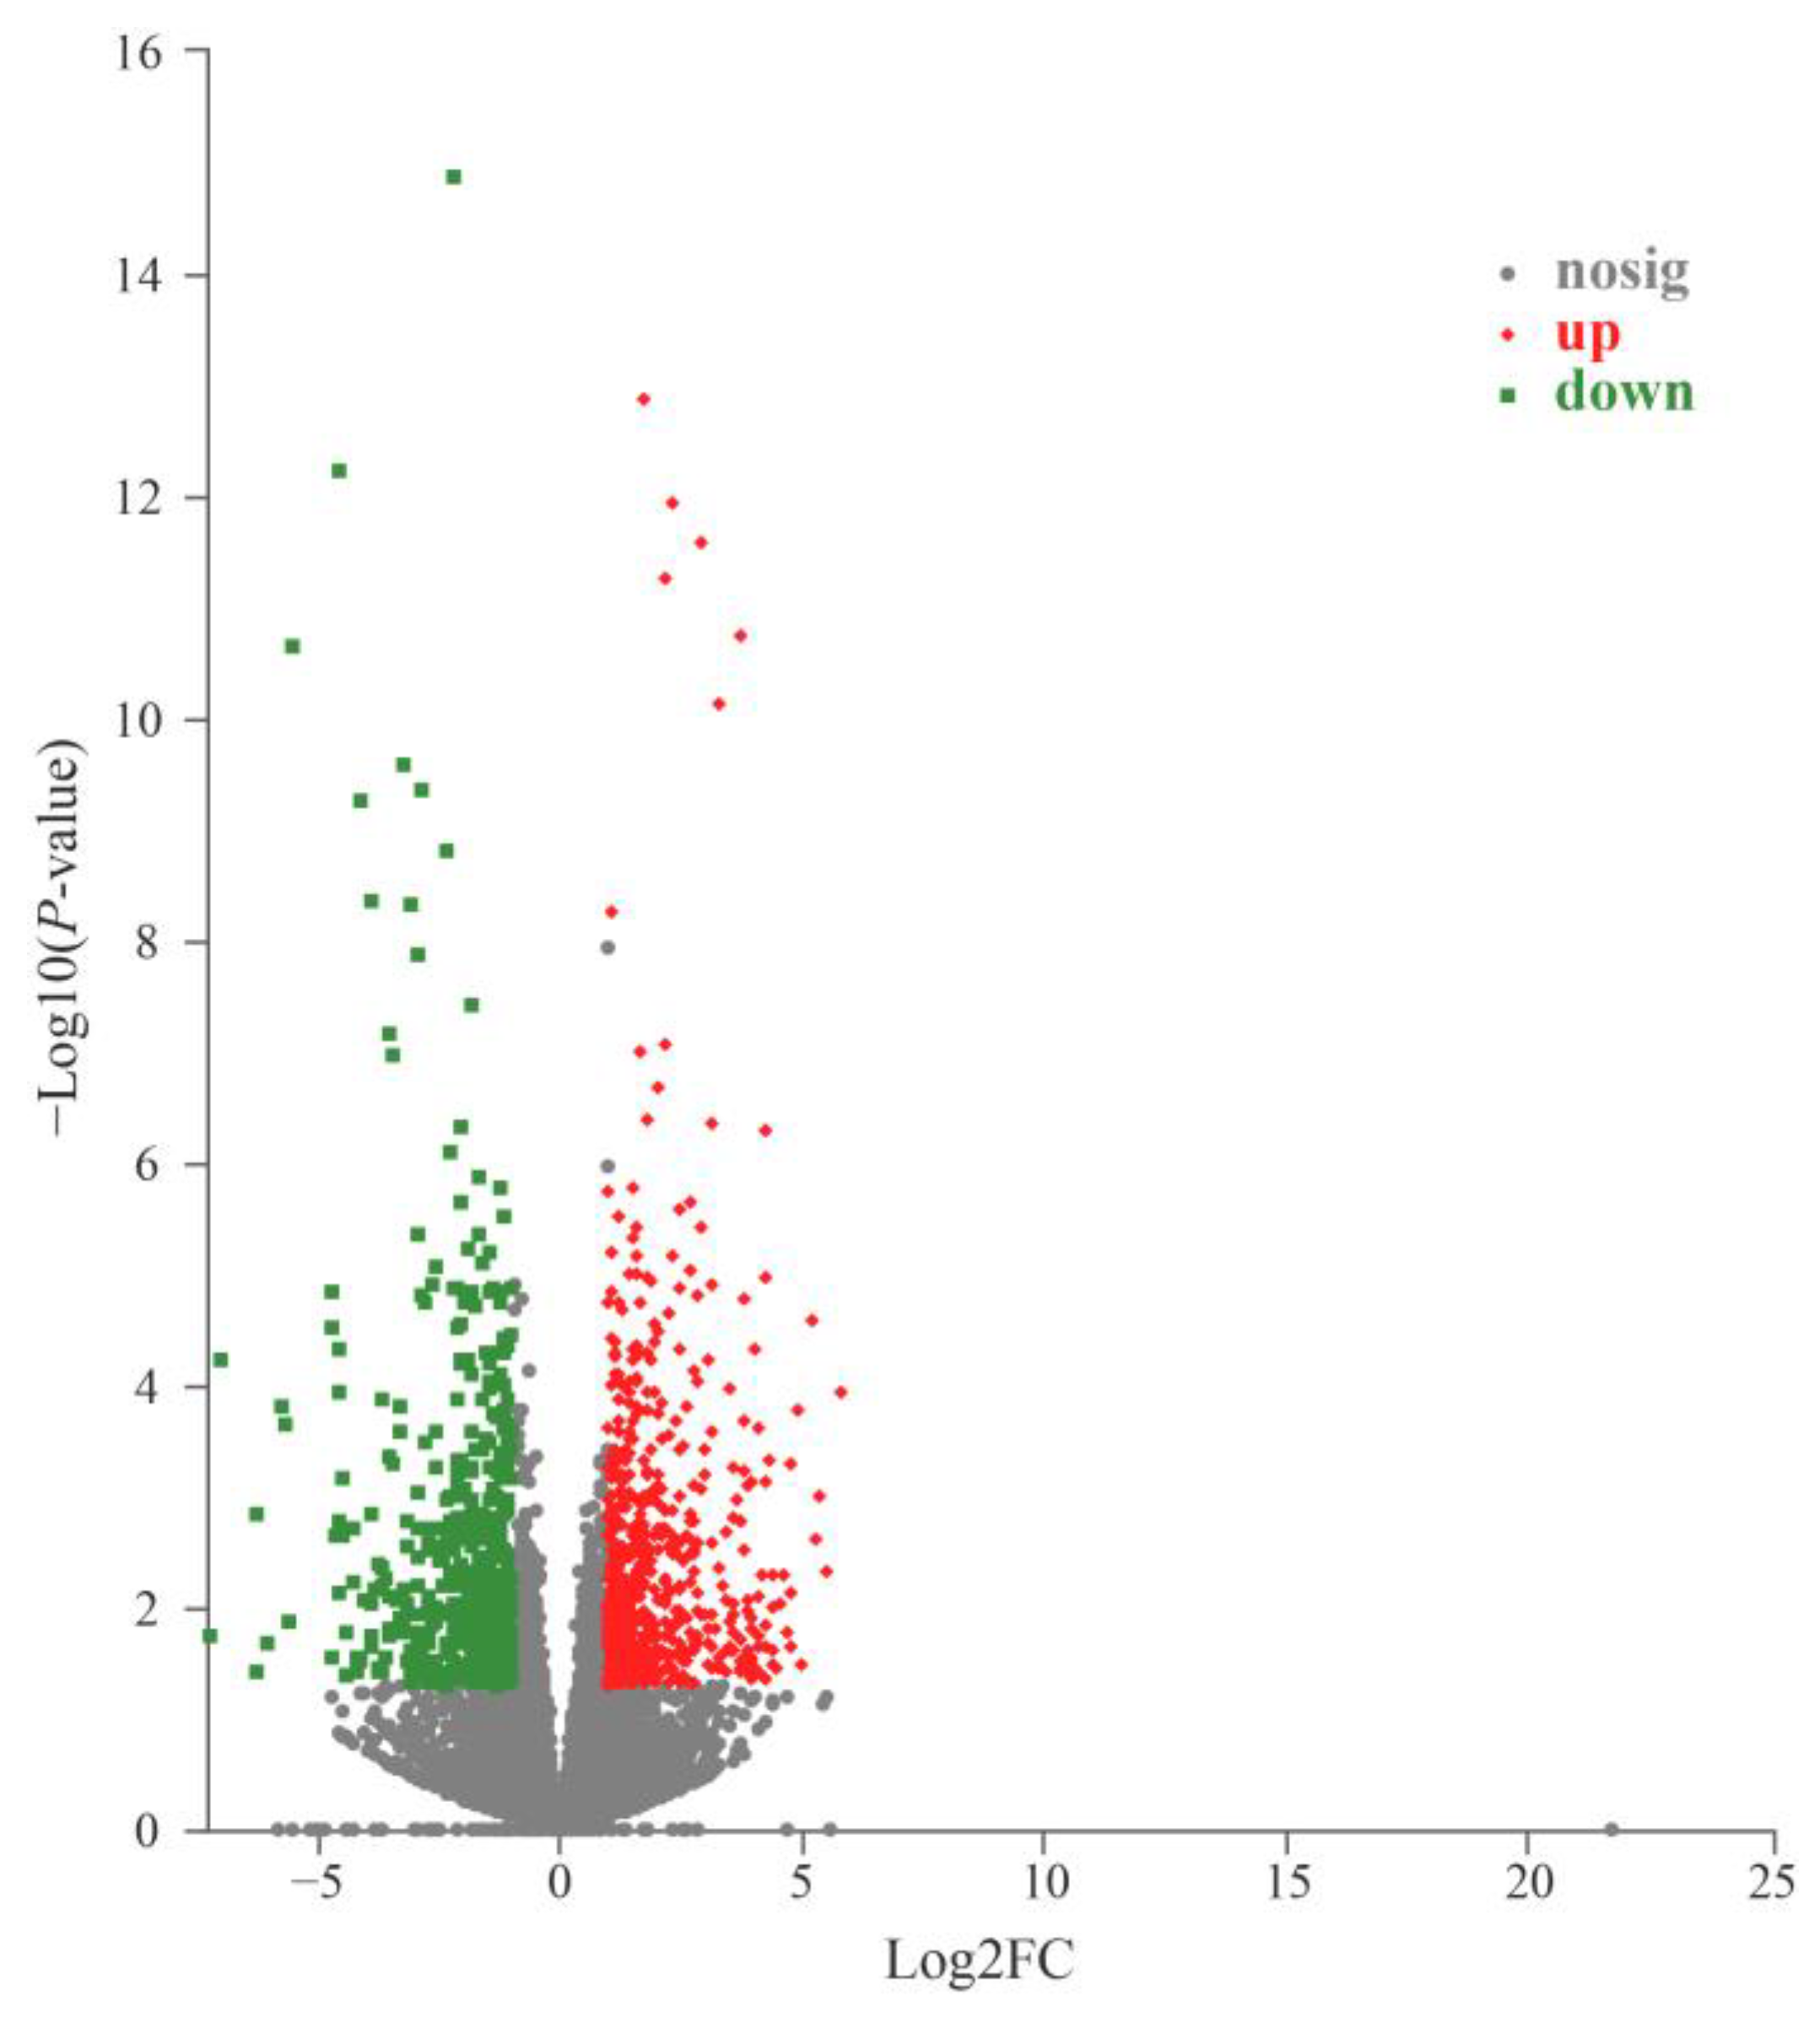
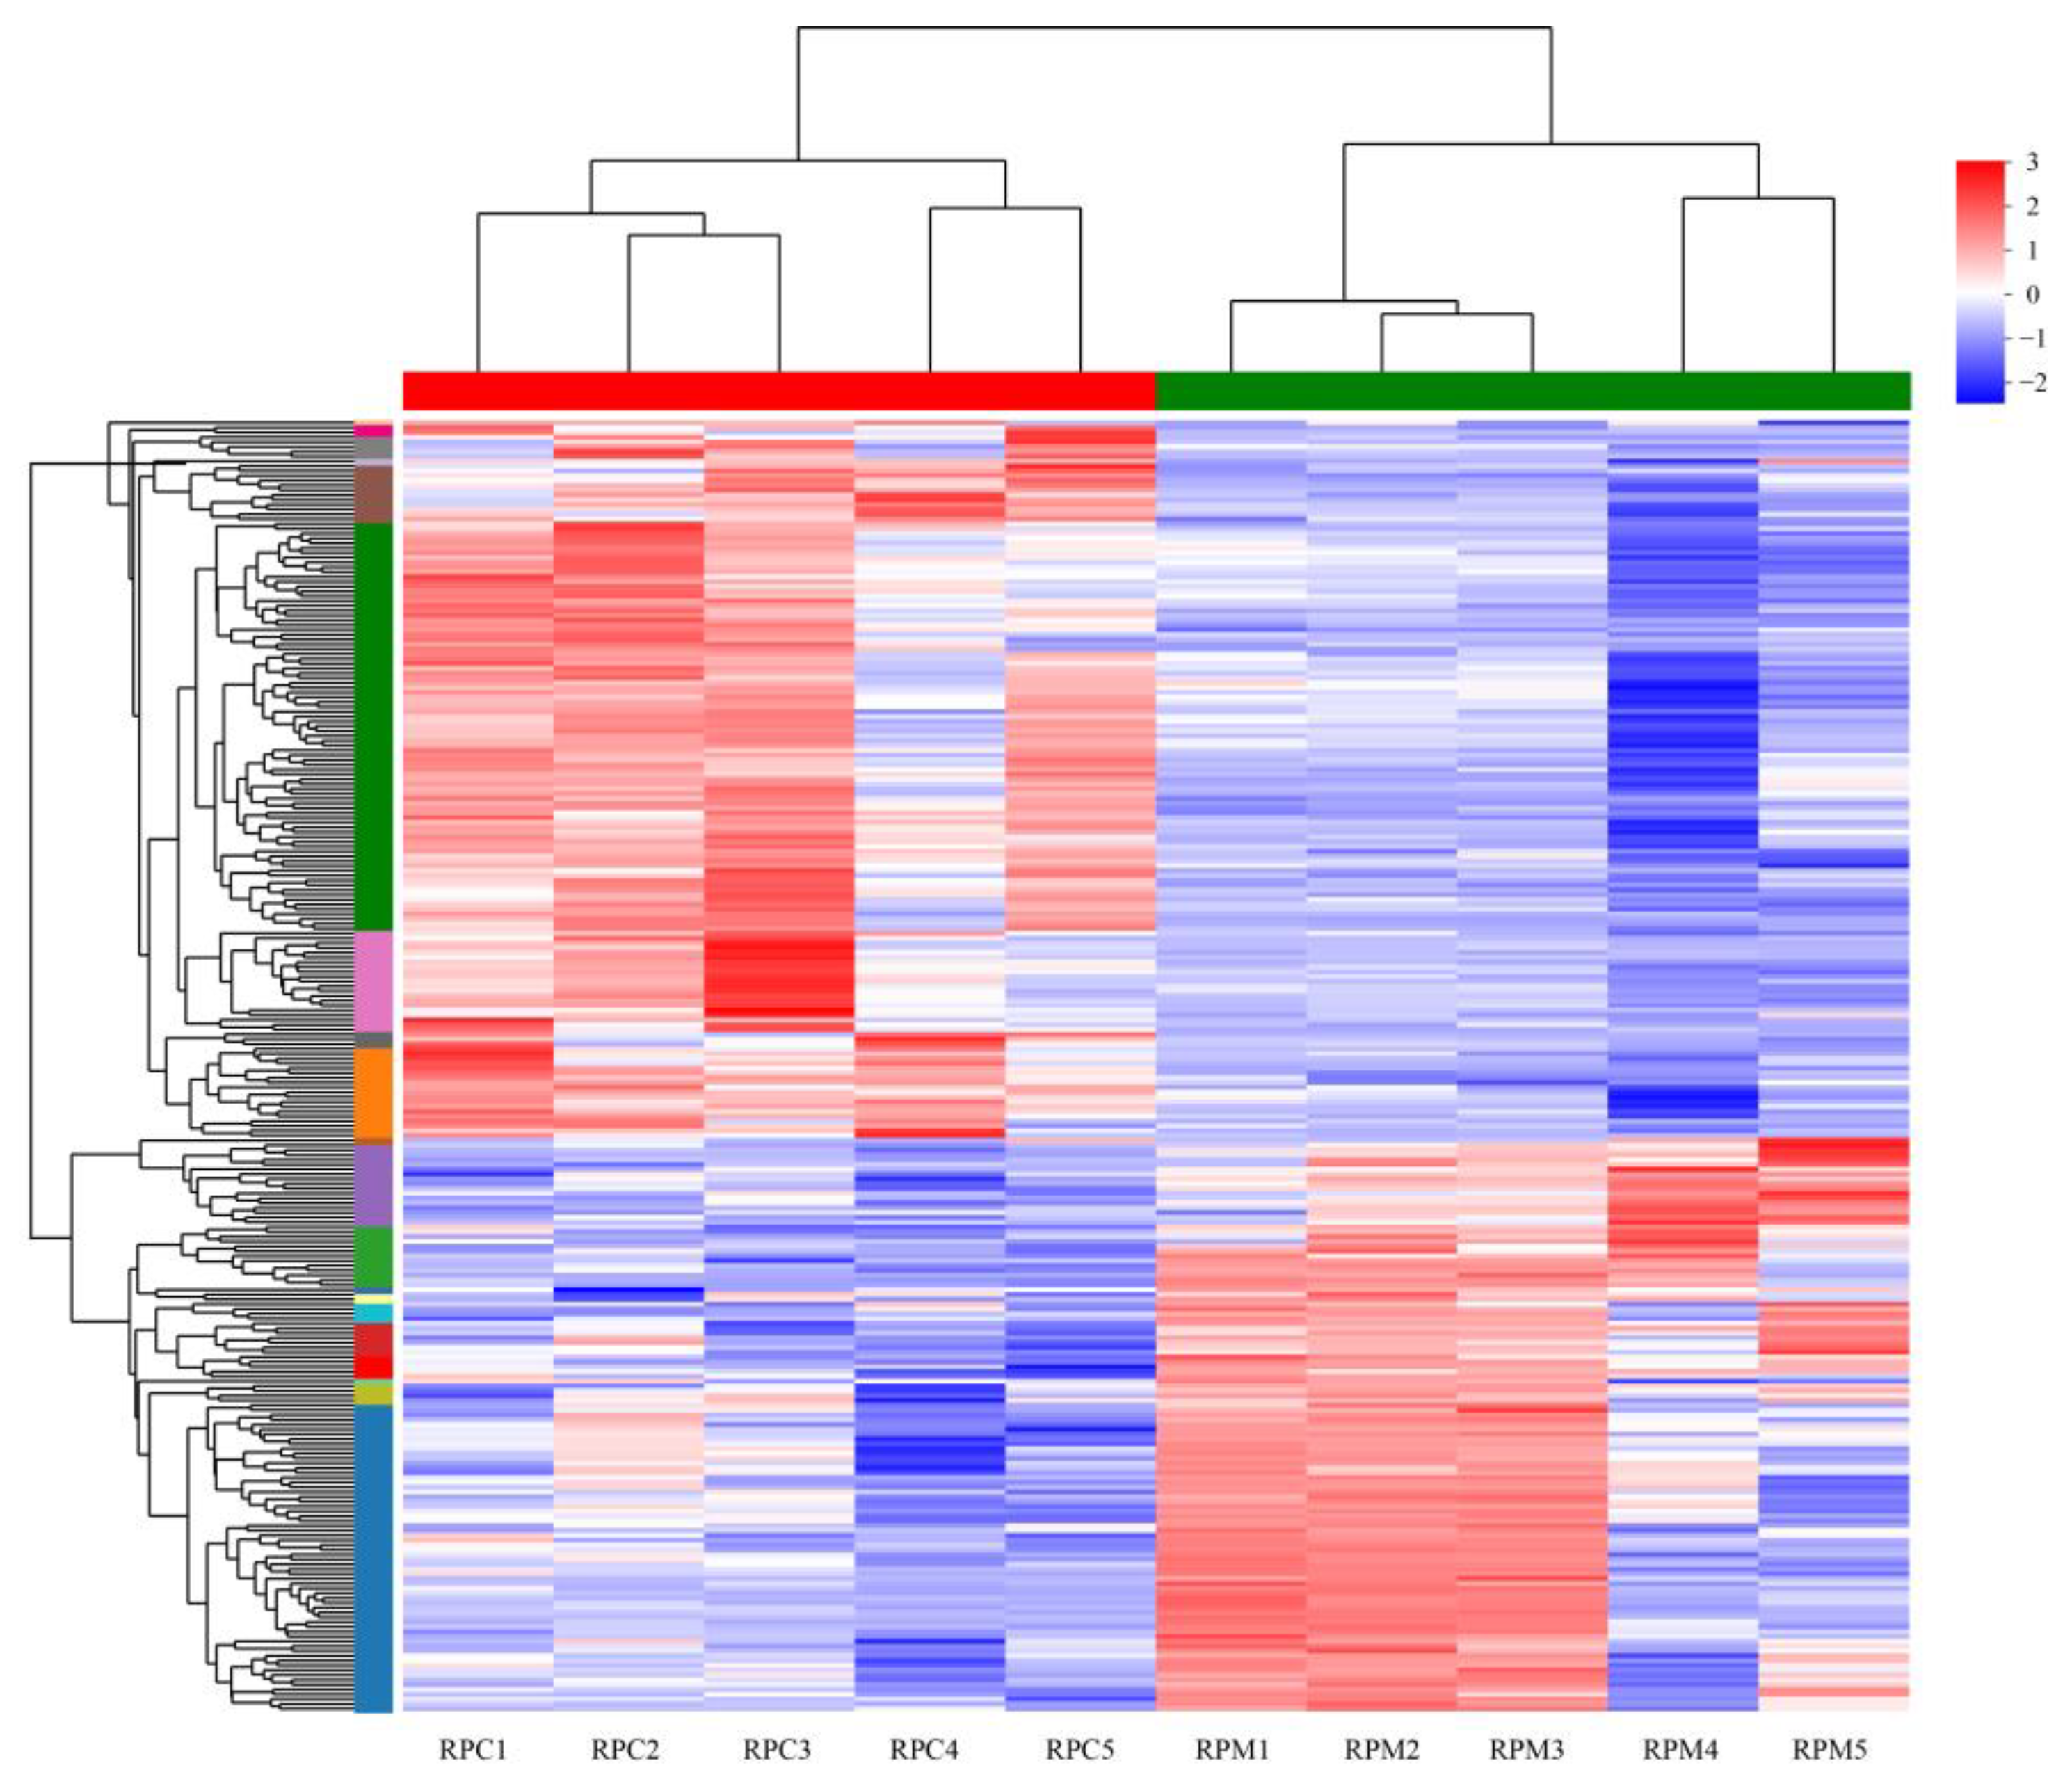
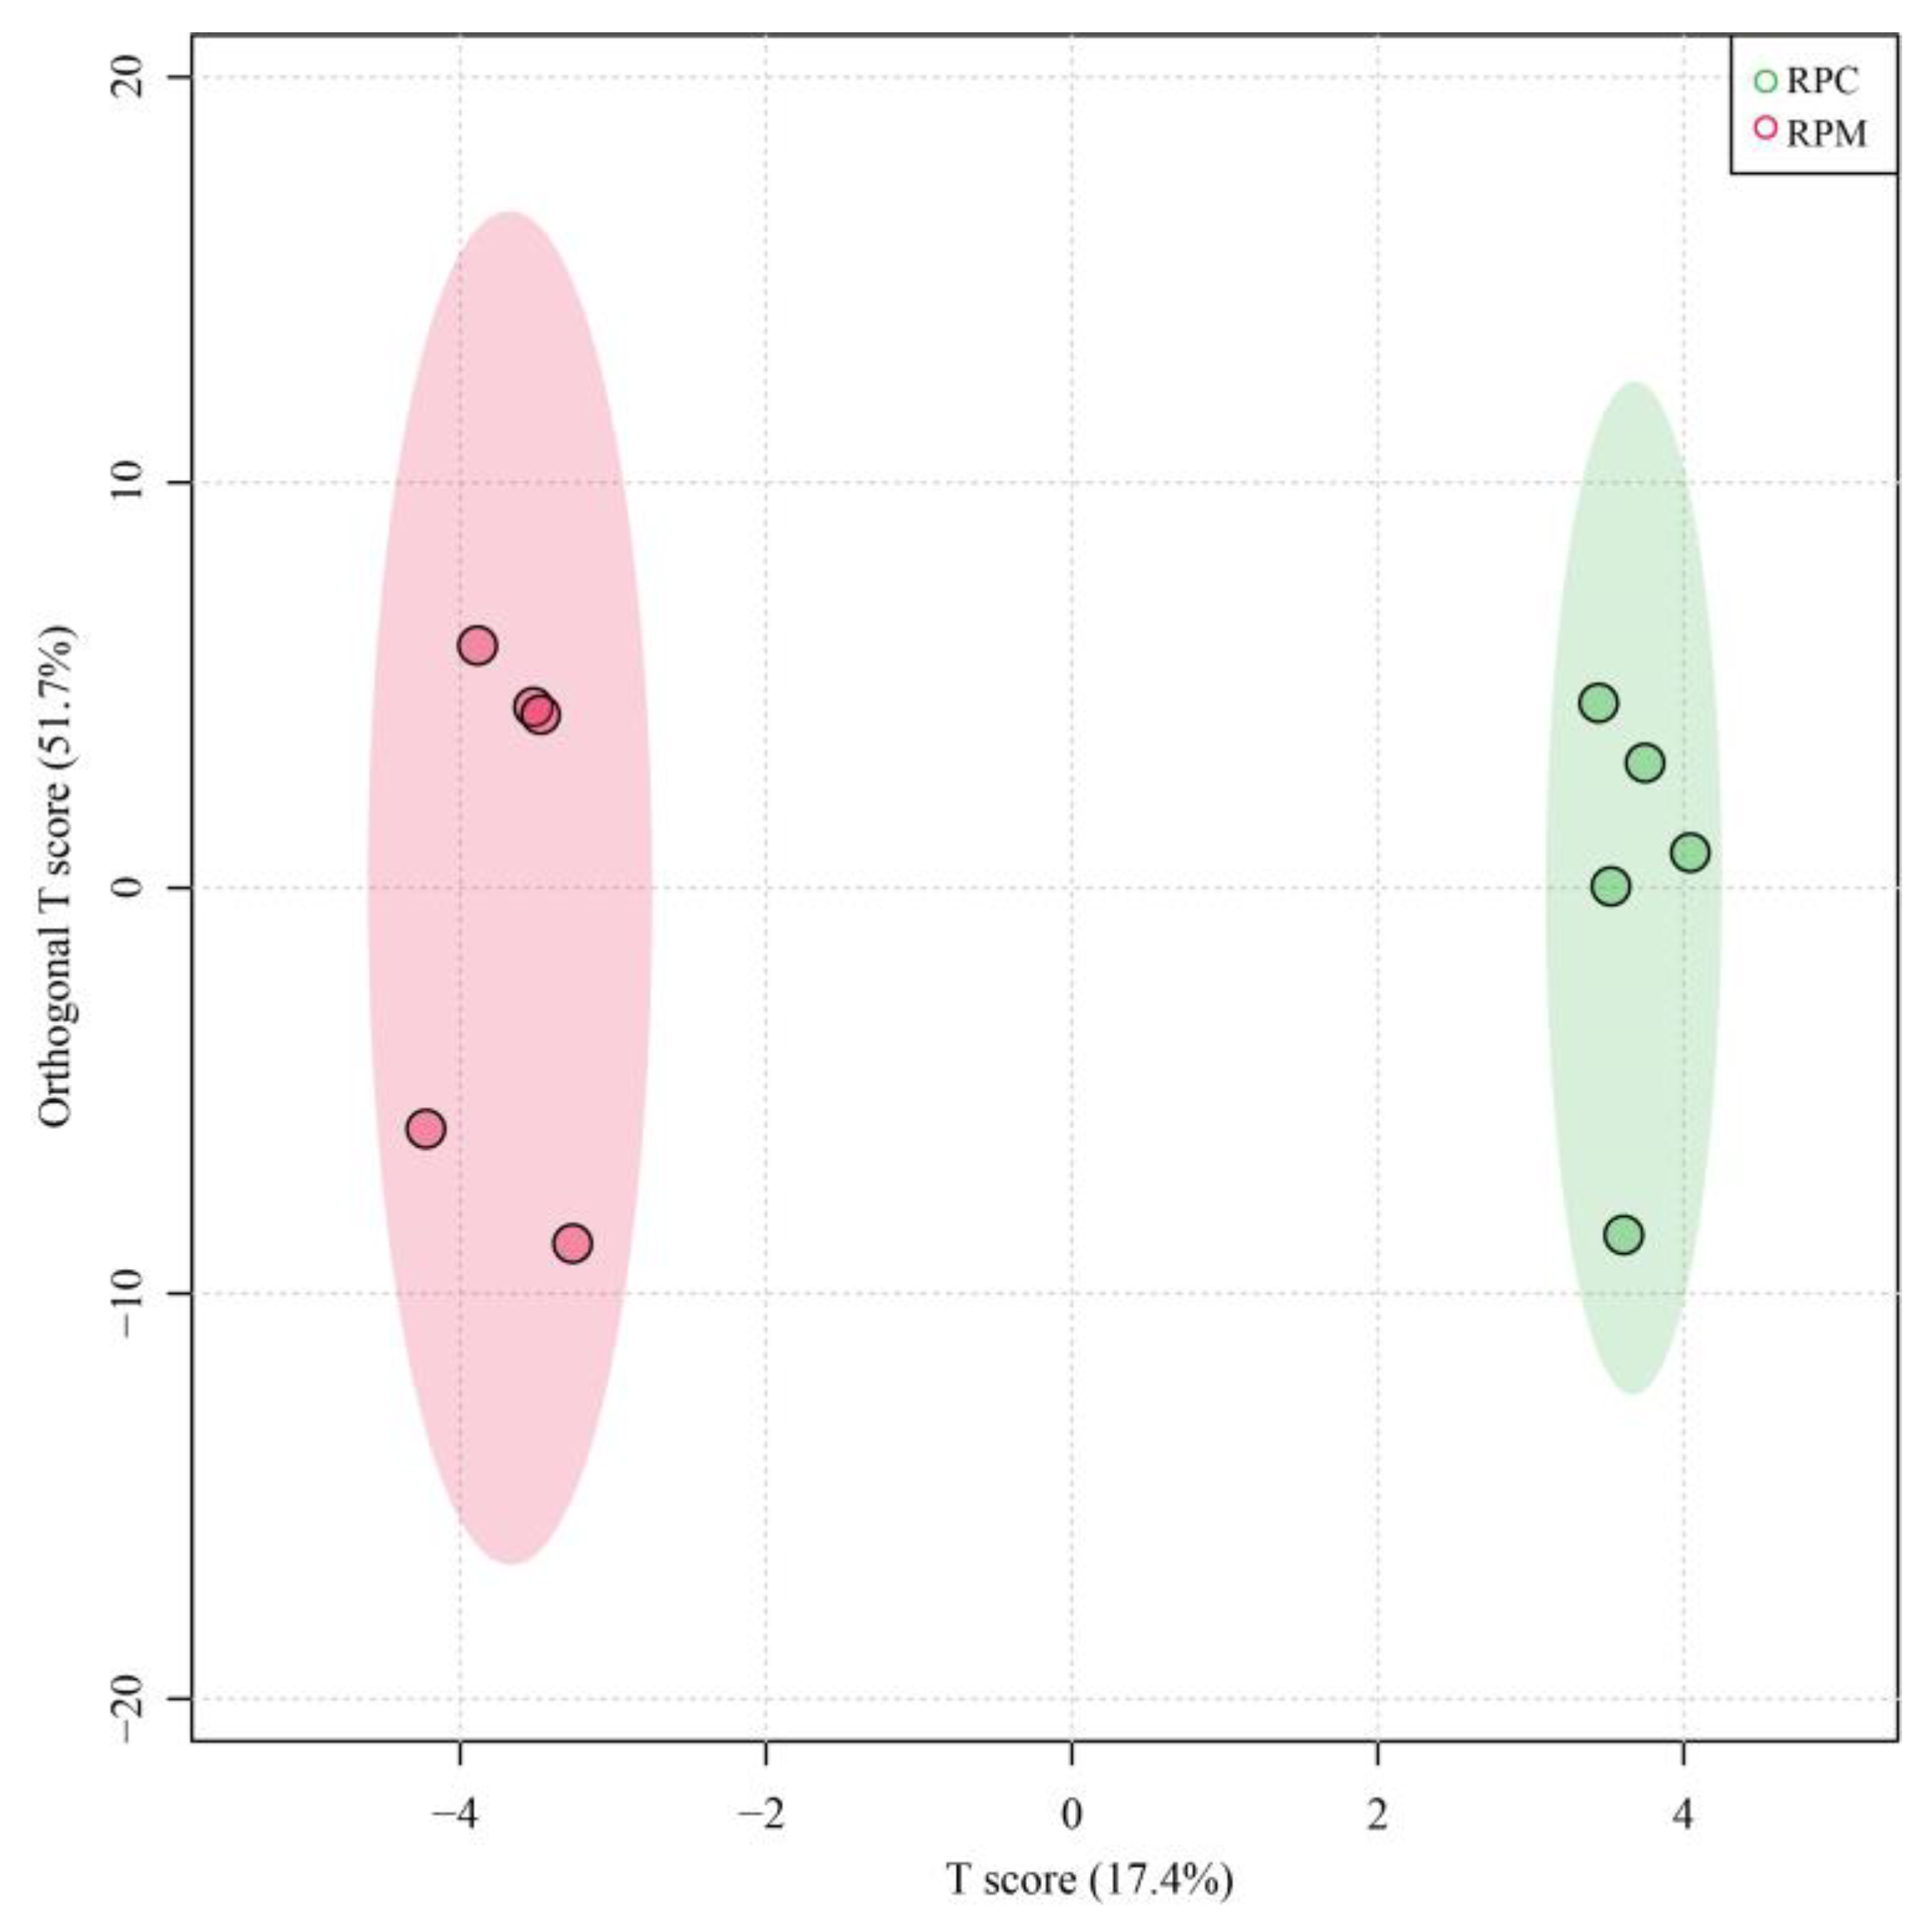
3.2. Analysis of DEGs

Transcripts with an absolute value of |log2 FC| ≥ 1 and adjusted p-value < 0.05 were defined as significant DEGs. A total of 11,023 genes were expressed in all 10 samples, while 828 genes were specifically expressed in the RPC group and 481 were specifically expressed in the RPM group (Supplementary Figure S1). From the comparisons between these two groups, 1123 DEGs were identified, 640 up-regulated and 483 down-regulated (Figure 1; Supplementary Table S2). The cluster heatmap analysis was performed on the identified DEGs, as shown in Figure 2, which shows that the samples from the RPC and RPM groups had obvious clustering. OPLS-DA analysis showed that the samples from the RPC and RPM groups were significantly separated (Figure 3).
Table 3 listed the top 30 DEGs, including FARS2, NOTUM, CYP2C19, KCNN2, CYP26A1, SLCO1B3, HRG, CES1, CD1D, FBP2, SEC14L3, PLEK, TKT, BIRC5, FGF21, FUT1, CDH11, DTX1, ATP6V1C2, SLC13A5, LRRC73, HOPX, MICAL2, GPC3, ADCY2, GLI1, MARS1, INHBE, CARS1, CITED4, etc. The genes with up-regulated expression levels included FARS2, NOTUM, CYP2C19, KCNN2, CYP26A1, SLCO1B3, HRG, CES1, CD1D, FBP2, SEC14L3, PLEK, TKT, BIRC5. The genes with down-regulated expression levels included FGF21, FUT1, CDH11, DTX1, ATP6V1C2, SLC13A5, LRRC73, HOPX, MICAL2, GPC3, ADCY2, GLI1, MARS1, INHBE, CARS1, and CITED4.

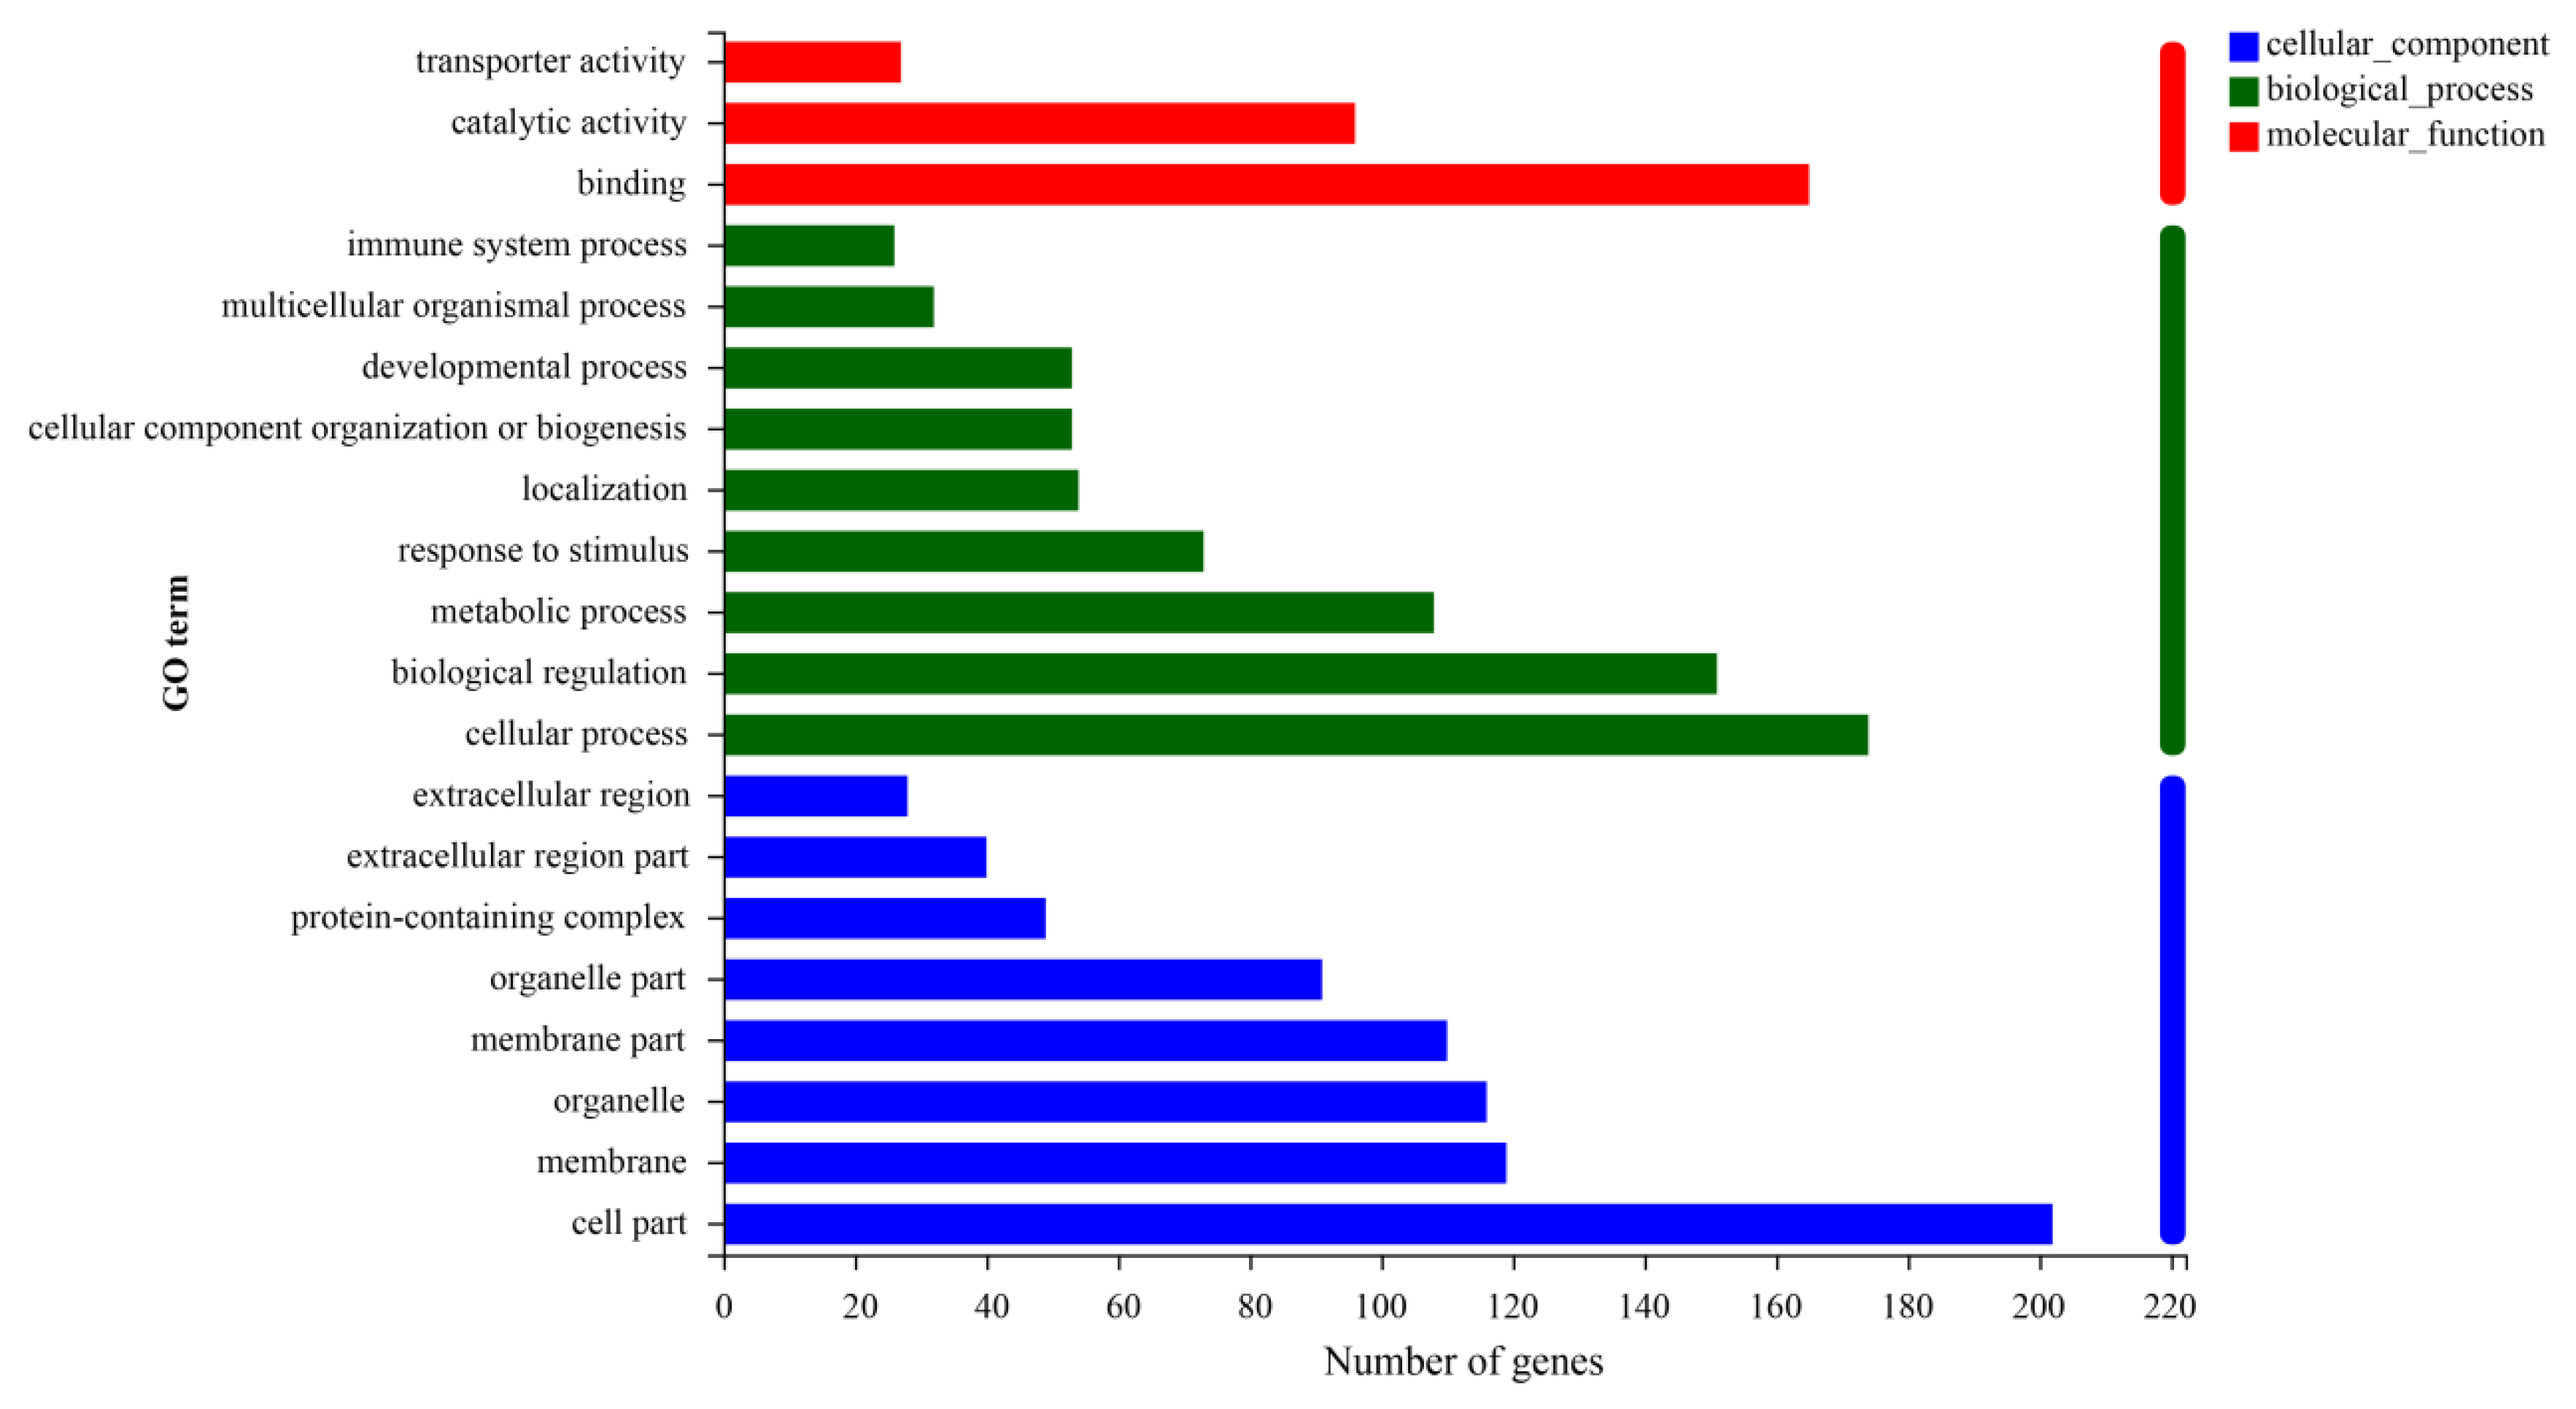
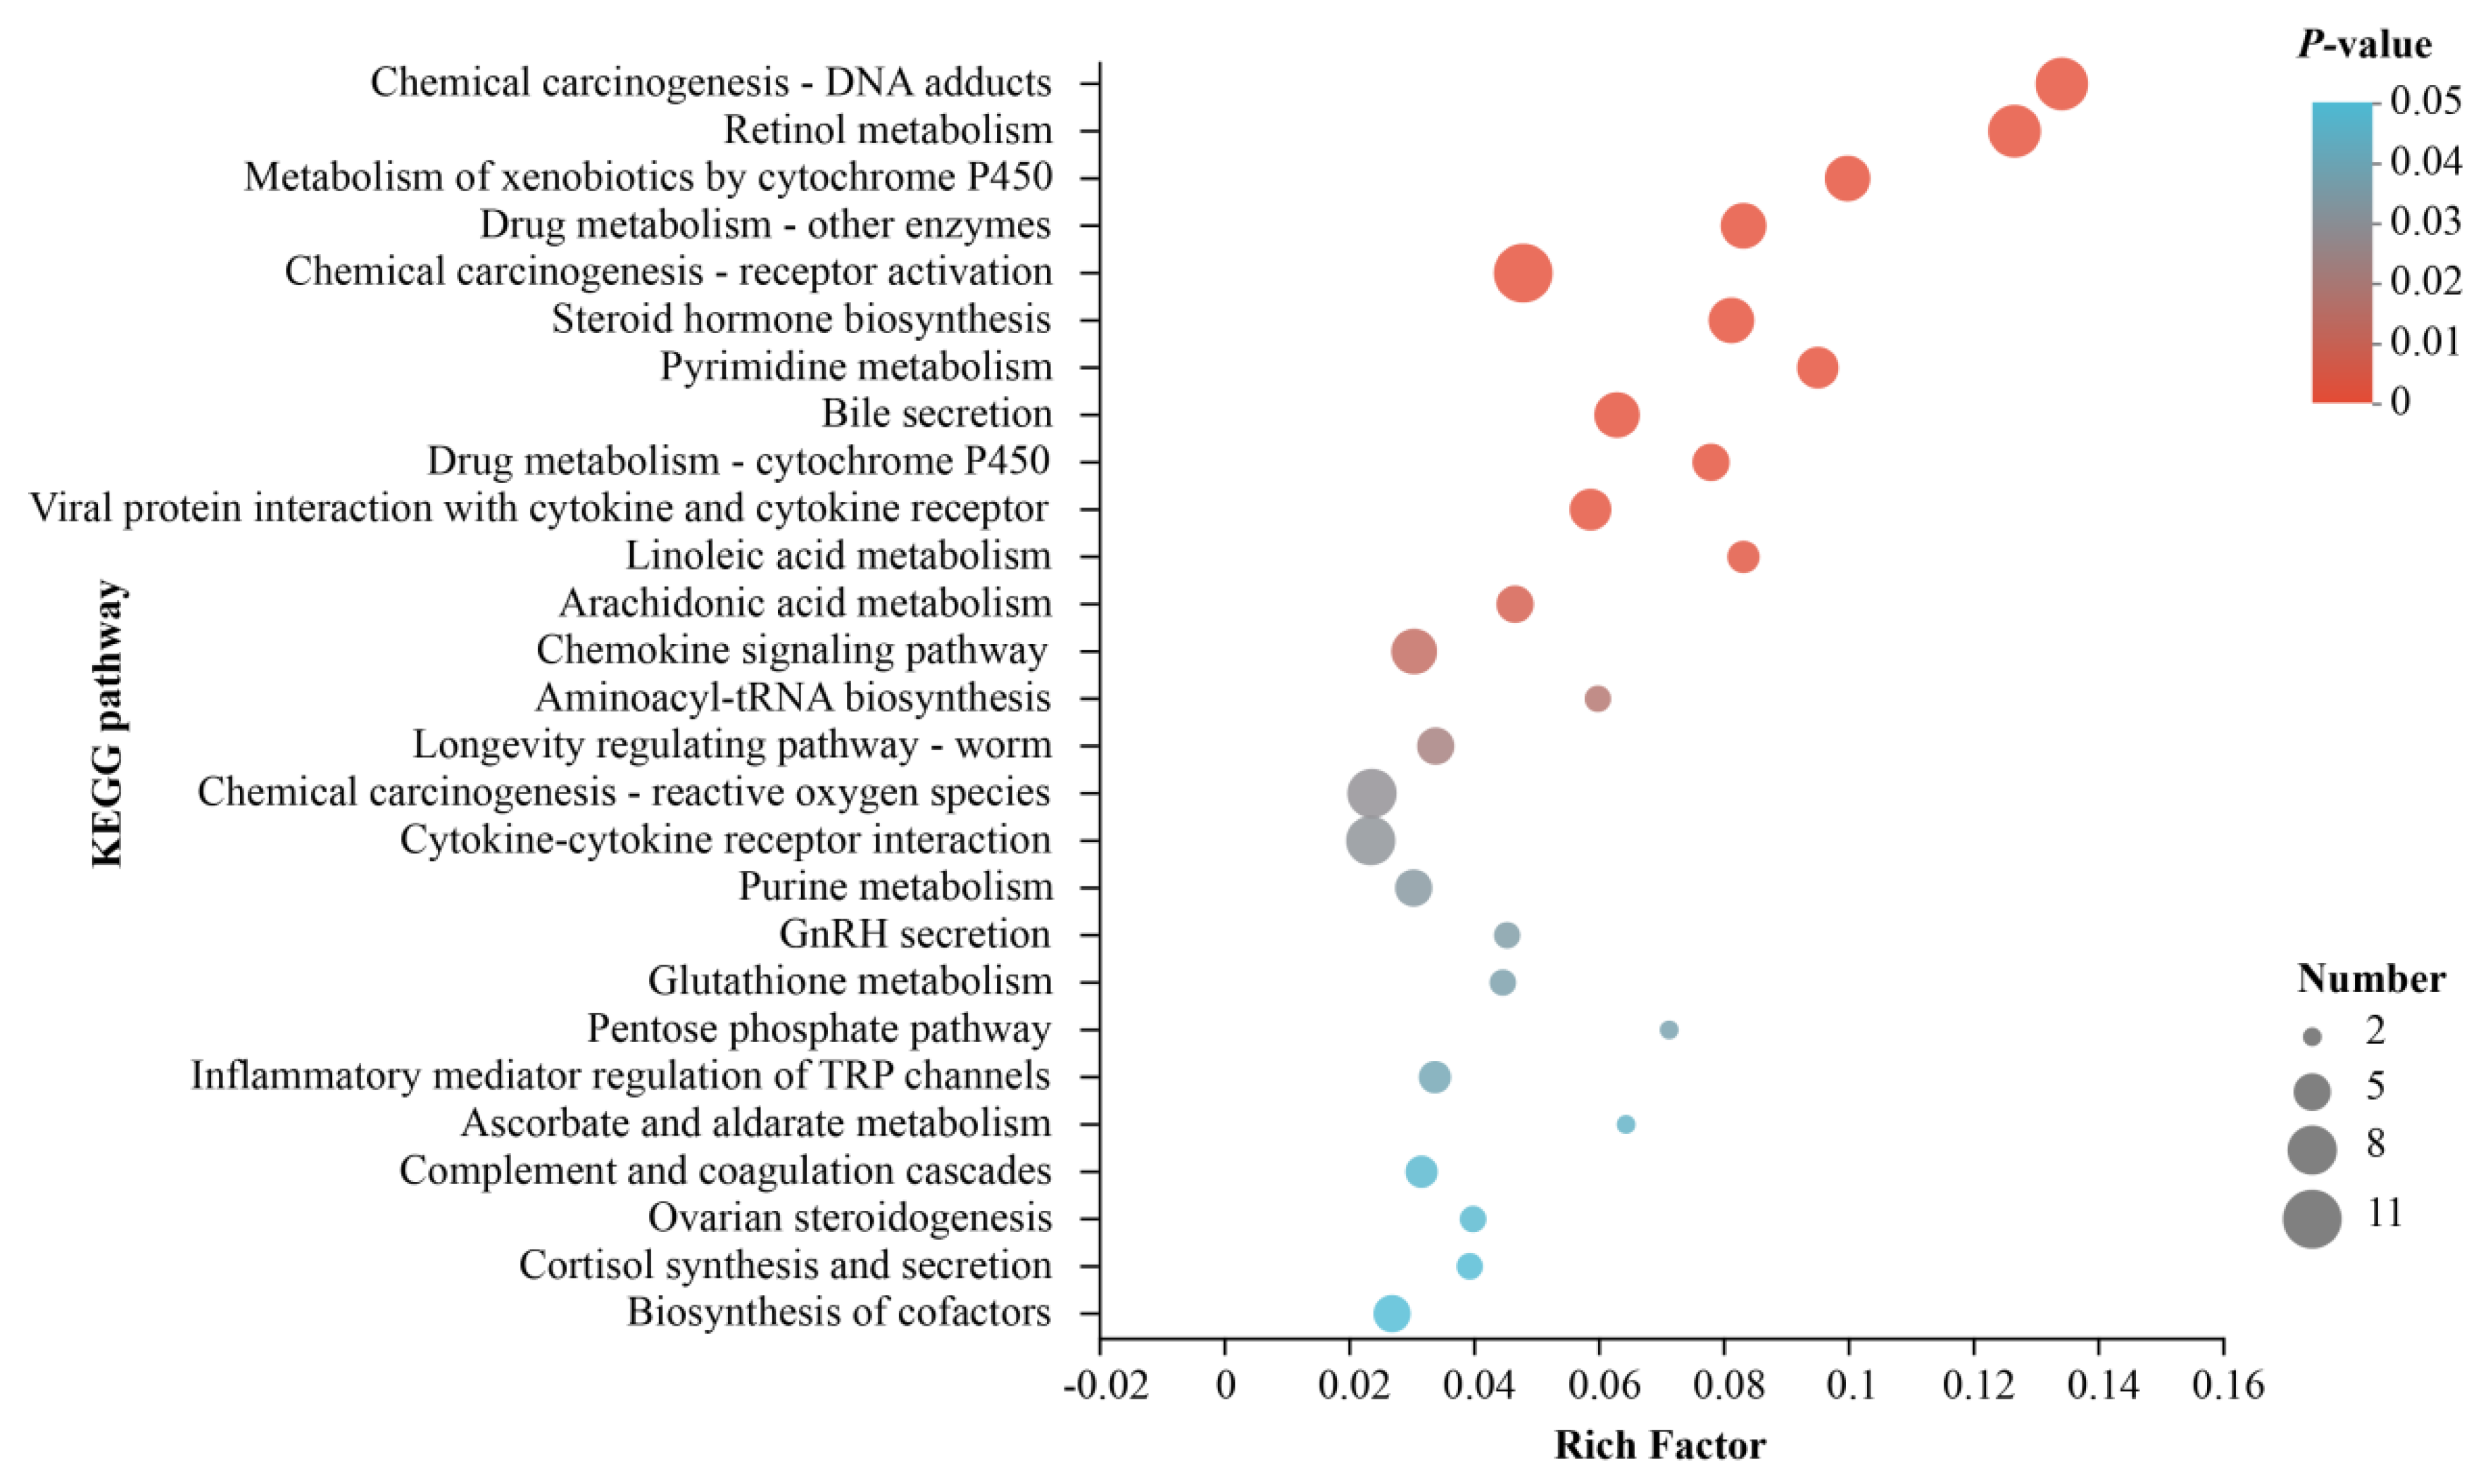
3.3. Analysis of Differential Gene Enrichment

The GO analysis was performed to detect the function of the identified DEGs. The 268 DEGs were enriched in 44 GO terms, including 20 terms in biological process (BP), 13 terms in cellular component (CC), and 10 terms in molecular function (MF) (Figure 4). Table 4 shows the top 20 items under GO enrichment which are mainly involved with terms relating to fat anabolic processes, including lipid metabolic process, small molecule metabolic process, cellular hormone metabolic process, xenobiotic metabolic process, extracellular space, monooxygenase activity, organic acid metabolic process, oxoacid metabolic process, hormone metabolic process, carboxylic acid metabolic process, monocarboxylic acid metabolic process, oxidoreductase activity, tetrapyrrole binding, chemokine activity, steroid metabolic process, detoxification, fatty acid omega-hydroxylase activity, steroid hydroxylase activity, etc.
Pathway-based analysis was conducted via KEGG to ulteriorly investigate the biological functions of these DEGs. A total of 27 pathways significantly enriched in two groups were identified, which are mainly related to fat metabolism and oxidative stress (Table 5), including retinol metabolism, metabolism of xenobiotics by cytochrome P450, steroid hormone biosynthesis, pyrimidine metabolism, bile secretion, drug metabolism - cytochrome P450, viral protein interaction with cytokine and cytokine receptor, linoleic acid metabolism, arachidonic acid metabolism, chemokine signaling pathway, aminoacyl-tRNA biosynthesis, longevity regulating pathway - worm, inflammatory mediator regulation of TRP channels, pentose phosphate pathway, chemical carcinogenesis - reactive oxygen species, purine metabolism, glutathione metabolism, GnRH secretion, cortisol synthesis and secretion, ovarian steroidogenesis, ascorbate and aldarate metabolism, complement and coagulation cascades, etc. (Figure 5).

3.4. Effects of Choline and Nicotinamide on Gene Expression Related to Liver Metabolism

Based on the above analysis results, in order to further verify the effect of choline and nicotinamide on liver metabolic function, the mRNA expression of some DEGs (FGF21, CYP26A1, SLC13A5, SLCO1B3, FBP2, MARS1, CDH11) associated with liver metabolic function was tested. As shown in Figure 6, compared with the NAM group, the gene expression of FGF21, CYP26A1, SLC13A5, SLCO1B3, FBP2, MARS1, CDH11 in the CHO group increased significantly (p < 0.05).

4. Discussion

The severe negative energy balance in periparturient dairy cows stimulates a large amount of body fat mobilized to support the energy demand of animals, resulting in the disorder of fat metabolism, particularly in the liver. Numerous studies have found that dietary choline and dietary nicotinamide supplementation can effectively alleviate the occurrence of metabolic diseases such as fatty liver, oxidative stress and inflammation [40,41,42]. This study compared the transcriptomic differences in liver metabolism in periparturient dairy cows with the addition of RPC and RPM, identified differential genes and pathways, and discussed the differences between choline and nicotinamide on liver metabolism at the transcriptome level.
In the present study, 640 genes up-regulated by the addition of RPC or RPM and 483 genes down-regulated by the addition of RPC or RPM were identified; the top 20 GO items were mainly involved in fat anabolic processes. The top two DEGs were phenylalanyl-tRNA synthetase 2 and fibroblast growth factor 21. Fibroblast growth factor 21 (FGF21), a member of the fibroblast 19 subfamily, is synthesized by the liver and regulated by peroxisome proliferators-activated receptors-α, carbohydrate response element binding protein and other reaction elements. It can act directly on liver cells as a paracrine or autocrine hormone and can also enter the systemic circulation and act on other tissues and organs to regulate glucose, lipid and energy metabolism [43,44]. Some researchers fed FGF21 knockout mice with a ketogenic diet and found that fat levels in the plasma of the mice were increased, obvious steatosis occurred, and the regulatory function of ketogenesis and sugar metabolism was impaired [45,46]. The chronic accumulation of triglycerides in the liver improves the β-oxidation rate of fatty acids in liver cells. When the energy supply from fatty acid oxidation exceeds the energy demand, it leads to the formation of reactive oxygen species, which, in turn, cause oxidative stress, thus inducing an increase in the synthesis of FGF21 [47,48]. It is worth noting that FGF21 can respond to low protein levels in the body to increase its own circulation and increase energy consumption to cope with the increase in calorie intake [44,49]. The results of the gene expression levels of FGF21 between two treatment groups showed that choline probably produces an effect on liver fat metabolism and reduces body energy consumption by up-regulating the level of FGF21. However, the reason for the reverse change of FGF21 expression under the influence of choline and nicotinamide needs to be further explored.
The top KEGG pathway of the DEGs in response to the RPC and RPM addition was for retinol metabolism in this study. Vitamin A can be stored in hepatic stellate cells in the form of retinol and provide vitamin A for various tissues of the body. All-trans-retinoic acid is an important active metabolite of vitamin A, and excessive retinoic acid levels in the body will cause changes in physiological functions of the body [50,51]. Retinoic acid hydroxylase CYP26A1 is very important for decomposing exogenous retinoic acid [52]. The results of the cell experiment show that the gene level of Cyp26a1 in the CHO group was significantly higher than that in the NAM group, indicating that choline can regulate retinoic acid hydroxylase to regulate liver retinol metabolism and maintain its level balance.
Subsequently, the genes closely related to liver metabolism among the DEGs to clarify the differences in the regulation of liver metabolism by choline and nicotinamide were further discussed. The solute carrier family 13 member 5 (SLC13A5) used to mediate citrate transport is mainly expressed in the liver of mammals. As a key intermediate of the tricarboxylic acid (TCA) cycle, citrate plays a key role in the cell metabolism of carbohydrates and fatty acids, as well as energy generation in mitochondria, and can also be served for the biosynthesis of triglycerides, fatty acids, cholesterol and low-density lipoprotein [53,54]. Brachs et al. (2016) found that in the Slc13a5 knockout of mice fed with a high-fat diet, tolerance to insulin resistance and fat deposition induced by the high-fat diet was increased [55]. The expression of Slc13a5 was also increased in the model of type-2-diabetes rats [56]. In addition, some researchers found that the level of intracellular citrate and phospholipid was significantly reduced after silencing the Slc13a5 in HepG2 and Huh7 cells [57]. Solid carrier organic animion transporter family member 1B3 (SLCO1B3, also known as OATP1B3) is a member of the solute transporter superfamily, which is mainly expressed in the basolateral membrane of hepatocytes. It can transport a variety of endogenous and xenobiotic compounds (such as prostaglandins, steroid hormone conjugates, bilirubin, bile acid, and thyroid hormone) to liver cells for metabolism [58,59]. It has been found that the new splice of OATP1B3, cancer-type OATP1B3, can up-regulate the expression of carnitine palmitoyl transfer and NADH: ubiquinone oxidoreductase subunit A2 through interaction with insulin-like growth factor 2 mRNA-binding protein 2, thereby promoting fatty acid β-oxidative and mitochondrial oxidative phosphorylation activities and increasing ATP production. This results in the formation of plate-like pseudopodia and migration and the invasion of high-grade serous ovarian cancer cells [60]. Sec14-like proteins belong to typical class III phosphatidylinositol transfer proteins, which can transfer phosphatidylinositol and PC between different biological membranes, exchange phosphatidylinositol to PC, and vice versa, so as to maintain membrane–lipid balance [61,62]. This study found that the expression levels of SLC13A5 and SLCO1B3 in the CHO group were significantly higher than that in the NAM group, showing that choline may regulate energy metabolism and material transport of the liver by up-regulation of SLCO1B3, thereby improving fat metabolite accumulation and energy imbalance. Nicotinamide may reduce the accumulation of citrate by promoting the TCA cycle, allowing the metabolites of citrate, acetyl coenzyme A and oxaloacetate to flow towards ATP synthesis rather than fatty acid synthesis, resulting in the lower gene expression of SLC13A5.
Analysis of DEGs revealed a significant increase in the expression levels of FBP and transaminase in the RPC group. Fructose diphosphatase (FBP) can not only regulate the glucose/glycogen synthesis of carbohydrate precursors but can also interact with proteins (such as ATP synthase, HIF1-α and NF-κB) to influence cell-cycle-dependent events, mitochondrial biogenesis and membrane polarization, expression of glycolytic enzymes, induction of synaptic plasticity, and even cancer progression [63]. Transketolase, a key enzyme of the pentose phosphate pathway that is ubiquitous in all organisms, provides a special connection between glycolysis and the non-oxidation period of the pentose phosphate pathway [64]. The study of LO2 cells suggests that the expression level of FBP significantly increased under the regulation of choline, indicating that choline may regulate the process of liver glucose metabolism through FBP and transketolase.
Methyl tRNA synthetase 1 (MARS1) and glycyl tRNA synthetase 1 (GARS1) belong to aminoacyl tRNA synthetases (ARSs). Aminoacyl tRNA synthetases, one of the potential markers of pneumonia, are generally used for protein synthesis and can interact with proteins in the signal pathway of the mammalian target of rapamycin 1, cyclin-dependent kinases 4 and the vascular endothelial growth factor receptor [65,66,67]. Several studies have found that inhibitors of aminoacyl tRNA synthetases have been used in the treatment of many diseases [68,69,70]. Fibroblasts will lose the function of matrix remodeling under pathological conditions, leading to tissue destruction and fibrosis [71,72]. Cadherin (cadherin-11, CDH11) is a mesenchymal cadherin that can be expressed in fibroblasts of various tissues and is also a marker and functional regulator of fibroblasts and can mediate homotypic cell adhesion that is important in histomorphogenesis and structure [73,74]. In CDH11-knocked diet-induced obese mice, inflammation was reduced and blood glucose levels were controlled [75]. The result of cell assays found that, compared with the CHO group, the levels of formyl tRNA synthetase 1 and CDH11 genes in the NAM group decreased significantly. Thus, it can be concluded that nicotinamide may affect liver inflammation by regulating the gene expression of MARS1, CDH11 and their related signal pathways, thereby preventing the occurrence of liver diseases.
The GO pathway enrichment analysis of the differential genes between RPC and RPM showed that the enriched pathways were mainly associated with the metabolic processes of lipid, cytokine, carboxylic acid, organic acid, oxoacid, and the activity of fatty acid omega-hydroxylase, steroid hydroxylase, oxidoreductase, chemokine, etc. The different metabolic pathways enriched by the KEGG pathway indicated that the differences between choline and nicotinamide in the regulation of liver metabolism were mainly manifested in fat metabolism, biosynthesis, drug metabolism, etc. This may be due to the fact that choline can also regulate the metabolism process of fat and energy in the liver as well as related signals of oxidative stress and inflammation as a signal, in addition to catabolizing into other substances and then participating in membrane biosynthesis, fat metabolism and transportation, and other substance synthesis [14,75]. Nicotinamide is mostly used to synthesize NAD for energy supply after entering the liver, to maintain the level of reduced glutathione and thioredoxin in the antioxidant system, and to participate in cell energy metabolism and other processes.

5. Conclusions

In this study, the effects of RPC and RPM on the liver transcriptome of perinatal cows were investigated, and 1123 DEGs and 27 different KEGG pathways were identified, mainly including retinol metabolism, metabolism of xenobiotics by cytochrome P450, steroid hormone biosynthesis, pyrimidine metabolism, bile secretion, linoleic acid metabolism, arachidonic acid metabolism, chemokine signaling pathway, aminoacyl-tRNA biosynthesis, purine metabolism, glutathione metabolism, etc. The expression levels of genes related to liver metabolism were identified, and it was found that, compared with the niacinamide group, the choline group could up-regulate the expression levels of FGF21, CYP26A1, SLC13A5, SLCO1B3, FBP2, MARS1, and CDH11. Overall, this study shows that RPC plays a prominent role in liver metabolism by regulating metabolic processes such as fatty acid synthesis and metabolism and glucose metabolism. Yet, RPM is more involved in biological processes such as the TCA cycle, ATP generation and inflammatory signaling.

Supplementary Materials

The following supporting information can be downloaded at: https://www.mdpi.com/article/10.3390/metabo13050594/s1, Supplementary Figure S1: Venn analysis between RPC and RPM group; Supplementary Table S1: Statistics for quality control of sequencing data; Supplementary Table S2: Differential gene statistics of up and down regulation.

Author Contributions

Conceptualization, Y.C., C.C. and J.Y.; methodology, Z.C. and X.D.; software, X.D.; formal analysis, X.D.; resources, X.D.; data curation, X.D.; writing—original draft preparation, X.D.; writing—review and editing, X.D., Z.C., R.Z., K.Z., L.W., Y.C., C.C., S.L. and J.Y.; supervision, Y.C., C.C. and J.Y.; project administration, Y.C.; funding acquisition, Y.C. All authors have read and agreed to the published version of the manuscript.

Funding

This research was funded by the National Natural Science Foundation of China (31972592), the National Key Research and Development Program (2021YFD1300301) and the Science and Technological Project of Shaanxi Province (2021NY-019).

Institutional Review Board Statement

In this study, all animal procedures were approved by the Institutional Animal Care and Use Committee of Northwest A&F University (Yangling, Shaanxi, China). The protocols of this study were specifically approved with the protocol number NWAFAC1008.

Informed Consent Statement

Not applicable.

Data Availability Statement

The data presented in this study are available in the article and the supplementary materials.

Conflicts of Interest

The authors declare no conflict of interest.

References

  1. Bazzano, M.; Giannetto, C.; Fazio, F.; Arfuso, F.; Giudice, E.; Piccione, G. Metabolic profile of broodmares during late pregnancy and early post-partum. Reprod. Domest. Anim. 2014, 49, 947–953. [Google Scholar] [CrossRef] [PubMed]
  2. Arfuso, F.; Minuti, A.; Liotta, L.; Giannetto, C.; Trevisi, E.; Piccione, G.; Lopreiato, V. Stress and inflammatory response of cows and their calves during peripartum and early neonatal period. Theriogenology 2023, 196, 157–166. [Google Scholar] [CrossRef] [PubMed]
  3. Tessari, R.; Berlanda, M.; Morgante, M.; Badon, T.; Gianesella, M.; Mazzotta, E.; Contiero, B.; Fiore, E. Changes of plasma fatty acids in four lipid classes to understand energy metabolism at different levels of non-esterified fatty acid (NEFA) in dairy cows. Animals 2020, 10, 1410. [Google Scholar] [CrossRef] [PubMed]
  4. Yepes, F.A.L.; Nydam, D.V.; Mann, S.; Caixeta, L.; Mcart, J.A.A.; Overton, T.R.; Wakshlag, J.; Huson, H.J. Longitudinal Phenotypes Improve Genotype Association for Hyperketonemia in Dairy Cattle. Animals 2019, 9, 1059. [Google Scholar] [CrossRef] [PubMed]
  5. Pascottini, O.B.; Leroy, J.L.M.R.; Opsomer, G. Metabolic stress in the transition period of dairy cows: Focusing on the prepartum period. Animals 2020, 10, 1419. [Google Scholar] [CrossRef]
  6. Van Saun, R.J.; Sniffen, C.J. Transition cow nutrition and feeding management for disease prevention. Vet. Clin. N. Am. Food. Anim. Pract. 2014, 30, 689–719. [Google Scholar] [CrossRef]
  7. Koeck, A.; Miglior, F.; Jamrozik, J.; Kelton, D.F.; Schenkel, F.S. Genetic associations of ketosis and displaced abomasum with milk production traits in early first lactation of Canadian Holsteins. J. Dairy Sci. 2013, 96, 4688–4696. [Google Scholar] [CrossRef]
  8. Jorritsma, R.; Wensing, T.; Kruip, T.A.; Vos, P.L.; Noordhuizen, J.P. Metabolic changes in early lactation and impaired reproductive performance in dairy cows. Vet. Res. Commun. 2003, 34, 11–26. [Google Scholar] [CrossRef]
  9. Ingvartsen, K.L.; Moyes, K.M. Factors contributing to immunosuppression in the dairy cow during the periparturient period. JPN J. Vet. Res. 2015, 63 (Suppl. S1), S15–S24. [Google Scholar]
  10. Korsmo, H.W.; Jiang, X.; Caudill, M.A. Choline: Exploring the growing science on its benefits for moms and babies. Nutrients 2019, 11, 1823. [Google Scholar] [CrossRef]
  11. Zeisel, S.H. Metabolic crosstalk between choline/1-carbon metabolism and energy homeostasis. Clin. Chem. Lab. Med. 2013, 51, 467–475. [Google Scholar] [CrossRef] [PubMed]
  12. Li, Z.; Agellon, L.B.; Allen, T.M.; Umeda, M.; Jewell, L.; Mason, A.; Vance, D.E. The ratio of phosphatidylcholine to phosphatidylethanolamine influences membrane integrity and steatohepatitis. Cell Metab. 2006, 3, 321–331. [Google Scholar] [CrossRef] [PubMed]
  13. Duszka, K.; Gregor, A.; Guillou, H.; König, J.; Wahli, W. Peroxisome proliferator-activated receptors and caloric restriction-common pathways affecting metabolism, health, and longevity. Cells 2020, 9, 1708. [Google Scholar] [CrossRef] [PubMed]
  14. Hedtke, V.; Bakovic, M. Choline transport for phospholipid synthesis: An emerging role of choline transporter-like protein 1. Exp. Biol. Med. 2019, 244, 655–662. [Google Scholar] [CrossRef] [PubMed]
  15. Snider, S.A.; Margison, K.D.; Ghorbani, P.; Leblond, N.D.; O’dwyer, C.; Nunes, J.R.C.; Nguyen, T.; Xu, H.; Bennett, S.A.L.; Fullerton, M. Choline transport links macrophage phospholipid metabolism and inflammation. J. Biol. Chem. 2018, 293, 11600–11611. [Google Scholar] [CrossRef]
  16. Ahmadzadeh-Gavahan, L.; Hosseinkhani, A. Feed restriction and supplementing with propylene glycol, monensin sodium and rumen-protected choline chloride in periparturient Ghezel ewes: Implications on production and performance of ewes and their offspring. Livest. Prod. Sci. 2022, 255, 104784. [Google Scholar] [CrossRef]
  17. Guo, C.Z.; Xue, Y.F.; Yin, Y.; Sun, D.M.; Xuan, H.P.; Liu, J.; Mao, S.Y. The effect of glycerol or rumen-protected choline chloride on rumen fermentation and blood metabolome in pregnant ewes suffering from negative energy balance. Anim. Feed Sci. Technol. 2020, 268, 114594. [Google Scholar] [CrossRef]
  18. Elek, P.; Newbold, J.R.; Gaal, T.; Wagner, L.; Husveth, F. Effects of rumen-protected choline supplementation on milk production and choline supply of periparturient dairy cows. Animal 2008, 2, 1595–1601. [Google Scholar] [CrossRef]
  19. Goselink, R.M.; van Baal, J.; Widjaja, H.C.; Dekker, R.A.; Zom, R.L.; de Veth, M.J.; van Vuuren, A.M. Effect of rumen-protected choline supplementation on liver and adipose gene expression during the transition period in dairy cattle. J. Dairy Sci. 2013, 96, 1102–1116. [Google Scholar] [CrossRef]
  20. Zom, R.L.; van Baal, J.; Goselink, R.M.; Bakker, J.A.; de Veth, M.J.; van Vuuren, A.M. Effect of rumen-protected choline on performance, blood metabolites, and hepatic triacylglycerols of periparturient dairy cattle. Clin. Chem. Lab. Med. 2011, 94, 4016–4027. [Google Scholar] [CrossRef]
  21. Guretzky, N.A.; Carlson, D.B.; Garrett, J.; Drackley, J.K. Lipid metabolite profiles and milk production for Holstein and Jersey cows fed rumen-protected choline during the periparturient period. J. Dairy Sci. 2006, 89, 188–200. [Google Scholar] [CrossRef] [PubMed]
  22. Chung, Y.H.; Brown, N.E.; Martinez, C.M.; Cassidy, T.W.; Varga, G.A. Effects of rumen-protected choline and dry propylene glycol on feed intake and blood parameters for Holstein dairy cows in early lactation. J. Dairy Sci. 2009, 92, 2729–2736. [Google Scholar] [CrossRef] [PubMed]
  23. Arshad, U.; Zenobi, M.G.; Staples, C.R.; Santos, J.E.P. Meta-analysis of the effects of supplemental rumen-protected choline during the transition period on performance and health of parous dairy cows. J. Dairy Sci. 2020, 103, 282–300. [Google Scholar] [CrossRef] [PubMed]
  24. Swartz, T.H.; Bradford, B.J.; Malysheva, O.; Caudill, M.A.; Mamedova, L.K.; Estes, K.A. Effects of dietary rumen-protected choline supplementation on colostrum yields, quality, and choline metabolites from dairy cattle. JDS. Commun. 2022, 3, 296–300. [Google Scholar] [CrossRef]
  25. Ahmadzadeh-Gavahan, L.; Hosseinkhani, A.; Taghizadeh, A.; Ghasemi-Panahi, B.; Hamidian, G.; Cheraghi-Saray, S.; Vakili, A. Impact of supplementing feed restricted ewes’ diet with propylene glycol, monensin sodium and rumen-protected choline chloride during late pregnancy on blood biochemical indices, body condition score and body weight. Anim. Feed. Sci. Technol. 2021, 273, 114801. [Google Scholar] [CrossRef]
  26. Morrison, E.I.; Reinhardt, H.; Leclerc, H.; DeVries, T.J.; LeBlanc, S.J. Effect of rumen-protected B vitamins and choline supplementation on health, production, and reproduction in transition dairy cows. J. Dairy Sci. 2018, 101, 9016–9027. [Google Scholar] [CrossRef]
  27. Vailati-Riboni, M.; Zhou, Z.; Jacometo, C.B.; Minuti, A.; Trevisi, E.; Luchini, D.N.; Loor, J.J. Supplementation with rumen-protected methionine or choline during the transition period influences whole-blood immune response in periparturient dairy cows. J. Dairy Sci. 2017, 100, 3958–3968. [Google Scholar] [CrossRef]
  28. Jayaprakash, G.; Sathiyabarathi, M.; Robert, M.A.; Tamilmani, T. Rumen-protected choline: A significance effect on dairy cattle nutrition. Vet. World 2016, 9, 837–841. [Google Scholar] [CrossRef]
  29. Swartz, T.H.; Bradford, B.J.; Lemke, M.; Mamedova, L.K.; Agnew, R.; Fehn, J.; Owczarzak, E.; McGill, J.L.; Estes, K.A. Effects of prenatal dietary rumen-protected choline supplementation during late gestation on calf growth, metabolism, and vaccine response. J. Dairy Sci. 2022, 105, 9639–9651. [Google Scholar] [CrossRef]
  30. Chen, J.; Yang, Z.; Dong, G. Niacin nutrition and rumen-protected niacin supplementation in dairy cows: An updated review. Br. J. Nutr. 2019, 122, 1103–1112. [Google Scholar] [CrossRef]
  31. Ijichi, H.; Ichiyama, A.; Hayaishi, O. Studies on the biosynthesis of nicotinamide adenine dinucleotide. 3. Comparative in vivo studies on nicotinic acid, nicotinamide, and quinolinic acid as precursors of nicotinamide adenine dinucleotide. J. Biol. Chem. 1966, 241, 3701–3707. [Google Scholar] [CrossRef] [PubMed]
  32. Maiese, K. New Insights for nicotinamide: Metabolic disease, autophagy, and mTOR. Front. Biosci. 2020, 25, 1925–1973. [Google Scholar] [CrossRef]
  33. Bogan, K.L.; Brenner, C. Nicotinic acid, nicotinamide, and nicotinamide riboside: A molecular evaluation of NAD+ precursor vitamins in human nutrition. Annu. Rev. Nutr. 2008, 28, 115–130. [Google Scholar] [CrossRef]
  34. Graff, E.C.; Fang, H.; Wanders, D.; Judd, R.L. The absence of adiponectin alters niacin’s effects on adipose tissue inflammation in mice. Nutrients 2020, 12, 2427. [Google Scholar] [CrossRef] [PubMed]
  35. Kashyap, M.L.; Ganji, S.; Nakra, N.K.; Kamanna, V.S. Niacin for treatment of nonalcoholic fatty liver disease (NAFLD): Novel use for an old drug? J. Clin. Lipidol. 2019, 13, 873–879. [Google Scholar] [CrossRef] [PubMed]
  36. Roberts, W.C. From the Editor Pellagra, Osler, Roberts, Goldberger, the Atherosclerotic Diet, Niacin, the Beginning of the Atherosclerotic Epidemic, and the First Lipid-Altering Drug. Am. J. Cardiol. 2019, 123, 697–700. [Google Scholar] [CrossRef] [PubMed]
  37. Ozaki, M.; Shimotsuma, M.; Hirose, T. Separation of nicotinamide metabolites using a PBr column packed with pentabromobenzyl group modified silica gel. Anal. Biochem. 2022, 655, 114837. [Google Scholar] [CrossRef]
  38. Hazim, R.A.; Paniagua, A.E.; Tang, L.; Yang, K.K.O.; Kim, K.; Stiles, L.; Divakaruni, A.S.; Williams, D. Vitamin B3, nicotinamide, enhances mitochondrial metabolism to promote differentiation of the retinal pigment epithelium. J. Biol. Chem. 2022, 298, 102286. [Google Scholar] [CrossRef] [PubMed]
  39. Feng, L.; Chen, Y.; Xu, K.; Li, Y.; Riaz, F.; Lu, K.; Chen, Q.; Du, X.; Wu, L.; Cao, D.; et al. Cholesterol-induced leucine aminopeptidase 3 (LAP3) upregulation inhibits cell autophagy in pathogenesis of NAFLD. Aging 2022, 14, 3259–3275. [Google Scholar] [CrossRef]
  40. Caprarulo, V.; Erb, S.; Chandler, T.L.; Zenobi, M.G.; Barton, B.A.; Staples, C.R.; White, H.M. The effects of prepartum energy intake and peripartum rumen-protected choline supplementation on hepatic genes involved in glucose and lipid metabolism. J. Dairy Sci. 2020, 103, 11439–11448. [Google Scholar] [CrossRef]
  41. Zenobi, M.G.; Bollatti, J.M.; Lopez, A.M.; Barton, B.A.; Hixson, C.L.; Maunsell, F.P.; Thatcher, W.W.; Miller-Cushon, K.; Santos, J.E.P.; Staples, C.R.; et al. Effects of maternal choline supplementation on performance and immunity of progeny from birth to weaning. Clin. Chem. Lab. Med. 2022, 105, 9896–9916. [Google Scholar] [CrossRef] [PubMed]
  42. Maiese, K. Nicotinamide as a Foundation for Treating Neurodegenerative Disease and Metabolic Disorders. Curr. Neurovasc. Res. 2021, 18, 134–149. [Google Scholar] [CrossRef] [PubMed]
  43. Do, H.; Tselykh, T.; Mäkelä, J.; Ho, T.; Olkkonen, V.; Bornhauser, B.; Korhonen, L.; Zelcer, N.; Lindholm, D. Fibroblast growth factor-21 (FGF21) regulates low-density lipoprotein receptor (LDLR) levels in cells via the E3-ubiquitin ligase Mylip/Idol and the Canopy2 (Cnpy2)/Mylip-interacting saposin-like protein (Msap). J. Biol. Chem. 2012, 287, 12602–12611. [Google Scholar] [CrossRef] [PubMed]
  44. Bondurant, L.D.; Potthoff, M.J. Fibroblast growth factor 21: A versatile regulator of metabolic homeostasis. Annu. Rev. Nutr. 2018, 38, 173–196. [Google Scholar] [CrossRef]
  45. Badman, M.K.; Pissios, P.; Kennedy, A.R.; Koukos, G.; Flier, J.S.; Maratos-Flier, E. Hepatic fibroblast growth factor 21 is regulated by PPARalpha and is a key mediator of hepatic lipid metabolism in ketotic states. Cell Metab. 2007, 5, 426–437. [Google Scholar] [CrossRef]
  46. Badman, M.K.; Koester, A.; Flier, J.S.; Kharitonenkov, A.; Maratos-Flier, E. Fibroblast growth factor 21-deficient mice demonstrate impaired adaptation to ketosis. Endocrinology 2009, 150, 4931–4940. [Google Scholar] [CrossRef]
  47. Tillman, E.J.; Rolph, T. FGF21: An emerging therapeutic target for non-alcoholic steatohepatitis and related metabolic diseases. Front. Endocrinol. 2020, 11, 601290. [Google Scholar] [CrossRef]
  48. Kharitonenkov, A.; Shiyanova, T.L.; Koester, A.; Ford, A.M.; Micanovic, R.; Galbreath, E.J.; Sandusky, G.E.; Hammond, L.J.; Moyers, J.S.; Owens, R.A.; et al. FGF-21 as a novel metabolic regulator. J. Clin. Lipidol. 2005, 115, 1627–1635. [Google Scholar] [CrossRef]
  49. Maida, A.; Zota, A.; Sjøberg, K.A.; Schumacher, J.; Sijmonsma, T.P.; Pfenninger, A.; Christensen, M.M.; Gantert, T.; Fuhrmeister, J.; Rothermel, U.; et al. A liver stress-endocrine nexus promotes metabolic integrity during dietary protein dilution. J. Clin. Investig. 2016, 126, 3263–3678. [Google Scholar] [CrossRef]
  50. Hall, J.A.; Grainger, J.R.; Spencer, S.P.; Belkaid, Y.J.I. The role of retinoic acid in tolerance and immunity. Immunity 2011, 35, 13–22. [Google Scholar] [CrossRef]
  51. Ross, A.C.; Zolfaghari, R. Cytochrome P450s in the regulation of cellular retinoic acid metabolism. Annu. Rev. Nutr. 2011, 31, 65–87. [Google Scholar] [CrossRef] [PubMed]
  52. Zhong, G.; Hogarth, C.; Snyder, J.M.; Palau, L.; Topping, T.; Huang, W.; Czuba, L.C.; Lafrance, J.; Ghiaur, G.; Isoherranen, N. The retinoic acid hydroxylase Cyp26a1 has minor effects on postnatal vitamin A homeostasis, but is required for exogenous atRA clearance. J. Biol. Chem. 2019, 294, 11166–11179. [Google Scholar] [CrossRef] [PubMed]
  53. Inoue, K.; Zhuang, L.; Maddox, D.M.; Smith, S.B.; Ganapathy, V. Structure, function, and expression pattern of a novel sodium-coupled citrate transporter (NaCT) cloned from mammalian brain. J. Biol. Chem. 2002, 277, 39469–39476. [Google Scholar] [CrossRef]
  54. Rogers, R.P.; Rogina, B. The role of INDY in metabolism, health and longevity. Front. Genet. 2015, 6, 204. [Google Scholar] [CrossRef] [PubMed]
  55. Brachs, S.; Winkel, A.F.; Tang, H.; Birkenfeld, A.; Brunner, B.; Jahn-Hofmann, K.; Margerie, D.; Ruetten, H.; Schmoll, D.; Spranger, J. Inhibition of citrate cotransporter Slc13a5/mINDY by RNAi improves hepatic insulin sensitivity and prevents diet-induced non-alcoholic fatty liver disease in mice. Mol. Metab. 2016, 5, 1072–1082. [Google Scholar] [CrossRef]
  56. Neuschäfer-Rube, F.; Lieske, S.; Kuna, M.; Henkel, J.; Perry, R.J.; Erion, D.; Pesta, D.M.; Willmes, D.; Brachs, S.; von Loeffelholz, C.; et al. The mammalian INDY homolog is induced by CREB in a rat model of type 2 diabetes. Diabetes 2014, 63, 1048–1057. [Google Scholar] [CrossRef]
  57. Li, Z.; Li, D.; Choi, E.; Lapidus, R.; Zhang, L.; Huang, S.; Shapiro, P.; Wang, H. Silencing of solute carrier family 13 member 5 disrupts energy homeostasis and inhibits proliferation of human hepatocarcinoma cells. J. Biol. Chem. 2017, 292, 13890–13901. [Google Scholar] [CrossRef]
  58. König, J.; Cui, Y.; Nies, A.T.; Keppler, D. A novel human organic anion transporting polypeptide localized to the basolateral hepatocyte membrane. Am. J. Physiol. Gastrointest. Liver Physiol. 2000, 278, G156–G164. [Google Scholar] [CrossRef]
  59. Svoboda, M.; Riha, J.; Wlcek, K.; Jaeger, W.; Thalhammer, T. Organic anion transporting polypeptides (OATPs): Regulation of expression and function. Curr. Drug Metab. 2011, 12, 139–153. [Google Scholar] [CrossRef]
  60. Huang, Y.; Du, Y.; Zheng, Y.; Wen, C.; Zou, H.; Huang, J.; Zhou, H.; Zhao, H.; Wu, L. Ct-OATP1B3 promotes high-grade serous ovarian cancer metastasis by regulation of fatty acid beta-oxidation and oxidative phosphorylation. Cell Death Dis. 2022, 13, 556. [Google Scholar] [CrossRef]
  61. Allen-Baume, V.; Ségui, B.; Cockcroft, S. Current thoughts on the phosphatidylinositol transfer protein family. FEBS Lett. 2002, 531, 74–80. [Google Scholar] [CrossRef] [PubMed]
  62. Wiedemann, C.; Cockcroft, S. The role of phosphatidylinositol transfer proteins (PITPs) in intracellular signalling. Trends Endocrinol. Metab. 1998, 9, 324–328. [Google Scholar] [CrossRef] [PubMed]
  63. Pietras, Ł.; Stefanik, E.; Rakus, D.; Gizak, A. FBP2—A New Player in Regulation of Motility of Mitochondria and Stability of Microtubules in Cardiomyocytes. Cells 2022, 11, 1710. [Google Scholar] [CrossRef] [PubMed]
  64. Wilkinson, H.C.; Dalby, P.A. The Two-Species Model of transketolase explains donor substrate-binding, inhibition and heat-activation. Sci. Rep. 2020, 10, 4148. [Google Scholar] [CrossRef] [PubMed]
  65. Mirando, A.C.; Francklyn, C.S.; Lounsbury, K.M. Regulation of angiogenesis by aminoacyl-tRNA synthetases. Int. J. Mol. Sci. 2014, 15, 23725–23748. [Google Scholar] [CrossRef] [PubMed]
  66. Yao, P.; Fox, P. Aminoacyl-tRNA synthetases in medicine and disease. EMBO. Mol. Med. 2013, 5, 332–343. [Google Scholar] [CrossRef]
  67. Hyeon, D.Y.; Kim, J.H.; Ahn, T.J.; Cho, Y.; Hwang, D.; Kim, S. Evolution of the multi-tRNA synthetase complex and its role in cancer. J. Biol. Chem. 2019, 294, 5340–5351. [Google Scholar] [CrossRef]
  68. Lee, J.M.; Kim, T.; Kim, E.Y.; Kim, A.; Lee, D.K.; Kwon, N.H.; Kim, S.; Chang, Y.S. Methionyl-tRNA synthetase is a useful diagnostic marker for lymph node metastasis in non-small cell lung cancer. Yonsei Med. J. 2019, 60, 1005–1012. [Google Scholar] [CrossRef] [PubMed]
  69. Kim, D.K.; Lee, H.J.; Kong, J.; Cho, H.Y.; Kim, S.; Kang, B.S. Structural basis for the dynamics of human methionyl-tRNA synthetase in multi-tRNA synthetase complexes. Nucleic. Acids. Res. 2021, 49, 6549–6568. [Google Scholar] [CrossRef]
  70. Buckner, F.S.; Ranade, R.M.; Gillespie, J.R.; Shibata, S.; Hulverson, M.A.; Zhang, Z.; Huang, W.; Choi, R.; Verlinde, C.L.M.J.; Hol, W.; et al. Cryptosporidium optimization of methionyl tRNA-synthetase inhibitors for treatment of infection. Antimicrob. Agents Chemother. 2019, 63, e02061-18. [Google Scholar] [CrossRef]
  71. Sun, K.; Tordjman, J.; Clément, K.; Scherer, P. Fibrosis and adipose tissue dysfunction. Cell Met. 2013, 18, 470–477. [Google Scholar] [CrossRef] [PubMed]
  72. Wynn, T. Integrating mechanisms of pulmonary fibrosis. J. Exp. Med. 2011, 208, 1339–1350. [Google Scholar] [CrossRef] [PubMed]
  73. Wu, M.; Pedroza, M.; Lafyatis, R.; George, A.T.; Mayes, M.D.; Assassi, S.; Tan, F.K.; Brenner, M.B.; Agarwal, S.K. Identification of cadherin 11 as a mediator of dermal fibrosis and possible role in systemic sclerosis. Arthritis Rheumatol. 2014, 66, 1010–1021. [Google Scholar] [CrossRef] [PubMed]
  74. Schneider, D.J.; Wu, M.; Le, T.; Cho, S.H.; Brenner, M.B.; Blackburn, M.R.; Agarwal, S.K. Cadherin-11 contributes to pulmonary fibrosis: Potential role in TGF-β production and epithelial to mesenchymal transition. FASEB J. 2012, 26, 503–512. [Google Scholar] [CrossRef]
  75. Garcia, M.; Mamedova, L.K.; Barton, B.; Bradford, B.J. In vitro choline regulates the function of bovine immune cells and alters the mRNA abundance of enzymes and receptors involved in its metabolism. Front. Immunol. 2018, 9, 2448. [Google Scholar] [CrossRef] [PubMed]
Figure 1. Volcano plot of DEGs. The corrected p-value is p−adjust. Each dot represents a gene in which red represents significant up-regulation of gene expression and green represents significant down-regulation of gene expression. The closer the point is to the two sides and the upper side, the more significant the difference is.
Metabolites 13 00594 g001
Figure 2. Cluster heatmap of DEGs in different samples. Different colors represent the expression value of the gene after standardization in each sample. On the left side is the tree diagram of the gene cluster and the module diagram of the sub cluster. The closer the two gene branches are, the closer their expression amounts are. The upper side in this graph is the tree diagram of the sample cluster. The closer the two samples branch, the closer the expression patterns of all genes in the two samples are. RPC = rumen-protected choline group; RPM = rumen-protected nicotinamide group.
Metabolites 13 00594 g002
Figure 3. OPLS-DA score plot of different samples. RPC = rumen-protected choline group; RPM = rumen-protected nicotinamide group. RPC = rumen-protected choline group; RPM = rumen-protected nicotinamide group.
Metabolites 13 00594 g003
Figure 4. Top 20 GO terms in gene abundance. The ordinate in the graph represents the GO’s secondary classification term, the lower abscissa represents the number of genes/transcripts for that secondary classification on the alignment. BP = biological process; CC = cellular component; MF = molecular function.
Metabolites 13 00594 g004
Figure 5. Enriched KEGG pathway of DEGs. The rich factor is the ratio of differentially methylated and expressed gene numbers annotated in this pathway term to all gene numbers annotated in this pathway term. The size of the dot represents the number of genes in the path, and the color of the dot corresponds to different p-value ranges.
Metabolites 13 00594 g005
Figure 6. Verification of gene expression. (A) mRNA expression of FGF21. (B) mRNA expression of CYP26A1. (C) mRNA expression of SLA13A5. (D) mRNA expression of SLCO1B3. (E) mRNA expression of FBP2. (F) mRNA expression of MARS1. (G) mRNA expression of CDH11. ** indicates p < 0.01, *** indicates p < 0.001.
Metabolites 13 00594 g006
Table 1. Sequences of primers.
Target GeneForward (5′-3′)Reverse (5′-3′)
FBP2GTCACGTTAACGCTTCCTGCCTGCACTGCTGGCGTTTTAG
SLCO1B3CACACTTGGGTGAATGCCCAATGTGGTACCTCCTGTTGCAG
MARS1GGGCTTCCAGCTGATGCTATTGGACTCTCTGTAGCCACCA
FGF21ATCGCTCCACTTTGACCCTGGGGCTTCGGACTGGTAAACA
CYP26A1CCCTATGCTGTGGCTGCAATCCAAGGGCTGACAAACTGGA
CDH11GGGCTTCCAGCTGATGCTATTGGACTCTCTGTAGCCACCA
SLC13A5TGATGACGTAGGCACACCTGTTGACAATCCATGCCAGCCG
β-actinGCACTCTTCCAGCCTTCCTTAATGCCAGGGTACATGGTGG
Table 2. The reaction system and condition of RT-PCR.
Reagent NameVolume (μL)
2× SYBR® Green Pro Taq HS Premix5.0
Forward primer (10 μM)0.5
Reverse primer (10 μM)0.5
cDNA4.0
Reaction conditions: 95 °C 30 s; 2 95 °C 5 s, 60 °C 30 s (40 cycles) (two-step algorithm)
Dissociation stage: 95 °C 10 s, 65 °C 60 s, 97 °C 1 s
Table 3. Top 30 DEGs identified in RPC and RPM groups.
Gene NameGene DescriptionLog2FC (RPC/RPM) *p-Value
FARS2phenylalanyl-tRNA synthetase 2, mitochondrial1.7571.31 × 1013
FGF21fibroblast growth factor 21−4.5355.77 × 1013
NOTUMnotum, palmitoleoyl-protein carboxylesterase2.3101.13 × 1012
CYP2C19cytochrome P450, family 2, subfamily C, polypeptide 192.8942.58 × 1012
KCNN2potassium calcium-activated channel subfamily N member 22.1635.49 × 1012
FUT1fucosyltransferase 1−5.5242.32 × 1012
CYP26A1cytochrome P450, family 26, subfamily A, polypeptide 13.3157.46 × 1011
CDH11cadherin 11−3.2012.64 × 1010
DTX1deltex E3 ubiquitin ligase 1−2.8724.29 × 1010
ATP6V1C2ATPase H+ transporting V1 subunit C2−4.0795.57 × 1010
SLC13A5solute carrier family 13 member 5−2.3691.53 × 109
LRRC73leucine-rich repeat-containing 73−3.9074.41 × 109
HOPXHOP homeobox−3.0704.68 × 109
SLCO1B3solute carrier organic anion transporter family member 1B31.0895.55 × 109
MICAL2microtubule-associated monooxygenase, calponin and LIM domain-containing 2−2.9591.36 × 108
GPC3glypican 3-1.8303.69 × 108
ADCY2adenylate cyclase 2−3.5377.04 × 107
HRGhistidine-rich glycoprotein1.6661.02 × 107
GLI1GLI family zinc finger 1−3.4461.10 × 107
CES1carboxylesterase 1 (monocyte/macrophage serine esterase 1)2.0002.08 × 107
CD1DCD1D antigen, d polypeptide1.8104.24 × 107
FBP2fructose-bisphosphatase 23.1674.36 × 107
MARS1methionyl-tRNA synthetase 1−2.0704.71 × 107
SEC14L3SEC14-like lipid binding 34.215.31 × 107
INHBEinhibin subunit beta E−2.2778.08 × 107
CARS1cysteinyl-tRNA synthetase 1−1.2181.71 × 106
PLEKpleckstrin1.5451.72 × 106
TKTtransketolase1.0091.75 × 106
CITED4Cbp/p300-interacting transactivator with Glu/Asp-rich carboxy-terminal domain 4−2.0262.22 × 106
BIRC5baculoviral IAP-repeat-containing 52.7032.34 × 106
* RPC = rumen-protected choline; RPM = rumen-protected nicotinamide.
Table 4. Top 20 enriched GO terms among DEGs. BP = biological process; CC = cellular component; MF = molecular function.
GO IDCategoryDescriptionp-ValueCounts
GO:0006629BPlipid metabolic process1.18 × 10629
GO:0044281BPsmall molecule metabolic process1.56 × 10640
GO:0034754BPcellular hormone metabolic process3.39 × 1068
GO:0006805BPxenobiotic metabolic process4.33 × 1067
GO:0005615CCextracellular space2.60 × 10633
GO:0004497MFmonooxygenase activity3.61 × 10610
GO:0005737CCcytoplasm5.73 × 10688
GO:0006082BPorganic acid metabolic process7.52 × 10623
GO:0043436BPoxoacid metabolic process1.41 × 10522
GO:0042445BPhormone metabolic process1.64 × 1059
GO:0019752BPcarboxylic acid metabolic process1.78 × 10521
GO:0110165CCcellular anatomical entity2.00 × 105236
GO:0032787BPmonocarboxylic acid metabolic process3.31 × 10515
GO:0016712MFoxidoreductase activity, acting on paired donors, with incorporation or reduction in molecular oxygen, reduced flavin or flavoprotein as one donor, and incorporation of one atom of oxygen2.96 × 1055
GO:0046906MFtetrapyrrole binding3.25 × 10510
GO:0008009MFchemokine activity4.86 × 1055
GO:0008202BPsteroid metabolic process8.63 × 1059
GO:0098754BPdetoxification9.17 × 1057
GO:0102033MFfatty acid omega-hydroxylase activity9.08 × 1052
GO:0008395MFsteroid hydroxylase activity9.33 × 1055
Table 5. Top 20 enriched KEGG pathways of DEGs.
Pathway IDKEGG Pathwaysp-ValueCounts
map00830Retinol metabolism5.95 × 1089
map05204Chemical carcinogenesis - DNA adducts3.54 × 1089
map00980Metabolism of xenobiotics by cytochrome P4509.19 × 1067
map00140Steroid hormone biosynthesis3.57 × 1057
map05207Chemical carcinogenesis - receptor activation3.44 × 10511
map00983Drug metabolism - other enzymes3.07 × 1057
map00240Pyrimidine metabolism5.39 × 1056
map04976Bile secretion0.000187
map00982Drug metabolism - cytochrome P4500.000585
map04061Viral protein interaction with cytokine and cytokine receptor0.000766
map00591Linoleic acid metabolism0.001654
map00590Arachidonic acid metabolism0.005635
map04062Chemokine signaling pathway0.011227
map00970Aminoacyl-tRNA biosynthesis0.015913
map04212Longevity regulating pathway - worm0.020225
map04060Cytokine-cytokine receptor interaction0.028358
map04750Inflammatory mediator regulation of TRP channels0.036844
map00030Pentose phosphate pathway0.035202
map05208Chemical carcinogenesis - reactive oxygen species0.027098
map00230Purine metabolism0.030555
Disclaimer/Publisher’s Note: The statements, opinions and data contained in all publications are solely those of the individual author(s) and contributor(s) and not of MDPI and/or the editor(s). MDPI and/or the editor(s) disclaim responsibility for any injury to people or property resulting from any ideas, methods, instructions or products referred to in the content.

