
Metabolomic Footprint of Disrupted Energetics and Amino Acid Metabolism in Neurodegenerative Diseases: Perspectives for Early Diagnosis and Monitoring of Therapy

 , and
, and
Abstract
:1. Introduction
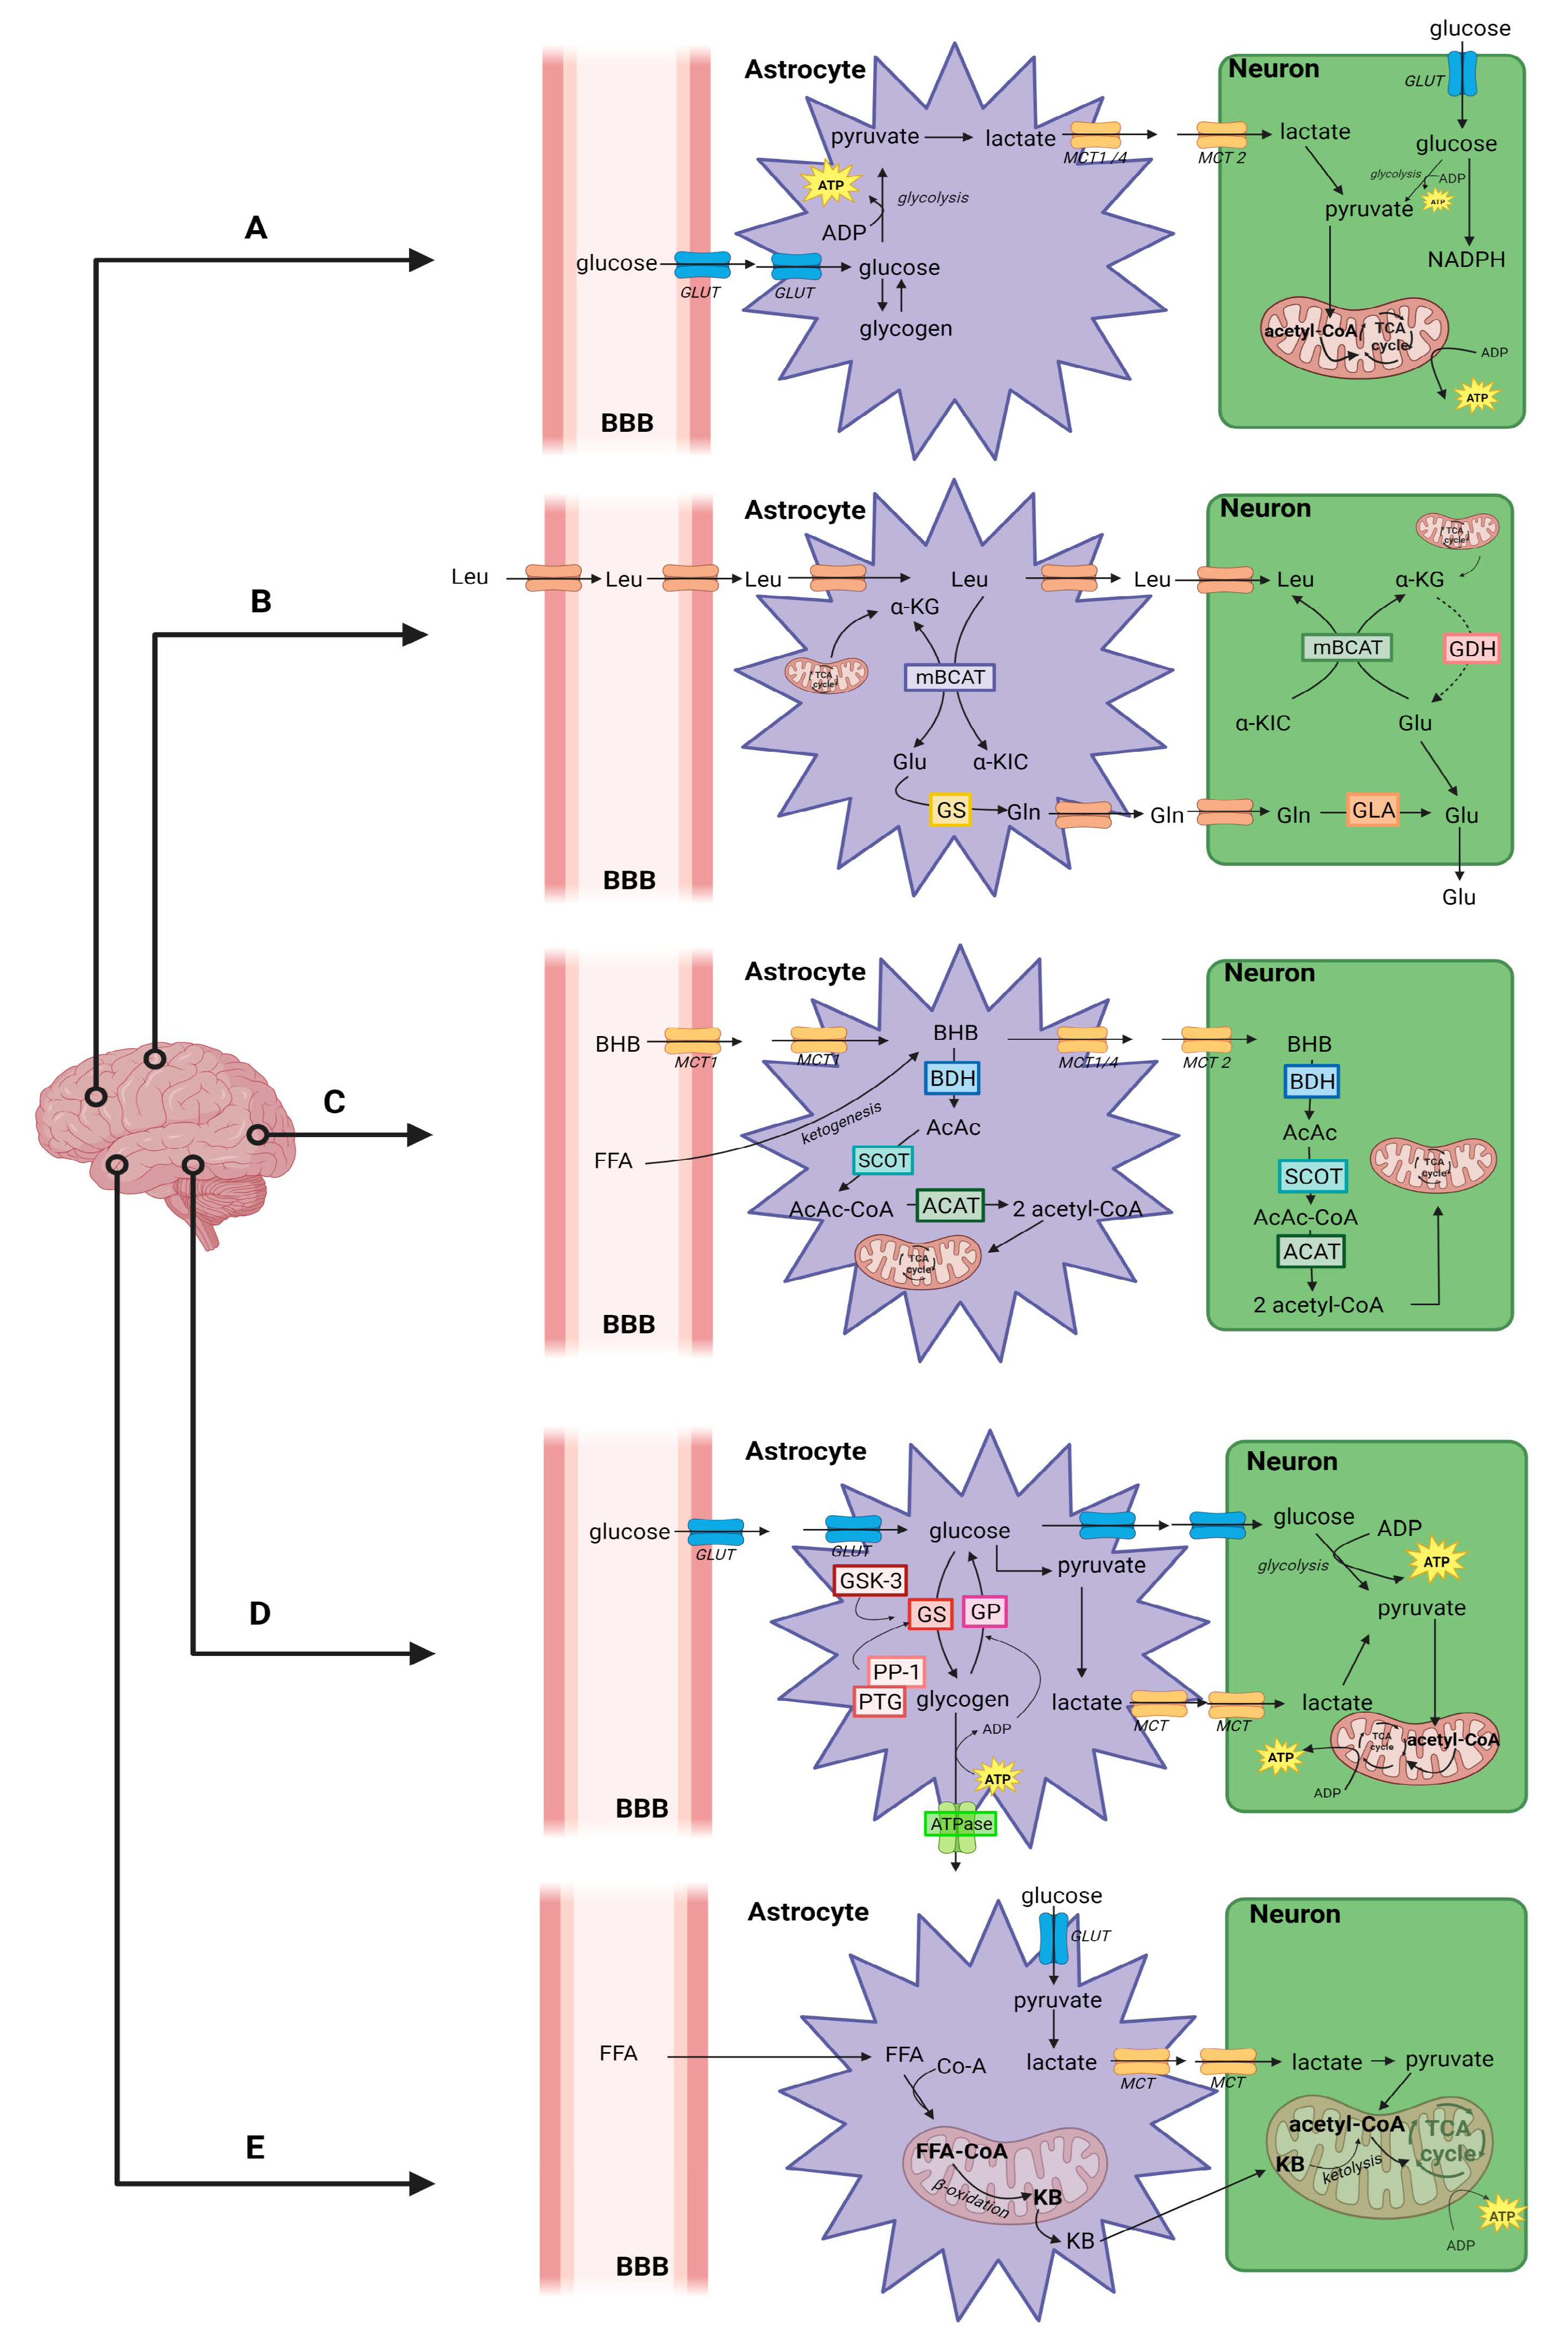
Brain Energy Metabolism

2. Alzheimer’s Disease
2.1. Disrupted Energy Metabolism in AD-Affected Brain
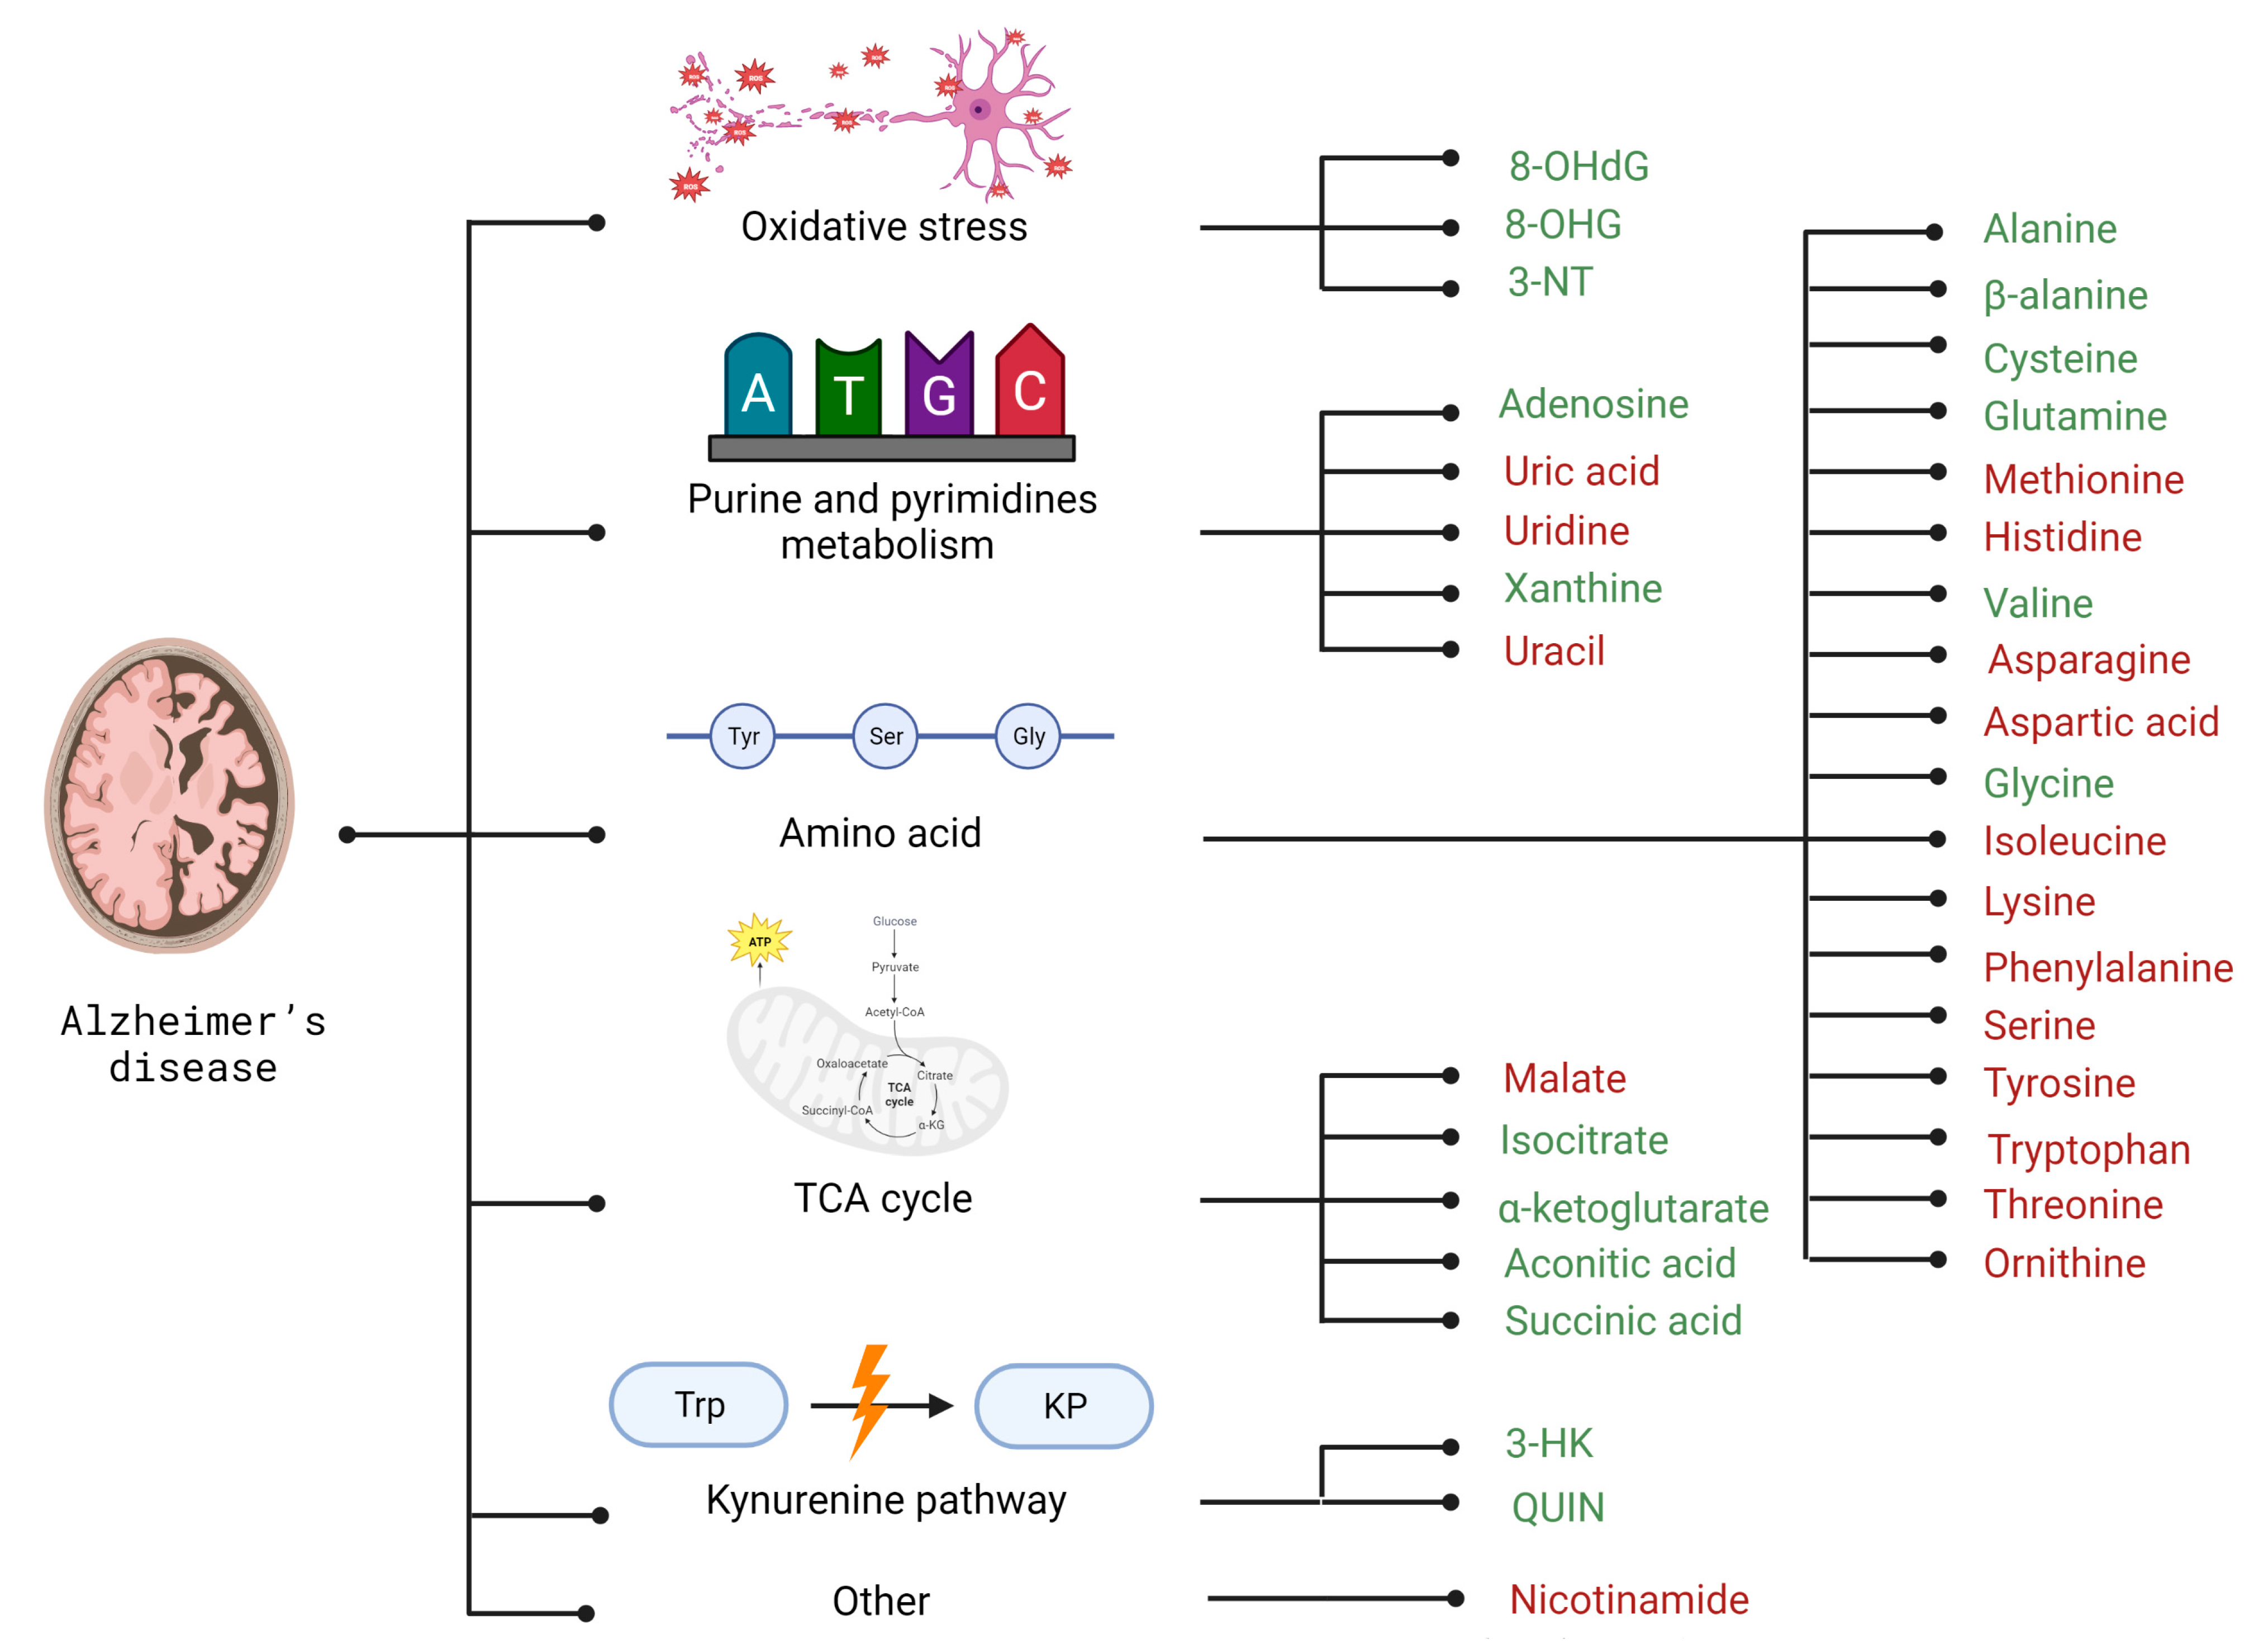
2.2. Selected Candidates for Biomarkers Related to Disrupted Energy Metabolism Pathways and Intracellular Homeostasis Imbalance
3. Parkinson’s Disease
3.1. Disrupted Energy Metabolism in PD-Affected Brain
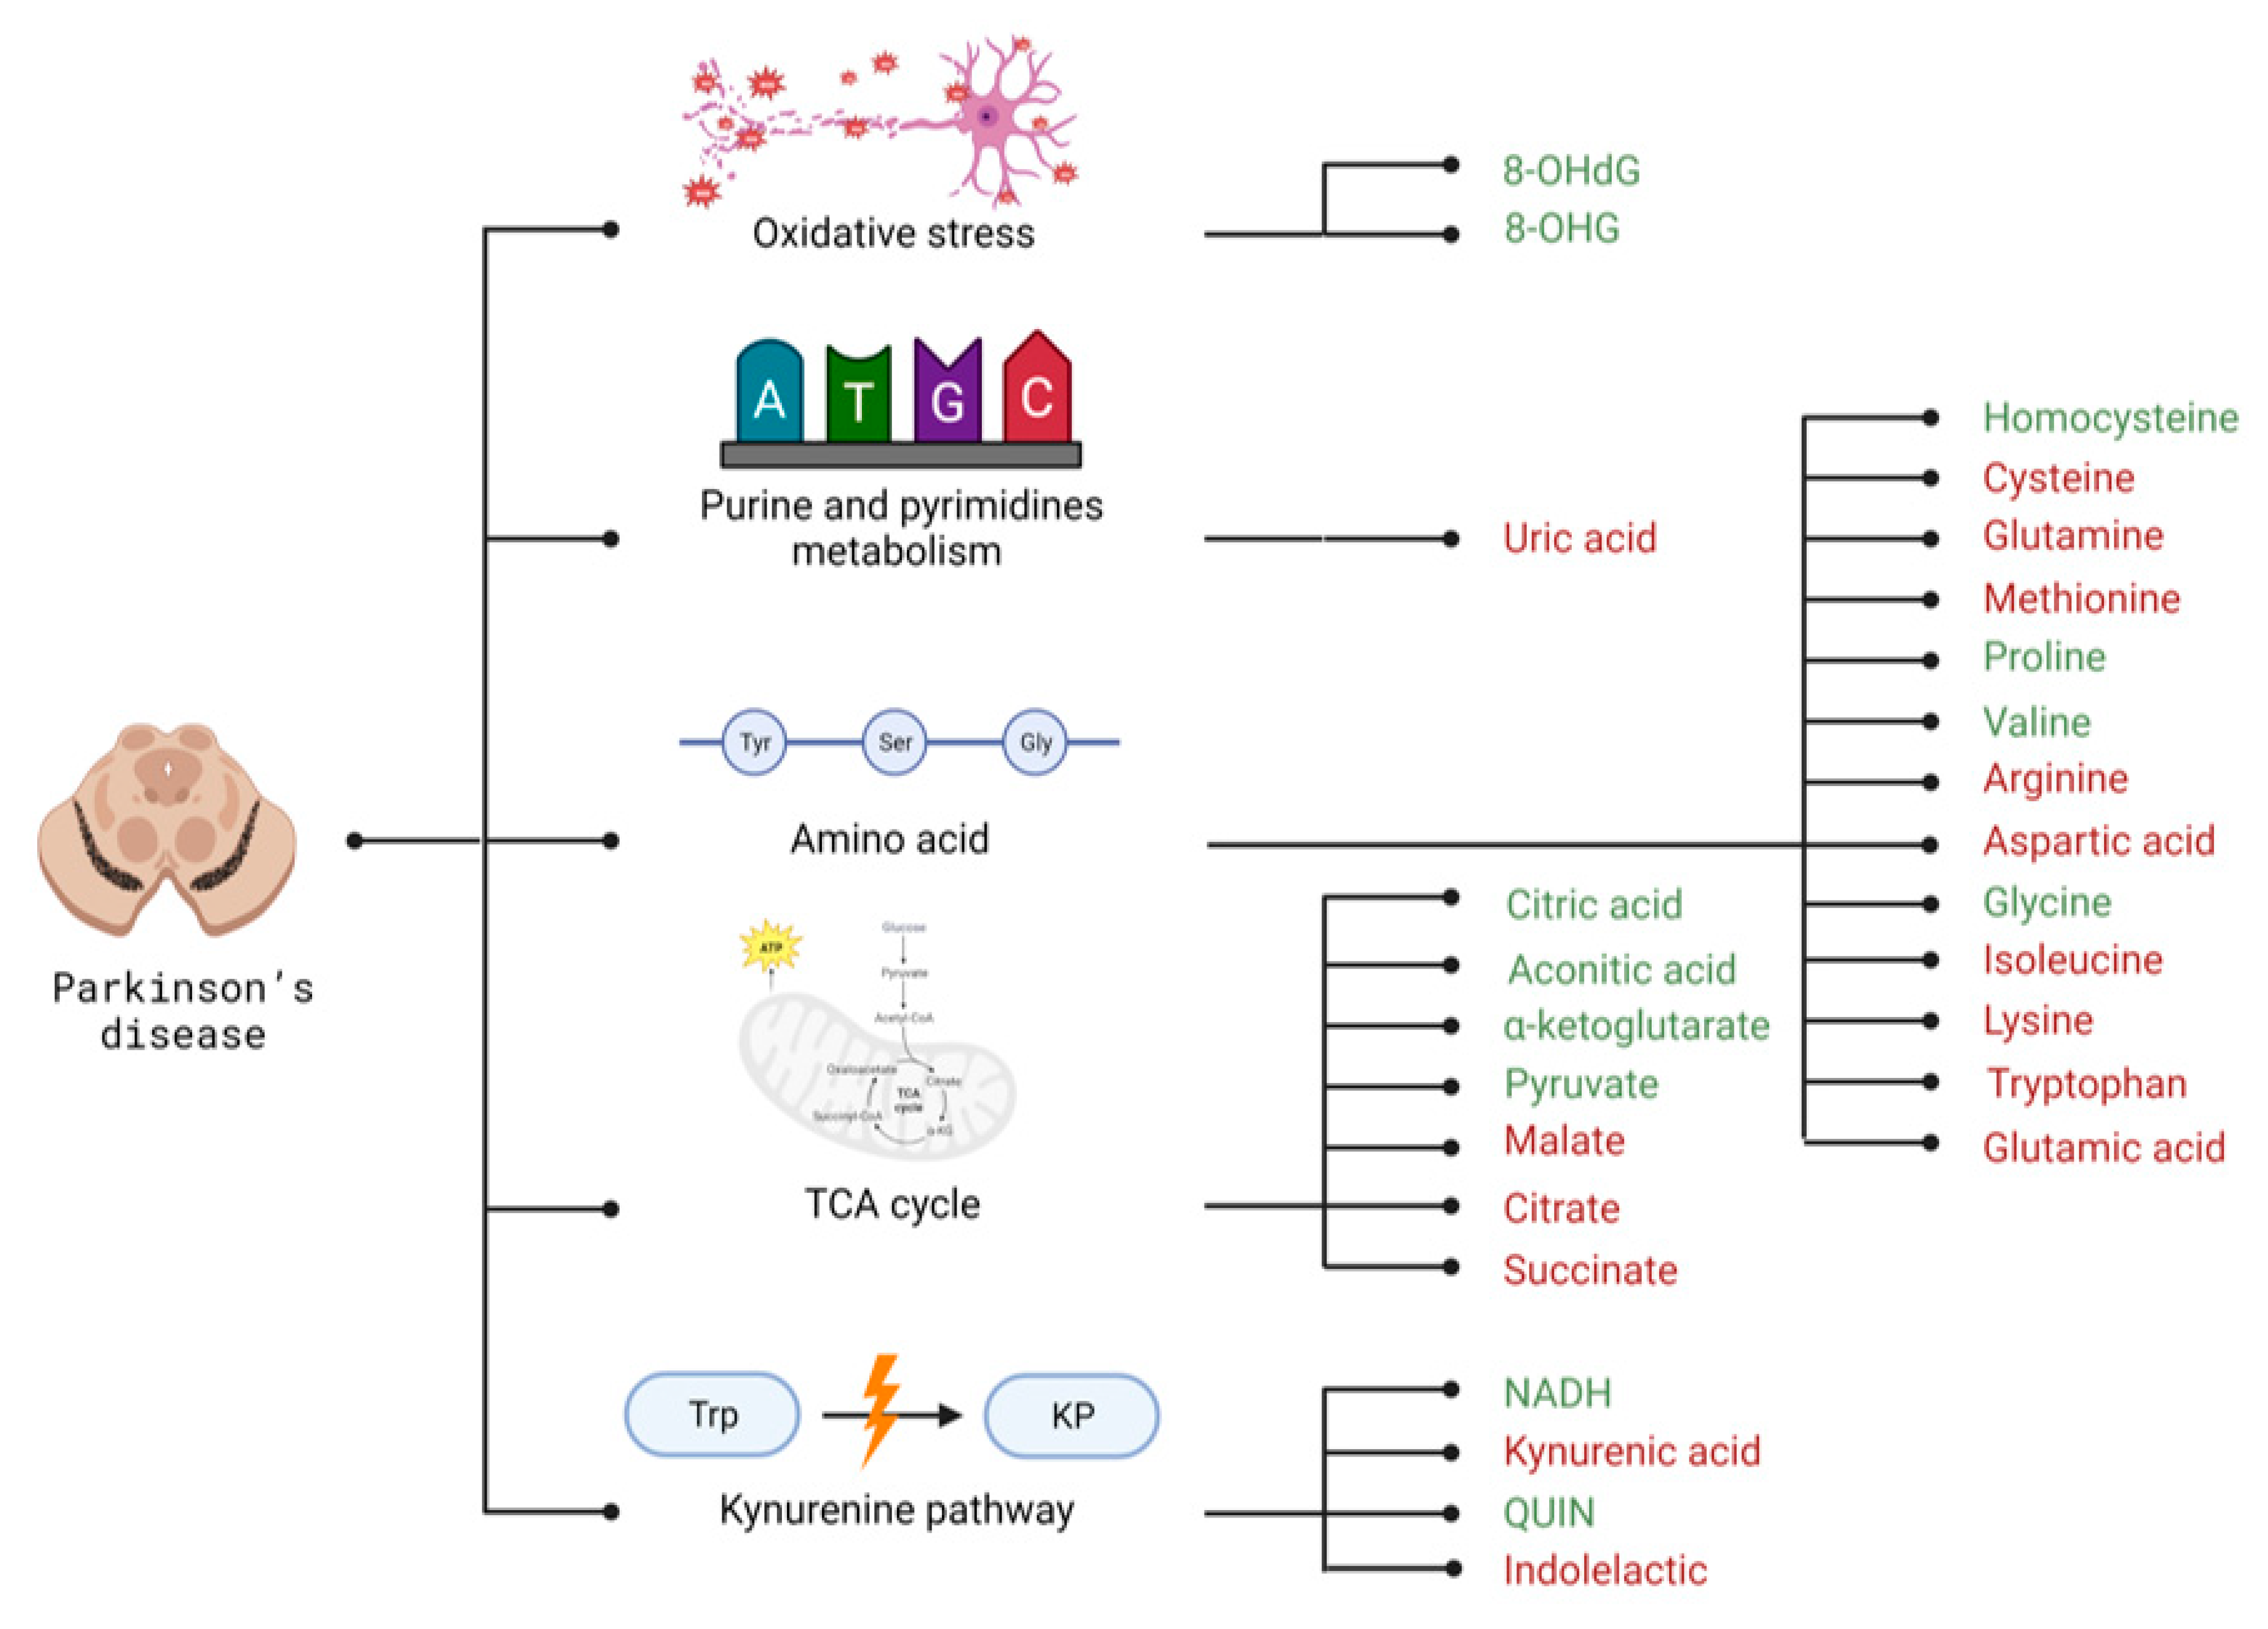
3.2. Selected Candidates for Biomarkers Related to Disrupted Energy Metabolism Pathways and Intracellular Homeostasis Imbalance
4. Huntington’s Disease
4.1. Disrupted Energy Metabolism in HD-Affected Brain
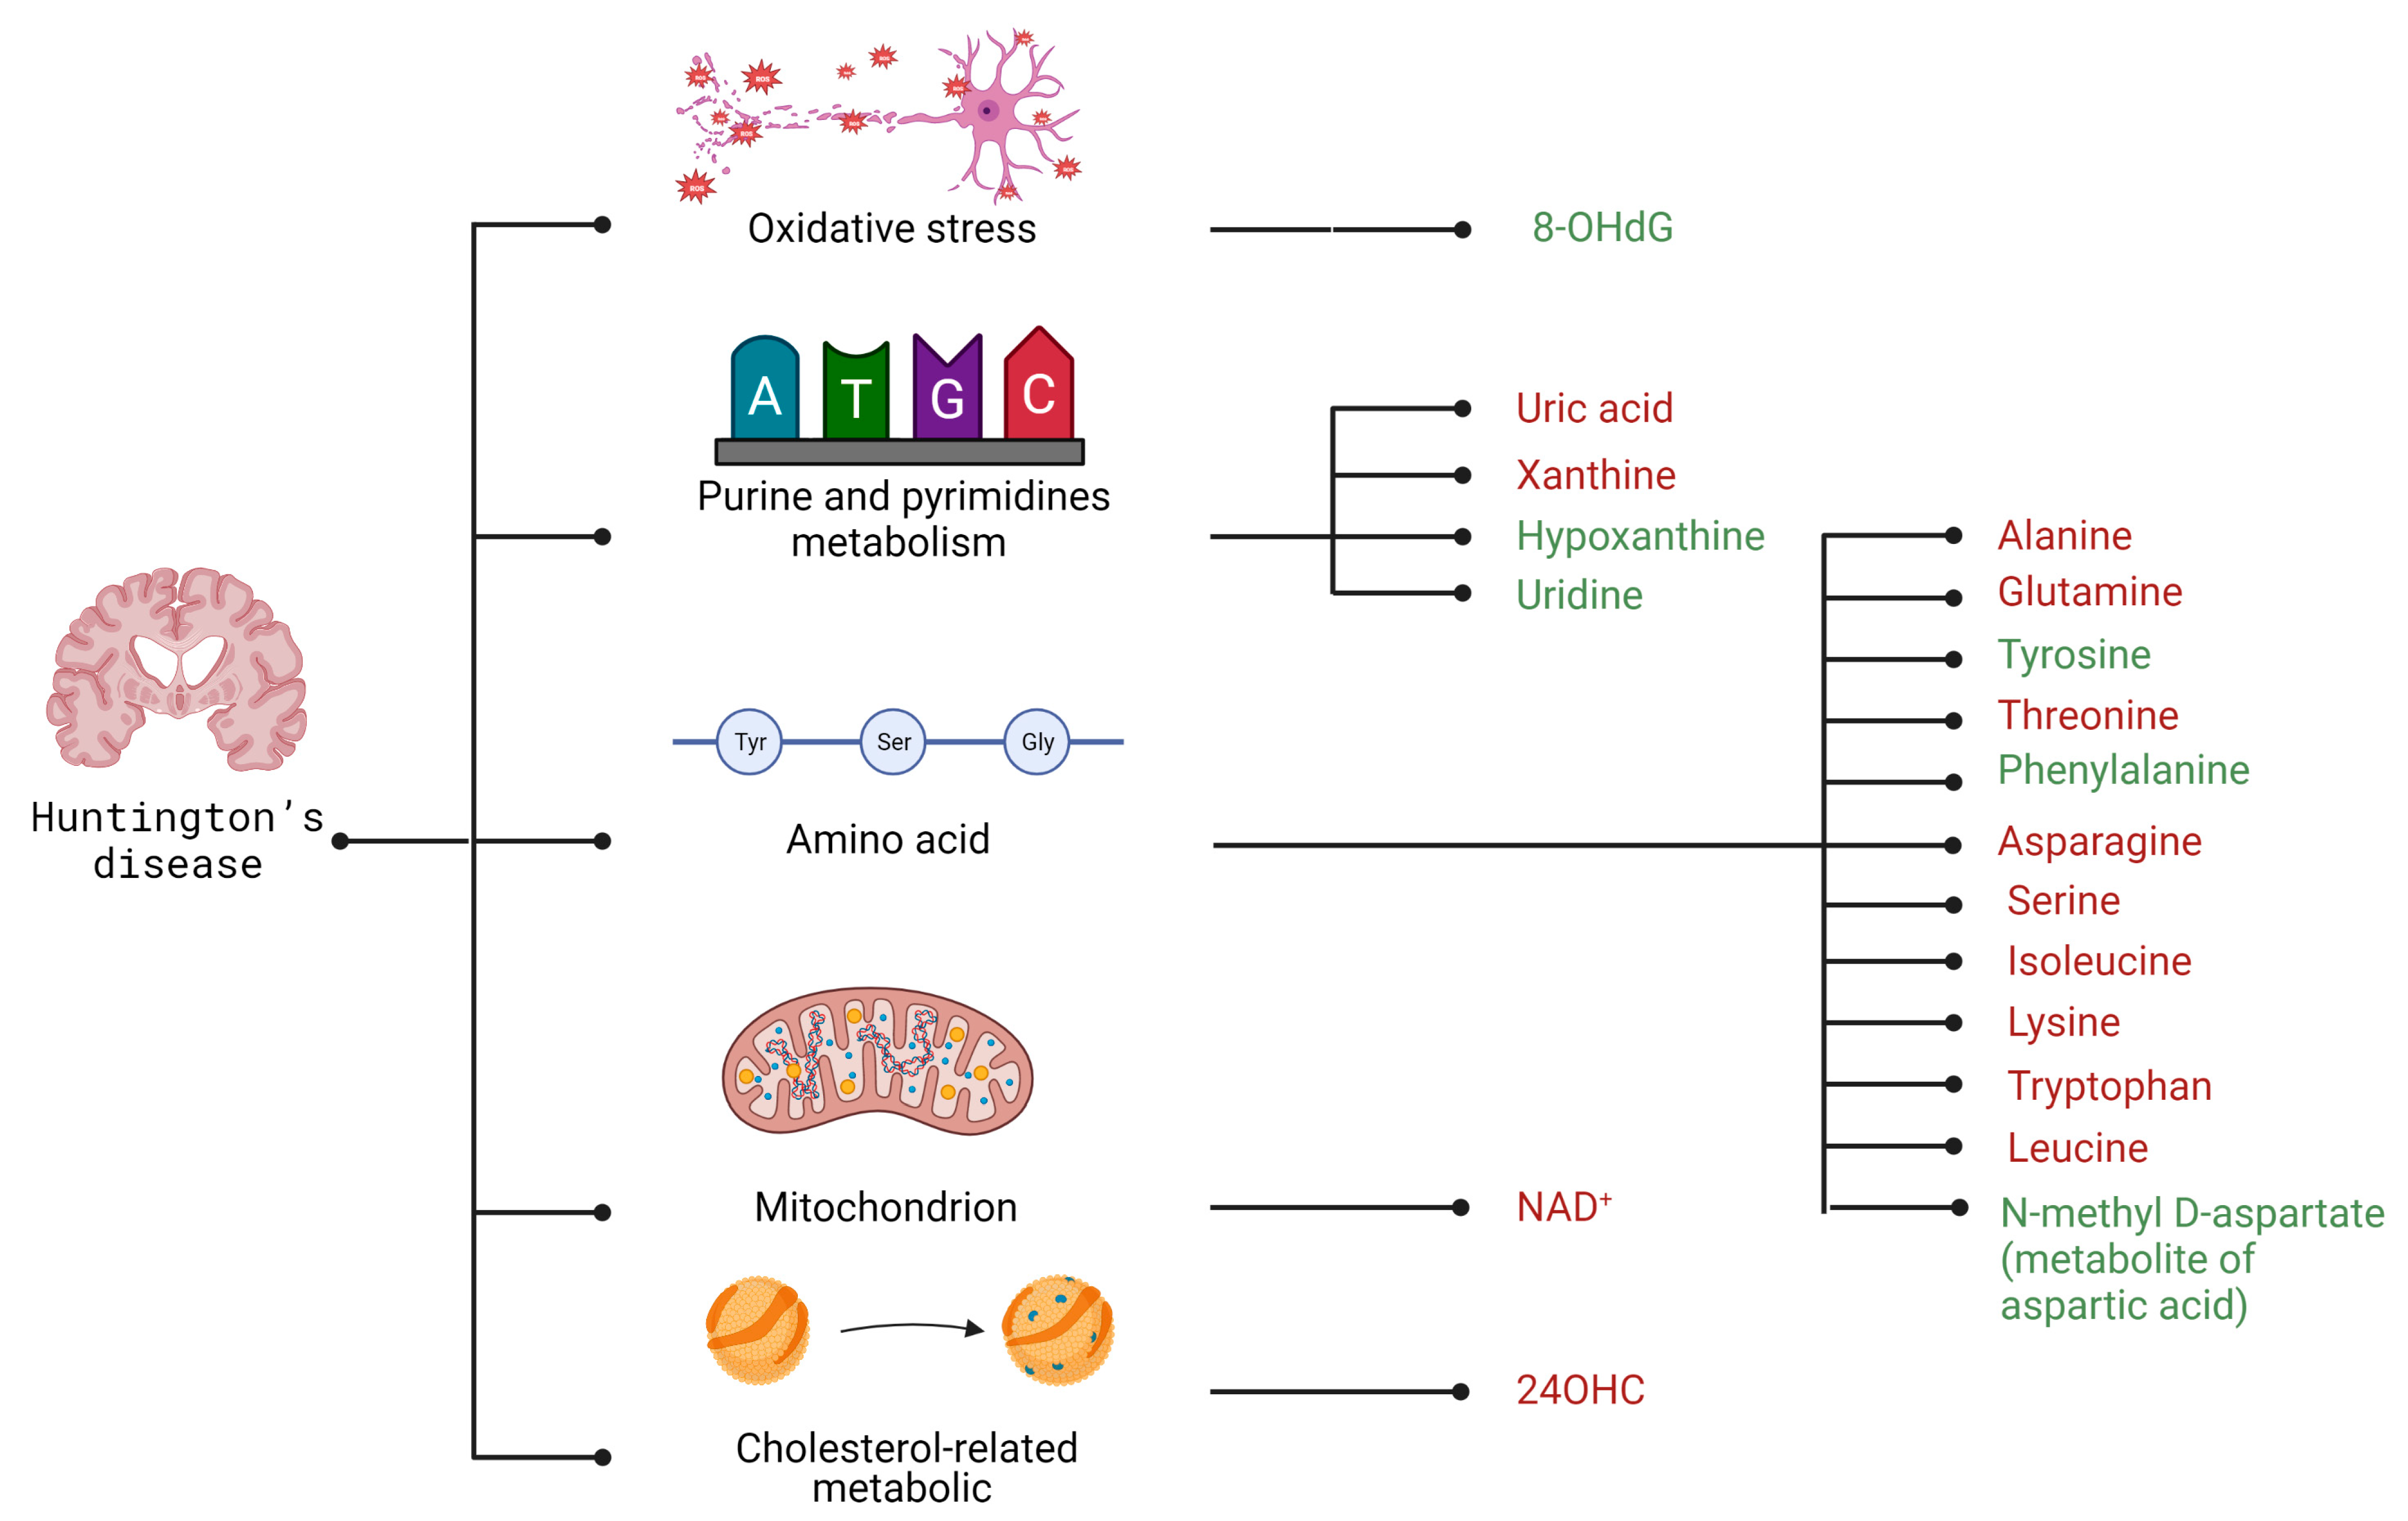
4.2. Selected Candidates for Biomarkers Related to Disrupted Energy Metabolism Pathways and Intracellular Homeostasis Imbalance
5. Discussion

| Group of Metabolites | Compound | AD | PD | HD |
|---|---|---|---|---|
| Amino acids | Alanine | + [87] | x | - [204] |
| Arginine | x | - [146] | x | |
| Asparagine | - [88] | x | - [197] | |
| Aspartic acid | - [88] | - [87] | + [194,199] | |
| Cysteine | + [87] | - [87] | x | |
| Glutamic acid | x | - [87] | x | |
| Glutamine | + [87] | - [87] | - [203] | |
| Glycine | + | + [87] | x | |
| Histidine | - [87] | x | x | |
| Homocysteine | x | + [164] | x | |
| Isoleucine | - [99] | + [87] | - [43,67] | |
| Leucine | x | x | + [196] | |
| Lysine | - [88] | - [87] | - [196] | |
| Methionine | - [87] | - [87] | x | |
| Ornithine | - [88] | x | x | |
| Phenylalanine | - [88] | x | + [196] | |
| Proline | x | + [87] | x | |
| Serine | - [88] | x | - [197] | |
| Threonine | - [88] | x | - [196] | |
| Tryptophan | - [88] | - [87] | + [211] | |
| Tyrosine | - [88] | x | + [196] | |
| Valine | + [99] | + [87] | x | |
| β-alanine | + [87] | x | x | |
| Cholesterol-related metabolic | 24OHC | x | x | - [211] |
| Kynurenine pathway | 3-HK | + [102] | x | x |
| Indolelactic | x | - [160] | x | |
| Kynurenic acid | x | - [155] | x | |
| QUIN | + [102] | + [155] | x | |
| Mitochondrion | NAD+ | x | x | - [214] |
| NADH | x | + [158] | x | |
| Oxidative stress | 8-OHdG | + [106] | + [169] | + [211] |
| 8-OHG | + [106] | + [169] | x | |
| 3-NT | + [105] | x | x | |
| Purine and pyrimidines metabolism | Adenosine | + [87] | x | x |
| Hypoxanthine | x | x | + [216] | |
| Uracil | - [88] | x | x | |
| Uric acid | - [87] | - [87] | - [218] | |
| Uridine | - [87] | x | + [216] | |
| Xanthine | + [87] | x | - [218] | |
| TCA cycle | Aconitic acid | + [101] | + [167] | x |
| Citrate | x | - [87] | x | |
| Citric acid | x | + [148] | x | |
| Isocitrate | + [87] | x | x | |
| Malate | - [89] | - [87] | x | |
| Pyruvate | x | + [87] | x | |
| Succinate | x | - [87] | x | |
| Succinic acid | + [101] | x | x | |
| α-ketoglutarate | + [87] | + [167] | x | |
| Other | Nicotinamide | - [100] | x | x |
6. Conclusions
Author Contributions
Funding
Conflicts of Interest
Abbreviations
| 24OHC | 24(S) hydroxy cholesterol |
| 3-HK | 3-hydroxyquinurenine |
| 3-NT | 3-Nitrotyrosine |
| 8-OHdG | 8-hydroxy-2′-deoxyguanosine |
| 8-OHG | 8-hydroxyguanosine |
| AcAc | acetoacetate |
| AcAc-Co-A | acetoacetyl-CoA |
| ACAT | acyl-CoA: cholesterol acetyltransferase |
| AD | Alzheimer’s disease |
| ADNI | Alzheimer’s Disease Neuroimaging Initiative |
| ALT | alanine aminotransferase |
| AMPK | adenosine monophosphate-activated protein kinase |
| ApoE | apolipoprotein E |
| APP | amyloid precursor protein |
| ASN | alpha-synuclein proteins |
| ATP | adenosine triphosphate |
| Aβ | beta-amyloid peptide |
| AβPP | beta-amyloid precurso peptide |
| BBB | blood–brain barier |
| BCAA | branch-chained amino acid |
| BHB | beta-hydroxybutyrate |
| BHD | betahydroxybutyrate dehydrogenase |
| cADPR | cyclic ADP-Ribose |
| cBCAT | cytosolic branched-chain aminotransferase |
| CNS | central nervous system |
| COX | cytochrome oxidase |
| CSF | cerebro-spinal fluid |
| DBS | deep brain stimulationz |
| Drp1 | dynamin-related protein 1 |
| ETC | electron transport chain |
| FDG-PET | fluorodeoxyglucose-PET |
| FFA | fatty acid |
| Fis1 | mitochondrial fission 1 protein |
| fructose-2,6-P2 | fructose-2,6-bisphosphate |
| G3PDH | glyceraldehyde-3-phosphate dehydrogenase |
| GABARAPL1 | γ-aminobutyric acid receptor-associated protein-like 1 |
| GDH | glutamine dehydrogenase |
| GLUT1 | neuronal glucose transporter 1 |
| GLUT3 | neuronal glucose transporter 3 |
| GP | glycogen phosphorylase |
| GS | glutamine synthase |
| GS | glycogen synthase |
| GSK-3 | GS kinase-3 |
| HD | Huntington’s disease |
| Htt | huntingtin protein |
| IDH | isocitrate dehydrogenase |
| IDO | indoleamine 2,3-dioxygenase |
| IIS | inhibition of the insulin |
| IR | insulin receptor |
| KB | ketone bodIES |
| KP | kynurenine pathway |
| LB | Lewy bodies |
| LDH | lactate dehydrogenase |
| LNAA | large neutral amino acid |
| MAP | microtubule-associated protein |
| mBCAT | mitochondrial branched-chain aminotransferase |
| MCT | monocarboxylate transporter |
| MHC | tissue compatibility system |
| mHtt | mutant huntingtin protein |
| MPTP | 1-metylo-4-fenylo-1,2,3,6-tetrahydropirydyny |
| MRI | magnetic resonance imaging |
| MRS | magnetic resonance spectroscopy |
| NAA | N-acetyl aspartate |
| NAD+ | nicotinamide adenine dinucleotide |
| NDs | neurodegenerative diseases |
| NFT | neurofibrillary tangle |
| NMDA | N-methyl-D-aspartic acid |
| PD | Parkinson’s disease |
| PDH | pyruvate dehydrogenase |
| PDHC | pyruvate dehydrogenase complex |
| PFK | phosphofructokinase-1 |
| Pfkfb3 | 6-phosphofructose-2-kinase/fructose-2,6-bisphosphatase-3 |
| PiB-PET | Amyloid Pittsburgh compound B-PET |
| PINK1 | PTEN-induced kinase 1 |
| poly Q | glutamine I polyglutamine |
| PP-1 | protein phosphatase-1 |
| PPP | pentose–phosphate pathway |
| PSEN-1 | presenilin-1 |
| PSEN-2 | presenilin-2 |
| PTG | protein targeting to glycogen |
| QUIN | quinolinic acid |
| ROS | reactive oxygen species |
| SCOT | succinyl-CoA:3-ketoacid coenzyme A transferase |
| SN | substantia nigra |
| SNpc | substantia nigra pars compacta |
| SSRI | includes selective serotonin reuptake inhibitor |
| STBD1 | starch-binding domain-containing protein 1 |
| TCA | tricarboxylic acid cycle |
| TNF-α | tumor necrosis factor-alpha |
| UA | uric acid |
| UPS | ubiquitin–proteasome system |
| α-KG | α-ketoglutarate |
| α-KGDH | α-ketoglutarate dehydrogenase |
| α-KIC | α-ketoisocaproate |
References
- Ruggiero, M.; Calvello, R.; Porro, C.; Messina, G.; Cianciulli, A.; Panaro, M.A. Neurodegenerative Diseases: Can Caffeine Be a Powerful Ally to Weaken Neuroinflammation. Int. J. Mol. Sci. 2022, 23, 12958. [Google Scholar] [CrossRef] [PubMed]
- Burré, J.; Sharma, M.; Südhof, T.C. Cell Biology and Pathophysiology of α-Synuclein. Cold Spring Harb. Perspect. Med. 2017, 8, a024091. [Google Scholar] [CrossRef] [PubMed]
- Davis, A.A.; Leyns, C.E.; Holtzman, D.M. Intercellular Spread of Protein Aggregates in Neurodegenerative Disease. Annu. Rev. Cell Dev. Biol. 2018, 34, 545–568. [Google Scholar] [CrossRef] [PubMed]
- Dorsey, E.R.; Sherer, T.; Okun, M.S.; Bloem, B.R. The Emerging Evidence of the Parkinson Pandemic. J. Park. Dis. 2018, 8, S3–S8. [Google Scholar] [CrossRef] [Green Version]
- Morovic, S.; Budincevic, H.; Govori, V.; Demarin, V. Possibilities of Dementia Prevention—It is Never Too Early to Start. J. Med. Life 2020, 12, 332–337. [Google Scholar] [CrossRef]
- Alle, H.; Roth, A.; Geiger, J.R.P. Energy-Efficient Action Potentials in Hippocampal Mossy Fibers. Science 2009, 325, 1405–1408. [Google Scholar] [CrossRef] [Green Version]
- Steiner, P. Brain Fuel Utilization in the Developing Brain. Ann. Nutr. Metab. 2019, 75, 8–18. [Google Scholar] [CrossRef]
- Bélanger, M.; Allaman, I.; Magistretti, P.J. Brain Energy Metabolism: Focus on Astrocyte-Neuron Metabolic Cooperation. Cell Metab. 2011, 14, 724–738. [Google Scholar] [CrossRef] [Green Version]
- Zielke, H.R.; Zielke, C.L.; Baab, P.J. Direct measurement of oxidative metabolism in the living brain by microdialysis: A review. J. Neurochem. 2009, 109, 24–29. [Google Scholar] [CrossRef] [Green Version]
- Xiong, X.-Y.; Tang, Y.; Yang, Q.-W. Metabolic changes favor the activity and heterogeneity of reactive astrocytes. Trends Endocrinol. Metab. 2022, 33, 390–400. [Google Scholar] [CrossRef]
- Boumezbeur, F.; Mason, G.F.; de Graaf, R.A.; Behar, K.L.; Cline, G.W.; Shulman, G.I.; Rothman, D.L.; Petersen, K.F. Altered Brain Mitochondrial Metabolism in Healthy Aging as Assessed by in vivo Magnetic Resonance Spectroscopy. J. Cereb. Blood Flow Metab. 2009, 30, 211–221. [Google Scholar] [CrossRef] [PubMed] [Green Version]
- Lee, K.H.; Cha, M.; Lee, B.H. Crosstalk between Neuron and Glial Cells in Oxidative Injury and Neuroprotection. Int. J. Mol. Sci. 2021, 22, 13315. [Google Scholar] [CrossRef] [PubMed]
- Boumezbeur, F.; Petersen, K.F.; Cline, G.W.; Mason, G.F.; Behar, K.; Shulman, G.; Rothman, D.L. The Contribution of Blood Lactate to Brain Energy Metabolism in Humans Measured by Dynamic 13C Nuclear Magnetic Resonance Spectroscopy. J. Neurosci. 2010, 30, 13983–13991. [Google Scholar] [CrossRef] [PubMed] [Green Version]
- Díaz-García, C.M.; Yellen, G. Neurons rely on glucose rather than astrocytic lactate during stimulation. J. Neurosci. Res. 2018, 97, 883–889. [Google Scholar] [CrossRef] [Green Version]
- Herrero-Mendez, A.; Almeida, A.; Fernández, E.; Maestre, C.; Bolaños, S.M.J.P. The Bioenergetic and Antioxidant Status of Neurons Is Controlled by Continuous Degradation of a Key Glycolytic Enzyme by APC/C-Cdh1. Nat. Cell Biol. 2009, 11, 747–752. [Google Scholar] [CrossRef] [PubMed]
- Pappas, G.; Wilkinson, M.L.; Gow, A.J. Nitric oxide regulation of cellular metabolism: Adaptive tuning of cellular energy. Nitric Oxide 2023, 131, 8–17. [Google Scholar] [CrossRef]
- Itoh, Y.; Esaki, T.; Shimoji, K.; Cook, M.; Law, M.J.; Kaufman, E.; Sokoloff, L. Dichloroacetate effects on glucose and lactate oxidation by neurons and astroglia in vitro and on glucose utilization by brain in vivo. Proc. Natl. Acad. Sci. USA 2003, 100, 4879–4884. [Google Scholar] [CrossRef] [PubMed] [Green Version]
- Bittner, C.X.; Loaiza, A.; Ruminot, I.; Larenas, V.; Sotelo-Hitschfeld, T.; Gutierrez, R.; Cordova, A.; Valdebenito, R.; Frommer, W.B.; Barros, L.F. High resolution measurement of the glycolytic rate. Front. Neuroenerget. 2010, 2. [Google Scholar] [CrossRef] [PubMed] [Green Version]
- Llorente-Folch, I.; Rueda, C.; Amigo, I.; del Arco, A.; Saheki, T.; Pardo, B.; Satrústegui, J. Calcium-Regulation of Mitochondrial Respiration Maintains ATP Homeostasis and Requires ARALAR/AGC1-Malate Aspartate Shuttle in Intact Cortical Neurons. J. Neurosci. 2013, 33, 13957–13971. [Google Scholar] [CrossRef] [PubMed]
- Halim, N.D.; Mcfate, T.; Mohyeldin, A.; Okagaki, P.; Korotchkina, L.G.; Patel, M.S.; Jeoung, N.H.; Harris, R.A.; Schell, M.J.; Verma, A. Phosphorylation status of pyruvate dehydrogenase distinguishes metabolic phenotypes of cultured rat brain astrocytes and neurons. Glia 2010, 58, 1168–1176. [Google Scholar] [CrossRef] [PubMed] [Green Version]
- Berkich, D.A.; Ola, M.S.; Cole, J.; Sweatt, A.J.; Hutson, S.M.; LaNoue, K.F. Mitochondrial Transport Proteins of the Brain. J. Neurosci. Res. 2007, 85, 3367–3377. [Google Scholar] [CrossRef] [PubMed]
- Kato, T.; Inui, Y.; Nakamura, A.; Ito, K. Brain fluorodeoxyglucose (FDG) PET in dementia. Ageing Res. Rev. 2016, 30, 73–84. [Google Scholar] [CrossRef]
- Zaragozá, R. Transport of Amino Acids Across the Blood-Brain Barrier. Front. Physiol. 2020, 11, 973. [Google Scholar] [CrossRef]
- Neinast, M.; Murashige, D.; Arany, Z. Branched Chain Amino Acids. Annu. Rev. Physiol. 2019, 81, 139–164. [Google Scholar] [CrossRef] [PubMed]
- Siddik, A.B.; Mullins, C.A.; Kramer, A.; Shah, H.; Gannaban, R.B.; Zabet-Moghaddam, M.; Huebinger, R.M.; Hegde, V.K.; MohanKumar, S.M.J.; MohanKumar, P.S.; et al. Branched-Chain Amino Acids Are Linked with Alzheimer’s Disease-Related Pathology and Cognitive Deficits. Cells 2022, 11, 3523. [Google Scholar] [CrossRef]
- Cunnane, S.C.; Courchesne-Loyer, A.; Vandenberghe, C.; St-Pierre, V.; Fortier, M.; Hennebelle, M.; Croteau, E.; Bocti, C.; Fulop, T.; Castellano, C.-A. Can Ketones Help Rescue Brain Fuel Supply in Later Life? Implications for Cognitive Health during Aging and the Treatment of Alzheimer’s Disease. Front. Mol. Neurosci. 2016, 9, 53. [Google Scholar] [CrossRef] [PubMed] [Green Version]
- Pierre, K.; Pellerin, L. Monocarboxylate transporters in the central nervous system: Distribution, regulation and function. J. Neurochem. 2005, 94, 1–14. [Google Scholar] [CrossRef]
- Achanta, L.B.; Rae, C.D. β-Hydroxybutyrate in the Brain: One Molecule, Multiple Mechanisms. Neurochem. Res. 2016, 42, 35–49. [Google Scholar] [CrossRef] [PubMed]
- Jensen, N.; Wodschow, H.; Nilsson, M.; Rungby, J. Effects of Ketone Bodies on Brain Metabolism and Function in Neurodegenerative Diseases. Int. J. Mol. Sci. 2020, 21, 8767. [Google Scholar] [CrossRef] [PubMed]
- Puchalska, P.; Crawford, P.A. Multi-dimensional Roles of Ketone Bodies in Fuel Metabolism, Signaling, and Therapeutics. Cell Metab. 2017, 25, 262–284. [Google Scholar] [CrossRef] [Green Version]
- Cunnane, S.C.; Trushina, E.; Morland, C.; Prigione, A.; Casadesus, G.; Andrews, Z.B.; Beal, M.F.; Bergersen, L.H.; Brinton, R.D.; de la Monte, S.; et al. Brain energy rescue: An emerging therapeutic concept for neurodegenerative disorders of ageing. Nat. Rev. Drug Discov. 2020, 19, 609–633. [Google Scholar] [CrossRef] [PubMed]
- Fan, Z.; Zhang, Z.; Zhao, S.; Zhu, Y.; Guo, D.; Yang, B.; Zhuo, L.; Han, J.; Wang, R.; Fang, Z.; et al. Dynamic Variations in Brain Glycogen are Involved in Modulating Isoflurane Anesthesia in Mice. Neurosci. Bull. 2020, 36, 1513–1523. [Google Scholar] [CrossRef]
- Zhang, S.; Lachance, B.B.; Mattson, M.P.; Jia, X. Glucose metabolic crosstalk and regulation in brain function and diseases. Prog. Neurobiol. 2021, 204, 102089. [Google Scholar] [CrossRef] [PubMed]
- DiNuzzo, M. How glycogen sustains brain function: A plausible allosteric signaling pathway mediated by glucose phosphates. J. Cereb. Blood Flow Metab. 2019, 39, 1452–1459. [Google Scholar] [CrossRef] [PubMed]
- Coggan, J.S.; Keller, D.; Calì, C.; Lehväslaiho, H.; Markram, H.; Schürmann, F.; Magistretti, P.J. Norepinephrine stimulates glycogenolysis in astrocytes to fuel neurons with lactate. PLoS Comput. Biol. 2018, 14, e1006392. [Google Scholar] [CrossRef] [Green Version]
- Sun, R.C.; Young, L.E.; Bruntz, R.C.; Markussen, K.H.; Zhou, Z.; Conroy, L.R.; Hawkinson, T.R.; Clarke, H.A.; Stanback, A.E.; Macedo, J.K.; et al. Brain glycogen serves as a critical glucosamine cache required for protein glycosylation. Cell Metab. 2021, 33, 1404–1417.e9. [Google Scholar] [CrossRef]
- Aman, Y.; Schmauck-Medina, T.; Hansen, M.; Morimoto, R.I.; Simon, A.K.; Bjedov, I.; Palikaras, K.; Simonsen, A.; Johansen, T.; Tavernarakis, N.; et al. Autophagy in healthy aging and disease. Nat. Aging 2021, 1, 634–650. [Google Scholar] [CrossRef]
- Zhao, H.; Tang, M.; Liu, M.; Chen, L. Glycophagy: An emerging target in pathology. Clin. Chim. Acta 2018, 484, 298–303. [Google Scholar] [CrossRef]
- Ebert, D.; Haller, R.G.; Walton, M.E. Energy Contribution of Octanoate to Intact Rat Brain Metabolism Measured by 13C Nuclear Magnetic Resonance Spectroscopy. J. Neurosci. 2003, 23, 5928–5935. [Google Scholar] [CrossRef] [Green Version]
- Romano, A.; Koczwara, J.B.; Gallelli, C.A.; Vergara, D.; di Bonaventura, M.V.M.; Gaetani, S.; Giudetti, A.M. Fats for thoughts: An update on brain fatty acid metabolism. Int. J. Biochem. Cell Biol. 2017, 84, 40–45. [Google Scholar] [CrossRef]
- Ioannou, M.S.; Jackson, J.; Sheu, S.-H.; Chang, C.-L.; Weigel, A.V.; Liu, H.; Pasolli, H.A.; Xu, C.S.; Pang, S.; Matthies, D.; et al. Neuron-Astrocyte Metabolic Coupling Protects against Activity-Induced Fatty Acid Toxicity. Cell 2019, 177, 1522–1535.e14. [Google Scholar] [CrossRef]
- Tomczyk, M.; Glaser, T.; Slominska, E.; Ulrich, H.; Smolenski, R. Purine Nucleotides Metabolism and Signaling in Huntington’s Disease: Search for a Target for Novel Therapies. Int. J. Mol. Sci. 2021, 22, 6545. [Google Scholar] [CrossRef]
- Mochel, F.; Charles, P.; Seguin, F.; Barritault, J.; Coussieu, C.; Perin, L.; Le Bouc, Y.; Gervais, C.; Carcelain, G.; Vassault, A.; et al. Early Energy Deficit in Huntington Disease: Identification of a Plasma Biomarker Traceable during Disease Progression. PLoS ONE 2007, 2, e647. [Google Scholar] [CrossRef]
- Sperringer, J.E.; Addington, A.; Hutson, S.M. Branched-Chain Amino Acids and Brain Metabolism. Neurochem. Res. 2017, 42, 1697–1709. [Google Scholar] [CrossRef] [PubMed]
- Benarroch, E.E. Glycogen metabolism. Neurology 2010, 74, 919–923. [Google Scholar] [CrossRef] [PubMed]
- Bertoux, M.; Cassagnaud, P.; Lebouvier, T.; Sarazin, M.; Le Ber, I.; Dubois, B.; Duyckaerts, C.; Auriacombe, S.; Hannequin, D.; Ceccaldi, M.; et al. P4-358: Diagnostic value of the amnestic syndrome for alzheimer’s disease: A clinicopathological study. Alzheimer’s Dement. 2019, 15, P1436. [Google Scholar] [CrossRef]
- Andersen, E.; Casteigne, B.; Chapman, W.D.; Creed, A.; Foster, F.; Lapins, A.; Shatz, R.; Sawyer, R.P. Diagnostic biomarkers in Alzheimer’s disease. Biomark. Neuropsychiatry 2021, 5, 100041. [Google Scholar] [CrossRef]
- Mroczek, M.; Clark, C.; Dayon, L.; Bowman, G.L.; Popp, J. Cerebrospinal Fluid Proteome Alterations Associated with Neuropsychiatric Symptoms in Cognitive Decline and Alzheimer’s Disease. Cells 2022, 11, 1030. [Google Scholar] [CrossRef]
- Mölsä, P.K.; Marttila, R.J.; Rinne, U.K. Long-term survival and predictors of mortality in Alzheimer’s disease and multi-infarct dementia. Acta Neurol. Scand. 2009, 91, 159–164. [Google Scholar] [CrossRef]
- Moon, S.; Park, H.J.; Sohn, M. The impact of long-term care service on total lifetime medical expenditure among older adults with dementia. Soc. Sci. Med. 2021, 280, 114072. [Google Scholar] [CrossRef] [PubMed]
- Picone, P.; Nuzzo, D.; Giacomazza, D.; di Carlo, M. β-Amyloid Peptide: The Cell Compartment Multi-faceted Interaction in Alzheimer’s Disease. Neurotox. Res. 2019, 37, 250–263. [Google Scholar] [CrossRef]
- Luu, L.; Ciccotosto, G.D.; Cappai, R. The Alzheimer’s Disease Amyloid Precursor Protein and its Neuritogenic Actions. Curr. Alzheimer Res. 2021, 18, 772–786. [Google Scholar] [CrossRef] [PubMed]
- Zhou, K.; Liu, Z.; He, W.; Cai, J.; Hu, L. Application of 3D Whole-Brain Texture Analysis and the Feature Selection Method Based on within-Class Scatter in the Classification and Diagnosis of Alzheimer’s Disease. Ther. Innov. Regul. Sci. 2022, 56, 561–571. [Google Scholar] [CrossRef] [PubMed]
- Tan, J.Z.A.; Gleeson, P.A. The role of membrane trafficking in the processing of amyloid precursor protein and production of amyloid peptides in Alzheimer’s disease. Biochim. Biophys. Acta (BBA)-Biomembr. 2019, 1861, 697–712. [Google Scholar] [CrossRef] [PubMed]
- Hernández, F.; Avila, J. Tauopathies. Cell. Mol. Life Sci. 2007, 64, 2219–2233. [Google Scholar] [CrossRef] [PubMed]
- Ferrer, I.; Andrés-Benito, P.; Ausín, K.; Pamplona, R.; Rio, J.A.; Fernández-Irigoyen, J.; Santamaría, E. Dysregulated protein phosphorylation: A determining condition in the continuum of brain aging and Alzheimer’s disease. Brain Pathol. 2021, 31, e12996. [Google Scholar] [CrossRef]
- Chandra, A.; Valkimadi, P.E.; Pagano, G.; Cousins, O.; Dervenoulas, G.; Politis, M.; Initiative, F.T.A.D.N. Applications of amyloid, tau, and neuroinflammation PET imaging to Alzheimer’s disease and mild cognitive impairment. Hum. Brain Mapp. 2019, 40, 5424–5442. [Google Scholar] [CrossRef] [Green Version]
- Viswanathan, A.; Greenberg, S.M. Cerebral amyloid angiopathy in the elderly. Ann. Neurol. 2011, 70, 871–880. [Google Scholar] [CrossRef] [Green Version]
- Klosinski, L.P.; Yao, J.; Yin, F.; Fonteh, A.N.; Harrington, M.G.; Christensen, T.A.; Trushina, E.; Brinton, R.D. White Matter Lipids as a Ketogenic Fuel Supply in Aging Female Brain: Implications for Alzheimer’s Disease. EBioMedicine 2015, 2, 1888–1904. [Google Scholar] [CrossRef] [Green Version]
- Blanchard, J.W.; Akay, L.A.; Davila-Velderrain, J.; von Maydell, D.; Mathys, H.; Davidson, S.M.; Effenberger, A.; Chen, C.-Y.; Maner-Smith, K.; Hajjar, I.; et al. APOE4 impairs myelination via cholesterol dysregulation in oligodendrocytes. Nature 2022, 611, 769–779. [Google Scholar] [CrossRef]
- Yamazaki, Y.; Zhao, N.; Caulfield, T.R.; Liu, C.-C.; Bu, G. Apolipoprotein E and Alzheimer disease: Pathobiology and targeting strategies. Nat. Rev. Neurol. 2019, 15, 501–518. [Google Scholar] [CrossRef] [PubMed]
- Scheltens, P.; de Strooper, B.; Kivipelto, M.; Holstege, H.; Chételat, G.; Teunissen, C.E.; Cummings, J.; van der Flier, W.M. Alzheimer’s disease. Lancet 2021, 397, 1577–1590. [Google Scholar] [CrossRef]
- Litke, R.; Garcharna, L.C.; Jiwani, S.; Neugroschl, J. Modifiable Risk Factors in Alzheimer Disease and Related Dementias: A Review. Clin. Ther. 2021, 43, 953–965. [Google Scholar] [CrossRef] [PubMed]
- Mumtaz, S.; Rana, J.N.; Choi, E.H.; Han, I. Microwave Radiation and the Brain: Mechanisms, Current Status, and Future Prospects. Int. J. Mol. Sci. 2022, 23, 9288. [Google Scholar] [CrossRef]
- Porsteinsson, A.P.; Isaacson, R.S.; Knox, S.; Sabbagh, M.N.; Rubino, I. Diagnosis of Early Alzheimer’s Disease: Clinical Practice in 2021. J. Prev. Alzheimer’s Dis. 2021, 8, 1–16. [Google Scholar] [CrossRef]
- Bjerke, M.; Engelborghs, S. Cerebrospinal Fluid Biomarkers for Early and Differential Alzheimer’s Disease Diagnosis. J. Alzheimer’s Dis. 2018, 62, 1199–1209. [Google Scholar] [CrossRef] [PubMed] [Green Version]
- Breijyeh, Z.; Karaman, R. Comprehensive Review on Alzheimer’s Disease: Causes and Treatment. Molecules 2020, 25, 5789. [Google Scholar] [CrossRef]
- Small, G.W.; Kepe, V.; Barrio, J.R. Seeing is believing: Neuroimaging adds to our understanding of cerebral pathology. Curr. Opin. Psychiatry 2006, 19, 564–569. [Google Scholar] [CrossRef] [PubMed]
- Duan, W.; Zhou, G.D.; Balachandrasekaran, A.; Bhumkar, A.B.; Boraste, P.B.; Becker, J.T.; Kuller, L.H.; Lopez, O.L.; Gach, H.M.; Dai, W. Cerebral Blood Flow Predicts Conversion of Mild Cognitive Impairment into Alzheimer’s Disease and Cognitive Decline: An Arterial Spin Labeling Follow-up Study. J. Alzheimer’s Dis. 2021, 82, 293–305. [Google Scholar] [CrossRef]
- Bateman, T.M. Advantages and disadvantages of PET and SPECT in a busy clinical practice. J. Nucl. Cardiol. 2012, 19, 3–11. [Google Scholar] [CrossRef]
- Ricci, M.; Cimini, A.; Chiaravalloti, A.; Filippi, L.; Schillaci, O. Positron Emission Tomography (PET) and Neuroimaging in the Personalized Approach to Neurodegenerative Causes of Dementia. Int. J. Mol. Sci. 2020, 21, 7481. [Google Scholar] [CrossRef] [PubMed]
- Cheng, Z.; Tseng, Y.; White, M.F. Insulin signaling meets mitochondria in metabolism. Trends Endocrinol. Metab. 2010, 21, 589–598. [Google Scholar] [CrossRef] [PubMed] [Green Version]
- Swerdlow, R.H. Mitochondria and Mitochondrial Cascades in Alzheimer’s Disease. J. Alzheimer’s Dis. 2018, 62, 1403–1416. [Google Scholar] [CrossRef] [PubMed] [Green Version]
- Wang, W.; Zhao, F.; Ma, X.; Perry, G.; Zhu, X. Mitochondria dysfunction in the pathogenesis of Alzheimer’s disease: Recent advances. Mol. Neurodegener. 2020, 15, 1–22. [Google Scholar] [CrossRef] [PubMed]
- Chen, X.; Yan, S. du Mitochondrial Aβ: A Potential Cause of Metabolic Dysfunction in Alzheimer’s Disease. IUBMB Life 2006, 58, 686–694. [Google Scholar] [CrossRef] [PubMed]
- Tang, J.X.; Thompson, K.; Taylor, R.W.; Oláhová, M. Mitochondrial OXPHOS Biogenesis: Co-Regulation of Protein Synthesis, Import, and Assembly Pathways. Int. J. Mol. Sci. 2020, 21, 3820. [Google Scholar] [CrossRef] [PubMed]
- Supnet, C.; Bezprozvanny, I. The dysregulation of intracellular calcium in Alzheimer disease. Cell Calcium 2010, 47, 183–189. [Google Scholar] [CrossRef] [Green Version]
- Simakova, O.; Arispe, N.J. The Cell-Selective Neurotoxicity of the Alzheimer’s Aβ Peptide Is Determined by Surface Phosphatidylserine and Cytosolic ATP Levels. Membrane Binding Is Required for Aβ Toxicity. J. Neurosci. 2007, 27, 13719–13729. [Google Scholar] [CrossRef] [Green Version]
- Godoy, J.; Rios, J.; Picón-Pagès, P.; Herrera-Fernández, V.; Swaby, B.; Crepin, G.; Vicente, R.; Fernández-Fernández, J.; Muñoz, F. Mitostasis, Calcium and Free Radicals in Health, Aging and Neurodegeneration. Biomolecules 2021, 11, 1012. [Google Scholar] [CrossRef]
- Dewanjee, S.; Chakraborty, P.; Bhattacharya, H.; Chacko, L.; Singh, B.; Chaudhary, A.; Javvaji, K.; Pradhan, S.R.; Vallamkondu, J.; Dey, A.; et al. Altered glucose metabolism in Alzheimer’s disease: Role of mitochondrial dysfunction and oxidative stress. Free Radic. Biol. Med. 2022, 193, 134–157. [Google Scholar] [CrossRef]
- Castro-Portuguez, R.; Sutphin, G.L. Kynurenine pathway, NAD+ synthesis, and mitochondrial function: Targeting tryptophan metabolism to promote longevity and healthspan. Exp. Gerontol. 2020, 132, 110841. [Google Scholar] [CrossRef] [PubMed]
- Yang, Y.; Sauve, A.A. NAD + metabolism: Bioenergetics, signaling and manipulation for therapy. Biochim. Biophys. Acta (BBA)-Proteins Proteom. 2016, 1864, 1787–1800. [Google Scholar] [CrossRef] [PubMed] [Green Version]
- Iwaoka, K.; Otsuka, C.; Maeda, T.; Yamahara, K.; Kato, K.; Takahashi, K.; Takahashi, K.; Terayama, Y. Impaired metabolism of kynurenine and its metabolites in CSF of parkinson’s disease. Neurosci. Lett. 2019, 714, 134576. [Google Scholar] [CrossRef] [PubMed]
- Lovelace, M.D.; Varney, B.; Sundaram, G.; Lennon, M.J.; Lim, C.K.; Jacobs, K.; Guillemin, G.J.; Brew, B.J. Recent evidence for an expanded role of the kynurenine pathway of tryptophan metabolism in neurological diseases. Neuropharmacology 2017, 112, 373–388. [Google Scholar] [CrossRef] [PubMed]
- Adeyemi, O.S.; Awakan, O.J.; Afolabi, L.B.; Rotimi, D.E.; Oluwayemi, E.; Otuechere, C.A.; Ibraheem, O.; Elebiyo, T.C.; Alejolowo, O.; Arowolo, A.T. Hypoxia and the Kynurenine Pathway: Implications and Therapeutic Prospects in Alzheimer’s Disease. Oxidative Med. Cell. Longev. 2021, 2021, 5522981. [Google Scholar] [CrossRef] [PubMed]
- Toledo, J.B.; Arnold, M.; Kastenmüller, G.; Chang, R.; Baillie, R.A.; Han, X.; Thambisetty, M.; Tenenbaum, J.D.; Suhre, K.; Thompson, J.W.; et al. Metabolic network failures in Alzheimer’s disease: A biochemical road map. Alzheimer’s Dement. 2017, 13, 965–984. [Google Scholar] [CrossRef]
- Kori, M.; Aydln, B.; Unal, S.; Arga, K.Y.; Kazan, D. Metabolic Biomarkers and Neurodegeneration: A Pathway Enrichment Analysis of Alzheimer’s Disease, Parkinson’s Disease, and Amyotrophic Lateral Sclerosis. OMICS J. Integr. Biol. 2016, 20, 645–661. [Google Scholar] [CrossRef]
- Ozaki, T.; Yoshino, Y.; Tachibana, A.; Shimizu, H.; Mori, T.; Nakayama, T.; Mawatari, K.; Numata, S.; Iga, J.-I.; Takahashi, A.; et al. Metabolomic alterations in the blood plasma of older adults with mild cognitive impairment and Alzheimer’s disease (from the Nakayama Study). Sci. Rep. 2022, 12, 15205. [Google Scholar] [CrossRef]
- Paglia, G.; Stocchero, M.; Cacciatore, S.; Lai, S.; Angel, P.; Alam, M.T.; Keller, M.; Ralser, M.; Astarita, G. Unbiased Metabolomic Investigation of Alzheimer’s Disease Brain Points to Dysregulation of Mitochondrial Aspartate Metabolism. J. Proteome Res. 2016, 15, 608–618. [Google Scholar] [CrossRef] [Green Version]
- An, Y.; Varma, V.R.; Varma, S.; Casanova, R.; Dammer, E.; Pletnikova, O.; Chia, C.W.; Egan, J.M.; Ferrucci, L.; Troncoso, J.; et al. Evidence for brain glucose dysregulation in Alzheimer’s disease. Alzheimer’s Dement. 2018, 14, 318–329. [Google Scholar] [CrossRef]
- Hata, J.; Ohara, T.; Katakura, Y.; Shimizu, K.; Yamashita, S.; Yoshida, D.; Honda, T.; Hirakawa, Y.; Shibata, M.; Sakata, S.; et al. Association Between Serum β-Alanine and Risk of Dementia. Am. J. Epidemiol. 2019, 188, 1637–1645. [Google Scholar] [CrossRef] [PubMed]
- Zhao, Q.-F.; Yu, J.-T.; Tan, L. S-Nitrosylation in Alzheimer’s disease. Mol. Neurobiol. 2014, 51, 268–280. [Google Scholar] [CrossRef]
- Rani, P.; Vivek, S.; Ram, S. A Systematic Review on Urinary Biomarkers for Early Diagnosis of Alzheimer’s Disease (AD). Int. J. Nutr. Pharmacol. Neurol. Dis. 2020, 10, 91–98. [Google Scholar]
- Cui, Y.; Liu, X.; Wang, M.; Liu, L.; Sun, X.; Ma, L.; Xie, W.; Wang, C.; Tang, S.; Wang, D.; et al. Lysophosphatidylcholine and Amide as Metabolites for Detecting Alzheimer Disease Using Ultrahigh-Performance Liquid ChromatographyYQuadrupole Time-of-Flight Mass Spectrometry-Based Metabonomics. J. Neuropathol. Exp. Neurol. 2014, 73, 954–963. [Google Scholar] [CrossRef] [PubMed] [Green Version]
- Horgusluoglu, E.; Neff, R.; Song, W.; Wang, M.; Wang, Q.; Arnold, M.; Krumsiek, J.; Galindo-Prieto, B.; Ming, C.; Nho, K.; et al. Integrative metabolomics-genomics approach reveals key metabolic pathways and regulators of Alzheimer’s disease. Alzheimer’s Dement. 2021, 18, 1260–1278. [Google Scholar] [CrossRef] [PubMed]
- Thakkar, M.M. Histamine in the regulation of wakefulness. Sleep Med. Rev. 2011, 15, 65–74. [Google Scholar] [CrossRef] [Green Version]
- Shan, L.; Hofman, M.A.; van Wamelen, D.J.; van Someren, E.J.; Bao, A.-M.; Dick, F.S. Diurnal Fluctuation in Histidine Decarboxylase Expression, the Rate Limiting Enzyme for Histamine Production, and Its Disorder in Neurodegenerative Diseases. Sleep 2012, 35, 713–715. [Google Scholar] [CrossRef]
- Butterfield, D.A.; Sultana, R. Methionine-35 of Aβ(1–42): Importance for Oxidative Stress in Alzheimer Disease. J. Amino Acids 2011, 2011, 198430. [Google Scholar] [CrossRef] [Green Version]
- Tynkkynen, J.; Chouraki, V.; van der Lee, S.J.; Hernesniemi, J.; Yang, Q.; Li, S.; Beiser, A.; Larson, M.G.; Sääksjärvi, K.; Shipley, M.J.; et al. Association of branched-chain amino acids and other circulating metabolites with risk of incident dementia and Alzheimer’s disease: A prospective study in eight cohorts. Alzheimer’s Dement. 2018, 14, 723–733. [Google Scholar] [CrossRef]
- González-Domínguez, R.; García-Barrera, T.; Gómez-Ariza, J.L. Metabolite profiling for the identification of altered metabolic pathways in Alzheimer’s disease. J. Pharm. Biomed. Anal. 2015, 107, 75–81. [Google Scholar] [CrossRef]
- Kalecký, K.; German, D.C.; Montillo, A.A.; Bottiglieri, T. Targeted Metabolomic Analysis in Alzheimer’s Disease Plasma and Brain Tissue in Non-Hispanic Whites. J. Alzheimer’s Dis. 2022, 86, 1875–1895. [Google Scholar] [CrossRef] [PubMed]
- van der Velpen, V.; Teav, T.; Gallart-Ayala, H.; Mehl, F.; Konz, I.; Clark, C.; Oikonomidi, A.; Peyratout, G.; Henry, H.; Delorenzi, M.; et al. Systemic and central nervous system metabolic alterations in Alzheimer’s disease. Alzheimer’s Res. Ther. 2019, 11, 93. [Google Scholar] [CrossRef] [PubMed] [Green Version]
- Bonda, D.J.; Mailankot, M.; Stone, J.G.; Garrett, M.R.; Staniszewska, M.; Castellani, R.J.; Siedlak, S.L.; Zhu, X.; Lee, H.-G.; Perry, G.; et al. Indoleamine 2,3-dioxygenase and 3-hydroxykynurenine modifications are found in the neuropathology of Alzheimer’s disease. Redox Rep. 2010, 15, 161–168. [Google Scholar] [CrossRef] [Green Version]
- Teixeira, J.P.; de Castro, A.A.; Soares, F.V.; da Cunha, E.F.F.; Ramalho, T.C. Future Therapeutic Perspectives into the Alzheimer’s Disease Targeting the Oxidative Stress Hypothesis. Molecules 2019, 24, 4410. [Google Scholar] [CrossRef] [Green Version]
- Barcarolo, D.; Angeli, E.; Ribas, L.; Addona, S.; Ortega, H.; Hein, G. Application of an optimized and validated LC–MS/MS method for the quantification of free 3-nitrotyrosine in plasma, urine and liver tissue of lactating dairy cows. Livest. Sci. 2022, 257, 104852. [Google Scholar] [CrossRef]
- Cioffi, F.; Adam, R.H.I.; Bansal, R.; Broersen, K. A Review of Oxidative Stress Products and Related Genes in Early Alzheimer’s Disease. J. Alzheimer’s Dis. 2021, 83, 977–1001. [Google Scholar] [CrossRef] [PubMed]
- Schwarcz, M.J.; Guillemin, G.J.; Teipel, S.J.; Buerger, K.; Hampel, H. Increased 3-hydroxykynurenine serum concentrations differentiate Alzheimer’s disease patients from controls. Eur. Arch. Psychiatry Clin. Neurosci. 2013, 263, 345. [Google Scholar] [CrossRef] [PubMed]
- Dalmasso, M.C.; Arán, M.; Galeano, P.; Perin, S.; Giavalisco, P.; Adami, P.V.M.; Novack, G.V.; Castaño, E.M.; Cuello, A.C.; Scherer, M.; et al. Nicotinamide as potential biomarker for Alzheimer’s disease: A translational study based on metabolomics. Front. Mol. Biosci. 2023, 9. [Google Scholar] [CrossRef] [PubMed]
- Boison, D. Adenosine as a neuromodulator in neurological diseases. Curr. Opin. Pharmacol. 2008, 8, 2–7. [Google Scholar] [CrossRef] [PubMed] [Green Version]
- Parker, W.D., Jr.; Filley, C.M.; Parks, J.K. Cytochrome oxidase deficiency in Alzheimer’s disease. Neurology 1990, 40, 1302. [Google Scholar] [CrossRef]
- Janitschke, D.; Lauer, A.; Bachmann, C.; Grimm, H.; Hartmann, T.; Grimm, M. Methylxanthines and Neurodegenerative Diseases: An Update. Nutrients 2021, 13, 803. [Google Scholar] [CrossRef] [PubMed]
- Abraham, A.; Drory, V.E. Influence of serum uric acid levels on prognosis and survival in amyotrophic lateral sclerosis: A meta-analysis. J. Neurol. 2014, 261, 1133–1138. [Google Scholar] [CrossRef] [PubMed]
- Guarda, G.; So, A. Regulation of Inflammasome Activity. Immunology 2010, 130, 329–336. [Google Scholar] [CrossRef]
- de Leeuw, F.A.; Tijms, B.M.; Doorduijn, A.S.; Hendriksen, H.M.A.; van de Rest, O.; de van der Schueren, M.A.E.; Visser, M.; Heuvel, E.G.H.M.V.D.; van Wijk, N.; Bierau, J.; et al. LDL cholesterol and uridine levels in blood are potential nutritional biomarkers for clinical progression in Alzheimer’s disease: The NUDAD project. Alzheimer’s Dement. 2020, 12, e12120. [Google Scholar] [CrossRef]
- Dai, Z.; Hu, T.; Su, S.; Liu, J.; Ma, Y.; Zhuo, Y.; Fang, S.; Wang, Q.; Mo, Z.; Pan, H.; et al. Comparative Metabolomics Analysis Reveals Key Metabolic Mechanisms and Protein Biomarkers in Alzheimer’s Disease. Front. Pharmacol. 2022, 13, 904857. [Google Scholar] [CrossRef]
- Sveinbjornsdottir, S. The clinical symptoms of Parkinson’s disease. J. Neurochem. 2016, 139, 318–324. [Google Scholar] [CrossRef] [Green Version]
- Kalia, L.V.; Lang, A.E. Parkinson’s Disease. Lancet 2015, 386, 896–912. [Google Scholar] [CrossRef]
- Tysnes, O.B.; Storstein, A. Epidemiology of Parkinson’s Disease. J. Neural. Transm. 2017, 124, 901–905. [Google Scholar] [CrossRef]
- Davie, C.A. A Review of Parkinson’s Disease. Br. Med. Bull. 2008, 86, 109–127. [Google Scholar] [CrossRef] [Green Version]
- Giguère, N.; Nanni, S.B.; Trudeau, L.-E. On Cell Loss and Selective Vulnerability of Neuronal Populations in Parkinson’s Disease. Front. Neurol. 2018, 9, 455. [Google Scholar] [CrossRef]
- Villar-Piqué, A.; da Fonseca, T.L.; Outeiro, T.F. Structure, function and toxicity of alpha-synuclein: The Bermuda triangle in synucleinopathies. J. Neurochem. 2015, 139, 240–255. [Google Scholar] [CrossRef] [PubMed]
- Bartels, T.; Selkoe, D.J. Bartels & Selkoe reply. Nature 2013, 498, E6–E7. [Google Scholar] [CrossRef]
- Barrett, P.J.; Greenamyre, J.T. Post-translational modification of α-synuclein in Parkinson’s disease. Brain Res. 2015, 1628, 247–253. [Google Scholar] [CrossRef]
- Gowers, W. Parkinson’s Disease Pathogenesis and Clinical Aspects; Codon Publications: Singapore, 2018; pp. 121–135. [Google Scholar] [CrossRef]
- Henderson, M.X.; Trojanowski, J.Q.; Lee, V.M.-Y. α-Synuclein pathology in Parkinson’s disease and related α-synucleinopathies. Neurosci. Lett. 2019, 709, 134316. [Google Scholar] [CrossRef]
- Harms, A.S.; Ferreira, S.A.; Romero-Ramos, M. Periphery and Brain, Innate and Adaptive Immunity in Parkinson’s Disease. Acta Neuropathol. 2021, 141, 527–545. [Google Scholar] [CrossRef]
- Raj, T.; Rothamel, K.; Mostafavi, S.; Ye, C.; Lee, M.N.; Replogle, J.M.; Feng, T.; Lee, M.; Asinovski, N.; Frohlich, I.; et al. Polarization of the Effects of Autoimmune and Neurodegenerative Risk Alleles in Leukocytes. Science 2014, 344, 519–523. [Google Scholar] [CrossRef] [Green Version]
- Heo, J.M.; Rutter, J. Ubiquitin-Dependent Mitochondrial Protein Degradation. Int. J. Biochem. Cell Biol. 2011, 43, 1422–1426. [Google Scholar] [CrossRef] [Green Version]
- Chen, C.; Turnbull, D.M.; Reeve, A.K. Mitochondrial Dysfunction in Parkinson’s Disease—Cause or Consequence. Biology 2019, 8, 38. [Google Scholar] [CrossRef] [Green Version]
- Bloem, B.R.; Okun, M.S.; Klein, C. Parkinson’s disease. Lancet 2021, 397, 2284–2303. [Google Scholar] [CrossRef]
- Day, J.; Mullin, S. The Genetics of Parkinson’s Disease and Implications for Clinical Practice. Genes 2021, 12, 1006. [Google Scholar] [CrossRef]
- Noyce, A.J.; Bestwick, J.P.; Silveira-Moriyama, L.; Hawkes, C.H.; Giovannoni, G.; Lees, A.J.; Schrag, A. Meta-analysis of early nonmotor features and risk factors for Parkinson disease. Ann. Neurol. 2012, 72, 893–901. [Google Scholar] [CrossRef] [PubMed] [Green Version]
- Rocha, E.M.; de Miranda, B.; Sanders, L.H. Alpha-synuclein: Pathology, mitochondrial dysfunction and neuroinflammation in Parkinson’s disease. Neurobiol. Dis. 2018, 109, 249–257. [Google Scholar] [CrossRef] [PubMed]
- Jellinger, K.A. Basic mechanisms of neurodegeneration: A critical update. J. Cell. Mol. Med. 2010, 14, 457–487. [Google Scholar] [CrossRef] [PubMed] [Green Version]
- Subramaniam, S.R.; Chesselet, M.-F. Mitochondrial dysfunction and oxidative stress in Parkinson’s disease. Prog. Neurobiol. 2013, 106–107, 17–32. [Google Scholar] [CrossRef] [Green Version]
- Bose, A.; Beal, M.F. Mitochondrial dysfunction in Parkinson’s disease. J. Neurochem. 2016, 139, 216–231. [Google Scholar] [CrossRef]
- Davis Parker, W., Jr.; Parks, J.K.; Swerdlow, R.H. Complex I Deficiency in Parkinson’s Disease Frontal Cortex. Brain Res. 2008, 1189, 215–218. [Google Scholar] [CrossRef] [Green Version]
- Isobe, C.; Abe, T.; Terayama, Y. Levels of reduced and oxidized coenzymeQ-10 and 8-hydroxy-2′-deoxyguanosine in the cerebrospinal fluid of patients with living Parkinson’s disease demonstrate that mitochondrial oxidative damage and/or oxidative DNA damage contributes to the neurodegenerative process. Neurosci. Lett. 2010, 469, 159–163. [Google Scholar] [CrossRef]
- Behl, T.; Kumar, S.; Althafar, Z.M.; Sehgal, A.; Singh, S.; Sharma, N.; Badavath, V.N.; Yadav, S.; Bhatia, S.; Al-Harrasi, A.; et al. Exploring the Role of Ubiquitin–Proteasome System in Parkinson’s Disease. Mol. Neurobiol. 2022, 59, 4257–4273. [Google Scholar] [CrossRef]
- Holper, L.; Ben-Shachar, D.; Mann, J.J. Multivariate meta-analyses of mitochondrial complex I and IV in major depressive disorder, bipolar disorder, schizophrenia, Alzheimer disease, and Parkinson disease. Neuropsychopharmacology 2018, 44, 837–849. [Google Scholar] [CrossRef]
- Ludtmann, M.H.R.; Abramov, A.Y. Mitochondrial calcium imbalance in Parkinson’s disease. Neurosci. Lett. 2018, 663, 86–90. [Google Scholar] [CrossRef]
- Venkatesan, D.; Iyer, M.; Narayanasamy, A.; Siva, K.; Vellingiri, B. Kynurenine Pathway in Parkinson’s Disease—An Update. eNeurologicalSci 2020, 21, 100270. [Google Scholar] [CrossRef] [PubMed]
- Schöndorf, D.C.; Ivanyuk, D.; Baden, P.; Sanchez-Martinez, A.; de Cicco, S.; Yu, C.; Giunta, I.; Schwarz, L.K.; di Napoli, G.; Panagiotakopoulou, V.; et al. The NAD+ Precursor Nicotinamide Riboside Rescues Mitochondrial Defects and Neuronal Loss in iPSC and Fly Models of Parkinson’s Disease. Cell Rep. 2018, 23, 2976–2988. [Google Scholar] [CrossRef] [PubMed]
- Brakedal, B.; Dölle, C.; Riemer, F.; Ma, Y.; Nido, G.S.; Skeie, G.O.; Craven, A.R.; Schwarzlmüller, T.; Brekke, N.; Diab, J.; et al. The NADPARK study: A randomized phase I trial of nicotinamide riboside supplementation in Parkinson’s disease. Cell Metab. 2022, 34, 396–407.e6. [Google Scholar] [CrossRef] [PubMed]
- Hosseini, M.; Hami, J.; Shahi, S.; Lotfi, N.; Talebi, A.; Afshar, M. Iranian Journal of Neurology © 2015 Effects of L-Arginine Pre-Treatment in 1-Methyl-4-Phenyl-1,2,3,6-Tetrahydropyridine-Induced Parkinson’s Diseases in Balb/c Mice. Iran. J. Neurol. 2015, 14, 195. [Google Scholar]
- Ahmed, S.S.; Santosh, W.; Kumar, S.; Christlet, H.T.T. Metabolic profiling of Parkinson’s disease: Evidence of biomarker from gene expression analysis and rapid neural network detection. J. Biomed. Sci. 2009, 16, 63. [Google Scholar] [CrossRef] [Green Version]
- Gröger, A.; Kolb, R.; Schäfer, R.; Klose, U. Dopamine Reduction in the Substantia Nigra of Parkinson’s Disease Patients Confirmed by In Vivo Magnetic Resonance Spectroscopic Imaging. PLoS ONE 2014, 9, e84081. [Google Scholar] [CrossRef]
- Wu, G.; Fang, Y.-Z.; Yang, S.; Lupton, J.R.; Turner, N.D. Recent Advances in Nutritional Sciences Glutathione Metabolism and Its Implications for Health. J. Nutr. 2004, 134, 489–492. [Google Scholar] [CrossRef] [Green Version]
- Harrison, I.F.; Powell, N.M.; Dexter, D.T. The histone deacetylase inhibitor nicotinamide exacerbates neurodegeneration in the lactacystin rat model of Parkinson’s disease. J. Neurochem. 2018, 148, 136–156. [Google Scholar] [CrossRef] [Green Version]
- Lukasheva, E.; Makletsova, M.; Lukashev, A.; Babayeva, G.; Arinbasarova, A.; Medentsev, A. Fungal Enzyme l-Lysine α-Oxidase Affects the Amino Acid Metabolism in the Brain and Decreases the Polyamine Level. Pharmaceuticals 2020, 13, 398. [Google Scholar] [CrossRef]
- Braak, H.; Rüb, U.; Gai, W.P.; del Tredici, K. Idiopathic Parkinson’s disease: Possible routes by which vulnerable neuronal types may be subject to neuroinvasion by an unknown pathogen. J. Neural. Transm. 2003, 110, 517–536. [Google Scholar] [CrossRef]
- Yan, Z.; Li, R.; Shi, W.; Yao, L. Role of the gut-microbiota-metabolite axis in the rotenone model of early-stage Parkinson’s Disease. Metab. Brain Dis. 2022, 37, 2511–2520. [Google Scholar] [CrossRef]
- Stoessel, D.; Schulte, C.; dos Santos, M.C.T.; Scheller, D.; Rebollo-Mesa, I.; Deuschle, C.; Walther, D.; Schauer, N.; Berg, D.; da Costa, A.N.; et al. Promising Metabolite Profiles in the Plasma and CSF of Early Clinical Parkinson’s Disease. Front. Aging Neurosci. 2018, 10, 51. [Google Scholar] [CrossRef] [Green Version]
- Steiner, J.A.; Quansah, E.; Brundin, P. The concept of alpha-synuclein as a prion-like protein: Ten years after. Cell Tissue Res. 2018, 373, 161–173. [Google Scholar] [CrossRef]
- Chang, K.-H.; Cheng, M.-L.; Tang, H.-Y.; Huang, C.-Y.; Wu, Y.-R.; Chen, C.-M. Alternations of Metabolic Profile and Kynurenine Metabolism in the Plasma of Parkinson’s Disease. Mol. Neurobiol. 2018, 55, 6319–6328. [Google Scholar] [CrossRef]
- Havelund, J.F.; Andersen, A.D.; Binzer, M.; Blaabjerg, M.; Heegaard, N.H.; Stenager, E.; Faergeman, N.J.; Gramsbergen, J.B. Changes in kynurenine pathway metabolism in Parkinson patients with L-DOPA-induced dyskinesia. J. Neurochem. 2017, 142, 756–766. [Google Scholar] [CrossRef] [PubMed] [Green Version]
- D’Ascenzo, N.; Antonecchia, E.; Angiolillo, A.; Bender, V.; Camerlenghi, M.; Xie, Q.; Di Costanzo, A. Metabolomics of blood reveals age-dependent pathways in Parkinson’s Disease. Cell Biosci. 2022, 12, 102. [Google Scholar] [CrossRef]
- Sorgdrager, F.J.H.; Naudé, P.J.W.; Kema, I.P.; Nollen, E.A.; de Deyn, P.P. Tryptophan Metabolism in Inflammaging: From Biomarker to Therapeutic Target. Front. Immunol. 2019, 10, 2565. [Google Scholar] [CrossRef]
- Shao, Y.; Li, T.; Liu, Z.; Wang, X.; Xu, X.; Li, S.; Xu, G.; Le, W. Comprehensive metabolic profiling of Parkinson’s disease by liquid chromatography-mass spectrometry. Mol. Neurodegener. 2021, 16, 4. [Google Scholar] [CrossRef] [PubMed]
- Ostrakhovitch, E.A.; Song, E.-S.; Macedo, J.K.; Gentry, M.S.; Quintero, J.E.; van Horne, C.; Yamasaki, T.R. Analysis of circulating metabolites to differentiate Parkinson’s disease and essential tremor. Neurosci. Lett. 2022, 769, 136428. [Google Scholar] [CrossRef] [PubMed]
- Białecka, M.; Kurzawski, M.; Roszmann, A.; Robowski, P.; Sitek, E.J.; Honczarenko, K.; Gorzkowska, A.; Budrewicz, S.; Mak, M.; Jarosz, M.; et al. Association of COMT, MTHFR, and SLC19A1(RFC-1) polymorphisms with homocysteine blood levels and cognitive impairment in Parkinson’s disease. Pharm. Genom. 2012, 22, 716–724. [Google Scholar] [CrossRef] [PubMed]
- Sławek, J.; Roszmann, A.; Robowski, P.; Dubaniewicz, M.; Sitek, E.J.; Honczarenko, K.; Gorzkowska, A.; Budrewicz, S.; Mak, M.; Gołąb-Janowska, M.; et al. The Impact of MRI White Matter Hyperintensities on Dementia in Parkinson’s Disease in Relation to the Homocysteine Level and Other Vascular Risk Factors. Neurodegener. Dis. 2012, 12, 1–12. [Google Scholar] [CrossRef]
- Szadejko, K.; Dziewiatowski, K.; Szabat, K.; Robowski, P.; Schinwelski, M.; Sitek, E.; Sławek, J. Polyneuropathy in levodopa-treated Parkinson’s patients. J. Neurol. Sci. 2016, 371, 36–41. [Google Scholar] [CrossRef] [PubMed]
- Fan, X.; Zhang, L.; Li, H.; Chen, G.; Qi, G.; Ma, X.; Jin, Y. Role of homocysteine in the development and progression of Parkinson’s disease. Ann. Clin. Transl. Neurol. 2020, 7, 2332–2338. [Google Scholar] [CrossRef] [PubMed]
- Tapiero, H.; Mathé, G.; Couvreur, P.; Tew, K.D. II. Glutamine and Glutamate. Biomed. Pharmacother. 2002, 56, 446–457. [Google Scholar] [CrossRef] [PubMed]
- Kwon, E.H.; Tennagels, S.; Gold, R.; Gerwert, K.; Beyer, L.; Tönges, L. Update on CSF Biomarkers in Parkinson’s Disease. Biomolecules 2022, 12, 329. [Google Scholar] [CrossRef]
- Willkommen, D.; Lucio, M.; Moritz, F.; Forcisi, S.; Kanawati, B.; Smirnov, K.S.; Schroeter, M.; Sigaroudi, A.; Schmitt-Kopplin, P.; Michalke, B. Metabolomic investigations in cerebrospinal fluid of Parkinson’s disease. PLoS ONE 2018, 13, e0208752. [Google Scholar] [CrossRef] [PubMed] [Green Version]
- Gątarek, P.; Sekulska-Nalewajko, J.; Bobrowska-Korczaka, B.; Pawełczyk, M.; Jastrzębski, K.; Głąbiński, A.; Kałużna-Czaplińska, J. Plasma Metabolic Disturbances in Parkinson’s Disease Patients. Biomedicines 2022, 10, 3005. [Google Scholar] [CrossRef]
- Shao, Y.; Le, W. Recent advances and perspectives of metabolomics-based investigations in Parkinson’s disease. Mol. Neurodegener. 2019, 14, 3. [Google Scholar] [CrossRef] [Green Version]
- Mobed, A.; Razavi, S.; Ahmadalipour, A.; Shakouri, S.K.; Koohkan, G. Biosensors in Parkinson’s disease. Clin. Chim. Acta 2021, 518, 51–58. [Google Scholar] [CrossRef]
- Andreadou, E.; Nikolaou, C.; Gournaras, F.; Rentzos, M.; Boufidou, F.; Tsoutsou, A.; Zournas, C.; Zissimopoulos, V.; Vassilopoulos, D. Serum uric acid levels in patients with Parkinson’s disease: Their relationship to treatment and disease duration. Clin. Neurol. Neurosurg. 2009, 111, 724–728. [Google Scholar] [CrossRef]
- Seifar, F.; Dinasarapu, A.R.; Jinnah, H.A. Uric Acid in Parkinson′s Disease: What Is the Connection. Mov. Disord. 2022, 37, 2173–2183. [Google Scholar] [CrossRef] [PubMed]
- Rebai, A.; Reçber, T.; Nemutlu, E.; Chbili, C.; Kurbanoglu, S.; Kir, S.; Ben Amor, S.; Özkan, S.A.; Saguem, S. GC-MS Based Metabolic Profiling of Parkinson’s Disease with Glutathione S-transferase M1 and T1 Polymorphism in Tunisian Patients. Comb. Chem. High Throughput Screen. 2020, 23, 1041–1048. [Google Scholar] [CrossRef]
- Cerri, S.; Mus, L.; Blandini, F. Parkinson’s Disease in Women and Men: What’s the Difference? J. Park. Dis. 2019, 9, 501–515. [Google Scholar] [CrossRef] [Green Version]
- Pietrucci, D.; Cerroni, R.; Unida, V.; Farcomeni, A.; Pierantozzi, M.; Mercuri, N.B.; Biocca, S.; Stefani, A.; Desideri, A. Dysbiosis of gut microbiota in a selected population of Parkinson’s patients. Park. Relat. Disord. 2019, 65, 124–130. [Google Scholar] [CrossRef] [PubMed]
- Dayalu, P.; Albin, R.L. Huntington Disease. Neurol. Clin. 2015, 33, 101–114. [Google Scholar] [CrossRef] [PubMed]
- Pagan, F.; Torres-Yaghi, Y.; Altshuler, M. The diagnosis and natural history of Huntington disease. Handb. Clin. Neurol. 2017, 144, 63–67. [Google Scholar] [CrossRef]
- Frank, S. Treatment of Huntington’s Disease. Neurotherapeutics 2014, 11, 153–160. [Google Scholar] [CrossRef] [Green Version]
- Oosterloo, M.; de Greef, B.T.; Bijlsma, E.K.; Durr, A.; Tabrizi, S.J.; Estevez-Fraga, C.; de Die-Smulders, C.E.; Roos, R.A. Disease Onset in Huntington’s Disease: When Is the Conversion. Mov. Disord. Clin. Pract. 2021, 8, 352–360. [Google Scholar] [CrossRef]
- Jacobsen, J.C.; Gregory, G.C.; Woda, J.M.; Thompson, M.N.; Coser, K.R.; Murthy, V.; Kohane, I.S.; Gusella, J.F.; Seong, I.S.; MacDonald, M.E.; et al. HD CAG-correlated gene expression changes support a simple dominant gain of function. Hum. Mol. Genet. 2011, 20, 2846–2860. [Google Scholar] [CrossRef] [Green Version]
- Shirasaki, D.I.; Greiner, E.R.; Al-Ramahi, I.; Gray, M.; Boontheung, P.; Geschwind, D.H.; Botas, J.; Coppola, G.; Horvath, S.; Loo, J.A.; et al. Network Organization of the Huntingtin Proteomic Interactome in Mammalian Brain. Neuron 2012, 75, 41–57. [Google Scholar] [CrossRef] [Green Version]
- Jahreiss, L.; Menzies, F.M.; Rubinsztein, D.C. The Itinerary of Autophagosomes: From Peripheral Formation to Kiss-and-Run Fusion with Lysosomes. Traffic 2008, 9, 574–587. [Google Scholar] [CrossRef] [Green Version]
- Jarosińska, O.D.; Rüdiger, S.G.D. Molecular Strategies to Target Protein Aggregation in Huntington’s Disease. Front. Mol. Biosci. 2021, 8, 1068. [Google Scholar] [CrossRef]
- Martinez-Vicente, M.; Talloczy, Z.; Wong, E.; Tang, G.; Koga, H.; Kaushik, S.; de Vries, R.; Arias, E.; Harris, S.; Sulzer, D.; et al. Cargo recognition failure is responsible for inefficient autophagy in Huntington’s disease. Nat. Neurosci. 2010, 13, 567–576. [Google Scholar] [CrossRef] [PubMed] [Green Version]
- Sassone, J.; Colciago, C.; Marchi, P.; Ascardi, C.; Alberti, L.; di Pardo, A.; Zippel, R.; Sipione, S.; Silani, V.; Ciammola, A. Mutant Huntingtin induces activation of the Bcl-2/adenovirus E1B 19-kDa interacting protein (BNip3). Cell Death Dis. 2010, 1, e7. [Google Scholar] [CrossRef] [PubMed]
- McColgan, P.; Tabrizi, S.J. Huntington’s disease: A clinical review. Eur. J. Neurol. 2017, 25, 24–34. [Google Scholar] [CrossRef] [PubMed]
- Stoker, T.B.; Mason, S.L.; Greenland, J.C.; Holden, S.T.; Santini, H.; Barker, R.A. Huntington’s disease: Diagnosis and management. Pract. Neurol. 2021, 22, 32–41. [Google Scholar] [CrossRef]
- Richard, A.; Frank, S. Deutetrabenazine in the treatment of Huntington’s disease. Neurodegener. Dis. Manag. 2019, 9, 31–37. [Google Scholar] [CrossRef]
- Duan, W.; Jiang, M.; Jin, J. Metabolism in HD: Still a Relevant Mechanism? Mov. Disord. 2014, 29, 1366–1374. [Google Scholar] [CrossRef] [Green Version]
- Raymond, L.A. Striatal synaptic dysfunction and altered calcium regulation in Huntington disease. Biochem. Biophys. Res. Commun. 2017, 483, 1051–1062. [Google Scholar] [CrossRef]
- Goswami, A.; Dikshit, P.; Mishra, A.; Mulherkar, S.; Nukina, N.; Jana, N.R. Oxidative stress promotes mutant huntingtin aggregation and mutant huntingtin-dependent cell death by mimicking proteasomal malfunction. Biochem. Biophys. Res. Commun. 2006, 342, 184–190. [Google Scholar] [CrossRef]
- Chang, C.-R.; Blackstone, C. Dynamic regulation of mitochondrial fission through modification of the dynamin-related protein Drp1. Ann. N. Y. Acad. Sci. 2010, 1201, 34–39. [Google Scholar] [CrossRef] [Green Version]
- Yun, C.L.; Zierath, J.R. AMP-Activated Protein Kinase Signaling in Metabolic Regulation. J. Clin. Investig. 2006, 116, 1776–1783. [Google Scholar]
- Castellano-Gonzalez, G.; Jacobs, K.R.; Don, E.; Cole, N.J.; Adams, S.; Lim, C.K.; Lovejoy, D.B.; Guillemin, G.J. Kynurenine 3-Monooxygenase Activity in Human Primary Neurons and Effect on Cellular Bioenergetics Identifies New Neurotoxic Mechanisms. Neurotox. Res. 2019, 35, 530–541. [Google Scholar] [CrossRef]
- Leavitt, B.R.; Weir, D.W.; Sturrock, A. Development of Biomarkers for Huntington’s Disease. Lancet Neurol. 2011, 10, 573–590. [Google Scholar] [CrossRef]
- Patassini, S.; Begley, P.; Xu, J.; Church, S.; Reid, S.; Kim, E.H.; Curtis, M.; Dragunow, M.; Waldvogel, H.; Snell, R.G.; et al. Metabolite mapping reveals severe widespread perturbation of multiple metabolic processes in Huntington’s disease human brain. Biochim. Biophys. Acta (BBA)-Mol. Basis Dis. 2016, 1862, 1650–1662. [Google Scholar] [CrossRef] [PubMed]
- Gruber, B.M.; Kłaczkow, G.; Jaworska, M.; Krzysztoń-Russjan, J.; Anuszewska, E.L.; Zielonka, D.; Klimberg, A.; Marcinkowski, J.T.; Huntington, M.J. Huntington’ Disease-Imbalance of Amino Acid Levels in Plasma of Patients and Mutation Carriers. Ann. Agric. Environ. Med. 2013, 20, 4. [Google Scholar]
- Moffett, J.R.; Ross, B.; Arun, P.; Madhavarao, C.N.; Namboodiri, A.M. N-Acetylaspartate in the CNS: From neurodiagnostics to neurobiology. Prog. Neurobiol. 2007, 81, 89–131. [Google Scholar] [CrossRef] [Green Version]
- Ruggieri, M.; Serpino, C.; Ceci, E.; Sciruicchio, V.; Franco, G.; Pica, C.; Trojano, M.; Livrea, P.; de Tommaso, M. Serum levels of N-acetylaspartate in Huntington’s disease: Preliminary results. Mov. Disord. 2011, 27, 329–330. [Google Scholar] [CrossRef]
- Pradhan, S.S.; Thota, S.M.; Rajaratnam, S.; Bhagavatham, S.K.S.; Pulukool, S.K.; Rathnakumar, S.; Phalguna, K.S.; Dandamudi, R.B.; Pargaonkar, A.; Joseph, P.; et al. Integrated multi-omics analysis of Huntington disease identifies pathways that modulate protein aggregation. Dis. Model. Mech. 2022, 15, dmm049492. [Google Scholar] [CrossRef]
- Borovecki, F.; Lovrecic, L.; Zhou, J.; Jeong, H.; Then, F.; Rosas, H.D.; Hersch, S.M.; Hogarth, P.; Bouzou, B.; Jensen, R.V.; et al. Genome-wide expression profiling of human blood reveals biomarkers for Huntington’s disease. Proc. Natl. Acad. Sci. USA 2005, 102, 11023–11028. [Google Scholar] [CrossRef] [Green Version]
- Tsang, T.M.; Woodman, B.; Mcloughlin, G.A.; Griffin, J.L.; Tabrizi, S.J.; Bates, G.P.; Holmes, E. Metabolic Characterization of the R6/2 Transgenic Mouse Model of Huntington’s Disease by High-Resolution MAS 1H NMR Spectroscopy. J. Proteome Res. 2006, 5, 483–492. [Google Scholar] [CrossRef] [PubMed]
- Underwood, B.R.; Broadhurst, D.; Dunn, W.B.; Ellis, D.I.; Michell, A.W.; Vacher, C.; Mosedale, D.E.; Kell, D.B.; Barker, R.A.; Grainger, D.J.; et al. Huntington disease patients and transgenic mice have similar pro-catabolic serum metabolite profiles. Brain 2006, 129, 877–886. [Google Scholar] [CrossRef] [Green Version]
- Reilmann, R.; Rolf, L.H.; Lange, H. Decreased plasma alanine and isoleucine in Huntington’s disease. Acta Neurol. Scand. 2009, 91, 222–224. [Google Scholar] [CrossRef] [PubMed]
- Deeb, O.; Atallah, A.; Salameh, S. Exploring biomarkers for Huntington’s disease. In From Pathophysiology to Treatment of Huntington’s Disease; Szejko, N., Ed.; IntechOpen: London, UK, 2022. [Google Scholar]
- Botas, A.; Campbell, H.M.; Han, X.; Maletic-Savatic, M. Metabolomics of Neurodegenerative Diseases. Int. Rev. Neurobiol. 2015, 122, 53–80. [Google Scholar] [CrossRef]
- Mastrokolias, A.; Pool, R.; Mina, E.; Hettne, K.M.; van Duijn, E.; van Der Mast, R.C.; van Ommen, G.; ‘t Hoen, P.A.C.; Prehn, C.; Adamski, J.; et al. Integration of targeted metabolomics and transcriptomics identifies deregulation of phosphatidylcholine metabolism in Huntington’s disease peripheral blood samples. Metabolomics 2016, 12, 137. [Google Scholar] [CrossRef] [PubMed] [Green Version]
- Futter, M.; Diekmann, H.; Schoenmakers, E.; Sadiq, O.; Chatterjee, K.; Rubinsztein, D.C. Wild-type but not mutant huntingtin modulates the transcriptional activity of liver X receptors. J. Med. Genet. 2009, 46, 438–446. [Google Scholar] [CrossRef] [Green Version]
- Christodoulou, C.C.; Zachariou, M.; Tomazou, M.; Karatzas, E.; Demetriou, C.A.; Zamba-Papanicolaou, E.; Spyrou, G.M. Investigating the Transition of Pre-Symptomatic to Symptomatic Huntington’s Disease Status Based on Omics Data. Int. J. Mol. Sci. 2020, 21, 7414. [Google Scholar] [CrossRef]
- Boros, F.A.; Klivényi, P.; Toldi, J.; Vécsei, L. Indoleamine 2,3-dioxygenase as a novel therapeutic target for Huntington’s disease. Expert Opin. Ther. Targets 2018, 23, 39–51. [Google Scholar] [CrossRef]
- Przybyl, L.; Wozna-Wysocka, M.; Kozlowska, E.; Fiszer, A. What, When and How to Measure—Peripheral Biomarkers in Therapy of Huntington’s Disease. Int. J. Mol. Sci. 2021, 22, 1561. [Google Scholar] [CrossRef]
- Forrest, C.M.; Mackay, G.M.; Stoy, N.; Spiden, S.L.; Taylor, R.; Stone, T.W.; Darlington, L.G. Blood levels of kynurenines, interleukin-23 and soluble human leucocyte antigen-G at different stages of Huntington’s disease. J. Neurochem. 2010, 112, 112–122. [Google Scholar] [CrossRef]
- McGarry, A.; Gaughan, J.; Hackmyer, C.; Lovett, J.; Khadeer, M.; Shaikh, H.; Pradhan, B.; Ferraro, T.N.; Wainer, I.W.; Moaddel, R. Cross-sectional analysis of plasma and CSF metabolomic markers in Huntington’s disease for participants of varying functional disability: A pilot study. Sci. Rep. 2020, 10, 20490. [Google Scholar] [CrossRef] [PubMed]
- Pehar, M.; Harlan, B.; Killoy, K.M.; Vargas, M. Nicotinamide Adenine Dinucleotide Metabolism and Neurodegeneration. Antioxid. Redox Signal. 2018, 28, 1652–1668. [Google Scholar] [CrossRef] [PubMed]
- Haag, F.; Adriouch, S.; Braß, A.; Jung, C.; Möller, S.; Scheuplein, F.; Bannas, P.; Seman, M.; Koch-Nolte, F. Extracellular NAD and ATP: Partners in immune cell modulation. Purinergic Signal. 2007, 3, 71–81. [Google Scholar] [CrossRef] [Green Version]
- Toczek, M.; Zielonka, D.; Zukowska, P.; Marcinkowski, J.T.; Slominska, E.; Isalan, M.; Smolenski, R.T.; Mielcarek, M. An impaired metabolism of nucleotides underpins a novel mechanism of cardiac remodeling leading to Huntington’s disease related cardiomyopathy. Biochim. Biophys. Acta (BBA)-Mol. Basis Dis. 2016, 1862, 2147–2157. [Google Scholar] [CrossRef]
- Graham, S.F.; Kumar, P.; Bahado-Singh, R.O.; Robinson, A.; Mann, D.; Green, B.D. Novel Metabolite Biomarkers of Huntington’s Disease As Detected by High-Resolution Mass Spectrometry. J. Proteome Res. 2016, 15, 1592–1601. [Google Scholar] [CrossRef] [PubMed]
- Rosas, H.D.; Doros, G.; Bhasin, S.; Thomas, B.; Gevorkian, S.; Malarick, K.; Matson, W.; Hersch, S.M. A systems-level “misunderstanding”: The plasma metabolome in Huntington’s disease. Ann. Clin. Transl. Neurol. 2015, 2, 756–768. [Google Scholar] [CrossRef]
- Chen, C.-M.; Wu, Y.-R.; Cheng, M.-L.; Liu, J.-L.; Lee, Y.-M.; Lee, P.-W.; Soong, B.-W.; Chiu, D.T.-Y. Increased oxidative damage and mitochondrial abnormalities in the peripheral blood of Huntington’s disease patients. Biochem. Biophys. Res. Commun. 2007, 359, 335–340. [Google Scholar] [CrossRef] [PubMed]
- Tomczyk, M.; Braczko, A.; Mierzejewska, P.; Podlacha, M.; Krol, O.; Jablonska, P.; Jedrzejewska, A.; Pierzynowska, K.; Wegrzyn, G.; Slominska, E.M.; et al. Rosiglitazone Ameliorates Cardiac and Skeletal Muscle Dysfunction by Correction of Energetics in Huntington’s Disease. Cells 2022, 11, 2662. [Google Scholar] [CrossRef]
- Silajdžić, E.; Björkqvist, M. A Critical Evaluation of Wet Biomarkers for Huntington’s Disease: Current Status and Ways Forward. J. Huntington’s Dis. 2018, 7, 109–135. [Google Scholar] [CrossRef] [Green Version]
- Korkmaz, K.S.; Butuner, B.D.; Roggenbuck, D. Detection of 8-OHdG as a diagnostic biomarker. J. Lab. Precis. Med. 2018, 3, 95. [Google Scholar] [CrossRef]
- Guo, C.; Li, X.; Wang, R.; Yu, J.; Ye, M.; Mao, L.; Zhang, S.; Zheng, S. Association between Oxidative DNA Damage and Risk of Colorectal Cancer: Sensitive Determination of Urinary 8-Hydroxy-2′-deoxyguanosine by UPLC-MS/MS Analysis. Sci. Rep. 2016, 6, 32581. [Google Scholar] [CrossRef] [PubMed] [Green Version]
- Sanchez, M.; Roussel, R.; Hadjadj, S.; Moutairou, A.; Marre, M.; Velho, G.; Mohammedi, K. Plasma concentrations of 8-hydroxy-2′-deoxyguanosine and risk of kidney disease and death in individuals with type 1 diabetes. Diabetologia 2017, 61, 977–984. [Google Scholar] [CrossRef] [PubMed] [Green Version]
- di Minno, A.; Turnu, L.; Porro, B.; Squellerio, I.; Cavalca, V.; Tremoli, E.; di Minno, M.N.D. 8-Hydroxy-2-Deoxyguanosine Levels and Cardiovascular Disease: A Systematic Review and Meta-Analysis of the Literature. Antioxid. Redox Signal. 2016, 24, 548–555. [Google Scholar] [CrossRef] [PubMed] [Green Version]
- Hakoda, M.; Ichida, K. Genetic Basis of the Epidemiological Features and Clinical Significance of Renal Hypouricemia. Biomedicines 2022, 10, 1696. [Google Scholar] [CrossRef] [PubMed]
- Maesaka, J.; Fishbane, S. Regulation of renal urate excretion: A critical review. Am. J. Kidney Dis. 1998, 32, 917–933. [Google Scholar] [CrossRef]
- Hoerr, R.A.; Matthews, D.E.; Bier, D.M.; Young, V.R. Effects of protein restriction and acute refeeding on leucine and lysine kinetics in young men. Am. J. Physiol. Metab. 1993, 264, E567–E575. [Google Scholar] [CrossRef]
- Matthews, D.E. Review of Lysine Metabolism with a Focus on Humans. J. Nutr. 2020, 150, S2548–S2555. [Google Scholar] [CrossRef]
- Procter, A.W.; Palmer, A.M.; Francis, P.T.; Lowe, S.L.; Neary, D.; Murphy, E.; Doshi, R.; Bowen, D.M. Evidence of Glutamatergic Denervation and Possible Abnormal Metabolism in Alzheimer’s Disease. J. Neurochem. 1988, 50, 790–802. [Google Scholar] [CrossRef]
- Zhang, Y.; He, X.; Qian, Y.; Xu, S.; Mo, C.; Yan, Z.; Yang, X.; Xiao, Q. Plasma branched-chain and aromatic amino acids correlate with the gut microbiota and severity of Parkinson’s disease. npj Park. Dis. 2022, 8, 48. [Google Scholar] [CrossRef]
- Yang, F.; Wu, S.-C.; Ling, Z.-X.; Chao, S.; Zhang, L.-J.; Yan, X.-M.; He, L.; Yu, L.-M.; Zhao, L.-Y. Altered Plasma Metabolic Profiles in Chinese Patients With Multiple Sclerosis. Front. Immunol. 2021, 12, 792711. [Google Scholar] [CrossRef]
- Barison, G.A.d.S.; D’Amora, P.; Izidoro, M.A.; Corinti, M.; Martins, L.M.; Bonduki, C.E.; Castro, R.D.A.; Girão, M.J.B.C.; Gomes, M.T.V. Metabolomic Profiling of Peripheral Plasma by GC-MS and Correlation with Size of Uterine Leiomyomas. J. Endocr. Soc. 2022, 6, bvac061. [Google Scholar] [CrossRef] [PubMed]
- Baranyi, A.; Amouzadeh-Ghadikolai, O.; Von Lewinski, D.; Rothenhäusler, H.-B.; Theokas, S.; Robier, C.; Mangge, H.; Reicht, G.; Hlade, P.; Meinitzer, A. Branched-Chain Amino Acids as New Biomarkers of Major Depression —A Novel Neurobiology of Mood Disorder. PLoS ONE 2016, 11, e0160542. [Google Scholar] [CrossRef] [PubMed] [Green Version]
- Rodrigues, F.B.; Byrne, L.M.; Lowe, A.J.; Tortelli, R.; Heins, M.; Flik, G.; Johnson, E.B.; de Vita, E.; Scahill, R.I.; Giorgini, F.; et al. Kynurenine pathway metabolites in cerebrospinal fluid and blood as potential biomarkers in Huntington’s disease. J. Neurochem. 2021, 158, 539–553. [Google Scholar] [CrossRef] [PubMed]
- Smith, C.C.; Bowen, D.M.; Francis, P.T.; Snowden, J.S.; Neary, D. Putative amino acid transmitters in lumbar cerebrospinal fluid of patients with histologically verified Alzheimer’s dementia. J. Neurol. Neurosurg. Psychiatry 1985, 48, 469–471. [Google Scholar] [CrossRef]
- Madeira, C.; Vargas-Lopes, C.; Brandão, C.O.; Reis, T.; Laks, J.; Panizzutti, R.; Ferreira, S.T. Elevated Glutamate and Glutamine Levels in the Cerebrospinal Fluid of Patients with Probable Alzheimer’s Disease and Depression. Front. Psychiatry 2018, 9, 561. [Google Scholar] [CrossRef] [Green Version]
- Xie, A.; Gao, J.; Xu, L.; Meng, D. Shared Mechanisms of Neurodegeneration in Alzheimer’s Disease and Parkinson’s Disease. BioMed Res. Int. 2014, 2014, 648740. [Google Scholar] [CrossRef]
- Flavin, W.P.; Bousset, L.; Green, Z.C.; Chu, Y.; Skarpathiotis, S.; Chaney, M.J.; Kordower, J.H.; Melki, R.; Campbell, E.M. Endocytic vesicle rupture is a conserved mechanism of cellular invasion by amyloid proteins. Acta Neuropathol. 2017, 134, 629–653. [Google Scholar] [CrossRef]


Disclaimer/Publisher’s Note: The statements, opinions and data contained in all publications are solely those of the individual author(s) and contributor(s) and not of MDPI and/or the editor(s). MDPI and/or the editor(s) disclaim responsibility for any injury to people or property resulting from any ideas, methods, instructions or products referred to in the content. |
© 2023 by the authors. Licensee MDPI, Basel, Switzerland. This article is an open access article distributed under the terms and conditions of the Creative Commons Attribution (CC BY) license (https://creativecommons.org/licenses/by/4.0/).
Share and Cite
Maszka, P.; Kwasniak-Butowska, M.; Cysewski, D.; Slawek, J.; Smolenski, R.T.; Tomczyk, M. Metabolomic Footprint of Disrupted Energetics and Amino Acid Metabolism in Neurodegenerative Diseases: Perspectives for Early Diagnosis and Monitoring of Therapy. Metabolites 2023, 13, 369. https://doi.org/10.3390/metabo13030369
Maszka P, Kwasniak-Butowska M, Cysewski D, Slawek J, Smolenski RT, Tomczyk M. Metabolomic Footprint of Disrupted Energetics and Amino Acid Metabolism in Neurodegenerative Diseases: Perspectives for Early Diagnosis and Monitoring of Therapy. Metabolites. 2023; 13(3):369. https://doi.org/10.3390/metabo13030369
Chicago/Turabian StyleMaszka, Patrycja, Magdalena Kwasniak-Butowska, Dominik Cysewski, Jaroslaw Slawek, Ryszard T. Smolenski, and Marta Tomczyk. 2023. "Metabolomic Footprint of Disrupted Energetics and Amino Acid Metabolism in Neurodegenerative Diseases: Perspectives for Early Diagnosis and Monitoring of Therapy" Metabolites 13, no. 3: 369. https://doi.org/10.3390/metabo13030369