Article

A Comprehensive Analysis to Elucidate the Effects of Spraying Mineral Elements on the Accumulation of Flavonoids in Epimedium sagittatum during the Harvesting Period

1
Henan Provincial Ecological Planting Engineering Technology Research Center of Daodi Herbs, School of Pharmacy, Henan University of Chinese Medicine, Zhengzhou 450046, China
2
Co-Construction Collaborative Innovation Centre for Chinese Medicine and Respiratory Diseases by Henan & Education Ministry of PR China, Henan University of Chinese Medicine, Zhengzhou 450046, China
3
Rural Agriculture Bureau of Pingyu County, Zhumadian 463499, China
*
Authors to whom correspondence should be addressed.
Metabolites 2023, 13(2), 294; https://doi.org/10.3390/metabo13020294
Submission received: 9 January 2023 / Revised: 10 February 2023 / Accepted: 14 February 2023 / Published: 16 February 2023
(This article belongs to the Special Issue Secondary Metabolites from Plant Sources)

Abstract

:
The harvesting period is a critical period for the accumulation of flavonoids in the leaves of the important medicinal plant Epimedium sagittatum. In this study, we conducted an experiment on E. sagittatum leaves sprayed with mineral elements with the aim of improving the quality of the herbal leafage during the harvesting period. We elucidated the changes in flavonoids (icariin, epimedin A, epimedin B, and epimedin C) in E. sagittatum leaves. The sum of main flavonoids content reached a maximum (11.74%) at 20 days after the high-concentration Fe2+ (2500 mg·L−1) treatment. We analyzed the FT-IR spectra characteristics of E. sagittatum leaf samples using the FT-IR technique, and constructed an OPLS-DA model and identified characteristic peaks to achieve differentiated identification of E. sagittatum. Further, widely untargeted metabolomic analysis identified different classes of metabolites. As the most important characteristic flavonoids, the relative contents of icariin, icaritin, icariside I, and icariside II were found to be up-regulated by high-Fe2+ treatment. Our experimental results demonstrate that high-concentration Fe2+ treatment is an effective measure to increase the flavonoids content in E. sagittatum leaves during the harvesting period, which can provide a scientific basis for the improvement of E. sagittatum leaf cultivation agronomic measures.

Graphical Abstract

1. Introduction

Epimedium folium (yin yang huo in Chinese), a yang-invigorating herb, is a commonly used herbal leafage (a class of Chinese herbs used as medicine) that has been used for over 2000 years in China [1]. Epimedium folium is derived from the dried leaves of Epimedium sagittatum, E. brevicomu, E. pubescens, and E. koreanum of the genus Berberidaceae, and is one of the most widely used Chinese herbs in the Chinese Pharmacopoeia [2]. There are about 60 species of Epimedium in the family Berberaceae, of which more than 50 species are concentrated in southwest and central China [3,4], and although they are not all included in the Chinese Pharmacopoeia, they are still used to a small extent in folklore. Modern pharmacological studies have shown that Epimedium folium plays an active role in the treatment of hypertension, coronary heart disease, osteoporosis, menopausal syndrome, impotence, hemiplegia, and numbness of the limbs [5,6,7]. Against the background of advocating the development of Traditional Chinese Medicine, as the use of Epimedium folium rises year by year, its market demand also gradually expands, and the current wild-harvested Epimedium folium (the main source) can no longer meet the huge consumer demand. Thus, seeking effective measures to improve the quality of Epimedium folium under artificial cultivation conditions and expanding Epimedium folium production is one of the paths that must be developed in the agricultural production of traditional Chinese medicine at present.
E. sagittatum is a medicinal plant, the leaves of which are the main medicinal part [8], and its main bioactive components are flavonoids (mainly icariin, epimedin A, epimedin B, and epimedin C), commonly used for kidney yang deficiency, impotence and spermatorrhea, tendon impotence, and other symptoms [9]. In particular, the main bioactive component is icariin, which has the biological activities of multi-target anti-inflammatory and anti-tumor immune regulation [10], and its safety and efficacy have been demonstrated in phase I, II, and III clinical trials in advanced hepatocellular carcinoma cells in China [11,12]. It has thus attracted much attention. With the launch of a new drug (icaritin soft capsule) in China, the demand for E. sagittatum is further increasing. Therefore, under the current situation that the wild resources of E. sagittatum are gradually being depleted, how to increase flavonoids content, as well as plant biomass under artificial cultivation, is one of the urgent problems that needs to be solved. Determining the appropriate time for harvesting in agricultural production is particularly important for medicinal plants (herbal medicines) [13]. This is because the period of highest bioactive component content in medicinal plants often does not coincide with the period of greatest biomass. For example, the traditional Chinese medicine Artemisae scopariae Herba is derived from the dried above-ground part of Artemisae scopariae and A. capillaris, which requires that A. scopariae and A. capillaris must be harvested in the spring, when they are a young seedling, or in the fall, when the flower buds have grown to the point of flower removal for use in medicine [14]. Lippia alba is widely used as a seasoning and traditional medicine in Brazil; in it, phenylpropanoids are predominant in winter, while flavonoids are predominant in summer, and other major secondary metabolites’ contents vary with the month [15]. For E. sagittatum, which is used as a herbal leafage, the main bioactive components, flavonoids, tend to decrease gradually as the leaves mature [16], so the contents of the bioactive components that are sought do not reach the maximum at the time of harvesting in autumn. For this reason, the search for effective measures to increase the flavonoids content of E. sagittatum during the autumn harvesting period is practical and effective in relation to the improvement of artificial cultivation techniques.
In the process of cultivating medicinal plants, fertilizers provide essential nutrients, and improve soil properties and soil fertility [17]. Foliar fertilizer can be applied directly to the foliage of medicinal plants, and can thus be used as a supplement to soil fertilizer and has the characteristics of fast fertilization effects, high nutrient utilization rate, and low environmental pollution [18]. A study by Bayram et al. on Pistacia lentiscus var. chia (an important medicinal aromatic plant) showed that the foliar spraying of Zn2+ increased the β-myrcene, germacrene-D, and α-pinene contents, particularly at 100% leafing [19]. Studies on red rice (a Oryza sativa with functional food potential) found that spraying with Fe2+ could promote the accumulation of procyanidin in grains by up-regulating the expressions of F3H and ANS genes [20]. Spraying Cu2+ on Mentha spicata is conducive to the biosynthesis of its major volatile oil components, resulting in significant changes in the yield and components of volatile oil [21]. For artificially cultivated E. sagittatum, the biomass of its leaves stabilizes during the harvesting period of autumn, but it is not clear whether its flavonoid content can be increased by spraying with mineral elements. Therefore, conducting relevant studies to elucidate the effects of spraying mineral elements on the flavonoid contents of E. sagittatum leaves is of practical importance to developing a simple operational technique that can improve the quality of medicinal herbs.
In order to elucidate the effects of spraying with mineral elements on the flavonoid’s accumulation of E. sagittatum leaves in a comprehensive analysis, we conducted an experiment on the changes of flavonoid contents in E. sagittatum leaves after spraying with different concentrations of mineral elements (Fe2+ Cu2+ and Zn2+), with the aim of improving the quality of the herbal leafage during the harvesting period. We analyzed the changes in flavonoid (icariin, epimedin A, epimedin B, and epimedin C) contents after 10 and 20 days of spraying with mineral elements, using the high-performance liquid chromatography (HPLC) technique as the quantitative analysis, and outlined the characteristics of the Fourier transform infrared (FT-IR) spectra of different E. sagittatum samples as the qualitative analysis. In addition, we further analyzed the effects of spraying high concentrations of Fe2+ on the synthesis of secondary metabolites in E. sagittatum leaves during harvesting, using widely untargeted metabolomic techniques. This study can provide a scientific basis for the improvement of agronomic cultivation measures during the harvesting period of E. sagittatum.

2. Materials and Methods

2.1. Experimental Materials and Treatment Methods

Three-year-old Epimedium sagittatum experimental materials (Figure 1) were planted at the standardized planting base used for medicinal plants in Zhumadian City, Henan Province, PR China (33°0′ N, 114°29′ E). As E. sagittatum is a shade plant, all E. sagittatum plants were planted in special cultivation facilities with about 70~80% net complete shade. During the entire growth cycle of the E. sagittatum plants, workers at the standardized planting base followed the operational specifications for cultivation. The experiment started one month before the harvesting of E. sagittatum plants—the critical period for the accumulation of flavonoid bioactive compounds in E. sagittatum leaves. Aqueous Fe2+ solutions, aqueous Cu2+ solutions, and aqueous Zn2+ solutions of 100 mg·L−1, 1000 mg·L−1, and 2500 mg·L−1, respectively, were prepared for spraying on E. sagittatum leaves. Three different sulfates (FeSO4·7H2O, CuSO4·5H2O, and ZnSO4·7H2O) were purchased from Shanghai Aladdin Biochemical Technology Co., Ltd. To avoid the effects of the different degrees of hydration of different sulfates, we configured the aqueous solution with the mass concentration of metal ions (Fe2+, Cu2+ and Zn2+). Different concentrations of aqueous mineral element solutions were sprayed on the leaves of E. sagittatum in different experimental plots (three 2 m × 4 m areas per plot, arranged according to the randomized complete block design) for three consecutive days (at around 17:00 every day). Equal amounts of water were sprayed on the control group (CK), and the amounts of solution sprayed on each experimental plot were kept the same. The leaves of E. sagittatum were collected at 10 days, 20 days, and 30 days after the completion of the experimental treatments (CK, Fe2+ 100 mg·L−1, Fe2+ 1000 mg·L−1, Fe2+ 2500 mg·L−1, Cu2+ 100 mg·L−1, Cu2+ 1000 mg·L−1, Cu2+ 2500 mg·L−1, Zn2+ 100 mg·L−1, Zn2+ 1000 mg·L−1, and Zn2+ 2500 mg·L−1). The collected leaves of E. sagittatum were placed in an oven and dried at 50 °C. The dried leaves of E. sagittatum were crushed into powder and passed through a sieve (No. 3) to obtain samples for HPLC and FT-IR analysis.

2.2. Determination of the Four Flavonoids’ Contents in E. sagittatum Leaves by HPLC

The powdered sample (0.2 g) was accurately weighed and placed in a conical flask with a stopper. Then, 20 mL of aqueous ethanol solution (75:25, v/v) was added to the conical flask and weighed. The conical flask was shaken in an ultrasonic bath at 35 °C (power 400 W, frequency 50 KHz) for 30 s and then sonicated for 60 min. After cooling the conical flask, it was weighed, and the weight loss was replenished with ethanol aqueous solution (75:25, v/v). It was then shaken well and filtered through a 0.45 μm filter for HPLC analysis. The contents of icariin, epimedin A, epimedin B, and epimedin C in the sample solutions were determined using a Waters 2695 liquid chromatography system (Waters Corporation, Milford, MA, USA) equipped with an Agilent ZORBAX SB-C18 column (4.6 mm × 150 mm, 5 μm). Methanolic aqueous solutions containing icariin, epimedin A, epimedin B, and epimedin C (standards) were prepared and diluted to the appropriate concentrations to establish the calibration curves. The elution procedure, operating conditions, and calibration curves of the liquid chromatography system were as reported in our previous paper [22]. The chromatogram of the mixed standards and samples of E. sagittatum is shown in Figure S1. The sums of the main flavonoid contents in the samples were calculated based on the total amounts of icariin, epimedin A, epimedin B, and epimedin C determined by HPLC.

2.3. Establishment of FT-IR Spectra of E. sagittatum Leaf Samples

Sample preparation for FT-IR analysis: The powder of the sample (0.006 g) and the dried potassium bromide (0.6 g) were accurately weighed, respectively, and they were ground thoroughly in a natural agate mortar to obtain a mixed powder. The mixed powder (0.01 g) was accurately weighed, transferred to a press mold, spread evenly, and then pressed for 5 s at 10 MPa using a tablet press to obtain the sample to be tested. The samples to be tested were further selected for homogeneity and transparency, without obvious particles or broken cracks, for FT-IR analysis. Blank samples were made using unadulterated and dried potassium bromide following the above steps.
Operating conditions for sample scanning: The sample scanning was performed with a Fourier transform infrared spectrometer (INVENIO-S, Bruker, Bremen, Germany). The scanning resolution was 4 cm−1 with blank samples as the background, and the rates of sample scans and background scans were both 32 times/s. The scanning range was 4000~400 cm−1, and the interference of H2O and CO2 was deducted during the scanning. Five spectra were acquired for each sample.

2.4. Widely Untargeted Metabolomic Analysis of E. sagittatum Leaves

In order to further explain the effect of Fe2+ (2500 mg·L−1) treatment on the E. sagittatum leaves’ metabolite changes, we used a widely untargeted metabolomic to analyze the changes of metabolites in the Fe2+ treatment (n = 6) and CK (n = 6). This widely untargeted metabolomic was completed by LC-Bio Technologies (Hangzhou, China) Co., Ltd. The basic data and data identification results can be found in our previous papers [22]. This widely untargeted metabolomic was carried out on an ultra-performance liquid chromatography (UPLC)-MS/MS system connected to a high-resolution tandem mass spectrometer. A UPLC (UltiMate 3000 HPLC, Thermo Fisher Scientific, Waltham, MA, USA) and a Q-Exactive (Thermo Fisher Scientific, Waltham, MA, USA) made up the UPLC-MS/MS system. Metabolomics datasets were analyzed using the open source software metaX [23] (metaX provides several functions, such as peak picking and annotation, pathway annotation, correlation network analysis, and metabolite identification, and it is available at https://www.genomics.cn/ (accessed on 5 January 2023), and differential accumulation metabolites (DAMs) were obtained between Fe2+ and CK in E. sagittatum leaves.

2.5. Statistical Analysis

The HPLC data were processed and statistically analyzed using SPSS software (version 21.0, SPSS Inc., Chicago, IL, USA) by Duncan’s single-factor variance analysis and Pearson correlation analysis. The raw data of the FT-IR spectra were retrieved using OMNIC software (version 9.2, Nicolet, Madison, WI, USA), and orthogonal partial least squares discriminant analysis (OPLS-DA) of the characteristic absorption peaks of FT-IR spectra was performed using SIMCA-P software (version 14.1, Umetrics, Vasterbottens Lan, Sweden). The statistically analyzed data were graphically presented using the GraphPad Prism software (version 9.0, GraphPad Software Inc., San Diego, CA, USA).

3. Results

3.1. The Four Flavonoids’ Contents in E. sagittatum Leaves

The sums of the main flavonoids’ contents, calculated by adding together the contents of icariin, epimedin A, epimedin B, and epimedin C in E. sagittatum leaves after 10 days, 20 days, and 30 days of treatment, are shown in Figure 2A. We observed that the sums of the main flavonoid contents in E. sagittatum leaves showed a significant increase at 10 days, 20 days, and 30 days after spraying with different concentrations of mineral elements. At 10 days after spraying with mineral elements, the contents of the main flavonoids in each treatment group ranged from 9.68% to 10.88%, which increased by 28.32% to 44.25% relative to CK (the sum of main flavonoids content in CK was 7.55%). At this time, the sum of the main flavonoids content in the treatment group (Fe2+ 2500 mg·L−1) was the highest, reaching 10.88%, and the sum of the main flavonoids content was significantly enhanced (p < 0.05). At 20 days after spraying with mineral elements, the contents of the main flavonoids in each treatment group ranged from 9.70% to 11.74%, which increased by 22.57% to 48.39% relative to CK (the sum of main flavonoids content in CK was 7.91%). At this time, the sum of the main flavonoids’ contents in the treatment group (Fe2+ 2500 mg·L−1) was the highest, reaching 11.74%, and the sum of the main flavonoids’ contents was significantly enhanced (p < 0.05). At 30 days after spraying with mineral elements, the content of the main flavonoids in each treatment group ranged from 9.11% to 11.10%, which increased by 21.75% to 48.40% relative to CK (the sum of main flavonoids content in CK was 7.48%). At this time, the sum of the main flavonoids’ contents in the treatment group (Fe2+ 2500 mg·L−1) was the highest, reaching 11.74%, and the sum of the main flavonoids’ contents was significantly enhanced (p < 0.05). The overall data we derived reflect that spraying with high concentrations of Fe2+ had the best effect in enhancing the sum of the main flavonoids’ contents in E. sagittatum leaves.
The effects of spraying Fe2+, Cu2+, and Zn2+ on the contents of the four flavonoid components (icariin, epimedin A, epimedin B, and epimedin C) in E. sagittatum leaves are presented in Figure 2B, Figure 2C, and Figure 2D, respectively. Figure 2B presents the changes in the contents of the four flavonoid components in E. sagittatum leaves at 10 days, 20 days, and 30 days after spraying with Fe2+ at low concentrations (100 mg·L−1), medium concentrations (1000 mg·L−1), and high concentrations (2500 mg·L−1). After spraying with high concentrations of Fe2+ (2500 mg·L−1), the contents of icariin, epimedin A, and epimedin C in E. sagittatum leaves reached their maximum values at 20 days, at 2.59%, 0.20%, and 8.80%, respectively, which increased by 52.77%, 54.74%, and 47.15%, respectively, relative to CK (p < 0.05). The content of epimedin B reached a maximum (0.17%) at 20 days after the low-concentration (100 mg·L−1) Fe2+ treatment, which increased by 60.07% compared to CK (p < 0.05).
Figure 2C presents the changes in the contents of the four flavonoid components in E. sagittatum leaves at 10 days, 20 days, and 30 days after spraying with Cu2+ at low concentrations (100 mg·L−1), medium concentrations (1000 mg·L−1), and high concentrations (2500 mg·L−1). The content of icariin reached a maximum (2.21%) at 20 days after the low concentration (100 mg·L−1) of Cu2+ treatment, which increased by 30.41% compared to CK (p < 0.05). The content of epimedin A reached a maximum (0.18%) at 20 days after the low-concentration (100 mg·L−1) and high-concentration (2500 mg·L−1) Cu2+ treatment, which increased by 39.63% compared to CK (p < 0.05). The content of epimedin B reached a maximum (0.16%) at 20 days and 30 days after the high-concentration (2500 mg·L−1) Cu2+ treatment, which increased by 51.80% compared to CK (p < 0.05). The content of epimedin C reached a maximum (8.39%) at 30 days after the medium concentration (1000 mg·L−1) of Cu2+ treatment, which increased by 47.34% compared to CK (p < 0.05).
Figure 2D presents the changes in the contents of the four flavonoid components in E. sagittatum leaves at 10 days, 20 days, and 30 days after spraying with Zn2+ at low concentrations (100 mg·L−1), medium concentrations (1000 mg·L−1), and high concentrations (2500 mg·L−1). The content of icariin reached a maximum (2.25%) at 30 days after the low concentration (100 mg·L−1) of Zn2+ treatment, which increased by 46.58% compared to CK (p < 0.05). After spraying with a low concentration of Zn2+ (100 mg·L−1), the contents of epimedin A, epimedin B, and epimedin C in E. sagittatum leaves reached their maximum values at 10 days, and at 0.24%, 0.19%, and 8.06%, respectively, which increased by 79.80%, 80.44%, and 39.40%, respectively, relative to CK (p < 0.05).

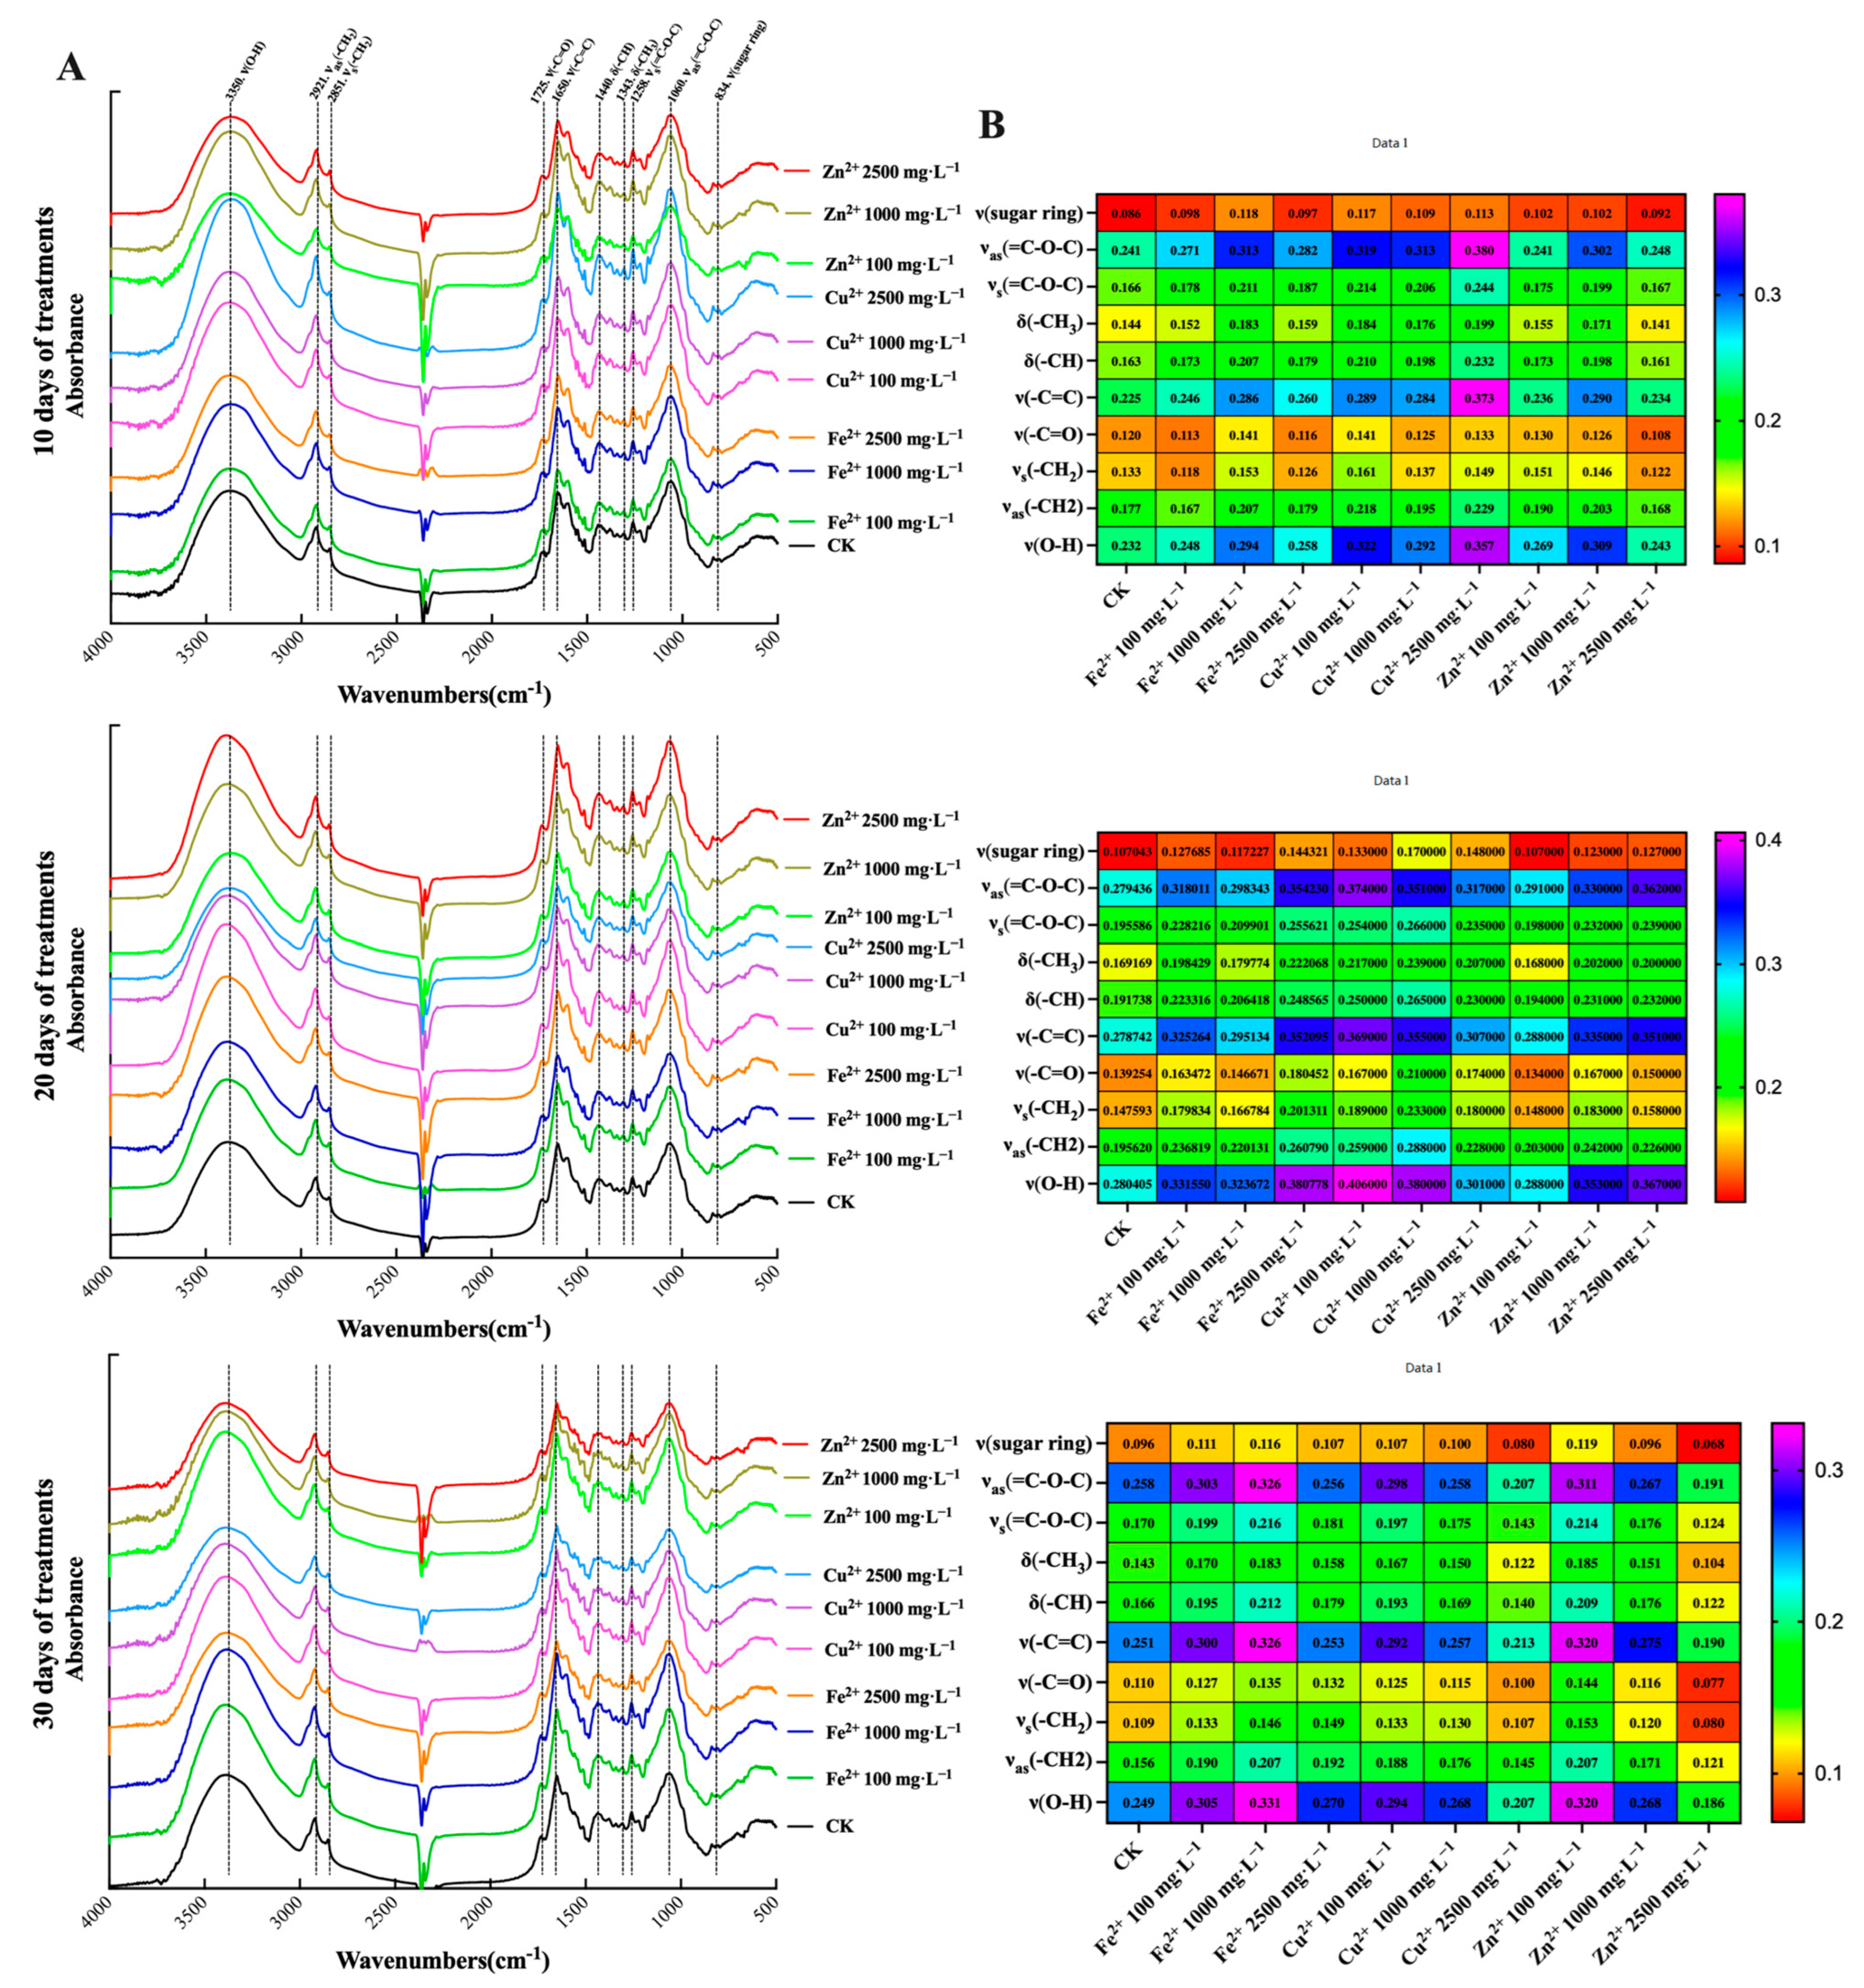
3.2. The FT-IR Spectra Characteristics in E. sagittatum Leaves

The FT-IR spectra between 4000 and 500 cm−1 in E. sagittatum leaves at 10 days, 20 days, and 30 days after spraying with Fe2+, Cu2+, and Zn2+ at low concentrations (100 mg·L−1), medium concentrations (1000 mg·L−1), and high concentrations (2500 mg·L−1) are presented in Figure 3. As shown in the FT-IR spectra between 4000 and 500 cm−1 (Figure 3A), some peaks, including peak 3350, peak 2921, peak 2851, peak 1725, peak 1650, peak 1440, peak 1343, peak 1258, and peaks 1069 and 834 cm−1, emerged [24,25,26]. The assignment of functional groups responsible for IR absorption were carried out as follows: (1) absorption peak near 3350 cm−1, O–H stretching vibration, ν(O–H); (2) absorption peak near 2921 cm−1, –CH2 asymmetrical stretching vibration, νas(–CH2); (3) absorption peak near 2851 cm−1, –CH2 symmetrical stretching vibration, νs(–CH2); (4) absorption peak near 1725 cm−1, –C=O stretching vibration, ν(–C=O); (5) absorption peak near 1650 cm−1, –C=C stretching vibration, ν(–C=C); (6) absorption peak near 1440 cm−1, –CH bending vibration, δ(–CH); (7) absorption peak near 1343 cm−1, –CH3 bending vibration, δ(–CH3); (8) absorption peak near 1258 cm−1, =C–O–C symmetrical stretching vibration, νs(=C–O–C); (9) absorption peak near 1069 cm−1, =C–O–C asymmetrical stretching vibration, νas(=C–O–C); (10) absorption peak near 834 cm−1, sugar ring stretching vibration, ν(sugar ring). The above 10 characteristic absorption peaks in the FT-IR spectra of the E. sagittatum leaves changed significantly at 10 days, 20 days, and 30 days after treatment with different concentrations of mineral elements.
The absorbance variations of the above 10 characteristic absorption peaks at 10 days, 20 days, and 30 days after treatment with different concentrations of mineral elements are presented in Figure 3B. At 10 days after spraying with mineral elements, the absorbances of the peaks ν(O–H), ν(–C=C), and νas(=C–O–C) were significantly up-regulated in treatment group Fe2+ 1000 mg·L−1, treatment group Cu2+ 100 mg·L−1, treatment group Cu2+ 1000 mg·L−1, treatment group Cu2+ 2500 mg·L−1, and treatment group Zn2+ 1000 mg·L−1. In treatment group Cu2+ 2500 mg·L−1, the absorbances of the peaks ν(O–H), ν(–C=C), and νas(=C–O–C) were up-regulated from 0.232 to 0.357, from 0.225 to 0.373, and from 0.241 to 0.380, respectively. At 20 days after spraying with mineral elements, the absorbance changes of the peaks ν(O–H), ν(–C=C), and νas(=C–O–C) were more significant. In treatment group Cu2+ 100 mg·L−1, the absorbances of the peaks ν(O–H), ν(–C=C), and νas(=C–O–C) were up-regulated from 0.280 to 0.406, from 0.279 to 0.369, and from 0.279 to 0.374, respectively. At 30 days after spraying with mineral elements, the absorbance changes of the peaks ν(O–H), ν(–C=C), and νas(=C–O–C) were more significant. In treatment group Fe2+ 1000 mg·L−1, the absorbances of the peaks ν(O–H), ν(–C=C), and νas(=C–O–C) were up-regulated from 0.249 to 0.331, from 0.251 to 0.326, and from 0.258 to 0.326, respectively. Overall, the absorbances of the 10 characteristic peaks changed to different degrees with different treatment times and different concentrations of mineral elements.

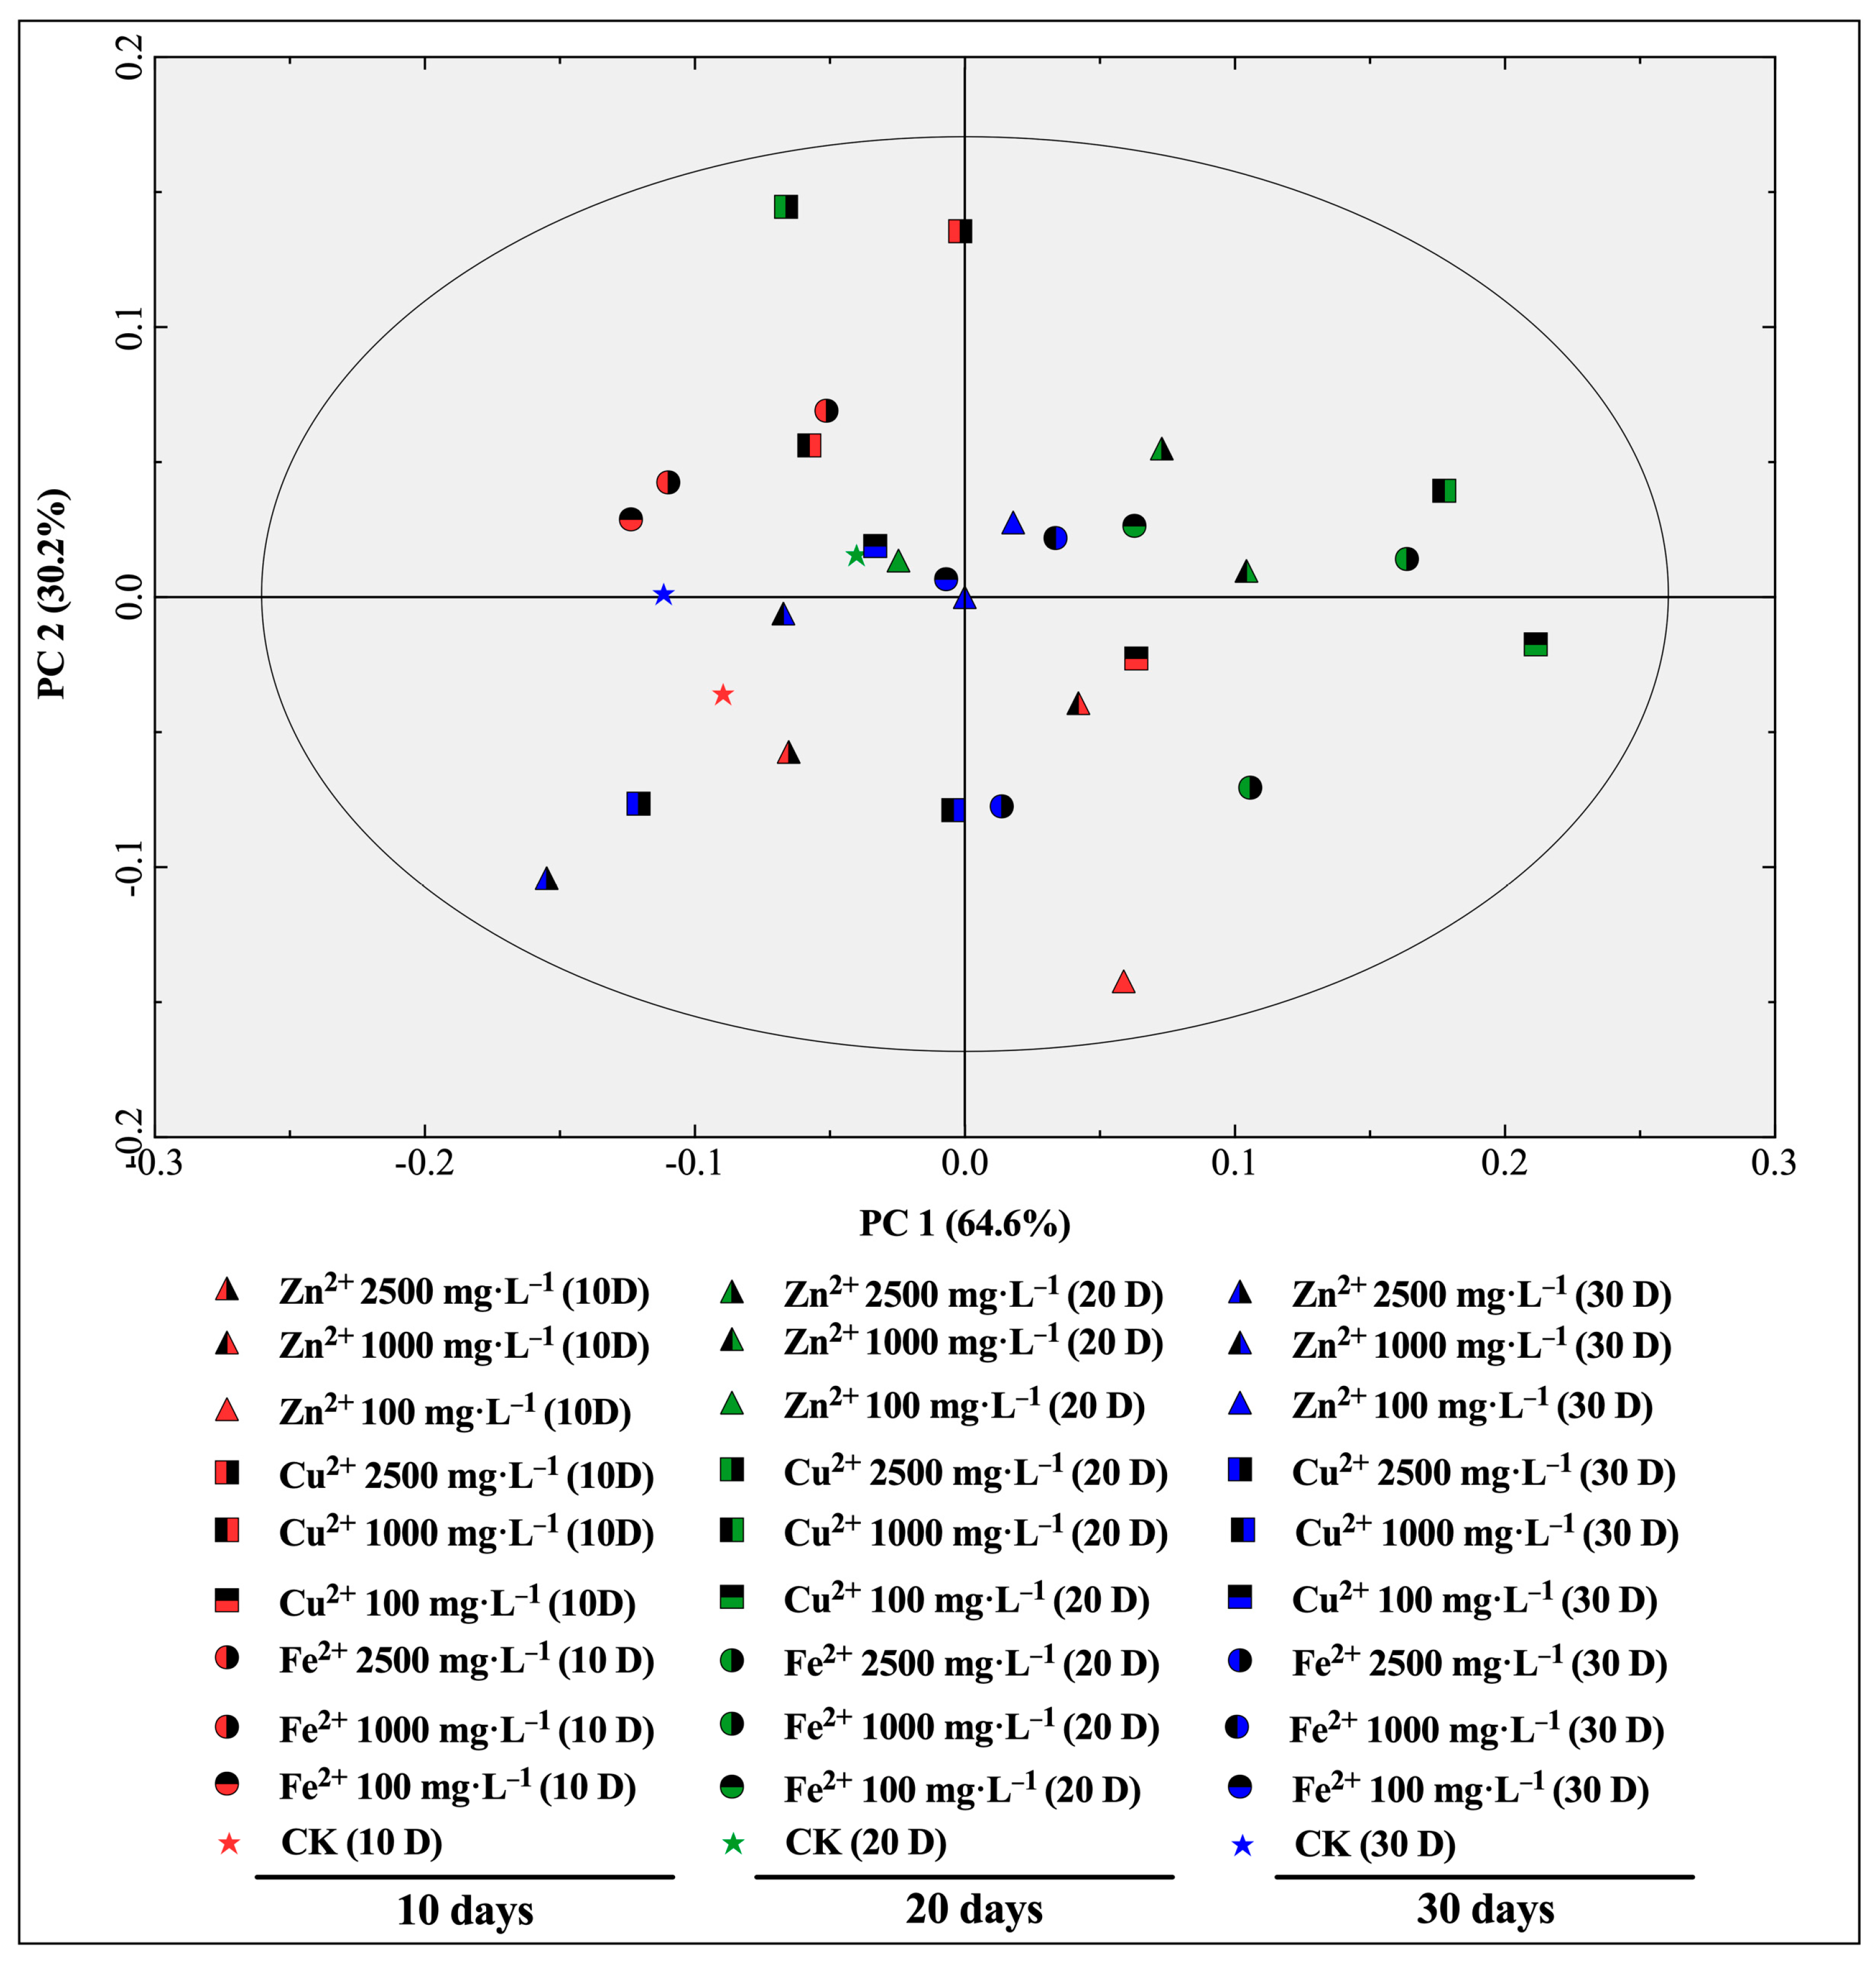
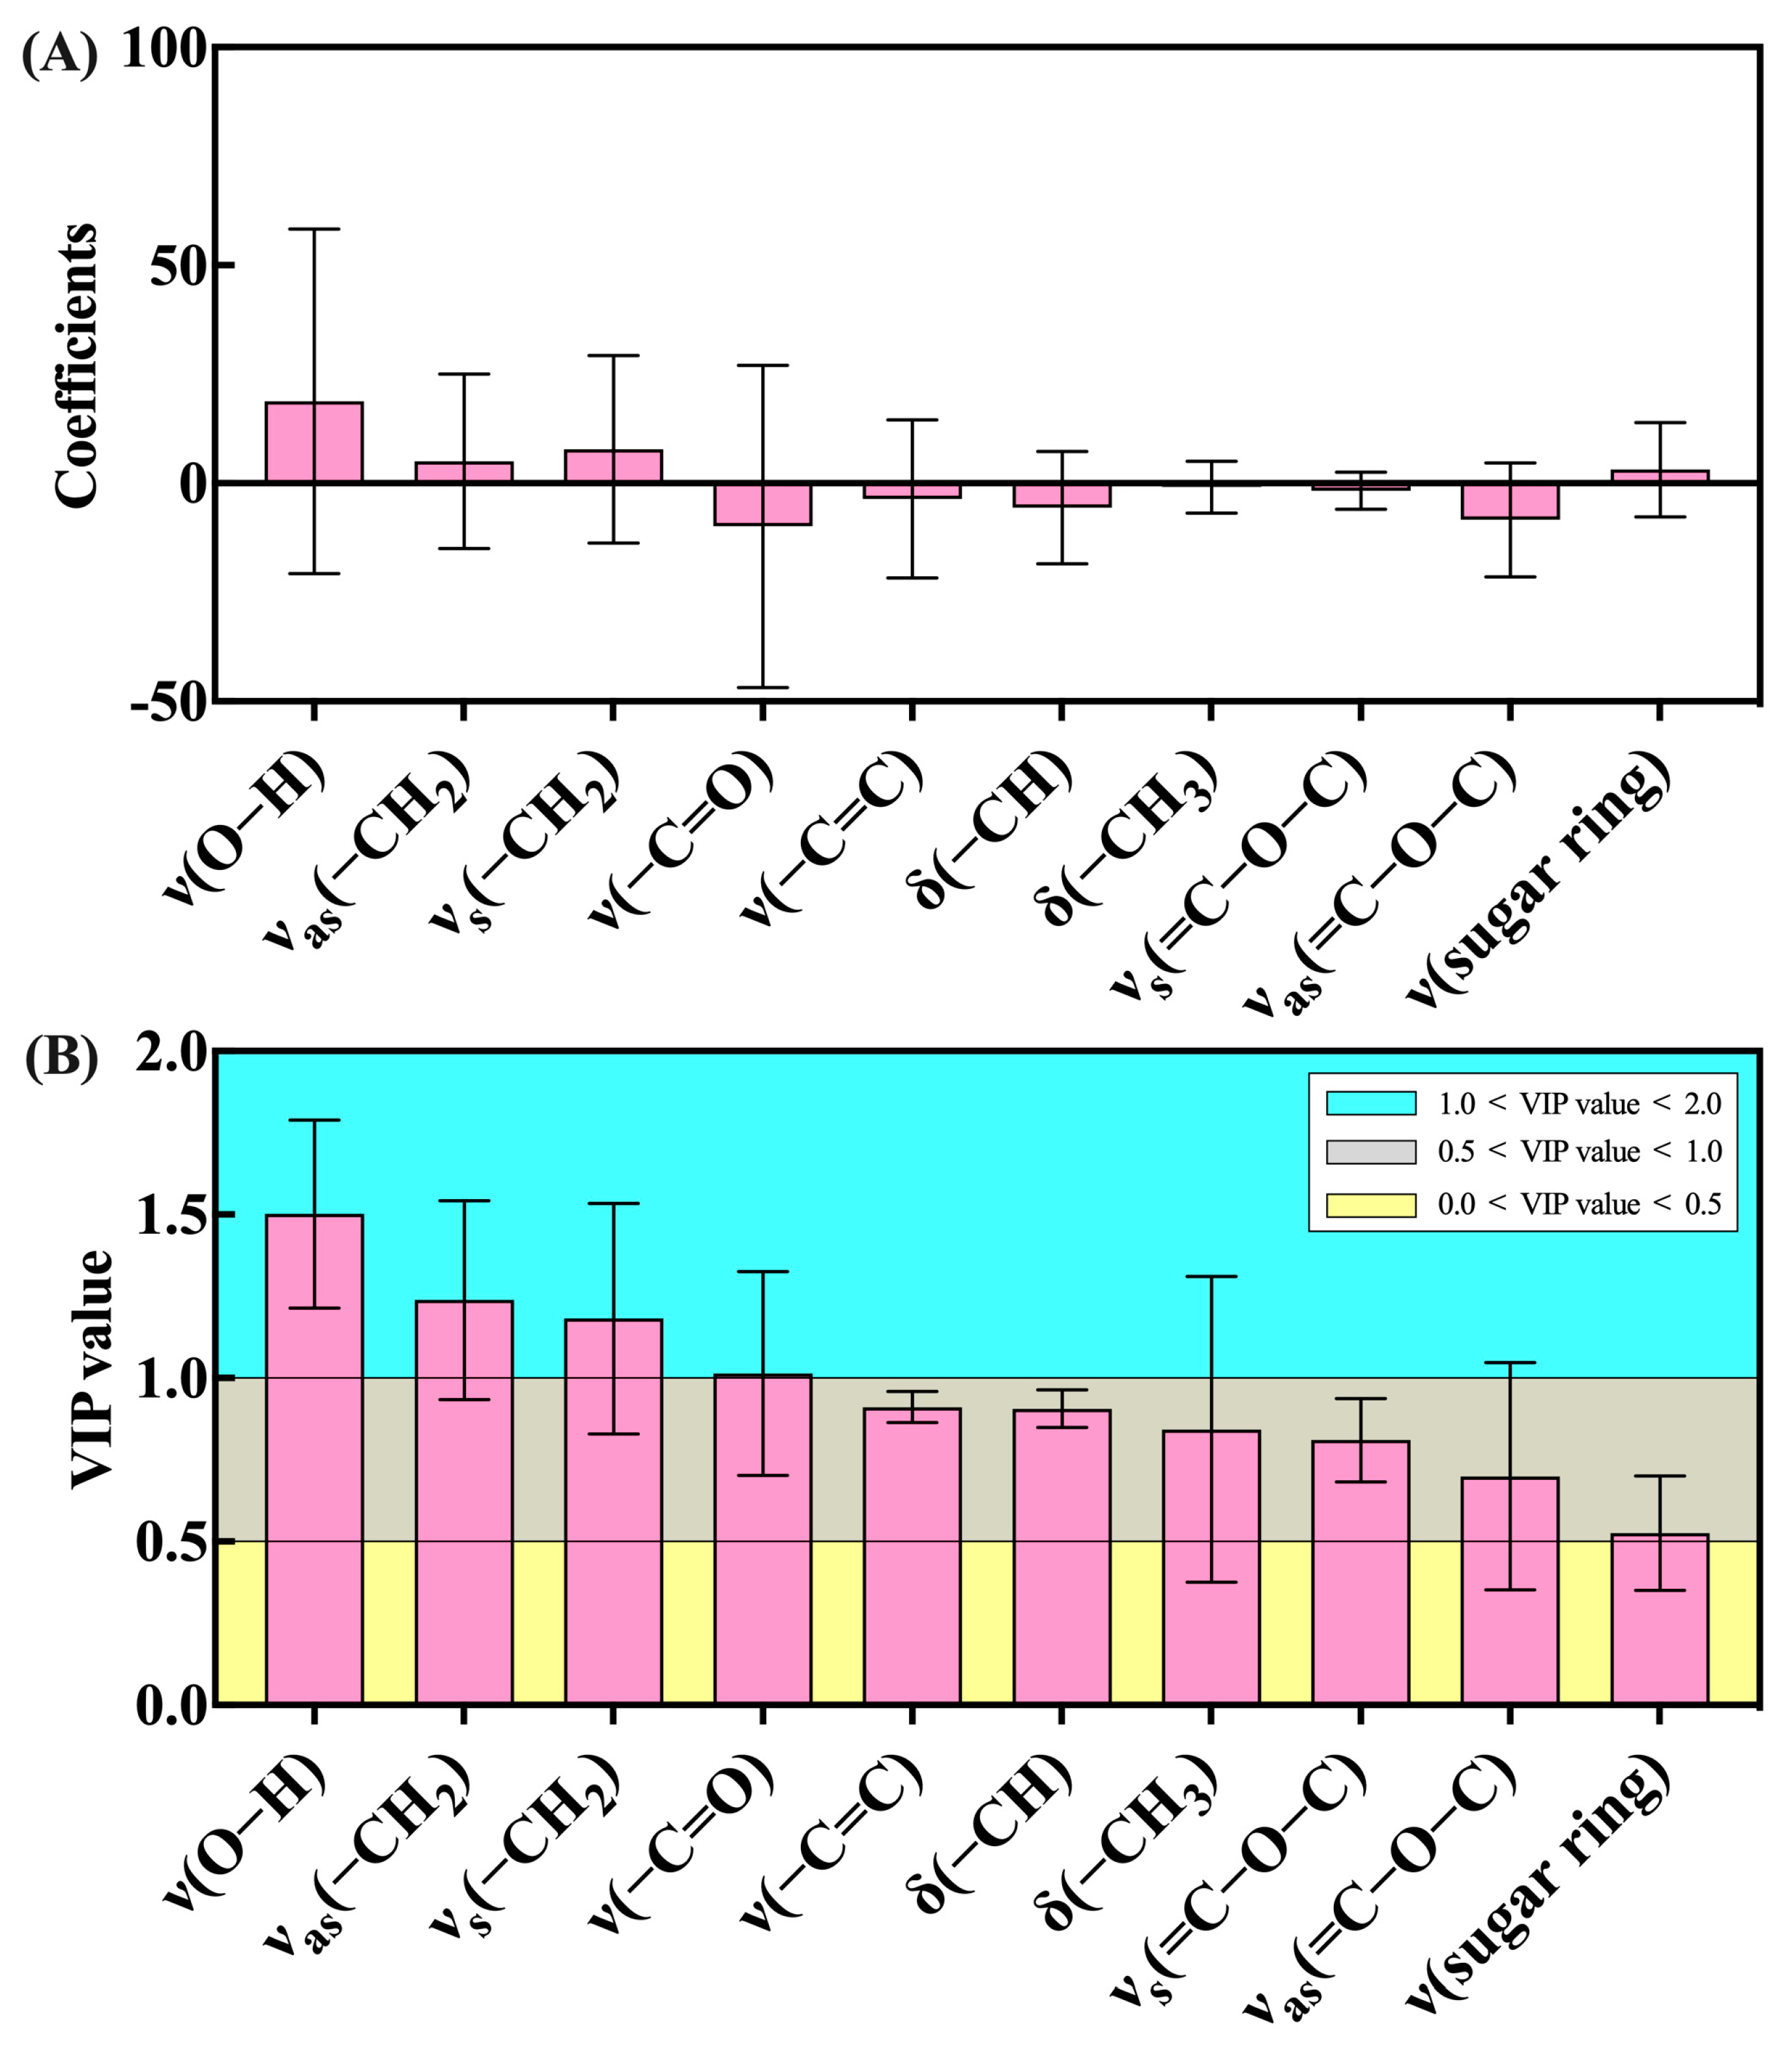
3.3. The OPLS-DA Analysis of FT-IR Characteristic Spectra in E. sagittatum Leaves

The OPLS-DA is a supervised statistical method used for discriminant analysis [27]. The relationship model between the samples subjected to different treatment times and different concentrations of mineral element treatments was established by focusing the classification of samples on principal components using OPLS-DA [28]. As shown in the score scatter plot of the characteristic absorption peaks in E. sagittatum leaves subjected to FT-IR under the OPLS-DA model (Figure 4), the first and second principal component axes (PC 1 and PC 2) explain a significant amount of the total variance (64.6% and 30.2%, respectively). The samples measured at 10 days after treatment are not distributed in the first quadrant, the samples 20 days after treatment are not distributed in the third quadrant, and the samples 30 days after treatment show a scattered distribution. Thus, the established OPLS-DA model provides better differentiation of the 30 samples with different treatment times and different concentrations of mineral elements. The differences in the samples can be identified via qualitative analysis using FT-IR characteristic absorption peaks.
The coefficients plot and variable importance for the projection (VIP) plot of the characteristic absorption peaks in E. sagittatum leaves subjected to FT-IR under the OPLS-DA model are presented by Figure 5. The coefficients plot (Figure 5A) indicates the degree of association of each X variable (absorbance of characteristic absorption peaks) in the system with the whole OPLS-DA model. The characteristic absorption peak ν(O–H) has the highest coefficient (18.81), followed by characteristic absorption peak ν(–C=O) (−9.82) and characteristic absorption peak νas(=C–O–C) (−8.37). The VIP plot (Figure 5B) indicates the intensity and explanatory power of the impact of the differential characteristic absorption peaks on the classification discriminations of each group of samples. A VIP value >1 was used as the screening criterion to obtain the most important characteristic absorption peaks for the classification and discrimination of each group of samples, which were identified as peak ν(O–H), peak ν(–C=C), peak νas(=C–O–C), and peak νas(–CH2). The results show that the OPLS-DA model established in this study has good explanatory and reliable predictive power. Furthermore, the values of the coefficients and VIP can be used to determine the characteristic absorption peaks that contribute the most to the OPLS-DA model.

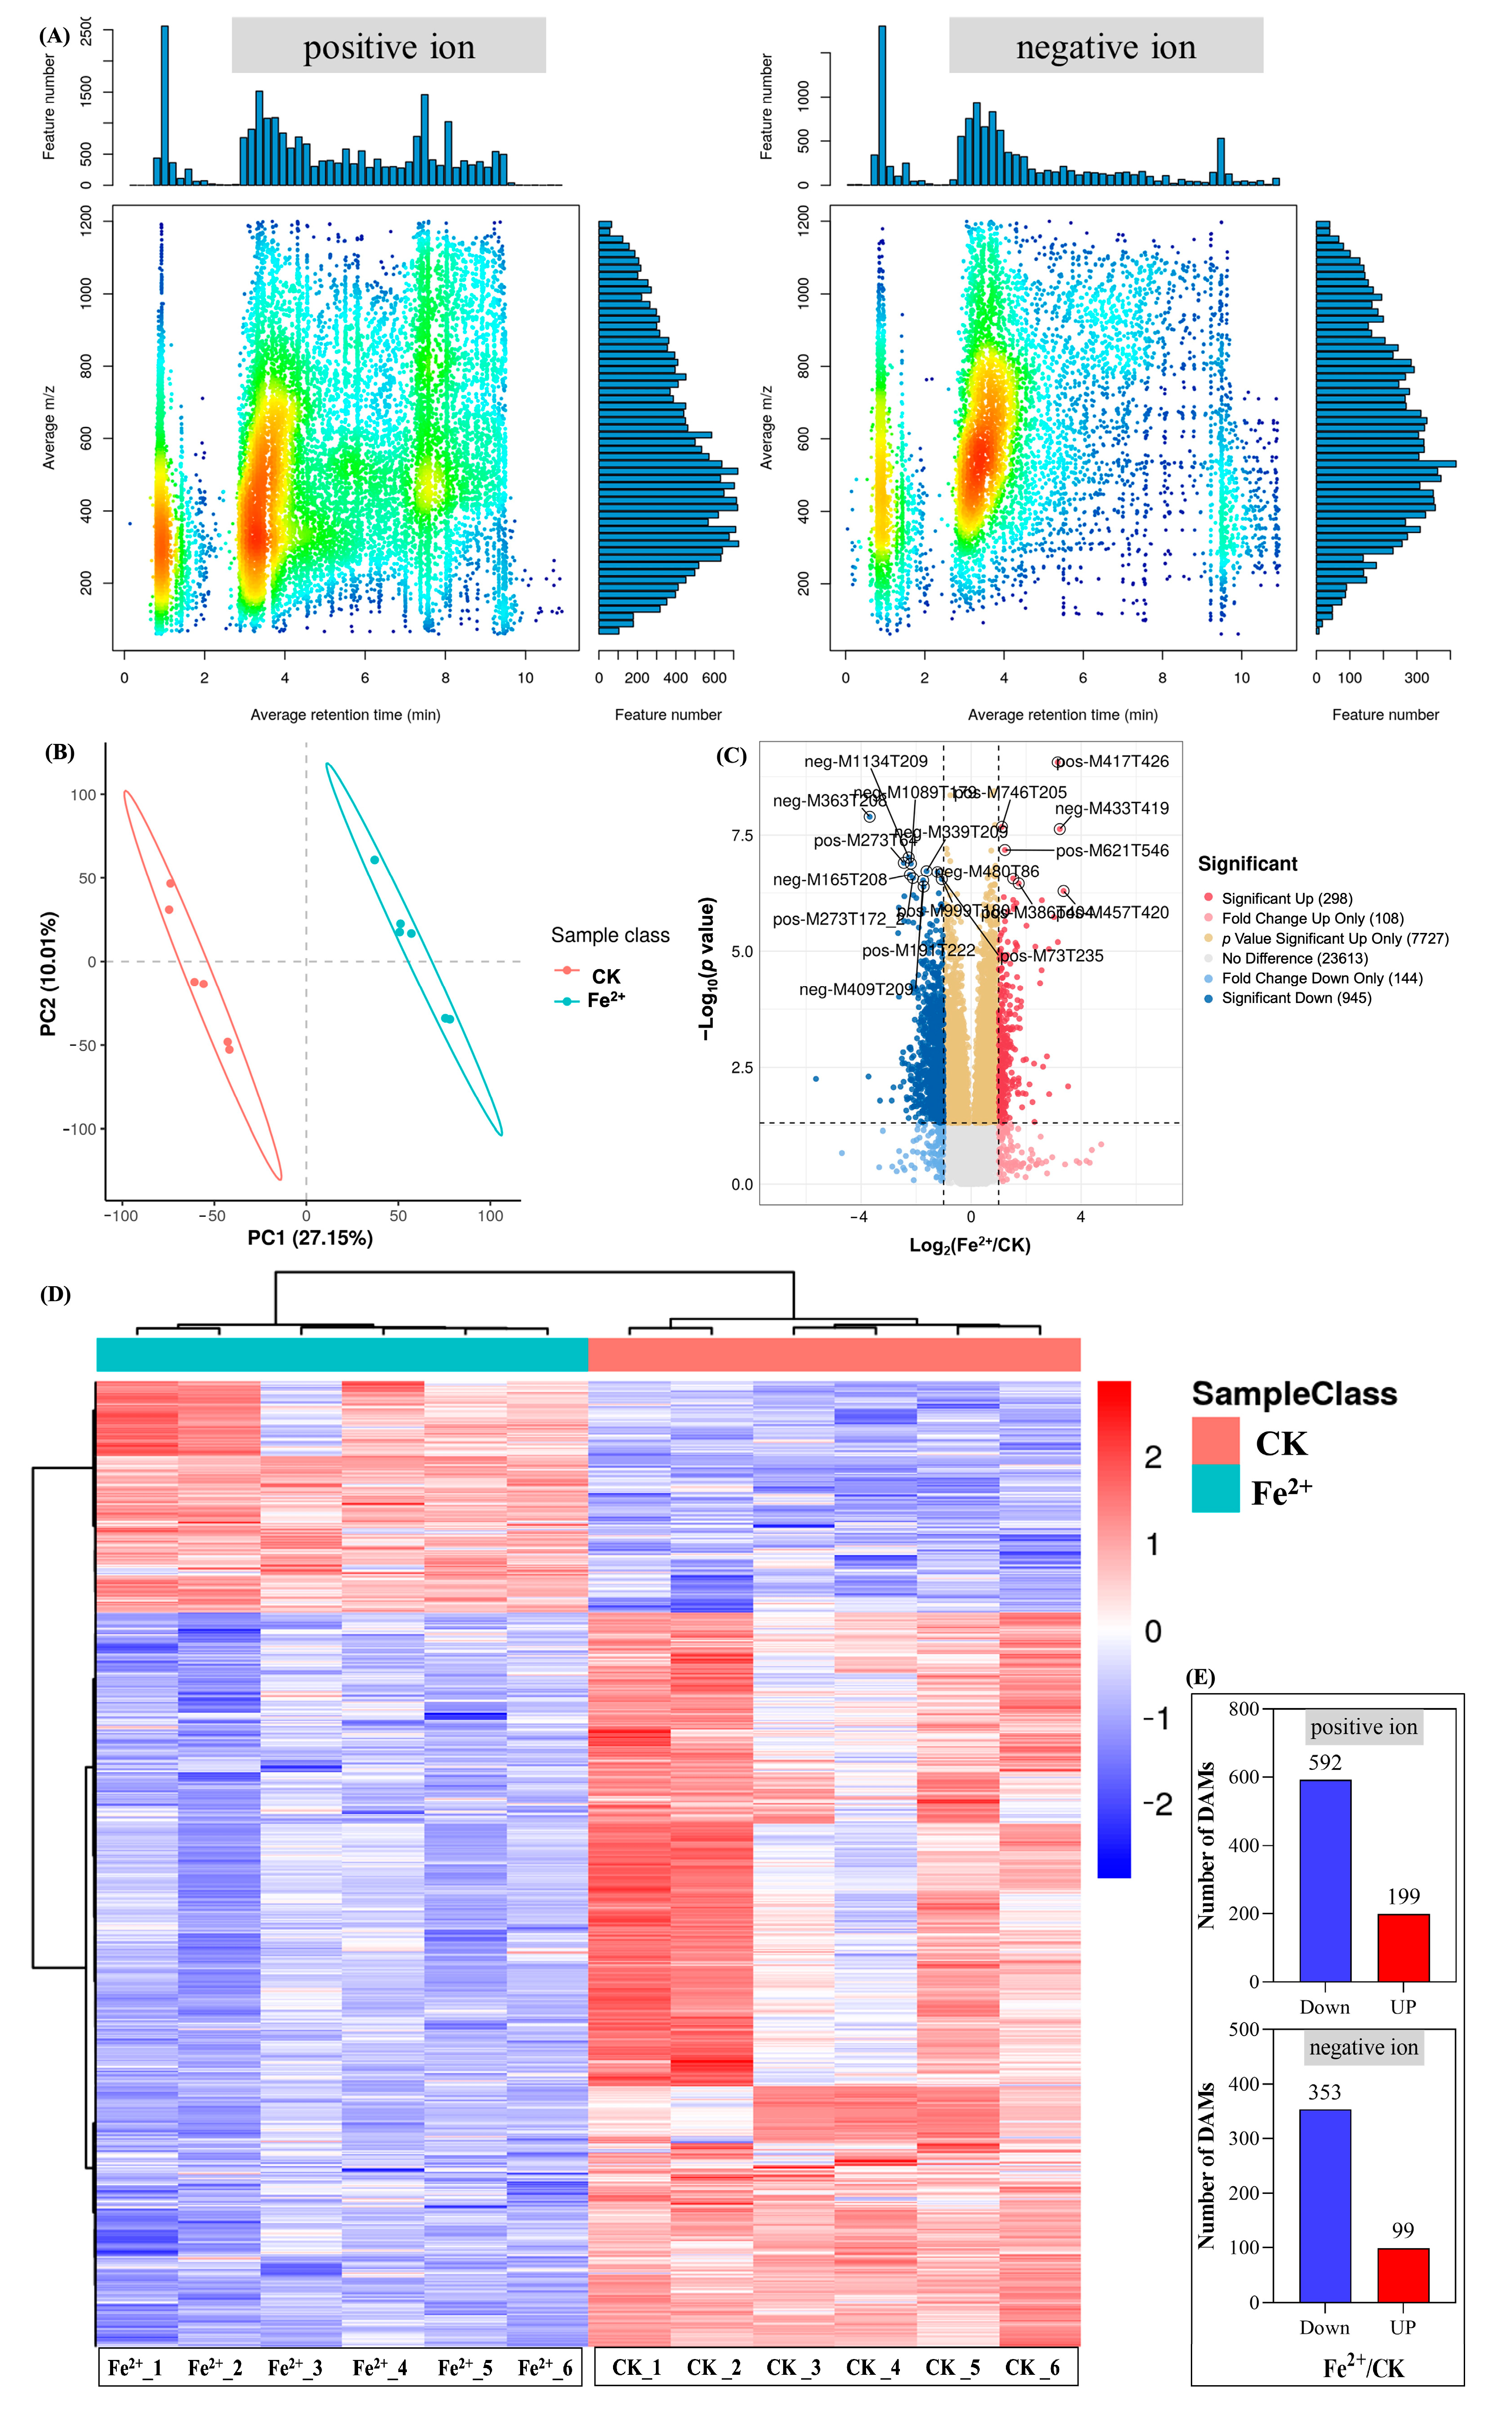
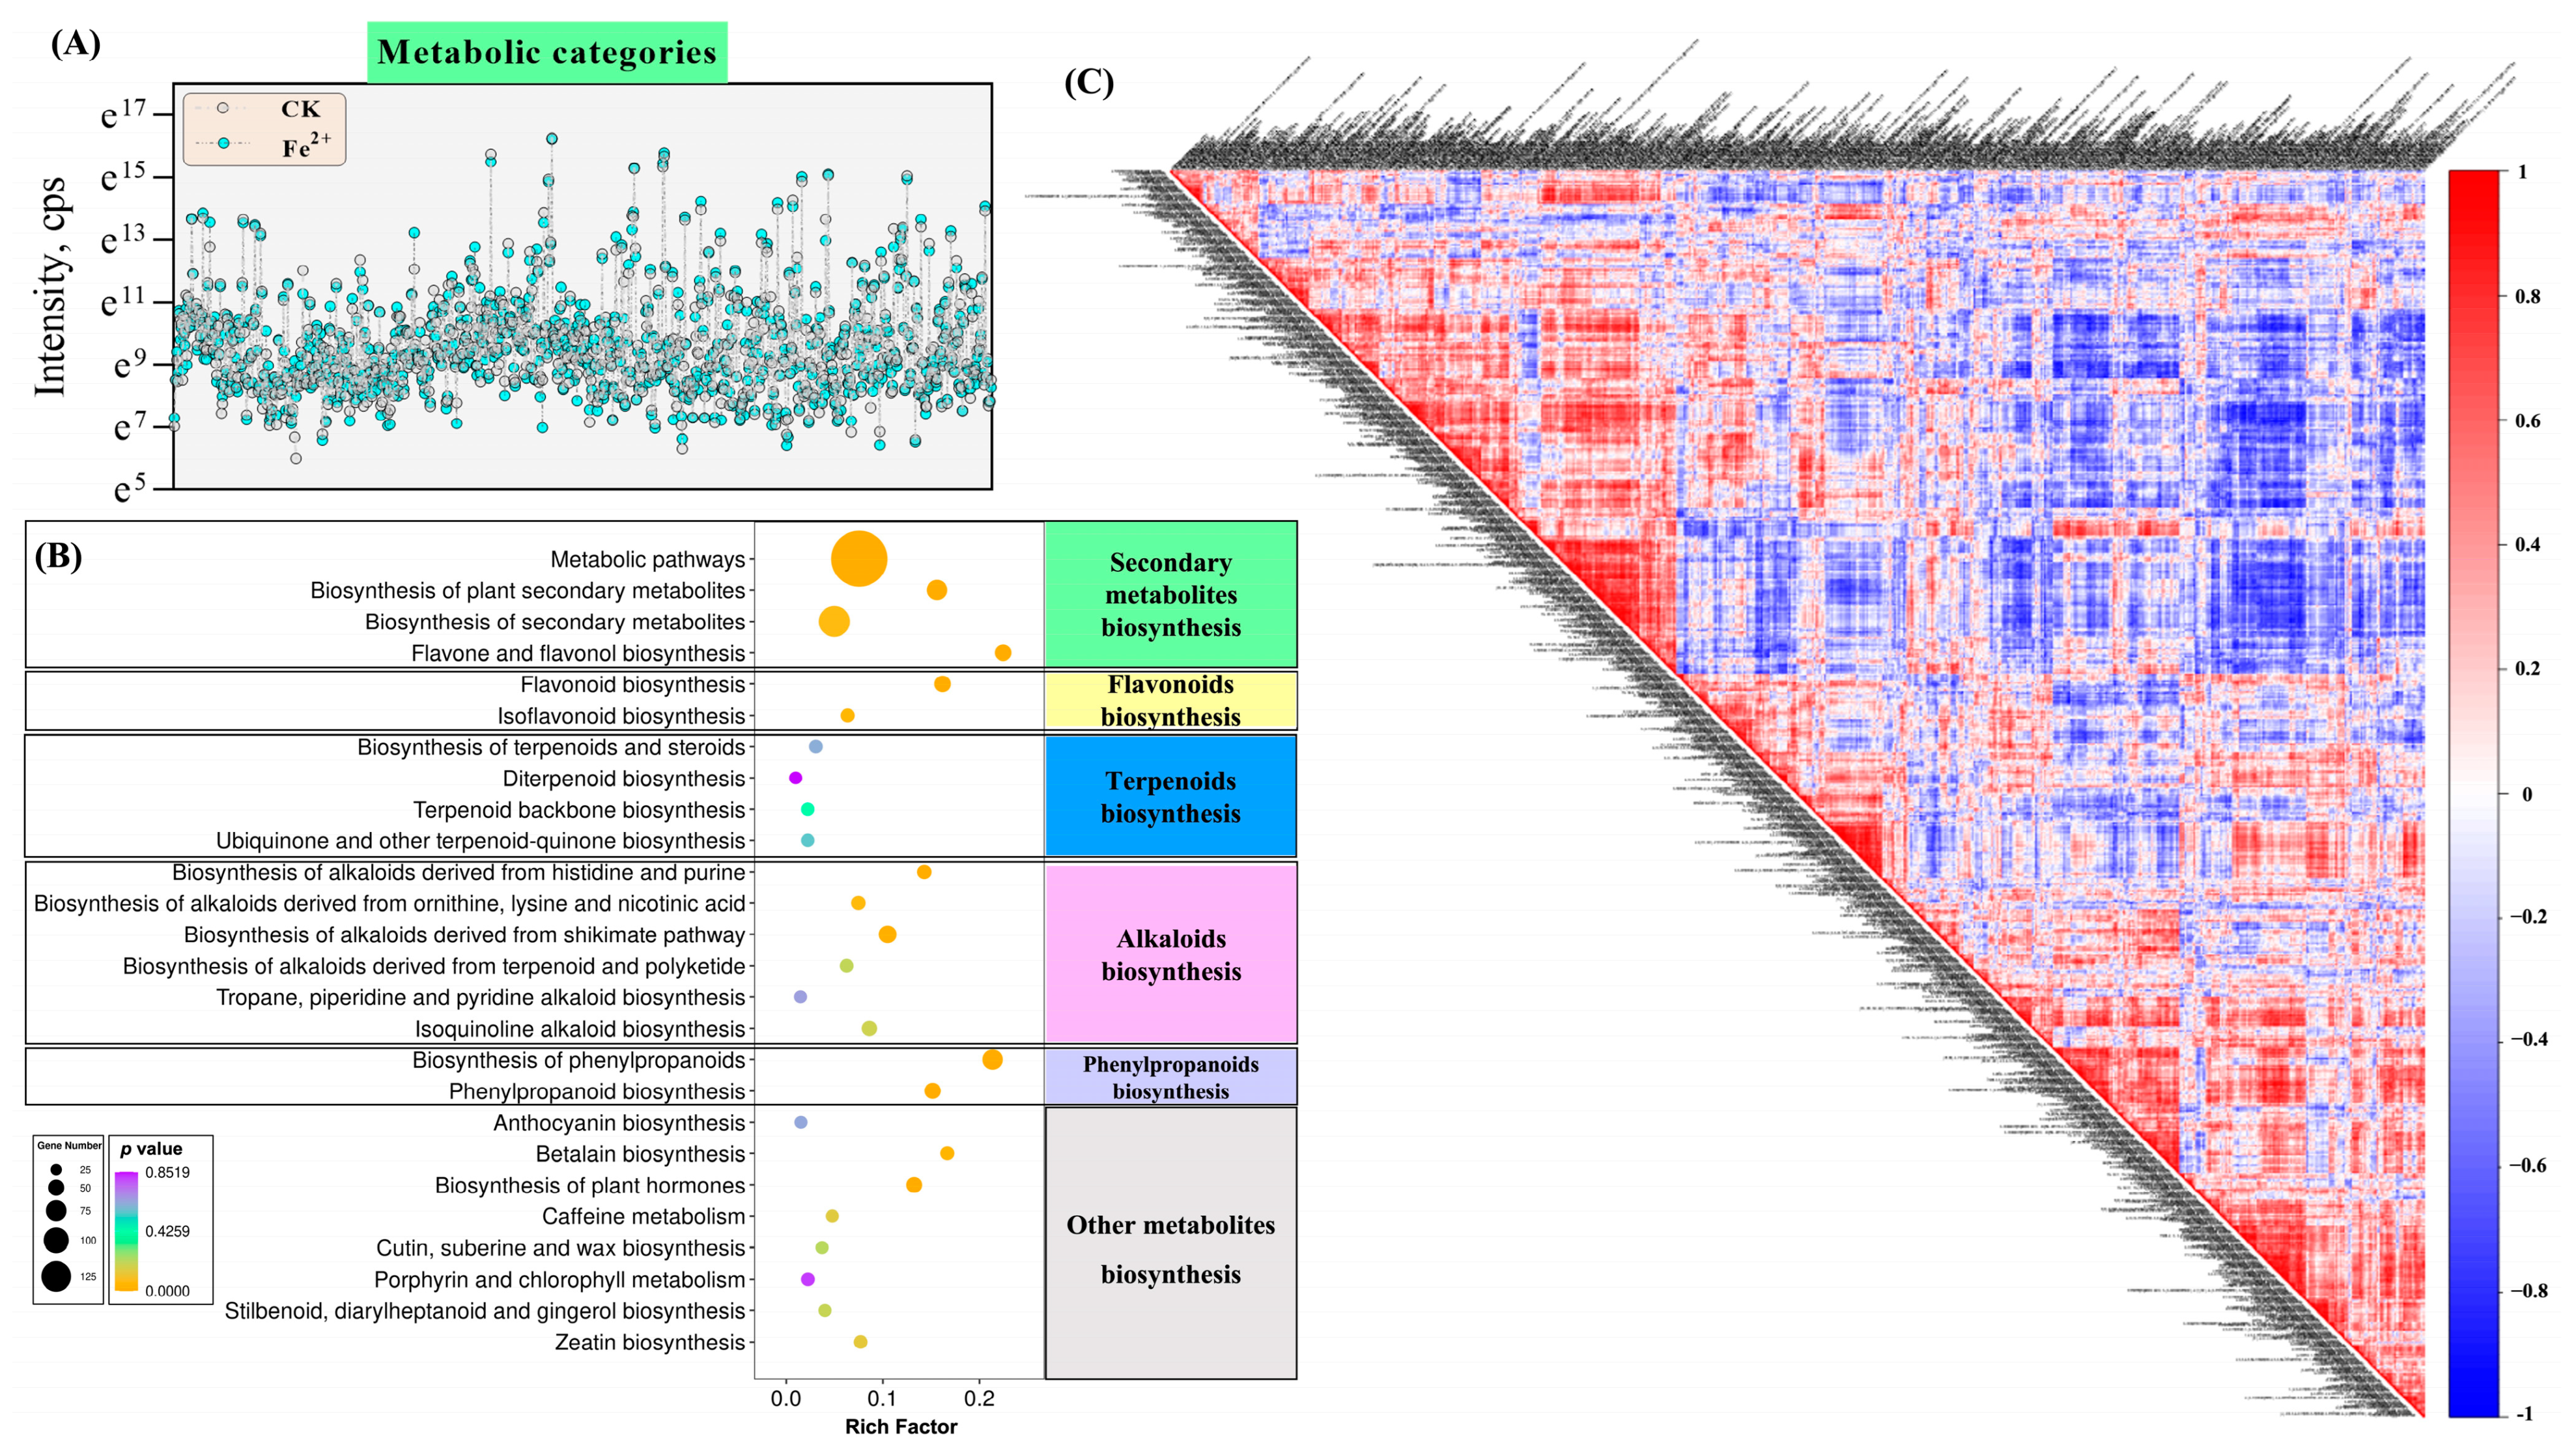
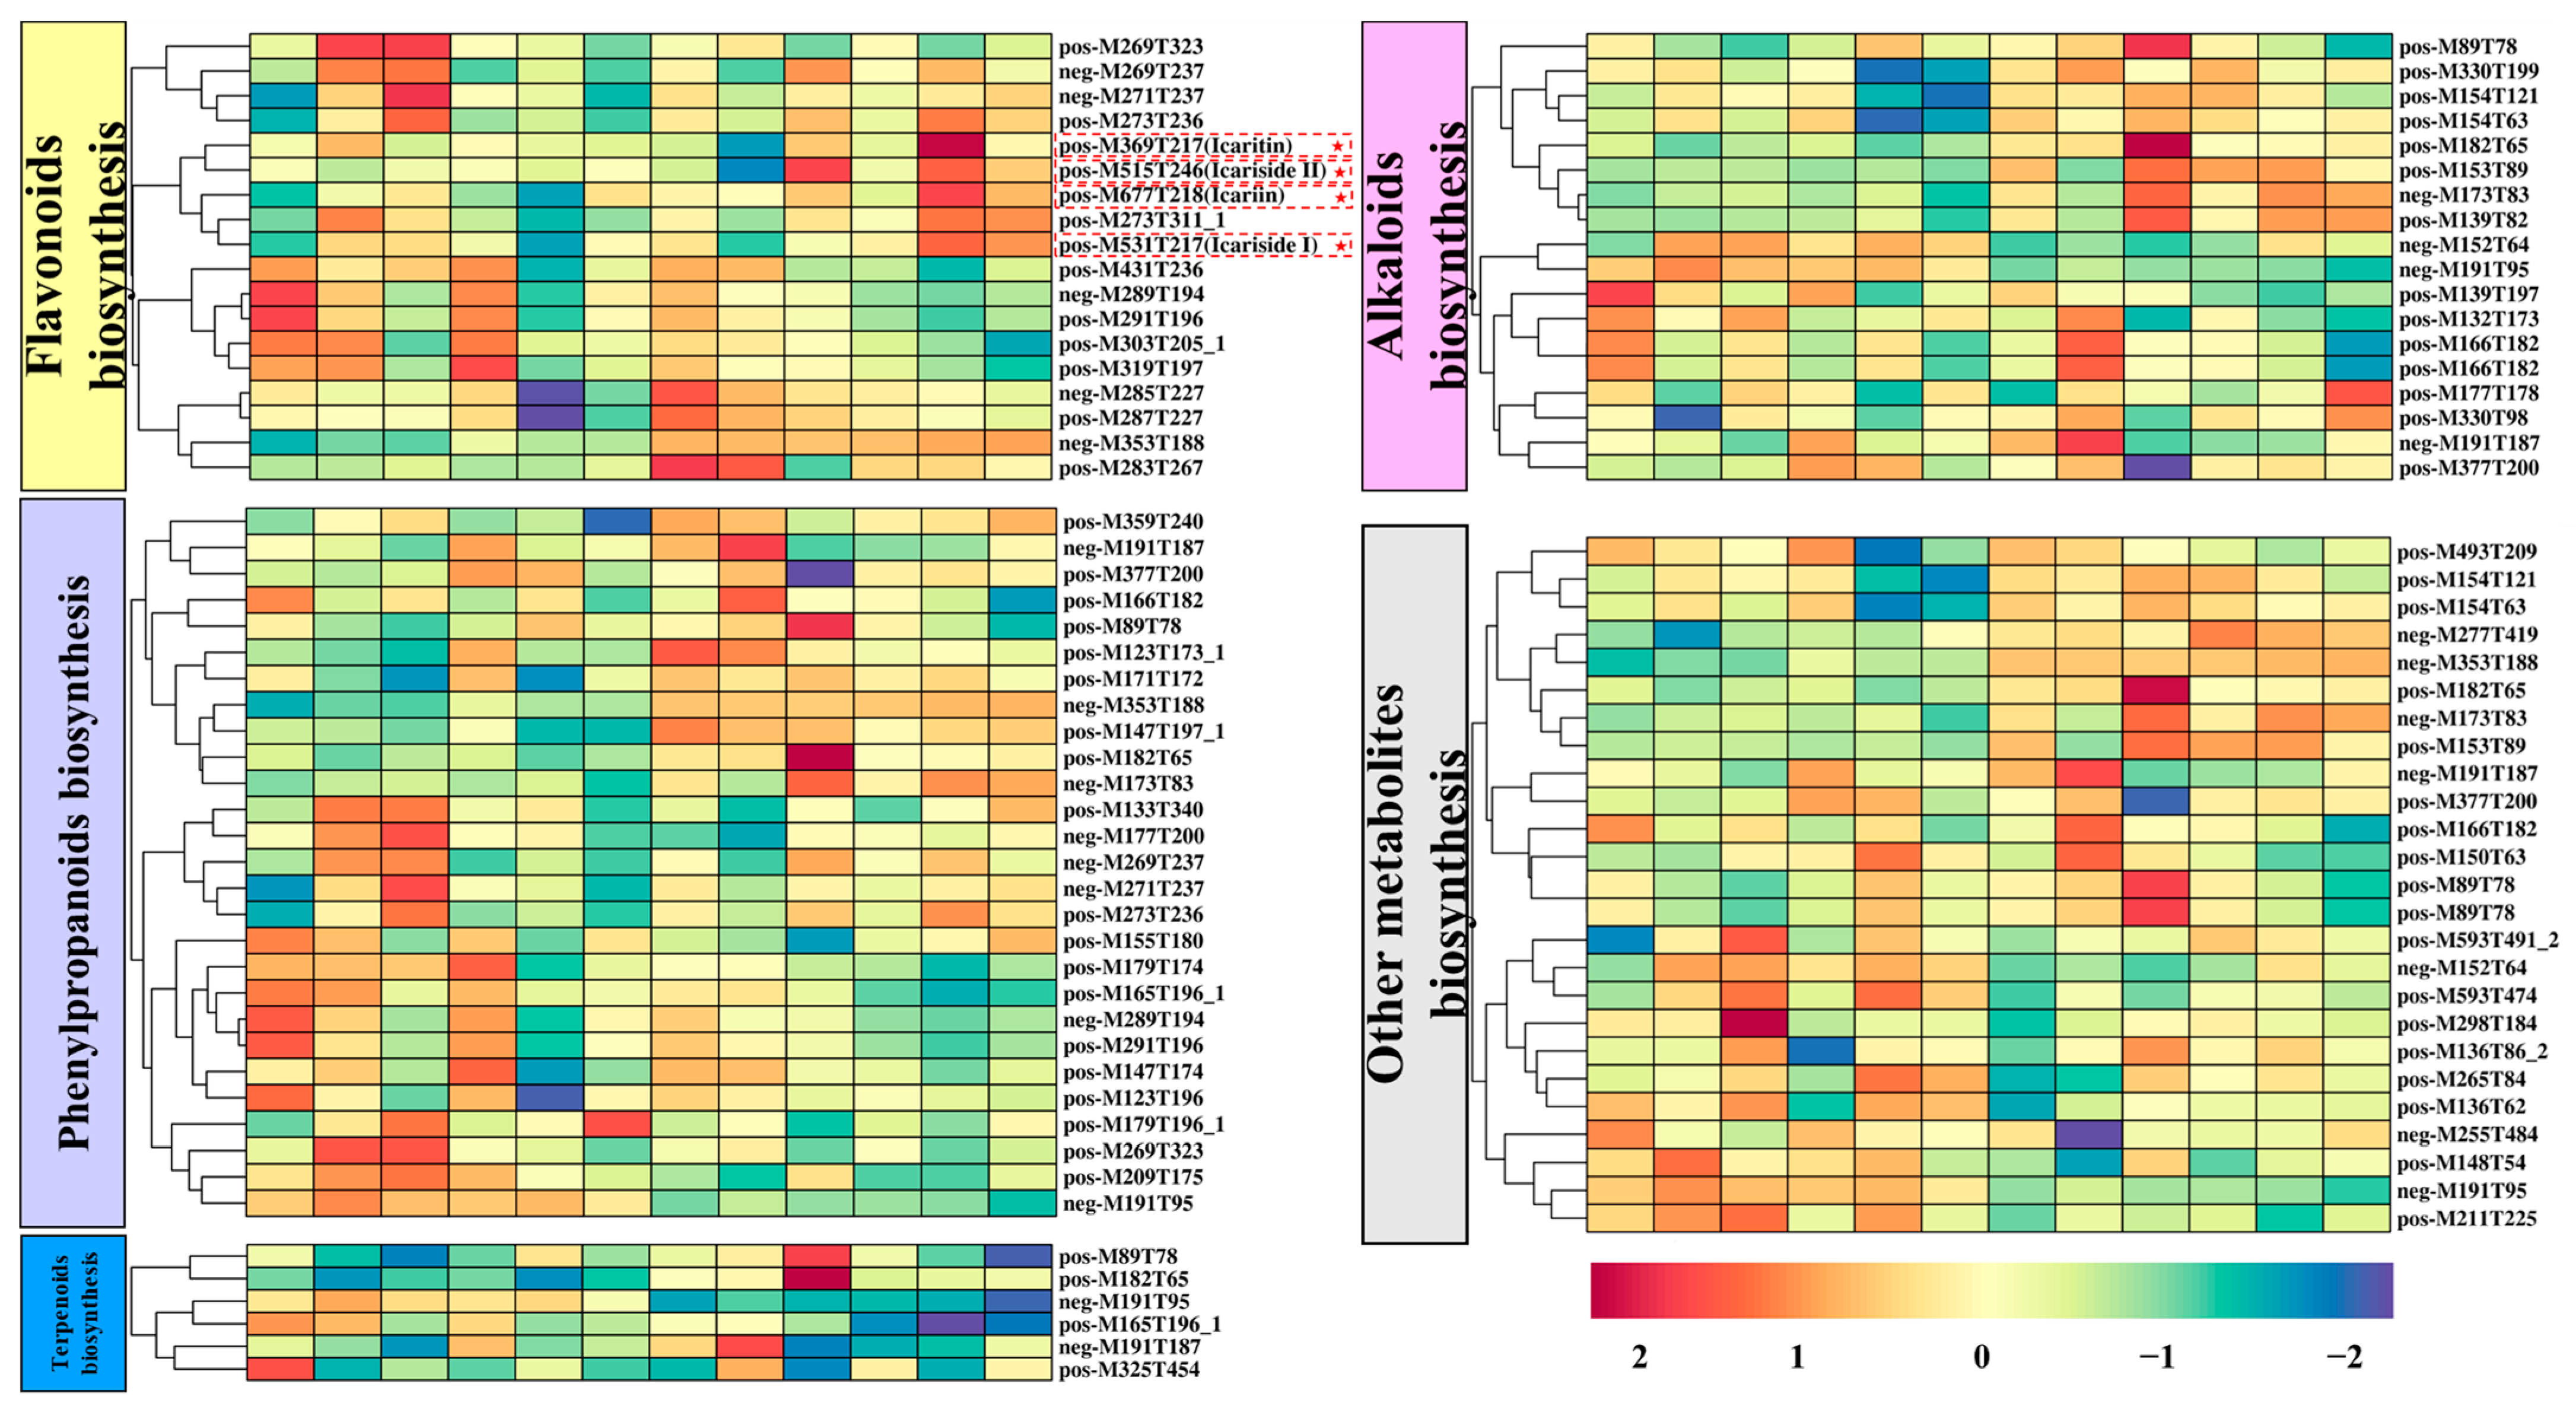
3.4. Widely Untargeted Metabolomic Analysis of E. sagittatum Leaves

According to the HPLC analysis in this study, high-concentration Fe2+ (2500 mg·L−1) had a more positive effect on flavonoids in E. sagittatum leaves. Therefore, the widely untargeted metabolomic analysis carried out by UPLC-MS/MS aimed at deciphering the effects of Fe2+ on the metabolites in E. sagittatum leaves. Basic metabolite information of Fe2+ (2500 mg·L−1) and CK (n = 6) based on widely untargeted metabolomics is shown in Figure 6. The average retention time and m/z of positive and negative ions are shown in Figure 6A. The m/z of the positive ions is concentrated between 200 and 650. The m/z of the negative ions is concentrated between 400 and 800. We have demonstrated the overall differences in metabolites between Fe2+ and CK using the partial least squares discriminant analysis (PLS-DA) (Figure 6B), which effectively reveals the differences between the two groups of metabolites. Figure 6C–E show the significance analysis of DAMs between Fe2+ and CK. The Volcano plot also presents the most distinct DAMs between Fe2+ and CK. A total of 32,835 metabolites were detected in this study, of which 1243 metabolites showed significant differences (presented by Figure 6D), including 791 positive ions (199 significantly up-regulated DAMs and 592 significantly down-regulated DAMs) and 452 negative ions (99 significantly up-regulated DAMs and 353 significantly down-regulated DAMs). The next step of the analysis focused on the classes to which these DAMs belonged, and the patterns of change after high-concentration Fe2+ treatment.
After the identification and KEGG annotation of DAMs, we screened for various metabolites involved in E. sagittatum leaves’ secondary metabolic activities, as shown in Figure 7. We calculated the normalized ionic intensities of each of the DAMs involved in different secondary metabolite activities (Figure 7A). The ionic intensities of DAMs changed significantly under high-concentration Fe2+ treatment. These DAMs were assigned to different classes of secondary metabolites, mainly including flavonoids, terpenoids, alkaloids, phenylpropanoids, and others. Figure 7B shows the statistical analysis of DAMs enriched in secondary metabolites’ biosynthesis pathways using KEGG annotation. It can be seen that the DAMs involved in different classes of secondary metabolites’ biosynthesis pathways exhibit distinct differences. Further, we performed a correlation analysis on the DAMs, as shown in Figure 7C, where red represents positive correlation and blue represents negative correlation, and the darker the color, the stronger the correlation between DAMs. It shows that there is an interaction between the changing DAMs in E. sagittatum leaves.
The abundance of active secondary metabolites within the tissues of medicinal plants is a major focus of interest, and as an important herbal leafage, E. sagittatum is known for the richness of the flavonoid icariin in its leaves. In this study, we separately identified metabolites including flavonoids (18 metabolites), phenylpropanoids (27 metabolites), terpenoids (6 metabolites), alkaloids (18 metabolites), and others (25 metabolites) after high-concentration Fe2+ treatment (Figure 8). The abundant secondary metabolic components of E. sagittatum leaves showed rapid responses to high-Fe2+ treatment. The metabolites that were most up-regulated in the flavonoid biosynthesis pathway were neg-M353T188 (3-caffeoylquinic acid), neg-M285T227 (luteolin), and pos-M283T267 (pseudobaptigenin). More importantly, we also identified the characteristic active metabolites in E. sagittatum, including pos-M677T218 (icariin), pos-M369T217 (icaritin), pos-M531T217 (icariside I), and pos-M515T246 (icariside II). All four characteristic active metabolites showed different degrees of up-regulation after high-concentration Fe2+ treatment. The metabolites that were most up-regulated in the phenylpropanoid biosynthesis pathway were pos-M147T197_1 (coumarin), neg-M173T83 (shikimic acid), and pos-M182T65 (tyrosine). The metabolites that were most up-regulated in the alkaloid biosynthesis pathway were pos-M153T89 (xanthine), pos-M139T82 (3,4-dihydroxybenzaldehyde), and pos-M330T199 (reticuline). The above heatmap analysis shows that high-concentration Fe2+ treatment changed the flow of the secondary metabolism in E. sagittatum leaves, and stimulated the synthesis of different kinds of secondary metabolites, especially flavonoids (including the characteristic active metabolites icariin, icaritin, icariside I, and icariside II).

4. Discussion

Quality control during the harvesting period of E. sagittatum is necessary to ensure the stability and reliability of its herbal leafage [29]. In this study, we conducted an experiment on E. sagittatum leaves by spraying them with mineral elements, with the aim of improving the quality of the herbal leafage during the harvesting period. The results can provide a scientific basis for the improvement of agronomic cultivation measures during the harvesting period of E. sagittatum, and effectively improve the quality of E. sagittatum herbal leafage.
Flavonoids, including icariin, epimedin A, epimedin B, and epimedin C, are the main bioactive components of E. sagittatum, and are also the main indicators of interest for the quality control of E. sagittatum [2]. The harvesting period of herbal leafage is mainly concentrated in autumn every year, and this is the key point at which to control the stable and reliable quality of herbal leafage. The foliar spraying of mineral elements allows the mineral elements to enter the tissues directly from the plant leaves’ surfaces, so as to participate in the metabolism of plants and the synthesis of organic matter, which is faster and more effective than soil fertilization [30]. Some studies have reported that spraying mineral elements on leaves is an effective way to enhance the quality of medicinal herbs. The foliar application concentrations of 500 mg·L−1 of Fe2+, Mn2+, and Cu2+, and 5000 mg·L−1 of Zn2+ improved both Panax ginseng yield and ginsenosides content [31]. The foliar application of 3 g·L−1 ZnO can improve the yield, flower number, and crocin content of Crocus sativus [32]. The application of Fe + Mn + Zn each at 150 ppm, combined with 4 mL·L−1 seaweed extract, caused a significant increase in the essential oil percentage and artemisinin content in Artemisia annua [33]. We conducted a detailed experiment involving spraying different concentrations of elements (Fe2+, Cu2+, and Zn2+) on the leaves of E. sagittatum during the harvest period. Applying different concentrations of Fe, Cu, and Zn at different treatment times during the harvesting period of E. sagittatum could increase the sum of main flavonoids’ contents (p < 0.05). In particular, the content of main flavonoids reached a maximum at 20 days after the high concentration of Fe2+ (2500 mg·L−1) treatment and was elevated by 48.39% compared to CK (p < 0.05). This increase in the sum of main flavonoids’ contents in E. sagittatum leaves was mainly due to the increase in the contents of icariin and epimedin C. The contents of icariin and epimedin C in E. sagittatum leaves accounted for more than 95% of the sum of the main flavonoids. Mineral elements can act as catalysts for certain organic synthesis reactions in plants, or participate in the structural functions of plant bioactive components to influence the formation and accumulation of phytochemicals, thus ultimately affecting the quality of medicinal herbs via the bioactive components’ content [34]. As an essential element for chlorophyll synthesis, Fe is an important component and activator of many enzymes in plants [35], and is involved in redox and electron transfer, which directly or indirectly affects photosynthesis, respiration, and material–energy conversion [36]. Therefore, the scientific and reasonable supplementation of Fe fertilizer is an important way to alleviate reductions in medicinal plant yield and quality [37]. Our experimental results show that the leaf surface-spraying of mineral elements was an effective measure to enhance the flavonoids content in E. sagittatum during the harvest period; in particular, the highest total flavonoid content was reached after 20 days of high-Fe2+ (2500 mg·L−1) treatment. Thus, a higher-quality E. sagittatum herb can be obtained by means of the foliar application of Fe2+ before harvesting, which has practical significance as regards enhancing the economic value of cultivated E. sagittatum.
In addition to the accurate quantitative analysis of compounds, researchers are seeking non-destructive, rapid and accurate qualitative analysis tools for medicinal plants. FT-IR technology based on the Fourier transform of the interfering infrared light, with a Michael interferometer instead of a spectroscopic system, is characterized by fast scanning speed, high luminous flux, and a wide measurement range, and is by far the most commonly used method for infrared spectral analysis [25]. FT-IR technology determines the change in molecular coupling distance caused by the vibration or rotation of molecules [38]. Since the molecules of substances contain different functional groups and chemical bonds, or functional groups in different chemical environments, the energy required for vibrational energy level jumps is different, and the corresponding absorption of infrared light is also different, so the absorption peaks appear at different wavelengths, and therefore different and informative infrared spectra can be obtained [39]. The FT-IR technique was used to identify the absorption peaks of the functional groups of the samples, and enables fast and non-destructive identification of the contents of various chemical components of different kinds in medicinal plant samples [40]. Currently, FT-IR technology is widely used in the field of authenticity identification and chemical composition prediction for Chinese herbal medicines [41,42]. Yang et al. established a partial least squares regression model for different geographical regions of Paris polyphylla var. yunnanensis using the total flavonoid content and the specific absorption peaks identified by FT-IR of different samples [26], which distinguished the geographical origin and predicted the active ingredients of samples. Chen et al. successfully identified wild-type, cultivated-type, and tissue cultured-type Anoectochilus roxburghii by constructing a model involving the Tri-step identification method of infrared spectroscopy [43]. Chen et al. developed a correlation-based linear discrimination model for Lonicera plants using FT-IR, which can accurately distinguish the medicinal flower buds of five kinds of Lonicera plants [44]. In this study, we used FT-IR to identify 10 characteristic absorption peaks, including peaks ν(O–H), ν(–C=C) and νas(=C–O–C), for 30 E. sagittatum leaf samples with different concentrations of mineral elements at different treatment times. The absorbances of the 10 characteristic peaks changed to significantly different degrees, and this better reflects the differences in the 30 E. sagittatum leaf samples. We also used OPLS-DA analysis to model the relationship between samples treated for different treatment times and with different concentrations of mineral elements. A total of 30 samples were well-distinguished in the score scatter plot; samples measured 10 days after treatment were not distributed in the first quadrant, samples 20 days after treatment were not distributed in the third quadrant, and samples 30 days after treatment showed a scattered distribution, indicating that the spraying of mineral elements did change the composition and content of chemical components in E. sagittatum leaves. Combined with the coefficients and VIP values of the 10 characteristic peaks in the OPLS-DA model, designation peak ν(O–H), peak ν(–C=C), peak νas(=C–O–C), and peak νas(–CH2) were shown to be relatively more important in sample differentiation and identification. Overall, we analyzed the FT-IR spectra characteristics of E. sagittatum leaf samples with different concentrations of mineral elements at different treatment times using the FT-IR technique and constructed an OPLS-DA model to achieve qualitative analysis and differentiated identification of E. sagittatum samples. This provides a feasible operational solution for the rapid and precise differentiation and identification of different samples of E. sagittatum, and contributes to our understanding of the effect of spraying mineral elements on the changes in chemical composition of E. sagittatum leaves.
Metabolomics is an emerging histological technology that is a dynamic product of the processes and activities of states of life, and can be used to determine physiological changes based on variability [45]. At present, metabolomics has been applied in many industries and fields, including traditional Chinese medicine [46]. In the study of medicinal plants, the main focus is on the identification of the basal origin, cultivation, harvesting, processing, concoction, and pharmacology [47]. Metabolomics is mainly divided into targeted and untargeted metabolomics. Because of its ability to analyze different classes of metabolites, untargeted metabolomics have been widely used to compare the overall metabolic compositions of different samples [48]. Untargeted metabolomics allow for the quantitative analysis of all metabolites in an organism, and thus visualizes the changes occurring in the plant tissues, which is more convenient compared to other histological techniques [49]. The synthesis of active secondary metabolites in medicinal plants is affected by environmental factors such as temperature, light, and moisture in different regions, and the variability of harvesting time and the complexity of active metabolites of different medicinal plants makes it difficult to study the formation of secondary metabolism [13,50]. Metabolomics technology plays an important role in the study of the secondary metabolism formation of medicinal plants given its high throughput and other technical analysis features. In this study, the effect of high-Fe2+ treatment on the synthesis of secondary metabolites (especially characteristic flavonoids) in E. sagittatum leaves during harvesting was investigated using widely untargeted metabolomics. After filtering, identification, and KEGG annotation, the high-quality metabolites were assigned to different secondary metabolism categories, including primarily flavonoids (18 metabolites), phenylpropanoids (27 metabolites), terpenoids (6 metabolites), alkaloids (18 metabolites), and others (25 metabolites). As the most important characteristic flavonoids, icariin, icaritin, icariside I, and icariside II were also annotated in the widely untargeted metabolomic analysis. The relative contents of these four metabolites were significantly up-regulated by the high-concentration Fe2+ treatment. This is consistent with the finding that high-concentration Fe2+ treatment increased the content of icariin in HPLC analysis. It is shown that widely untargeted metabolomics is one of the most effective techniques in explaining the secondary metabolic synthesis of medicinal plants. In summary, our study further confirms the positive effect of high-Fe2+ treatment on secondary metabolic activities in E. sagittatum leaves during the harvesting period by widely untargeted metabolomic analysis.

5. Conclusions

In this study, we conducted an experiment on E. sagittatum leaves sprayed with mineral elements, with the aim of improving the quality of the herbal leafage during the harvesting period. We elucidated the changes in flavonoids (icariin, epimedin A, epimedin B, and epimedin C) in E. sagittatum leaves via quantitative analysis. The content of the main flavonoids reached a maximum (11.74%) at 20 days after the high concentration of Fe2+ (2500 mg·L−1) treatment. From the perspective of the qualitative analysis, we analyzed the FT-IR spectra characteristics of E. sagittatum leaf samples using the FT-IR technique, and constructed an OPLS-DA model, then identified several key characteristic peaks to complete the differentiated identification of E. sagittatum samples. Further, widely untargeted metabolomic analysis identified different classes of metabolites, including flavonoids (18 metabolites), phenylpropanoids (27 metabolites), terpenoids (6 metabolites), alkaloids (18 metabolites), and others (25 metabolites). As the most important characteristic flavonoids, the relative contents of icariin, icaritin, icariside I, and icariside II were found to be up-regulated by high-Fe2+ treatment. Our experimental results demonstrate that high-concentration Fe2+ treatment is an effective measure to increase the flavonoids content in E. sagittatum leaves during the harvesting period, which can provide a scientific basis for the improvement of E. sagittatum leaf cultivation agronomic measures.

Supplementary Materials

The following supporting information can be downloaded at: https://www.mdpi.com/article/10.3390/metabo13020294/s1, Figure S1: The chromatogram of the mixed standards and samples of E. sagittatum.

Author Contributions

L.Y. and C.D. conceived and designed the experiments. L.Y. performed most of the experiments, analyzed the data and completed the first draft. F.Z., Y.Y., S.Z. and X.G. worked together with L.Y. to accomplish the experiments. X.S. and B.J. participated in data analysis and manuscript modification. H.Z. was responsible for the cultivation and management of E. sagittatum. All authors have read and agreed to the published version of the manuscript.

Funding

This work was supported by the National Natural Science Foundation of China (grant number 82104329), the special funds for starting scientific research of Henan University of Chinese Medicine (grant number 00104311-2021-1-41, 00104311-2022-1-1-41) and the National Key R&D Programme of China (grant number 2017YFC1702800).

Institutional Review Board Statement

Not applicable.

Informed Consent Statement

Not applicable.

Data Availability Statement

The data presented in this study are available on request from the corresponding author. The data are not publicly available due to their required use in further research.

Conflicts of Interest

The authors declare no conflict of interest.

References

  1. Chen, X.-J.; Tang, Z.-H.; Li, X.-W.; Xie, C.-X.; Lu, J.-J.; Wang, Y.-T. Chemical constituents, quality control, and bioactivity of Epimedii Folium (Yinyanghuo). Am. J. Chin. Med. 2015, 43, 783–834. [Google Scholar] [CrossRef]
  2. Ma, H.; He, X.; Yang, Y.; Li, M.; Hao, D.; Jia, Z. The genus Epimedium: An ethnopharmacological and phytochemical review. J. Ethnopharmacol. 2011, 134, 519–541. [Google Scholar] [CrossRef]
  3. Chen, J.; Xu, Y.; Wei, G.; Liao, S.; Zhang, Y.; Huang, W.; Yuan, L.; Wang, Y. Chemotypic and genetic diversity in Epimedium sagittatum from different geographical regions of China. Phytochemistry 2015, 116, 180–187. [Google Scholar] [CrossRef] [PubMed]
  4. Zhang, Y.; Yang, L.; Chen, J.; Sun, W.; Wang, Y. Taxonomic and phylogenetic analysis of Epimedium L. based on amplified fragment length polymorphisms. Sci. Hortic. 2014, 170, 284–292. [Google Scholar] [CrossRef]
  5. Li, W.-X.; Deng, Y.-Y.; Li, F.; Liu, B.; Liu, H.-Y.; Shi, J.-S.; Gong, Q.-H. Icariin, a major constituent of flavonoids from Epimedium brevicornum, protects against cognitive deficits induced by chronic brain hypoperfusion via its anti-amyloidogenic effect in rats. Pharmacol. Biochem. Behav. 2015, 138, 40–48. [Google Scholar] [CrossRef] [PubMed]
  6. Wu, H.; Lien, E.J.; Lien, L.L. Chemical and pharmacological investigations of Epimedium species: A survey. In Progress in Drug Research; Wu, H., Lien, E.J., Lien, L.L., Schultz, R.M., Ram, V.J., Domingo, E., Spence, P., Gupta, S.P., Bhat, S.P., Villarreal, E.C., et al., Eds.; Birkhäuser Basel: Basel, Switzerland, 2003; pp. 1–57. [Google Scholar]
  7. Jiang, J.; Song, J.; Jia, X.-B. Phytochemistry and ethnopharmacology of Epimedium L. Species. Chin. Herb. Med. 2015, 7, 204–222. [Google Scholar] [CrossRef]
  8. Zhang, H.-F.; Zhang, X.; Yang, X.-H.; Qiu, N.-X.; Wang, Y.; Wang, Z.-Z. Microwave assisted extraction of flavonoids from cultivated Epimedium sagittatum: Extraction yield and mechanism, antioxidant activity and chemical composition. Ind. Crops Prod. 2013, 50, 857–865. [Google Scholar] [CrossRef]
  9. Shen, P.; Guo, B.L.; Gong, Y.; Hong, D.Y.Q.; Hong, Y.; Yong, E.L. Taxonomic, genetic, chemical and estrogenic characteristics of Epimedium species. Phytochemistry 2007, 68, 1448–1458. [Google Scholar] [CrossRef] [PubMed]
  10. Bi, Z.; Zhang, W.; Yan, X. Anti-inflammatory and immunoregulatory effects of icariin and icaritin. Biomed. Pharmacother. 2022, 151, 113180. [Google Scholar] [CrossRef]
  11. Sun, Y.; Li, Q.; Xu, J.-M.; Liang, J.; Cheng, Y.; Li, S.; Zheng, L.; Ye, B.; Meng, K.; Qin, S. A multicenter, single arm phase II trial of a small molecule immune-modulator icaritin: Safety, overall survival, immune dynamics, and PD-L1 expression in advanced hepatocellular carcinoma. J. Clin. Oncol. 2018, 36 (Suppl. S15), 4077. [Google Scholar] [CrossRef]
  12. Mo, D.; Zhu, H.; Wang, J.; Hao, H.; Guo, Y.; Wang, J.; Han, X.; Zou, L.; Li, Z.; Yao, H.; et al. Icaritin inhibits PD-L1 expression by Targeting Protein IκB Kinase α. Eur. J. Immunol. 2021, 51, 978–988. [Google Scholar] [CrossRef] [PubMed]
  13. Li, Y.; Kong, D.; Fu, Y.; Sussman, M.R.; Wu, H. The effect of developmental and environmental factors on secondary metabolites in medicinal plants. Plant Physiol. Biochem. 2020, 148, 80–89. [Google Scholar] [CrossRef] [PubMed]
  14. Alaerts, G.; Pieters, S.; Logie, H.; Van Erps, J.; Merino-Arévalo, M.; Dejaegher, B.; Smeyers-Verbeke, J.; Vander Heyden, Y. Exploration and classification of chromatographic fingerprints as additional tool for identification and quality control of several Artemisia species. J. Pharm. Biomed. Anal. 2014, 95, 34–46. [Google Scholar] [CrossRef]
  15. Gomes, A.F.; Almeida, M.P.; Leite, M.F.; Schwaiger, S.; Stuppner, H.; Halabalaki, M.; Amaral, J.G.; David, J.M. Seasonal variation in the chemical composition of two chemotypes of Lippia alba. Food Chem. 2019, 273, 186–193. [Google Scholar] [CrossRef]
  16. Huang, W.; Zeng, S.; Xiao, G.; Wei, G.; Liao, S.; Chen, J.; Sun, W.; Lv, H.; Wang, Y. Elucidating the biosynthetic and regulatory mechanisms of flavonoid-derived bioactive components in Epimedium sagittatum. Front. Plant Sci. 2015, 6, 689. [Google Scholar] [CrossRef] [PubMed] [Green Version]
  17. Tripathi, P.; Singh, A. Chapter 19—Biofertilizers: “An ace in the hole” in medicinal and aromatic plants cultivation. In Biofertilizers; Rakshit, A., Meena, V.S., Parihar, M., Singh, H.B., Singh, A.K., Eds.; Woodhead Publishing: Cambridge, UK, 2021; pp. 253–263. [Google Scholar]
  18. Toksha, B.; Sonawale, V.A.M.; Vanarase, A.; Bornare, D.; Tonde, S.; Hazra, C.; Kundu, D.; Satdive, A.; Tayde, S.; Chatterjee, A. Nanofertilizers: A review on synthesis and impact of their use on crop yield and environment. Environ. Technol. Innov. 2021, 24, 101986. [Google Scholar] [CrossRef]
  19. Bayram, S.E.; İsfendiyaroğlu, M.; Tuncay, Ö. Effects of foliar zinc applications on some yield parameters and essential oil constituents of the mastic tree (Pistacia lentiscus var. chia Duham.). J. Appl. Res. Med. Aromat. Plants 2022, 31, 100431. [Google Scholar] [CrossRef]
  20. He, Y.; Luo, Y.; Wang, Q.; Sun, Y.; Duan, N.; Chen, Z.; Zeng, H. Spray treatment of leaves with Fe2+ promotes procyanidin biosynthesis by upregulating the expression of the F3H and ANS genes in red rice grains (Oryza sativa L.). J. Cereal Sci. 2021, 100, 103231. [Google Scholar] [CrossRef]
  21. Chrysargyris, A.; Papakyriakou, E.; Petropoulos, S.A.; Tzortzakis, N. The combined and single effect of salinity and copper stress on growth and quality of Mentha spicata plants. J. Hazard. Mater. 2019, 368, 584–593. [Google Scholar] [CrossRef]
  22. Yang, L.; Zhou, S.; Hou, Y.; Ji, B.; Pei, L.; Su, X.; Zhong, H.; Dong, C. Blue light induces biosynthesis of flavonoids in Epimedium sagittatum (Sieb.et Zucc.) Maxim. leaves, a study on a light-demanding medicinal shade herb. Ind. Crops Prod. 2022, 187, 115512. [Google Scholar] [CrossRef]
  23. Wen, B.; Mei, Z.; Zeng, C.; Liu, S. metaX: A flexible and comprehensive software for processing metabolomics data. BMC Bioinform. 2017, 18, 183. [Google Scholar] [CrossRef] [Green Version]
  24. Pei, L.-K.; Sun, S.-Q.; Guo, B.-L.; Huang, W.-H.; Xiao, P.-G. Fast quality control of Herba Epimedii by using Fourier transform infrared spectroscopy. Spectrochim. Acta Part A Mol. Biomol. Spectrosc. 2008, 70, 258–264. [Google Scholar] [CrossRef] [PubMed]
  25. Krysa, M.; Szymańska-Chargot, M.; Zdunek, A. FT-IR and FT-Raman fingerprints of flavonoids—A review. Food Chem. 2022, 393, 133430. [Google Scholar] [CrossRef] [PubMed]
  26. Yang, Y.; Zhao, Y.; Zuo, Z.; Wang, Y. Determination of total flavonoids for Paris polyphylla var. yunnanensis in different geographical origins using UV and FT-IR spectroscopy. J. AOAC Int. 2019, 102, 457–464. [Google Scholar] [CrossRef] [PubMed]
  27. Boccard, J.; Rutledge, D.N. A consensus orthogonal partial least squares discriminant analysis (OPLS-DA) strategy for multiblock Omics data fusion. Anal. Chim. Acta 2013, 769, 30–39. [Google Scholar] [CrossRef] [PubMed]
  28. Huang, B.-M.; Zha, Q.-L.; Chen, T.-B.; Xiao, S.-Y.; Xie, Y.; Luo, P.; Wang, Y.-P.; Liu, L.; Zhou, H. Discovery of markers for discriminating the age of cultivated ginseng by using UHPLC-QTOF/MS coupled with OPLS-DA. Phytomedicine 2018, 45, 8–17. [Google Scholar] [CrossRef]
  29. Singh, P.A.; Bajwa, N.; Chinnam, S.; Chandan, A.; Baldi, A. An overview of some important deliberations to promote medicinal plants cultivation. J. Appl. Res. Med. Aromat. Plants 2022, 31, 100400. [Google Scholar] [CrossRef]
  30. Kumar, D.; Punetha, A.; Verma, P.P.S.; Padalia, R.C. Micronutrient based approach to increase yield and quality of essential oil in aromatic crops. J. Appl. Res. Med. Aromat. Plants 2022, 26, 100361. [Google Scholar] [CrossRef]
  31. Zhang, H.; Yang, H.; Wang, Y.; Gao, Y.; Zhang, L. The response of ginseng grown on farmland to foliar-applied iron, zinc, manganese and copper. Ind. Crops Prod. 2013, 45, 388–394. [Google Scholar] [CrossRef]
  32. Rostami, M.; Talarposhti, R.M.; Mohammadi, H.; Demyan, M.S. Morpho-physiological Response of Saffron (Crocus sativus L.) to Particle Size and Rates of Zinc Fertilizer. Commun. Soil Sci. Plant Anal. 2019, 50, 1250–1257. [Google Scholar] [CrossRef]
  33. Ghatas, Y.; Ali, M.; Elsadek, M.; Mohamed, Y. Enhancing growth, productivity and artemisinin content of Artemisia annua L. Plant using seaweed extract and micronutrients. Ind. Crops Prod. 2021, 161, 113202. [Google Scholar] [CrossRef]
  34. Awasthi, S.; Chauhan, R.; Srivastava, S. Chapter 2—The importance of beneficial and essential trace and ultratrace elements in plant nutrition, growth, and stress tolerance. In Plant Nutrition and Food Security in the Era of Climate Change; Kumar, V., Srivastava, A.K., Suprasanna, P., Eds.; Academic Press: Cambridge, MA, USA, 2022; pp. 27–46. [Google Scholar]
  35. Li, P.; Wang, A.; Du, W.; Mao, L.; Wei, Z.; Wang, S.; Yuan, H.; Ji, R.; Zhao, L. Insight into the interaction between Fe-based nanomaterials and maize (Zea mays) plants at metabolic level. Sci. Total Environ. 2020, 738, 139795. [Google Scholar] [CrossRef] [PubMed]
  36. Liang, G. Iron uptake, signaling, and sensing in plants. Plant Commun. 2022, 3, 100349. [Google Scholar] [CrossRef]
  37. Afzal, S.; Singh, N.K.; Singh, N.; Sohrab, S.; Rani, M.; Mishra, S.K.; Agarwal, S.C. Chapter 9—Effect of metals and metalloids on the physiology and biochemistry of medicinal and aquatic plants. In Metals Metalloids Soil Plant Water Systems; Aftab, T., Hakeem, K., Eds.; Academic Press: Cambridge, MA, USA, 2022; pp. 199–216. [Google Scholar]
  38. Esteki, M.; Memarbashi, N.; Simal-Gandara, J. Classification and authentication of tea according to their harvest season based on FT-IR fingerprinting using pattern recognition methods. J. Food Compos. Anal. 2022, 115, 104995. [Google Scholar] [CrossRef]
  39. Nikalje, G.C.; Kumar, J.; Nikam, T.D.; Suprasanna, P. FT-IR profiling reveals differential response of roots and leaves to salt stress in a halophyte Sesuvium portulacastrum (L.). Biotechnol. Rep. 2019, 23, e00352. [Google Scholar] [CrossRef]
  40. He, W.; Lei, T. Identification of camellia oil using FT-IR spectroscopy and chemometrics based on both isolated unsaponifiables and vegetable oils. Spectrochim. Acta Part A Mol. Biomol. Spectrosc. 2020, 228, 117839. [Google Scholar] [CrossRef]
  41. Cheng, C.-S.; Wang, C.-J.; Liang, J.; Lao, C.-C.; Zhou, H.; Zhang, Z.-F. A new approach for identification of medicinal almonds by fourier transform infrared spectroscopy and systematic clustering of characteristic peaks. Chin. J. Nat. Med. 2017, 15, 703–709. [Google Scholar] [CrossRef]
  42. Shannon, M.; Lafeuille, J.-L.; Frégière-Salomon, A.; Lefevre, S.; Galvin-King, P.; Haughey, S.A.; Burns, D.T.; Shen, X.; Kapil, A.; McGrath, T.F.; et al. The detection and determination of adulterants in turmeric using fourier-transform infrared (FTIR) spectroscopy coupled to chemometric analysis and micro-FTIR imaging. Food Control. 2022, 139, 109093. [Google Scholar] [CrossRef]
  43. Chen, Y.; Huang, J.; Yeap, Z.Q.; Zhang, X.; Wu, S.; Ng, C.H.; Yam, M.F. Rapid authentication and identification of different types of A. roxburghii by Tri-step FT-IR spectroscopy. Spectrochim. Acta Part A Mol. Biomol. Spectrosc. 2018, 199, 271–282. [Google Scholar] [CrossRef]
  44. Chen, J.; Guo, B.; Yan, R.; Sun, S.; Zhou, Q. Rapid and automatic chemical identification of the medicinal flower buds of Lonicera plants by the benchtop and hand-held Fourier transform infrared spectroscopy. Spectrochim. Acta Part A Mol. Biomol. Spectrosc. 2017, 182, 81–86. [Google Scholar] [CrossRef]
  45. Rinschen, M.M.; Ivanisevic, J.; Giera, M.; Siuzdak, G. Identification of bioactive metabolites using activity metabolomics. Nat. Rev. Mol. Cell Biol. 2019, 20, 353–367. [Google Scholar] [CrossRef]
  46. Yang, L.; Wen, K.-S.; Ruan, X.; Zhao, Y.-X.; Wei, F.; Wang, Q. Response of plant secondary metabolites to environmental factors. Molecules 2018, 23, 762. [Google Scholar] [CrossRef] [PubMed] [Green Version]
  47. Zhou, X.; Li, C.-G.; Chang, D.; Bensoussan, A. Current status and major challenges to the safety and efficacy presented by Chinese herbal medicine. Medicines 2019, 6, 14. [Google Scholar] [CrossRef] [PubMed] [Green Version]
  48. Scossa, F.; Benina, M.; Alseekh, S.; Zhang, Y.; Fernie, A.R. The integration of metabolomics and next-generation sequencing data to elucidate the pathways of natural product metabolism in medicinal plants. Planta Med. 2018, 84, 855–873. [Google Scholar] [CrossRef] [PubMed] [Green Version]
  49. Hong, J.; Yang, L.; Zhang, D.; Shi, J. Plant metabolomics: An indispensable system biology tool for plant science. Int. J. Mol. Sci. 2016, 17, 767. [Google Scholar] [CrossRef]
  50. Soni, U.; Brar, S.; Gauttam, V.K. Effect of seasonal variation on secondary metabolites of medicinal plants. Int. J. Pharm. Sci. Res. 2015, 6, 3654–3662. [Google Scholar]
Figure 1. Overview of experimental sites used for spraying mineral elements on E. sagittatum. (A) Diagram of the spraying of mineral elements before E. sagittatum harvest. (B) The growth situation of E. sagittatum in special cultivation facilities.
Metabolites 13 00294 g001
Figure 2. The changes of flavonoids in E. sagittatum leaves after spraying with mineral elements (10 days, 20 days, and 30 days). The data are expressed as the means ± SDs (standard deviations, n = 3). (A) The sum of main flavonoids in E. sagittatum leaves after spraying with Fe2+, Cu2+, and Zn2+ (10 days, 20 days, and 30 days). * indicates a significant difference between the treatment group and the control group. (BD) The changes of icariin, epimedin A, epimedin B, and epimedin C in E. sagittatum leaves after spraying with Fe2+ (B), Cu2+ (C), and Zn2+ (D) (10 days, 20 days, and 30 days). The different lowercase letters indicate significant differences between treatments (p < 0.05) determined by Duncan’s single-factor variance analysis.
Metabolites 13 00294 g002
Figure 3. The characteristic absorption peaks of FT-IR spectra between 4000 and 500 cm−1 in E. sagittatum leaves after spraying with mineral elements (10 days, 20 days, and 30 days). The data are expressed as the means ± SDs (standard deviations, n = 5). (A) The FT-IR spectra between 4000 and 500 cm−1 in E. sagittatum leaves after 10 days, 20 days, and 30 days of treatment. (B) Heatmap of the changes of characteristic absorption peaks in E. sagittatum leaves after 10 days, 20 days, and 30 days of treatment.
Metabolites 13 00294 g003
Figure 4. Scores scatter plot of the characteristic absorption peaks in E. sagittatum leaves subjected to FT-IR under the OPLS-DA model.
Metabolites 13 00294 g004
Figure 5. Coefficients plot (A) and VIP plot (B) of the characteristic absorption peaks in E. sagittatum leaves subjected to FT-IR under the OPLS-DA model.
Metabolites 13 00294 g005
Figure 6. Basic metabolite information of Fe2+ (2500 mg·L−1) and CK based on widely untargeted metabolomics. (A) M/z-RT distribution of metabolites. (B) PLS-DA score plot of metabolites. (C) Significance analysis of the DAMs between the Fe2+ and CK determined by Volcano plot. (D) Fe2+ regulated the metabolites of E. sagittatum leaves. (E) Number of DAMs between Fe2+ and CK.
Metabolites 13 00294 g006
Figure 7. Identification and KEGG annotation of the DAMs between Fe2+ (2500 mg·L−1) and CK. (A) The abundances of DAMs belonging to different metabolic categories. (B) Statistic analysis of DAMs enriched in the secondary metabolites’ biosynthesis pathways by KEGG annotation. (C) Correlation between metabolites detected in the positive and negative ion mode (red—positive correlation, blue—negative correlation).
Metabolites 13 00294 g007
Figure 8. A heatmap of the relative amounts of flavonoids, phenylpropanoids, terpenoids, alkaloids, and other metabolites biosynthesis in E. sagittatum leaves.
Metabolites 13 00294 g008
Disclaimer/Publisher’s Note: The statements, opinions and data contained in all publications are solely those of the individual author(s) and contributor(s) and not of MDPI and/or the editor(s). MDPI and/or the editor(s) disclaim responsibility for any injury to people or property resulting from any ideas, methods, instructions or products referred to in the content.

