Article

Widely Targeted Metabolomics Reveals Metabolite Diversity in Jalapeño and Serrano Chile Peppers (Capsicum annuum L.)

by
Dennis N. Lozada
1,2,*,
Sahithi Reddy Pulicherla
3 and
Francisco Omar Holguin
1
1
Department of Plant and Environmental Sciences, New Mexico State University, Las Cruces, NM 88003, USA
2
Chile Pepper Institute, Department of Plant and Environmental Sciences, New Mexico State University, Las Cruces, NM 88003, USA
3
Molecular Biology Interdisciplinary Life Sciences Program, Department of Entomology, Plant Pathology, and Weed Science, New Mexico State University, Las Cruces, NM 88003, USA
*
Author to whom correspondence should be addressed.
Metabolites 2023, 13(2), 288; https://doi.org/10.3390/metabo13020288
Submission received: 27 January 2023 / Revised: 12 February 2023 / Accepted: 13 February 2023 / Published: 16 February 2023

Abstract

:
Chile peppers (Capsicum annuum L.) are good sources of vitamins and minerals that can be included in the diet to mitigate nutritional deficiencies. Metabolomics examines the metabolites involved in biological pathways to understand the genes related to complex phenotypes such as the nutritional quality traits. The current study surveys the different metabolites present in jalapeño (‘NuMex Pumpkin Spice’) and serrano (‘NuMex LotaLutein’) type chile peppers grown in New Mexico using a widely targeted metabolomics approach, with the ‘NuMex LotaLutein’ as control. A total of 1088 different metabolites were detected, where 345 metabolites were differentially expressed; 203 (59%) were downregulated and 142 (41%) were upregulated (i.e., relative metabolite content is higher in ‘NuMex Pumpkin Spice’). The upregulated metabolites comprised mostly of phenolic acids (42), flavonoids (22), and organic acids (13). Analyses of principal component (PC) and orthogonal partial least squares demonstrated clustering based on cultivars, where at least 60% of variation was attributed to the first two PCs. Pathway annotation identified 89 metabolites which are involved in metabolic pathways and the biosynthesis of secondary metabolites. Altogether, metabolomics provided insights into the different metabolites present which can be targeted for breeding and selection towards the improvement of nutritional quality traits in Capsicum.

1. Introduction

The recent global health crisis necessitates the improvement of diets by consuming healthier and more nutritious foods. Chile peppers (Capsicum spp.) are good sources of vitamins and minerals that can mitigate nutritional deficiencies. These include phenols; ascorbic acid; carotenoids; chlorophylls; vitamins A, C, and E; capsaicinoids; and flavonoids [1,2]. Capsaicinoids, which give chile peppers their unique ‘heat’ sensation, possess anti-cancer properties [3] and have been shown to have the potential of alleviating cough, rheumatism, sore throat, and toothache [4]. Phenolic compounds show great potential as strong antioxidants that can aid the human body against free radicals resulting from reactive oxygen species (ROS) to help prevent cancer, cardiovascular disorders, and neurodegenerative diseases [5,6,7]. These metabolites have also demonstrated anti-aging and depigmentation properties, anti-inflammatory potential, and antimicrobial activity [8]. A survey on the variation of vitamin contents in a Capsicum germplasm identified eight cultivars that have higher vitamin A concentration than sweet potato (Ipomea batatas), and 16 pepper types that have vitamin C content higher than kiwi (Actinidia deliciosa), indicating a great potential for improving nutrition through genetic improvement [9].
A deeper understanding of the different metabolites present in chile peppers will provide avenues to understand the complex array of genes resulting in quantitative phenotypes such as the nutritional quality traits. Metabolomics studies link the phenotype and genotype, acting as a bridge between the phenome and the genome [10]. Previous estimates revealed at least 200,000 metabolites in the plant kingdom, significantly higher than those found in animals; a potential consequence of a wide variety of metabolic pathways developed by plants to thrive in diverse environmental conditions [11]. In chile peppers, metabolomics approaches have profiled metabolites involved in growth, development, and adaptation to different environments [12,13]. Numerous changes in the biochemical and physiological processes involving enzyme activity, gene expression, and metabolite synthesis result in developmental changes in the fruit in response to the environment [14]. For example, during fruit development in C. chinense Jacq, a metabolomics approach revealed distinct patterns of metabolite distribution at 16 days post-anthesis across the orange and red ripening periods [15]. In another study, fruit discoloration was attributed to the reduction in carotenoid content in discolored red peppers compared to normal peppers, where lipid and flavonoid synthesis were significantly associated with discoloration [16]. Increased lipid metabolism and decrease in capsaicinoid, flavones, flavanol compounds, and terpenoids were further observed in domesticated chile peppers compared to their wild ancestors [17], indicating that genetic improvement for increased nutritional quality through breeding and selection have been implemented for the cultivated chile peppers.
Widely targeted metabolomics is the next generation of metabolomics, combining the benefits of the targeted and untargeted approaches, and has several advantages, including being high-throughput, highly sensitive, and having a broad coverage [18], in contrast to targeted approaches where some metabolites may be left unidentified [19]. The detection and identification of broadly targeted metabolites are made possible by Q-TRAP mass spectrometry based on multiple reaction monitoring mode, which allows for the simultaneous quantification of hundreds of known metabolites over a thousand of unknown metabolites [20,21].
The objectives of this study were to: (1) survey the metabolite diversity in jalapeño and serrano peppers using a nontargeted metabolomics approach; (2) identify differentially expressed metabolites; and (3) perform the functional annotation of genes involved in different metabolic pathways. A widely targeted metabolomics approach through an ultra-performance liquid chromatography tandem mass spectrometry (UPLC-MS/MS) was employed to determine differentially expressed metabolites in jalapeño and serrano pepper types cultivated in a New Mexico growing environment. The results from this study will be relevant for future metabolite-based genomics-assisted mapping approaches for the genetic improvement of nutritional quality traits in Capsicum.

2. Materials and Methods

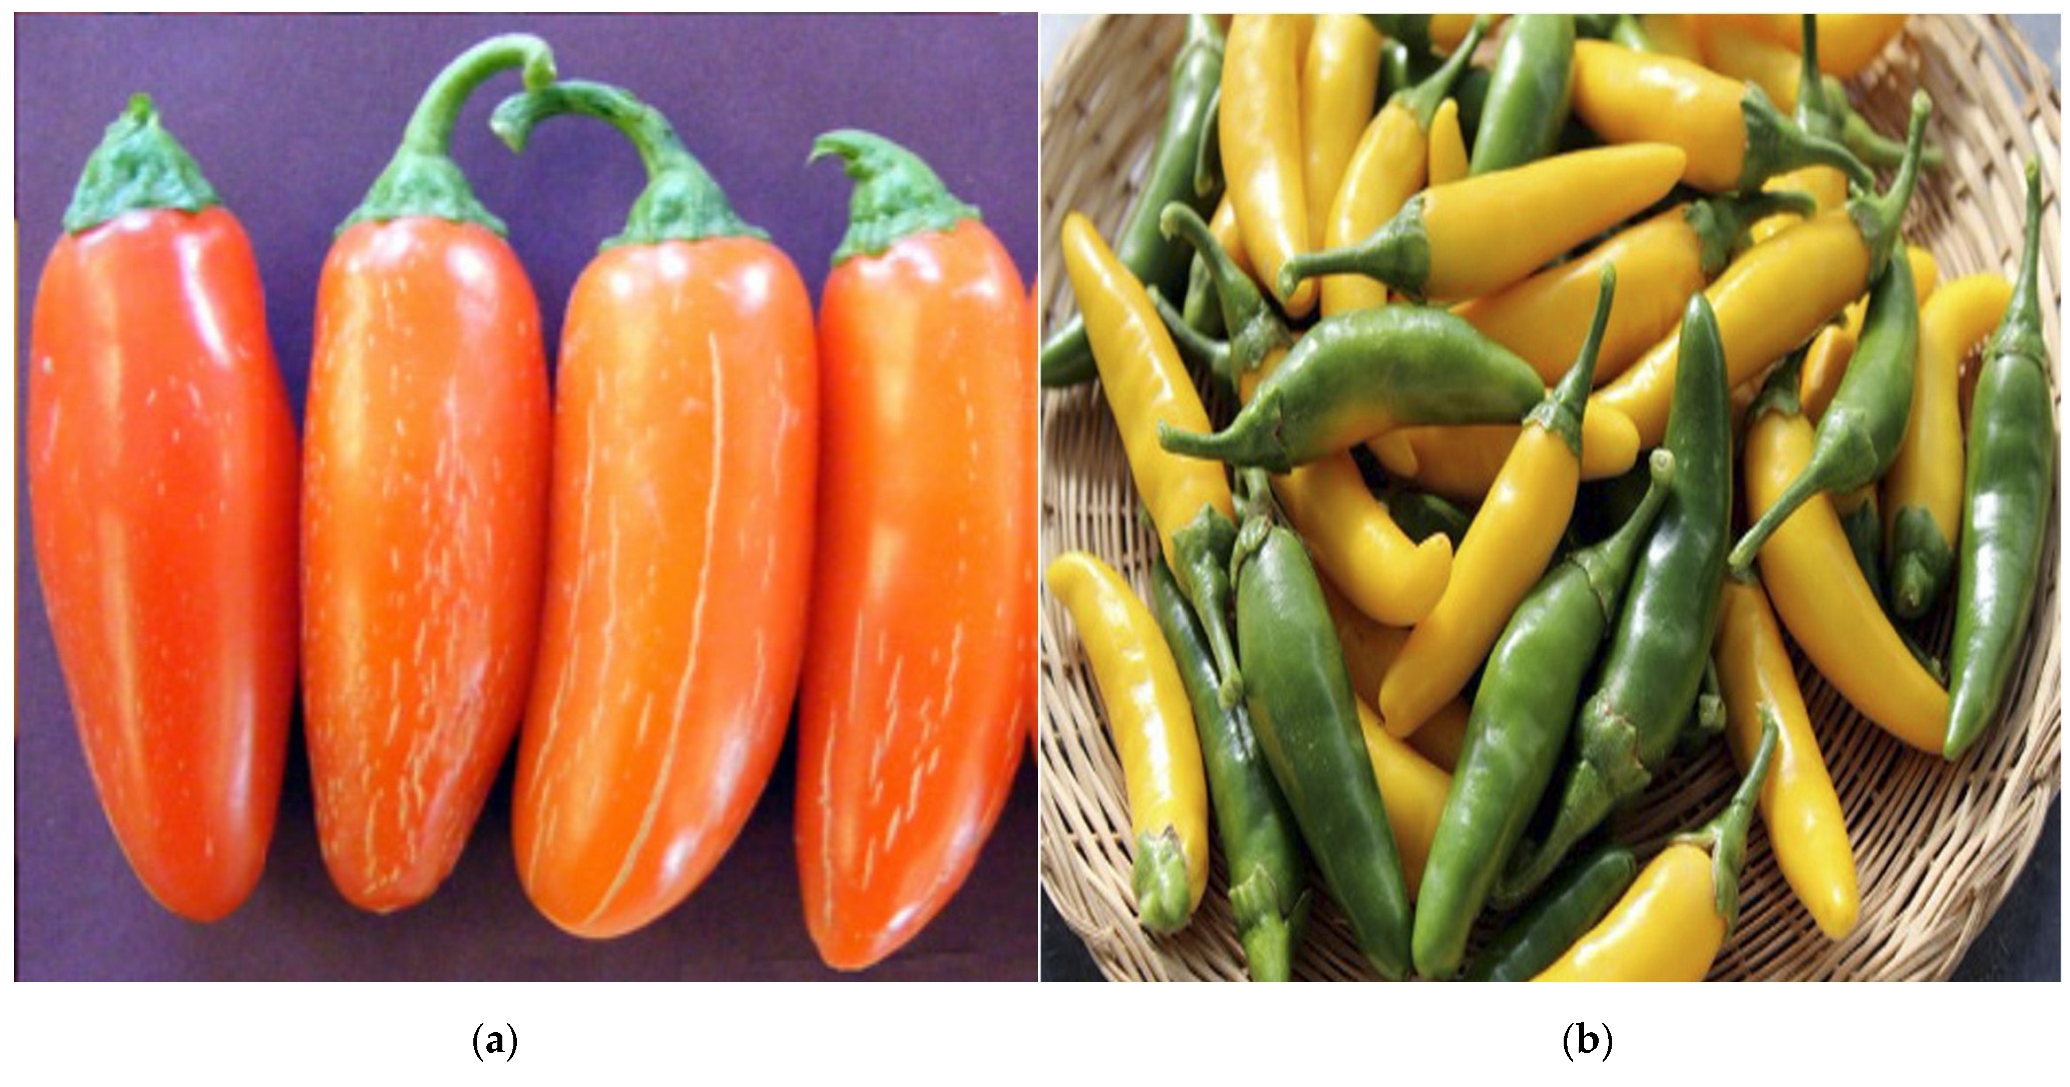
2.1. Plant Material and Collection of Fruit Samples

Two C. annuum L. cultivars previously released by the New Mexico State University (NMSU) Chile Pepper Breeding and Genetics Program, viz., ‘NuMex Pumpkin Spice’ (a jalapeño type) [22] and ‘NuMex LotaLutein’ (a serrano type), [23] were used in this study (Figure 1). The ‘NuMex Pumpkin Spice’ originated from the hybridization between the ‘Permagreen’ bell pepper and ‘Early Jalapeno’ and was developed using a pedigree breeding approach with three generations of backcrossing to a jalapeño fruit type, followed by multiple cycles of single plant selections [22]. ‘NuMex LotaLutein’ is a biofortified serrano pepper with improved lutein content and was derived from a segregating F2 population resulting from selfing a commercial F1 hybrid serrano cultivar [23]. ‘NuMex Pumpkin Spice’ has a characteristic deep orange (i.e., ‘pumpkin’-like) color, whereas ‘NuMex LotaLutein’ has a distinct yellow color.
The cultivars were transplanted at the Amy Goldman Flower Chile Pepper Institute Teaching Garden, Fabián García Science Center, Las Cruces, NM, USA. Three mature fruits from three individual plants (representing three biological replicates) from each cultivar were sampled ~130 days after transplanting (~190 days after initial sowing in the greenhouse). Fruit samples were subsequently freeze-dried for ~48 h using a Labconco Freeze Dry System (Labconco Corporation, Kansas City, MO, USA) and were sent to MetWare® Bio, MA, USA (https://www.metwarebio.com/ (accessed on 4 November 2022)) for processing and metabolomics analyses.

2.2. UPLC-MS/MS Based Widely Targeted Metabolomics Approach

Biological samples were re-freeze-dried using a vacuum lyophilizer (Scientz-100 F) at MetWare® Bio. A mixer mill (MM 400, Retsch, Verder Scientific, Inc., Newtown, PA, USA) with zirconia beads was used to grind the samples for 1.5 min at 30 Hz. The freeze-dried powder samples (~50 mg) were dissolved with 70% methanol solution (1.2 mL; 0.84 mL methanol; 0.36 mL distilled water), mixed using a vortex for 30 sec every 30 min, and stored at 4 °C overnight. The extracts were later centrifuged at 12,000 rpm for 10 min and filtered using a 0.22 μm filter before liquid chromatography and mass spectrometry.
Ultra-performance liquid chromatography (UPLC) (ExionLC™ AD, https://sciex.com.cn/ (accessed on 4 November 2022)) and tandem mass spectrometry (MS/MS) (Applied Biosystems QTRAP 6500, https://sciex.com.cn/ (accessed on 4 November 2022)) were performed with the following conditions (a): liquid phase chromatographic column: Agilent SB-C18 1.8 µm, 2.1 mm × 100 mm; (b) mobile phase: A phase—ultrapure water (0.1% formic acid added), B phase—acetonitrile (0.1% formic acid added); (c) elution gradient: 0.00 min, the proportion of B phase was 5%, within 9.00 min, the proportion of B phase increased linearly to 95% and remained at 95% for 1 min, 10.00–11.10 min, the proportion of B phase decreased to 5% and balanced at 5% up to 14 min; (d) flow rate: 0.35 mL/min; (e) column temperature: 40 °C; and (f) injection volume: 2 μL.
Mass spectrum scans were acquired using both the Linear Ion Trap (LIT) and Triple Quadrupole (QqQ) modes of a hybrid QqQ LIT Mass Spectrometer (Q TRAP ®) (AB6500 Q TRAP® UPLC/MS/MS system) with an ESI Turbo ion spray interface, and both cation and anion modes were controlled by Analyst 1.6.3 software (AB Sciex, MA, USA). Operating conditions consisted of the following: turbine spray (ion source); source temperature 550 °C; ion spray voltage (IS) 5500 V (cation mode)/−4500 V (anion mode); ion source gas I (GSI), gas II (GSII), and curtain gas (CUR) set to 50, 60, and 25 psi, respectively; collision-induced ionization parameter set to high. The multiple reaction monitoring (MRM) mode was used for the QqQ scan, where a specific set of MRM ion pairs was monitored based on the eluted metabolites at each period.

2.3. Qualitative and Quantitative Analyses of Metabolites

An in-house database (MetWare® Database) was used to identify metabolites based on their secondary spectrum information. The following were excluded during the qualitative analyses: signals from isotopes, and repeated signals containing cations such as K+, Na+, and NH4+. Semi-quantitative analyses of the samples were performed by MRM using QqQ MS. Peak integration on the mass spectrum peaks of all the metabolites identified was performed after obtaining spectrum analyses data from the different samples. Integral correction was implemented on the peaks of similar metabolites in different samples according to Fraga et al. [24].

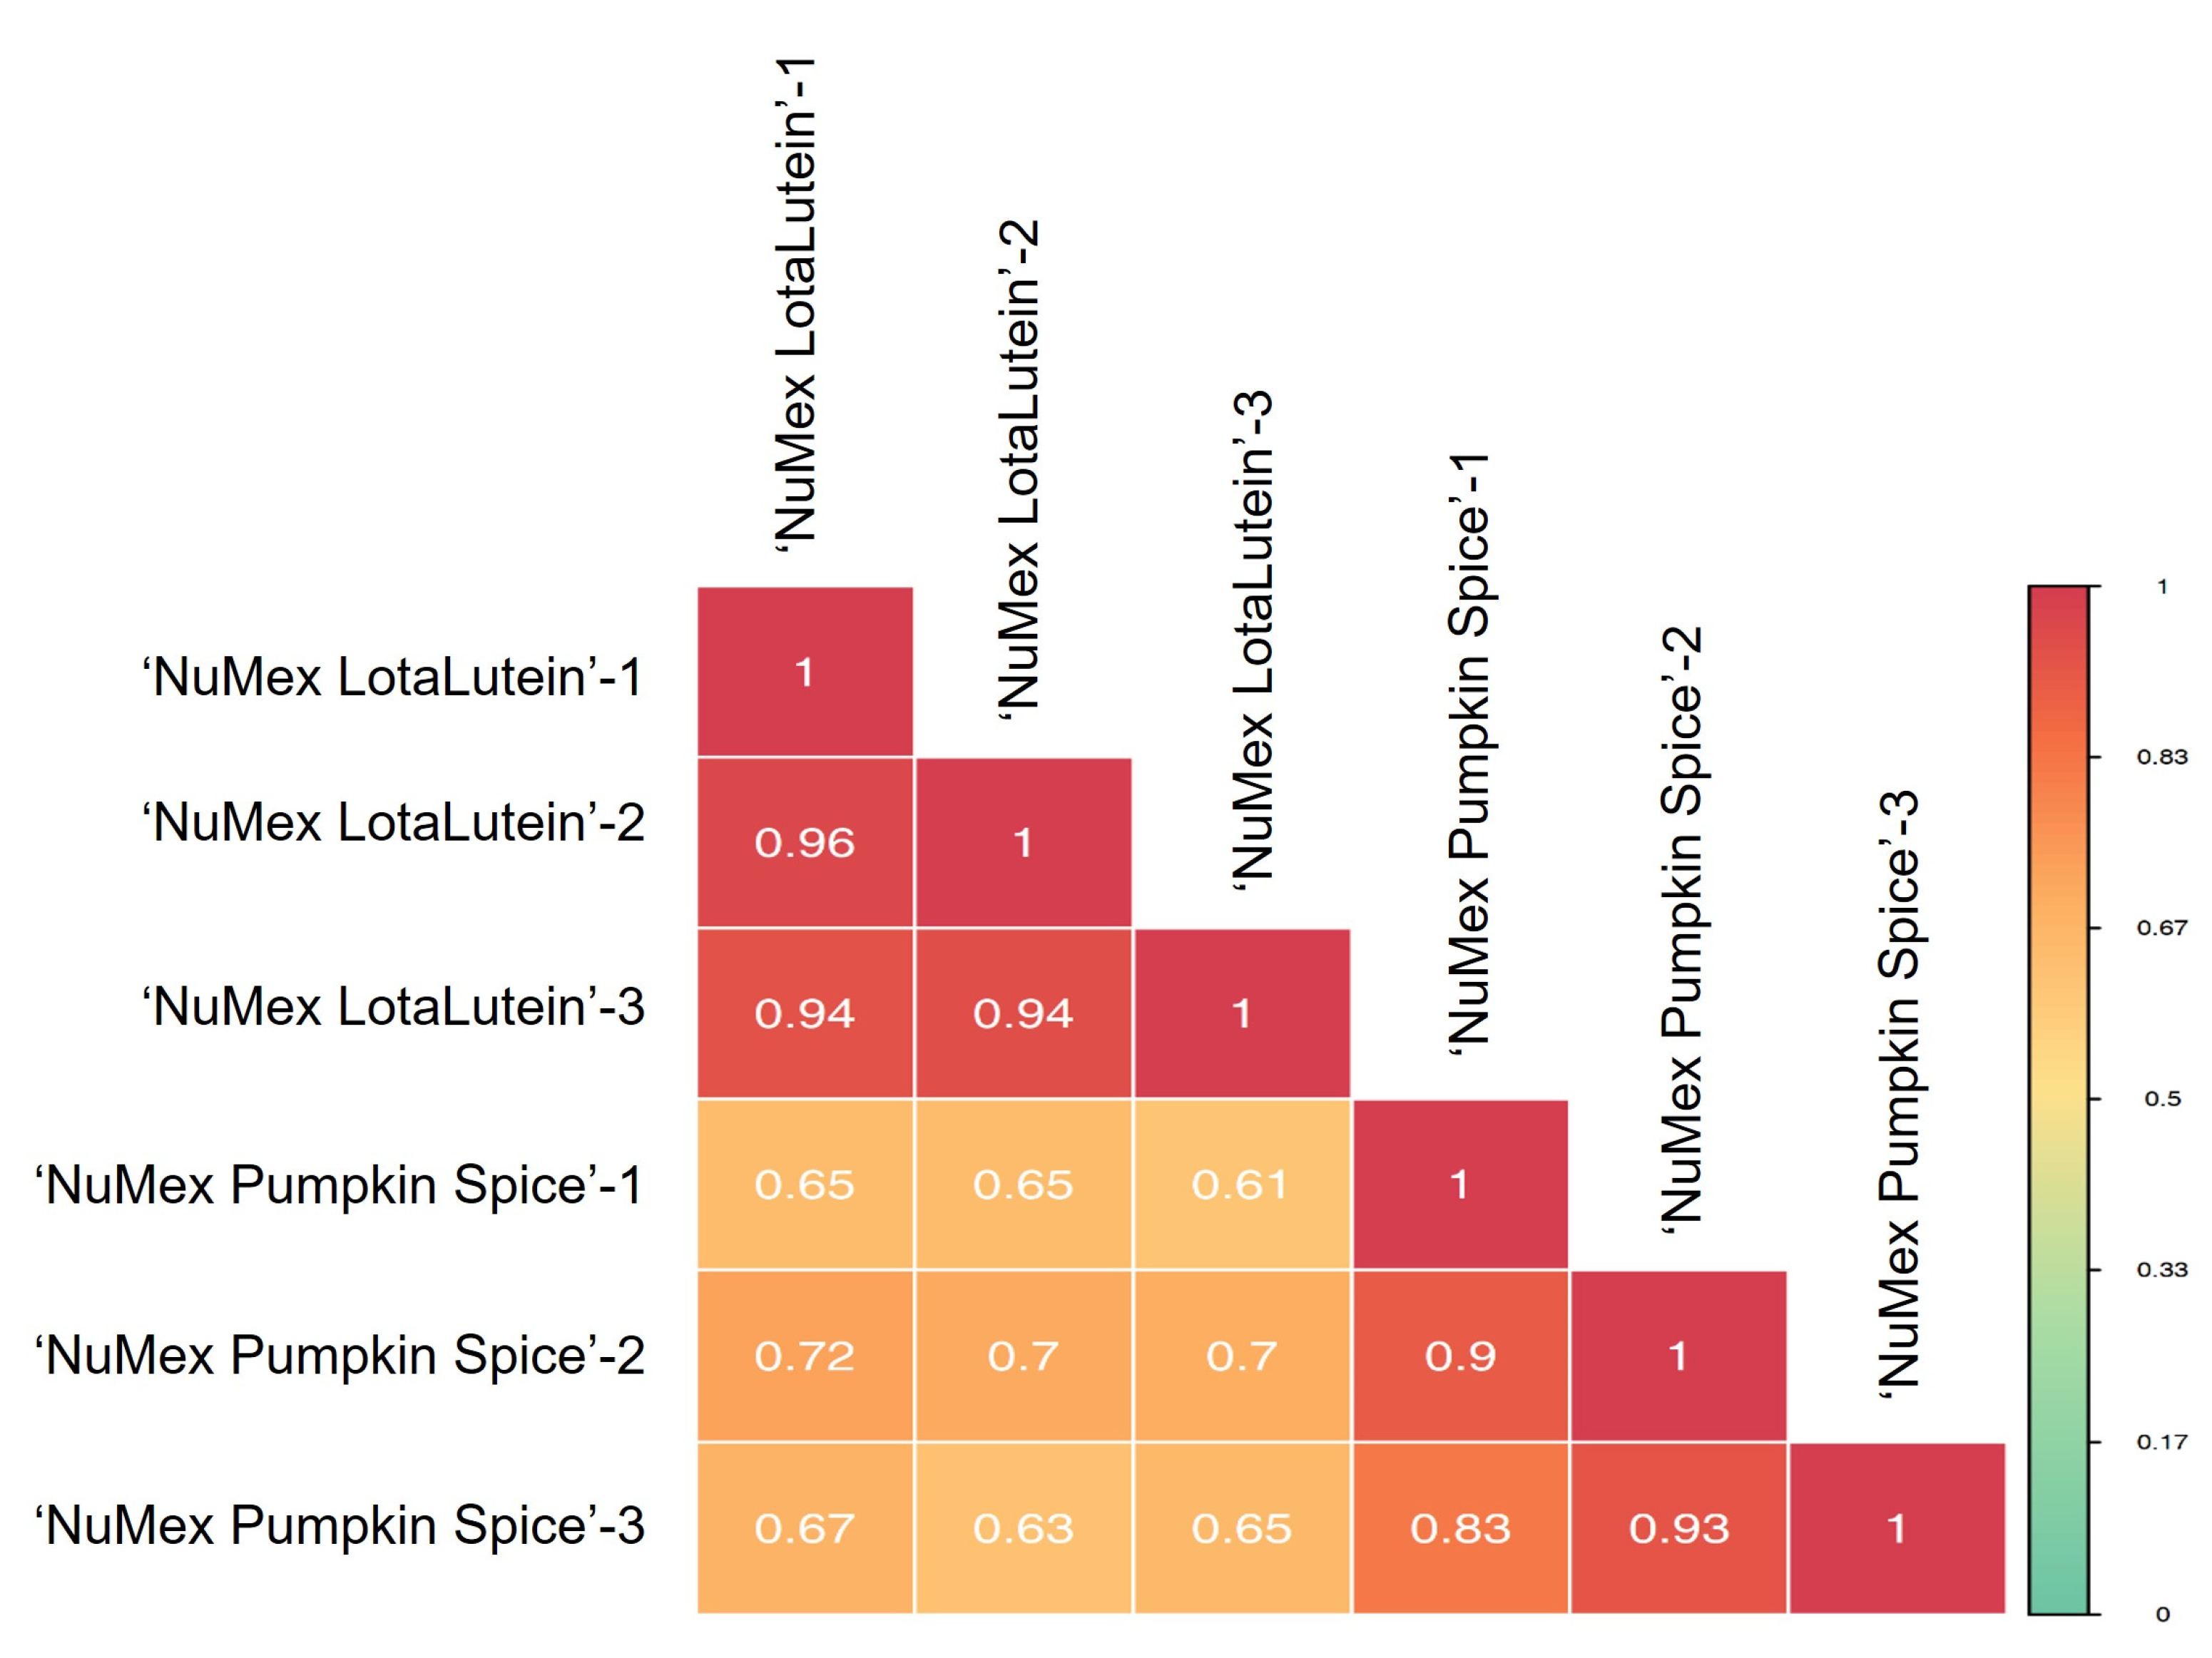
2.4. Sample Quality Control and Correlation Analysis

A quality control (QC) sample was prepared from a mixture of sample extracts to examine the repeatability of the sample under the same treatment conditions. Metabolite extraction and detection repeatability were evaluated by analyzing the overlapping display of total ion chromatogram (TIC) of different QC samples. The high stability of the instrument was related to the high repeatability and reliability of the data. The correlation between samples was established using the ‘cor’ function in R software (www.r-project.org (accessed on 4 November 2022)).

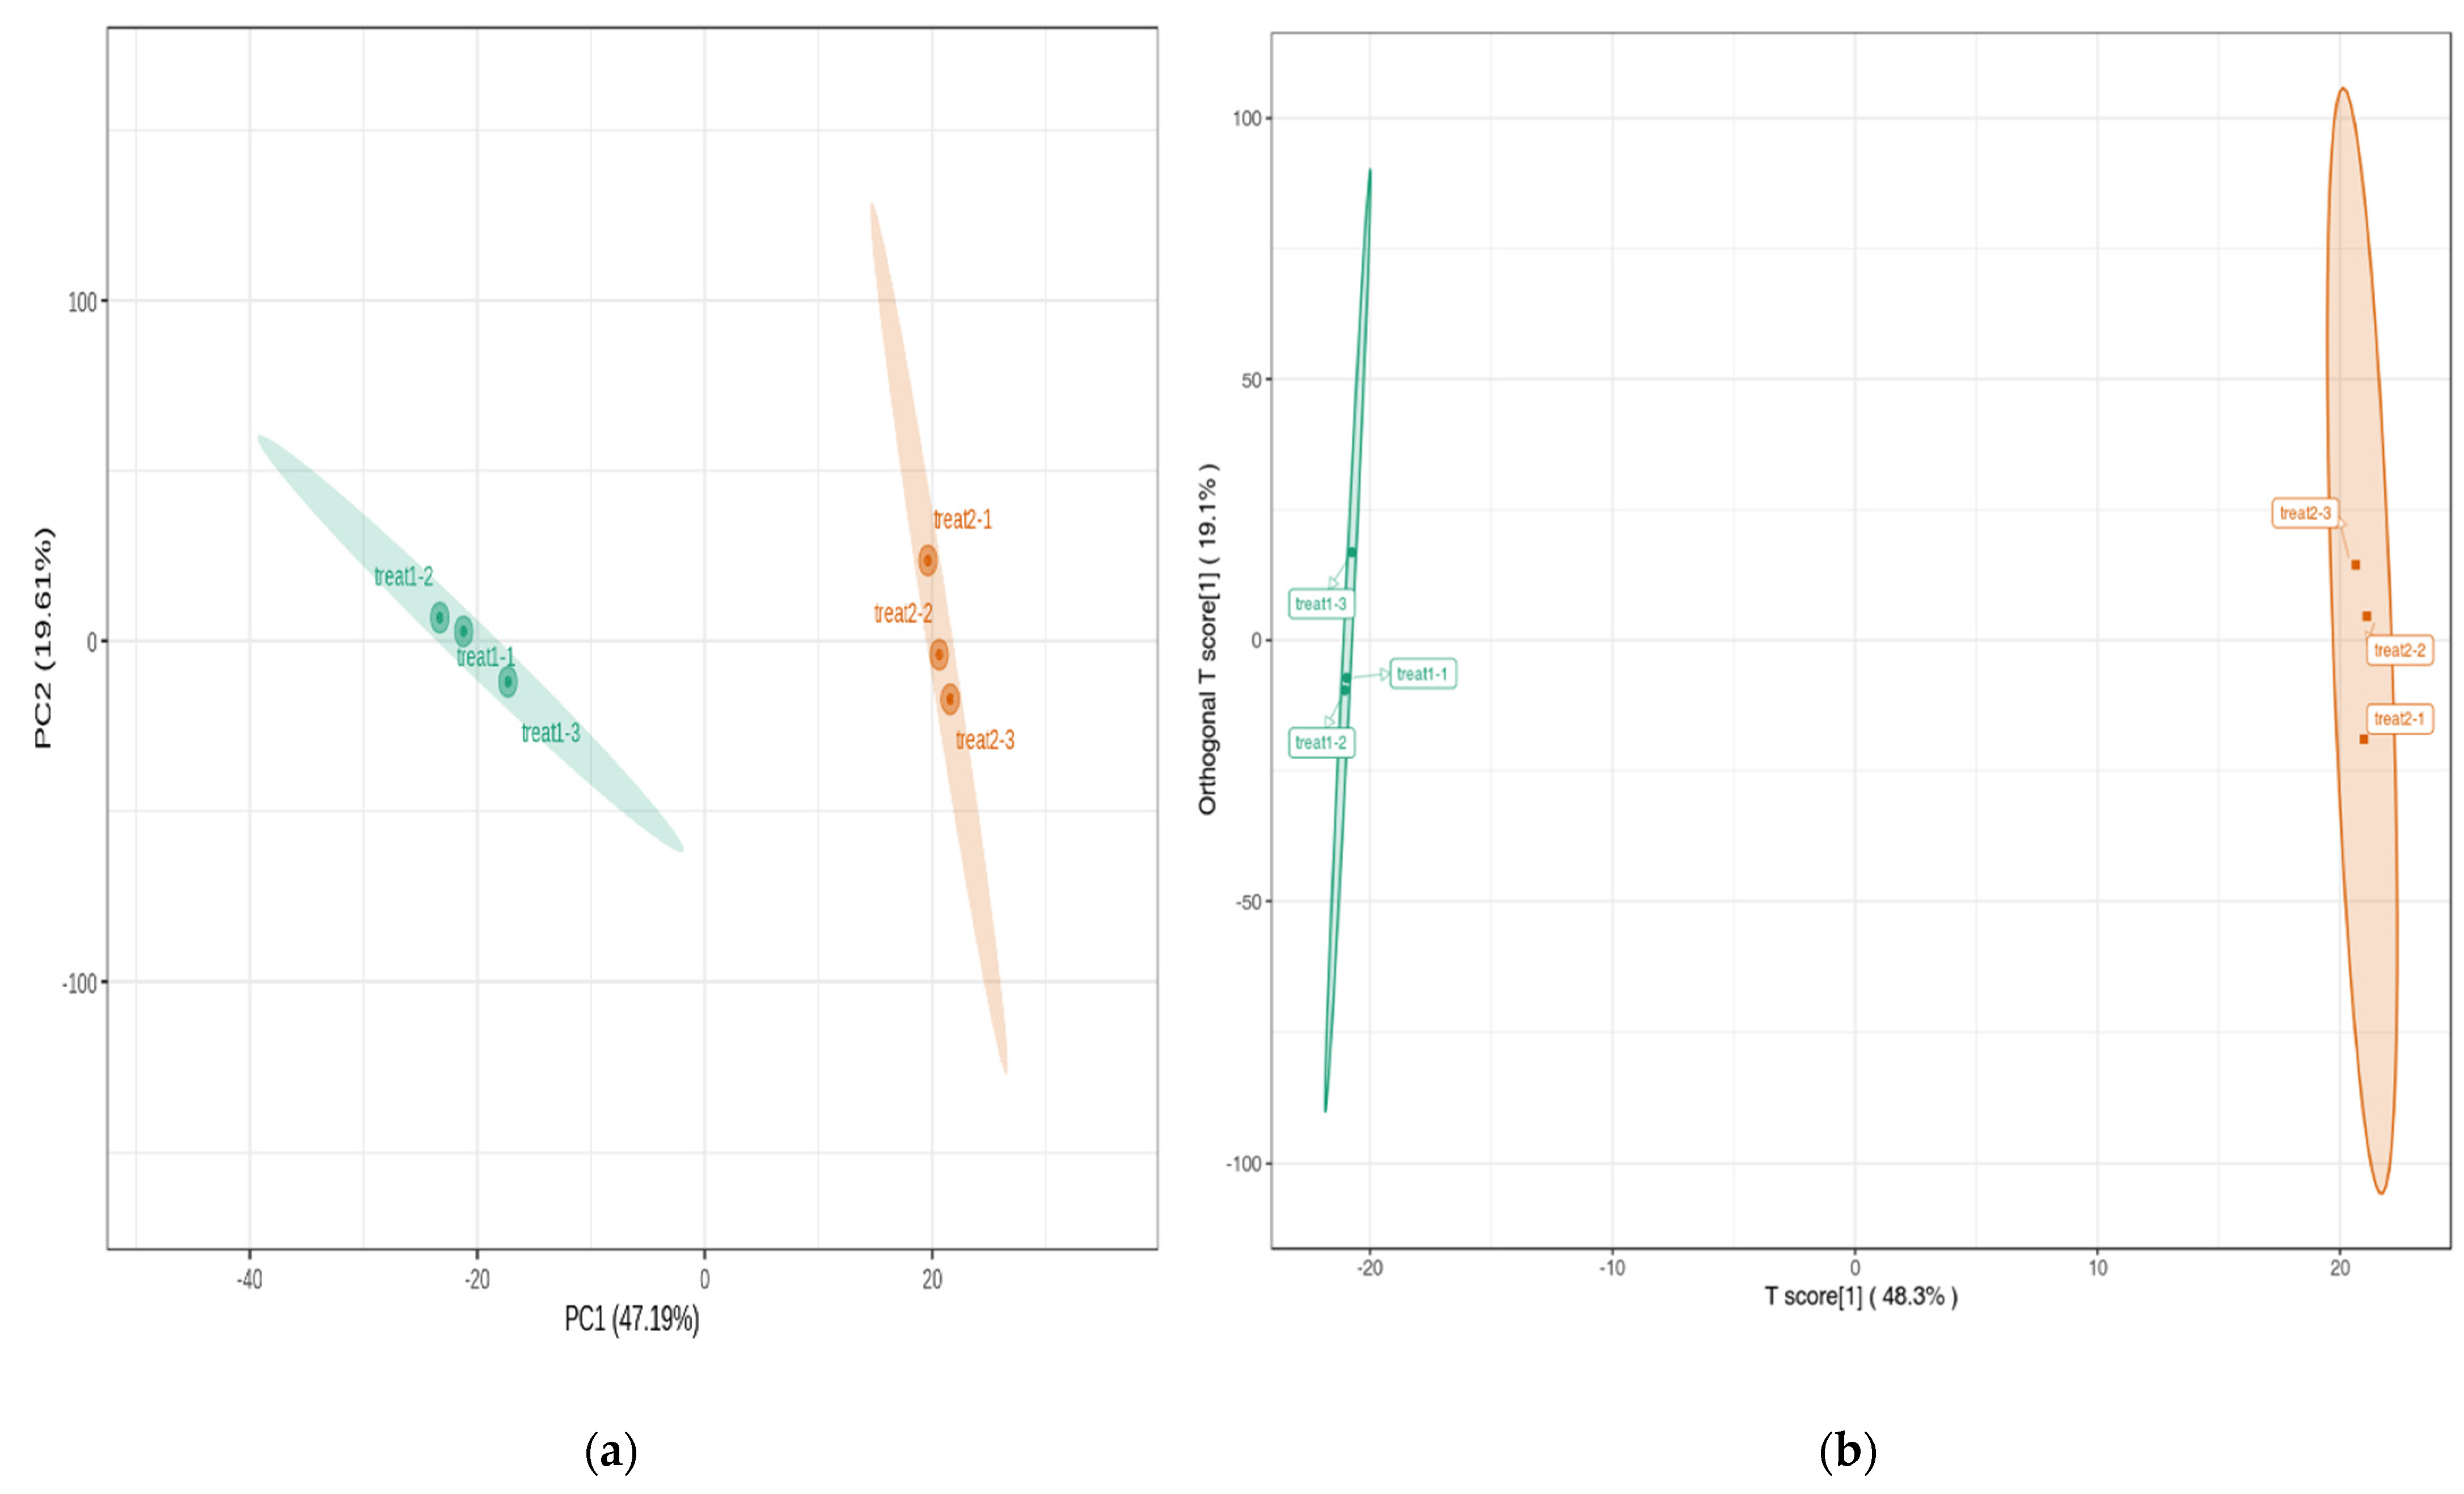
2.5. Analysis of Principal Components and Discriminant Analysis by Orthogonal Partial Least Squares

Metabolite data were compressed into N principal components (PCs) to describe the features of the dataset, where the first principal component (PC1) represented the highest degree of variation, followed by the second principal component (PC2), and so on. Principal components analysis (PCA) was performed using the ‘prcomp’ function in the R program, where parameter scale = ‘True’ demonstrated the unit variance (UV) scaling for normalizing the data. Biplots were constructed using the first two PCs (PC1 and PC2). Orthogonal partial least squares discriminant analysis (OPLS-DA) for the metabolome data was further implemented to show the differences between each group. During the modeling of OPLS-DA, X matrix information is divided into information that is either related or unrelated (i.e., noise) to Y, where the variables associated with Y are the PC, and the information unrelated to Y is the orthogonal PC [25]. The ‘OPLSR.Anal’ function in the package ‘MetaboAnalystR’ in R was used for OPLS-DA. S plots for the OPLS-DA were constructed by plotting the correlation coefficient values between the PCs and the metabolites against the covariance between the PCs and metabolites. The OPLS-DA model validation was performed using permutation tests, represented as R2X, R2Y, and Q2, where R2X and R2Y denote the explanatory rate of the model to the X and Y matrices, respectively; and Q2 signifies the prediction ability of the model. Values closer to 1 indicate a more stable and reliable model for validation.

2.6. Identification and Functional Annotation of Differentially Expressed Metabolites

Variable importance in projection (VIP) from modeling using OPLS-DA was used to determine metabolites that were differentially expressed. Given that the number of biological replicates, n, is ≥3, the different metabolites were screened by combining the fold change and VIP of the discriminant analysis model, where metabolites with VIP ≥ 1 and with fold change ≥2 or ≤0.5 at p < 0.05 were considered to be differentially expressed. Volcanic plots of the differentially expressed metabolites were constructed by plotting VIP values against the log2 (fold change; FC). Functional annotation of the differential metabolites was performed using the KEGG (Kyoto Encyclopedia of Genes and Genomes) database [26] based on the KO (KEGG Orthology) of molecular functions. The PCA, OPLS-DA model validations, and functional annotation of the different metabolites were all performed at MetWare® Bio. Screening results were based on performing comparisons of metabolite contents where the ‘NuMex LotaLutein’ was used as the control. Positive and negative values for log2FC indicate upregulation and downregulation, respectively. Upregulation signifies that the relative content for the metabolite is higher in ‘NuMex Pumpkin Spice’ than in ‘NuMex LotaLutein’ and vice versa.

3. Results

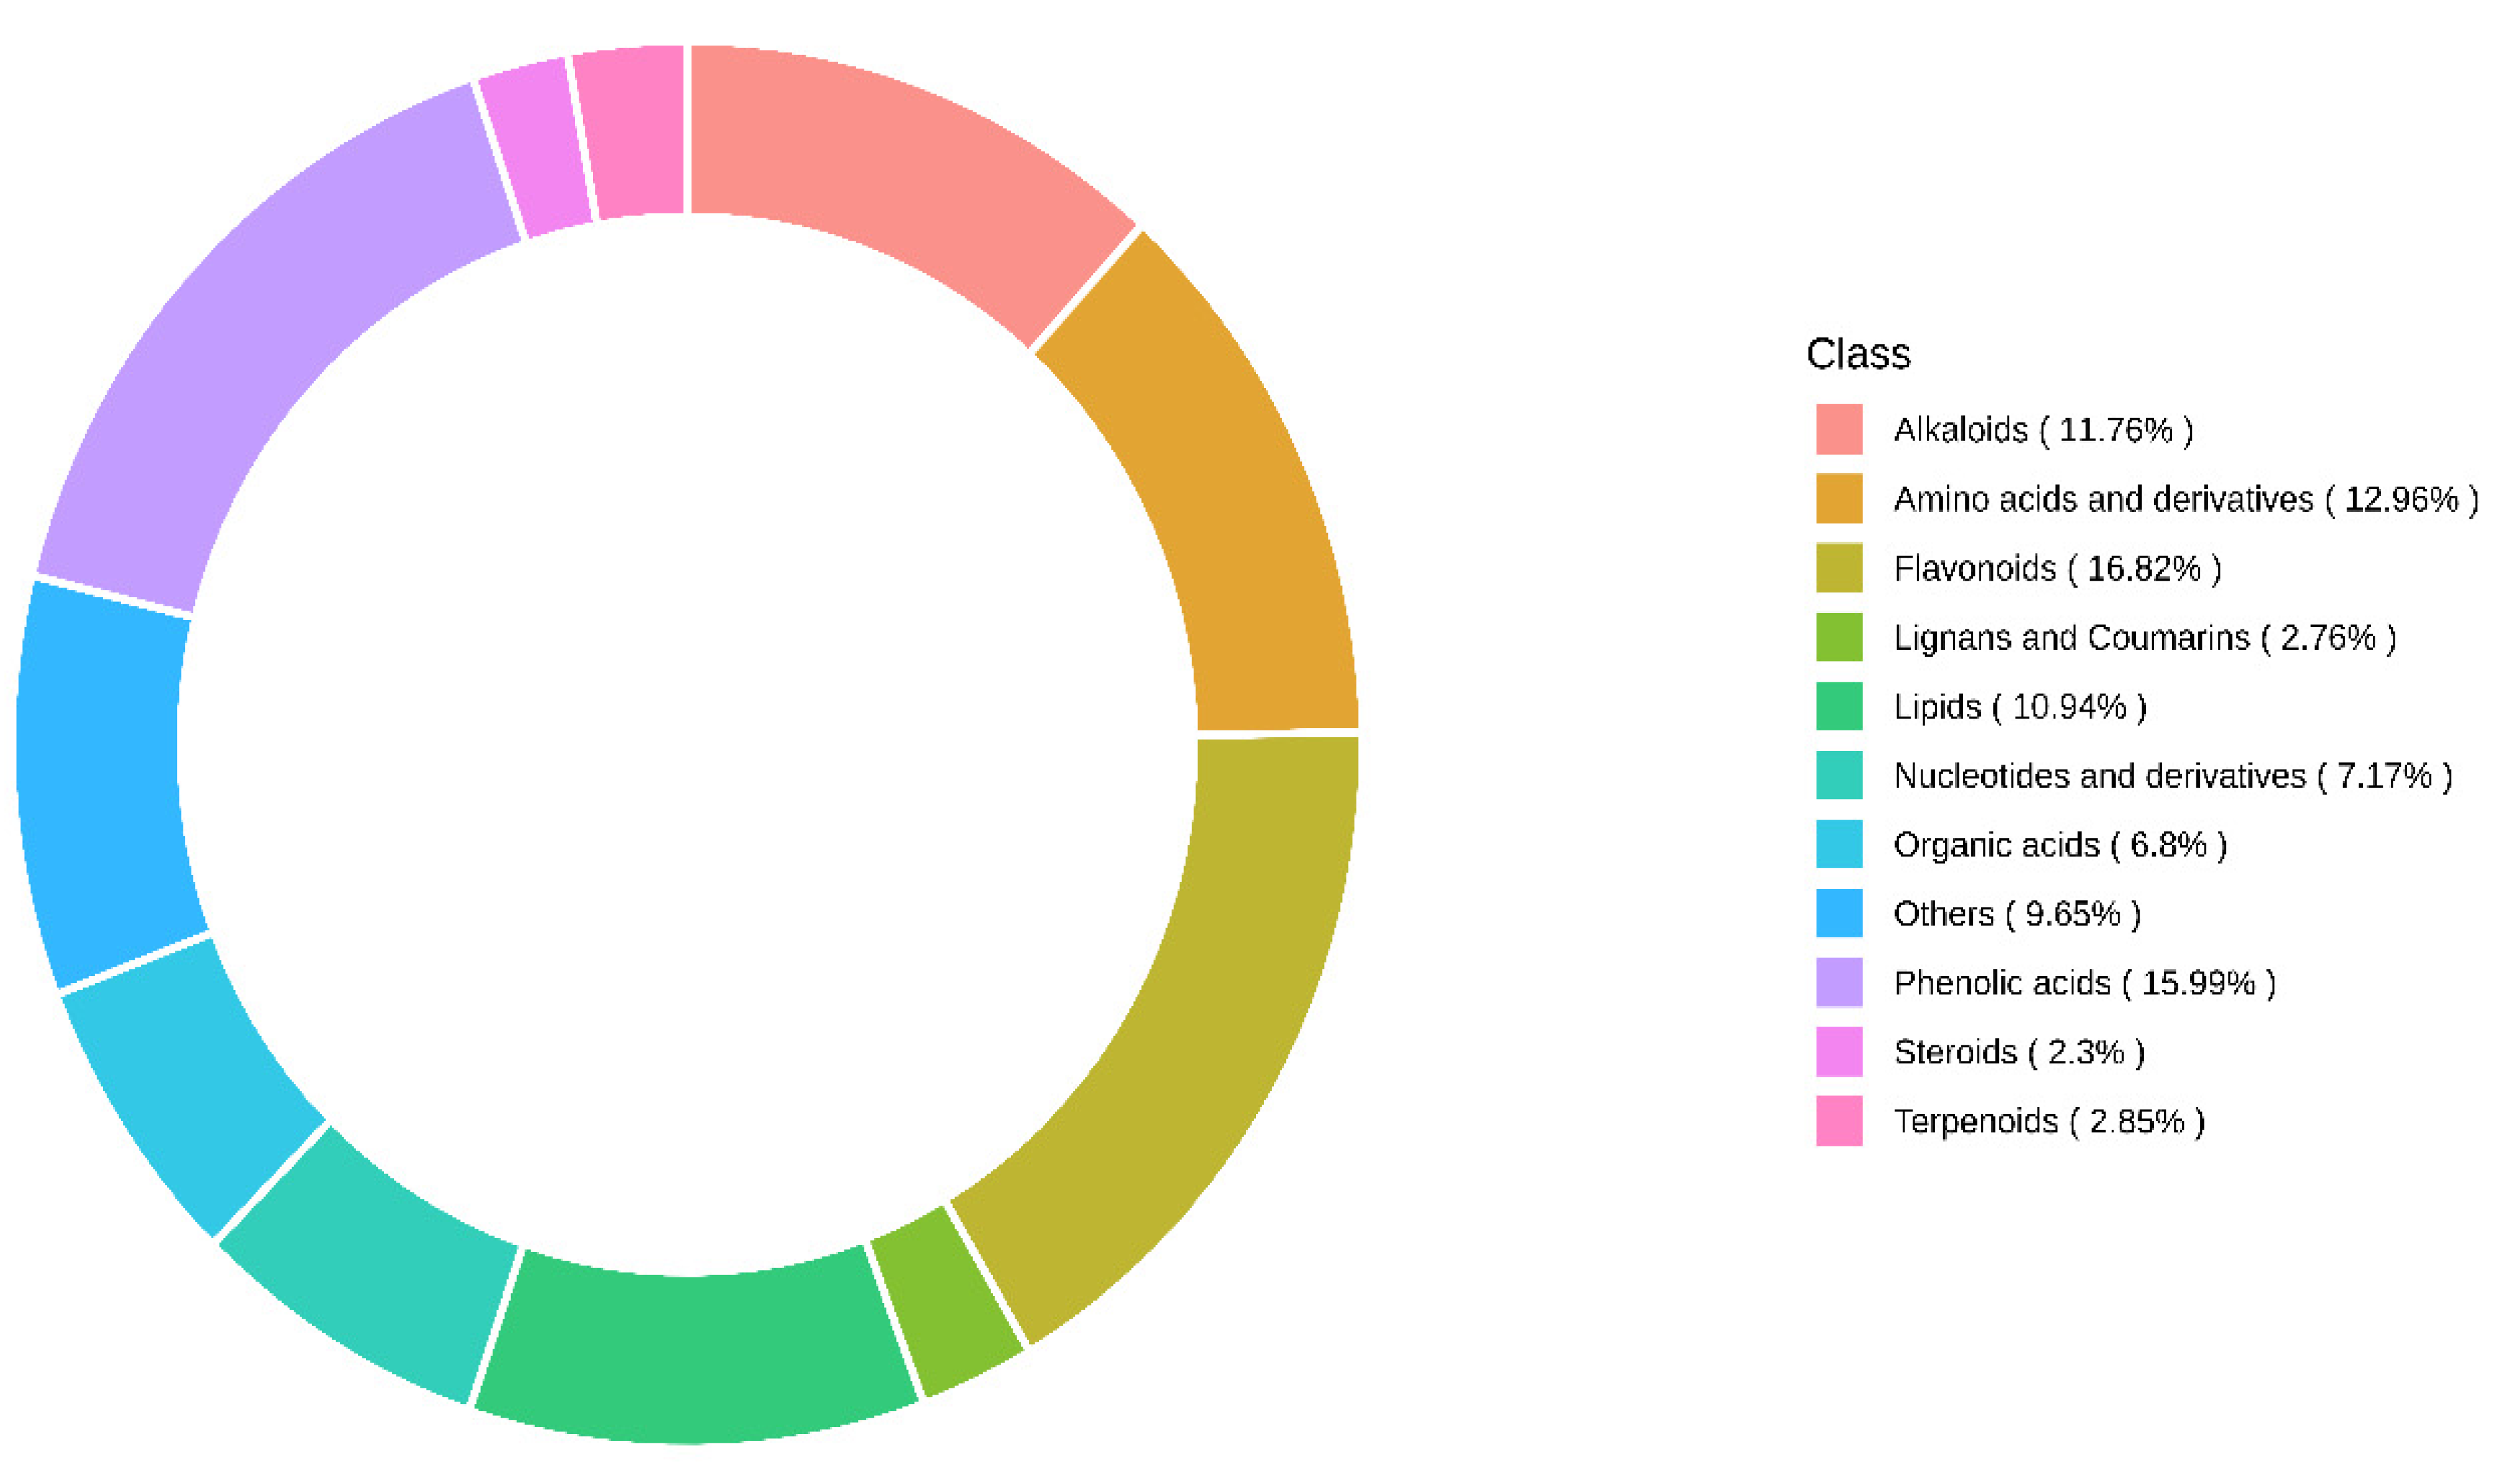
3.1. Fruit Sample Collection and Metabolite Identification

Mature fruit samples of ‘NuMex LotaLutein’ and ‘NuMex Pumpkin Spice’ were collected for metabolomic profiling. After the initial freeze drying, the weight of the ‘NuMex LotaLutein’ samples ranged between 1.72 and 2.77 g, whereas for ‘NuMex Pumpkin Spice’ weights ranged between 1.28 and 2.35 g. Using a UPLC-MS/MS system and the MetWare® in-house database, a total of 1088 metabolites were identified. Flavonoids and phenolic acids comprised 16.82% and 15.99% of the identified metabolites, respectively. Along with them, amino acids and derivatives (12.96%), alkaloids (11.76%), and lipids (10.94%) were also present in considerable quantities (Figure 2).

3.2. Analysis of Principal Components and Orthogonal Partial Least Squares

PCA has identified two distinct groups based on the cultivars, where the biological replicates from each sample were grouped together (Figure 3a). Group 1, which consisted of the ‘NuMex LotaLutein’ samples, clustered on the left side, whereas Group 2, comprising ‘NuMex Pumpkin Spice’ samples, clustered on the right side of the PCA diagram. The first principal component (PC1) contributed to 47.19% of variation, whereas PC2 was associated with 15.95% of variation. Model prediction by OPLS-DA modeling revealed consistent clustering for the samples according to cultivars (Figure 3b). A significant model for partial LS discriminant analyses was supported by the high values of the explanatory rates, R2X (0.67), R2Y (1.0), and of the prediction ability of the model, Q2 (0.94). Excluding the QC samples, the overall contributions of the T-score and orthogonal T-score for the OPLS-DA were 48.3 and 19.1%, respectively. The results from correlation analyses further supported the differentiation observed from PCA. Mean Pearson correlation coefficients of 0.92 were observed within cultivars, whereas an average of 0.66 was observed across treatments (Figure 4). Coefficient of variation (CV) values across all the QC samples also demonstrated the stability of the experimental data, with the proportion of samples having a CV less than 0.3 and 0.5 being higher than 75% and 85%, respectively. The CV across all metabolites ranged between 1.34% and 115.54%, with a mean value of 36.50%.

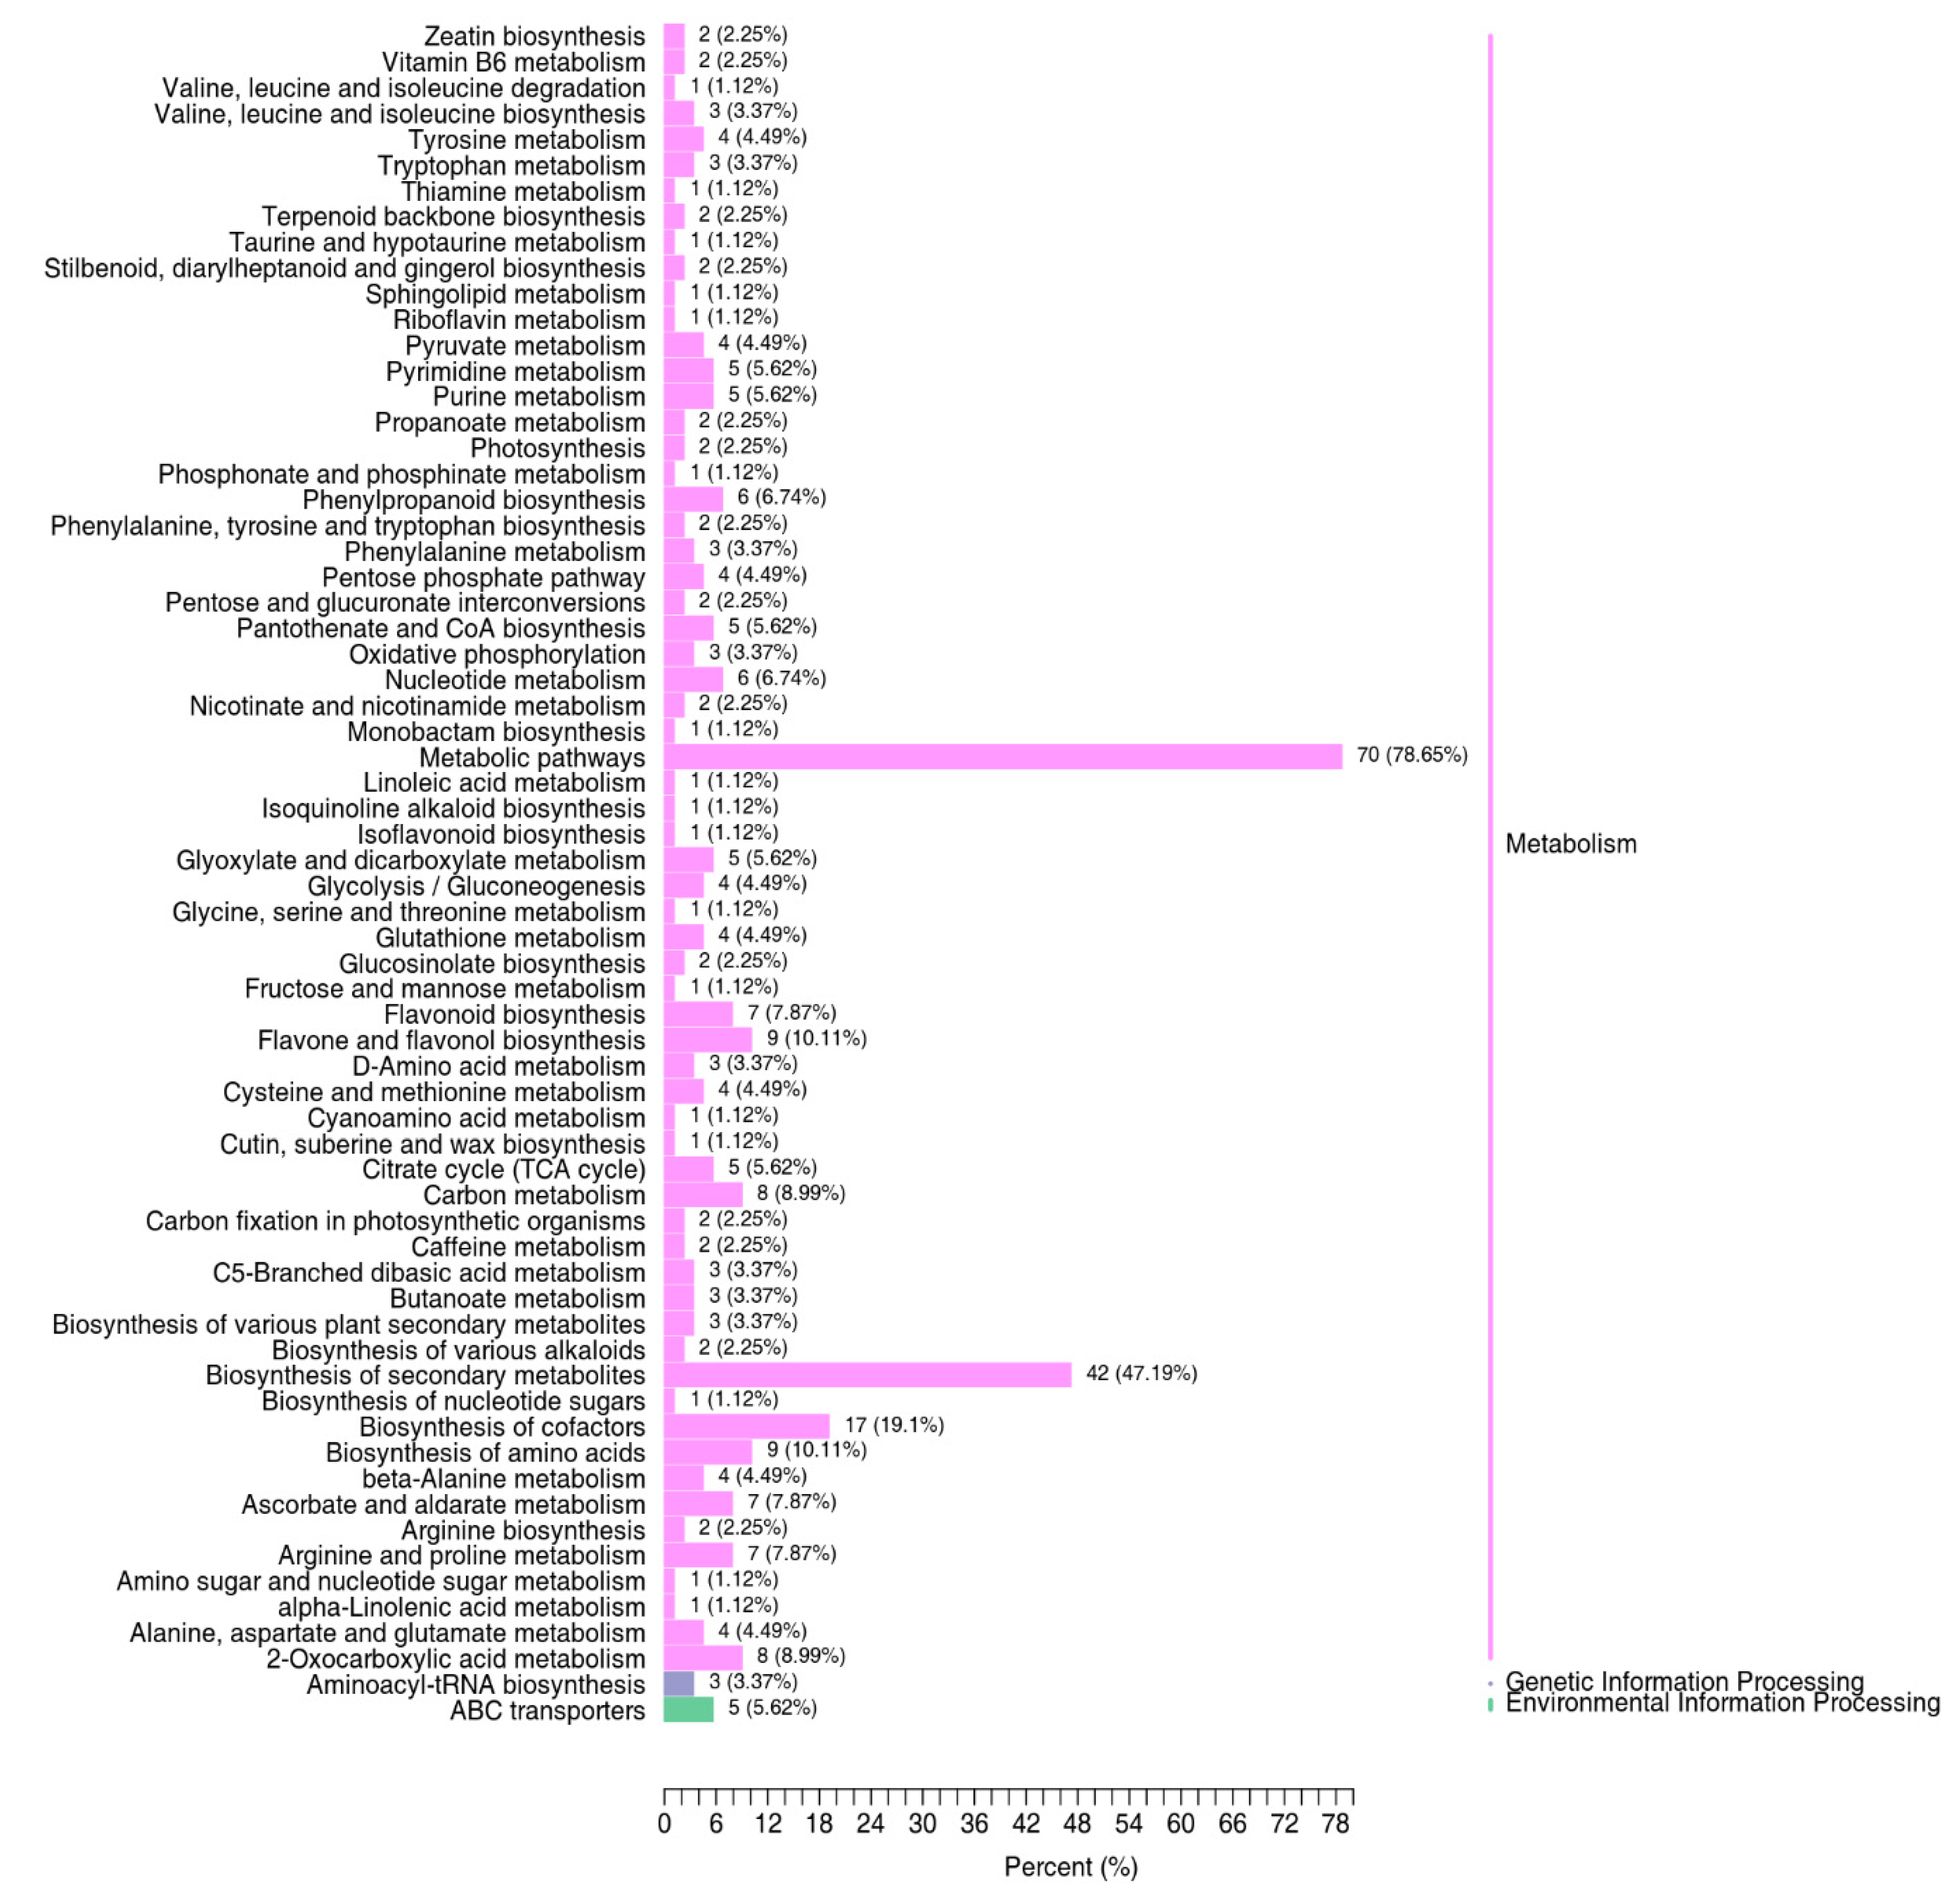
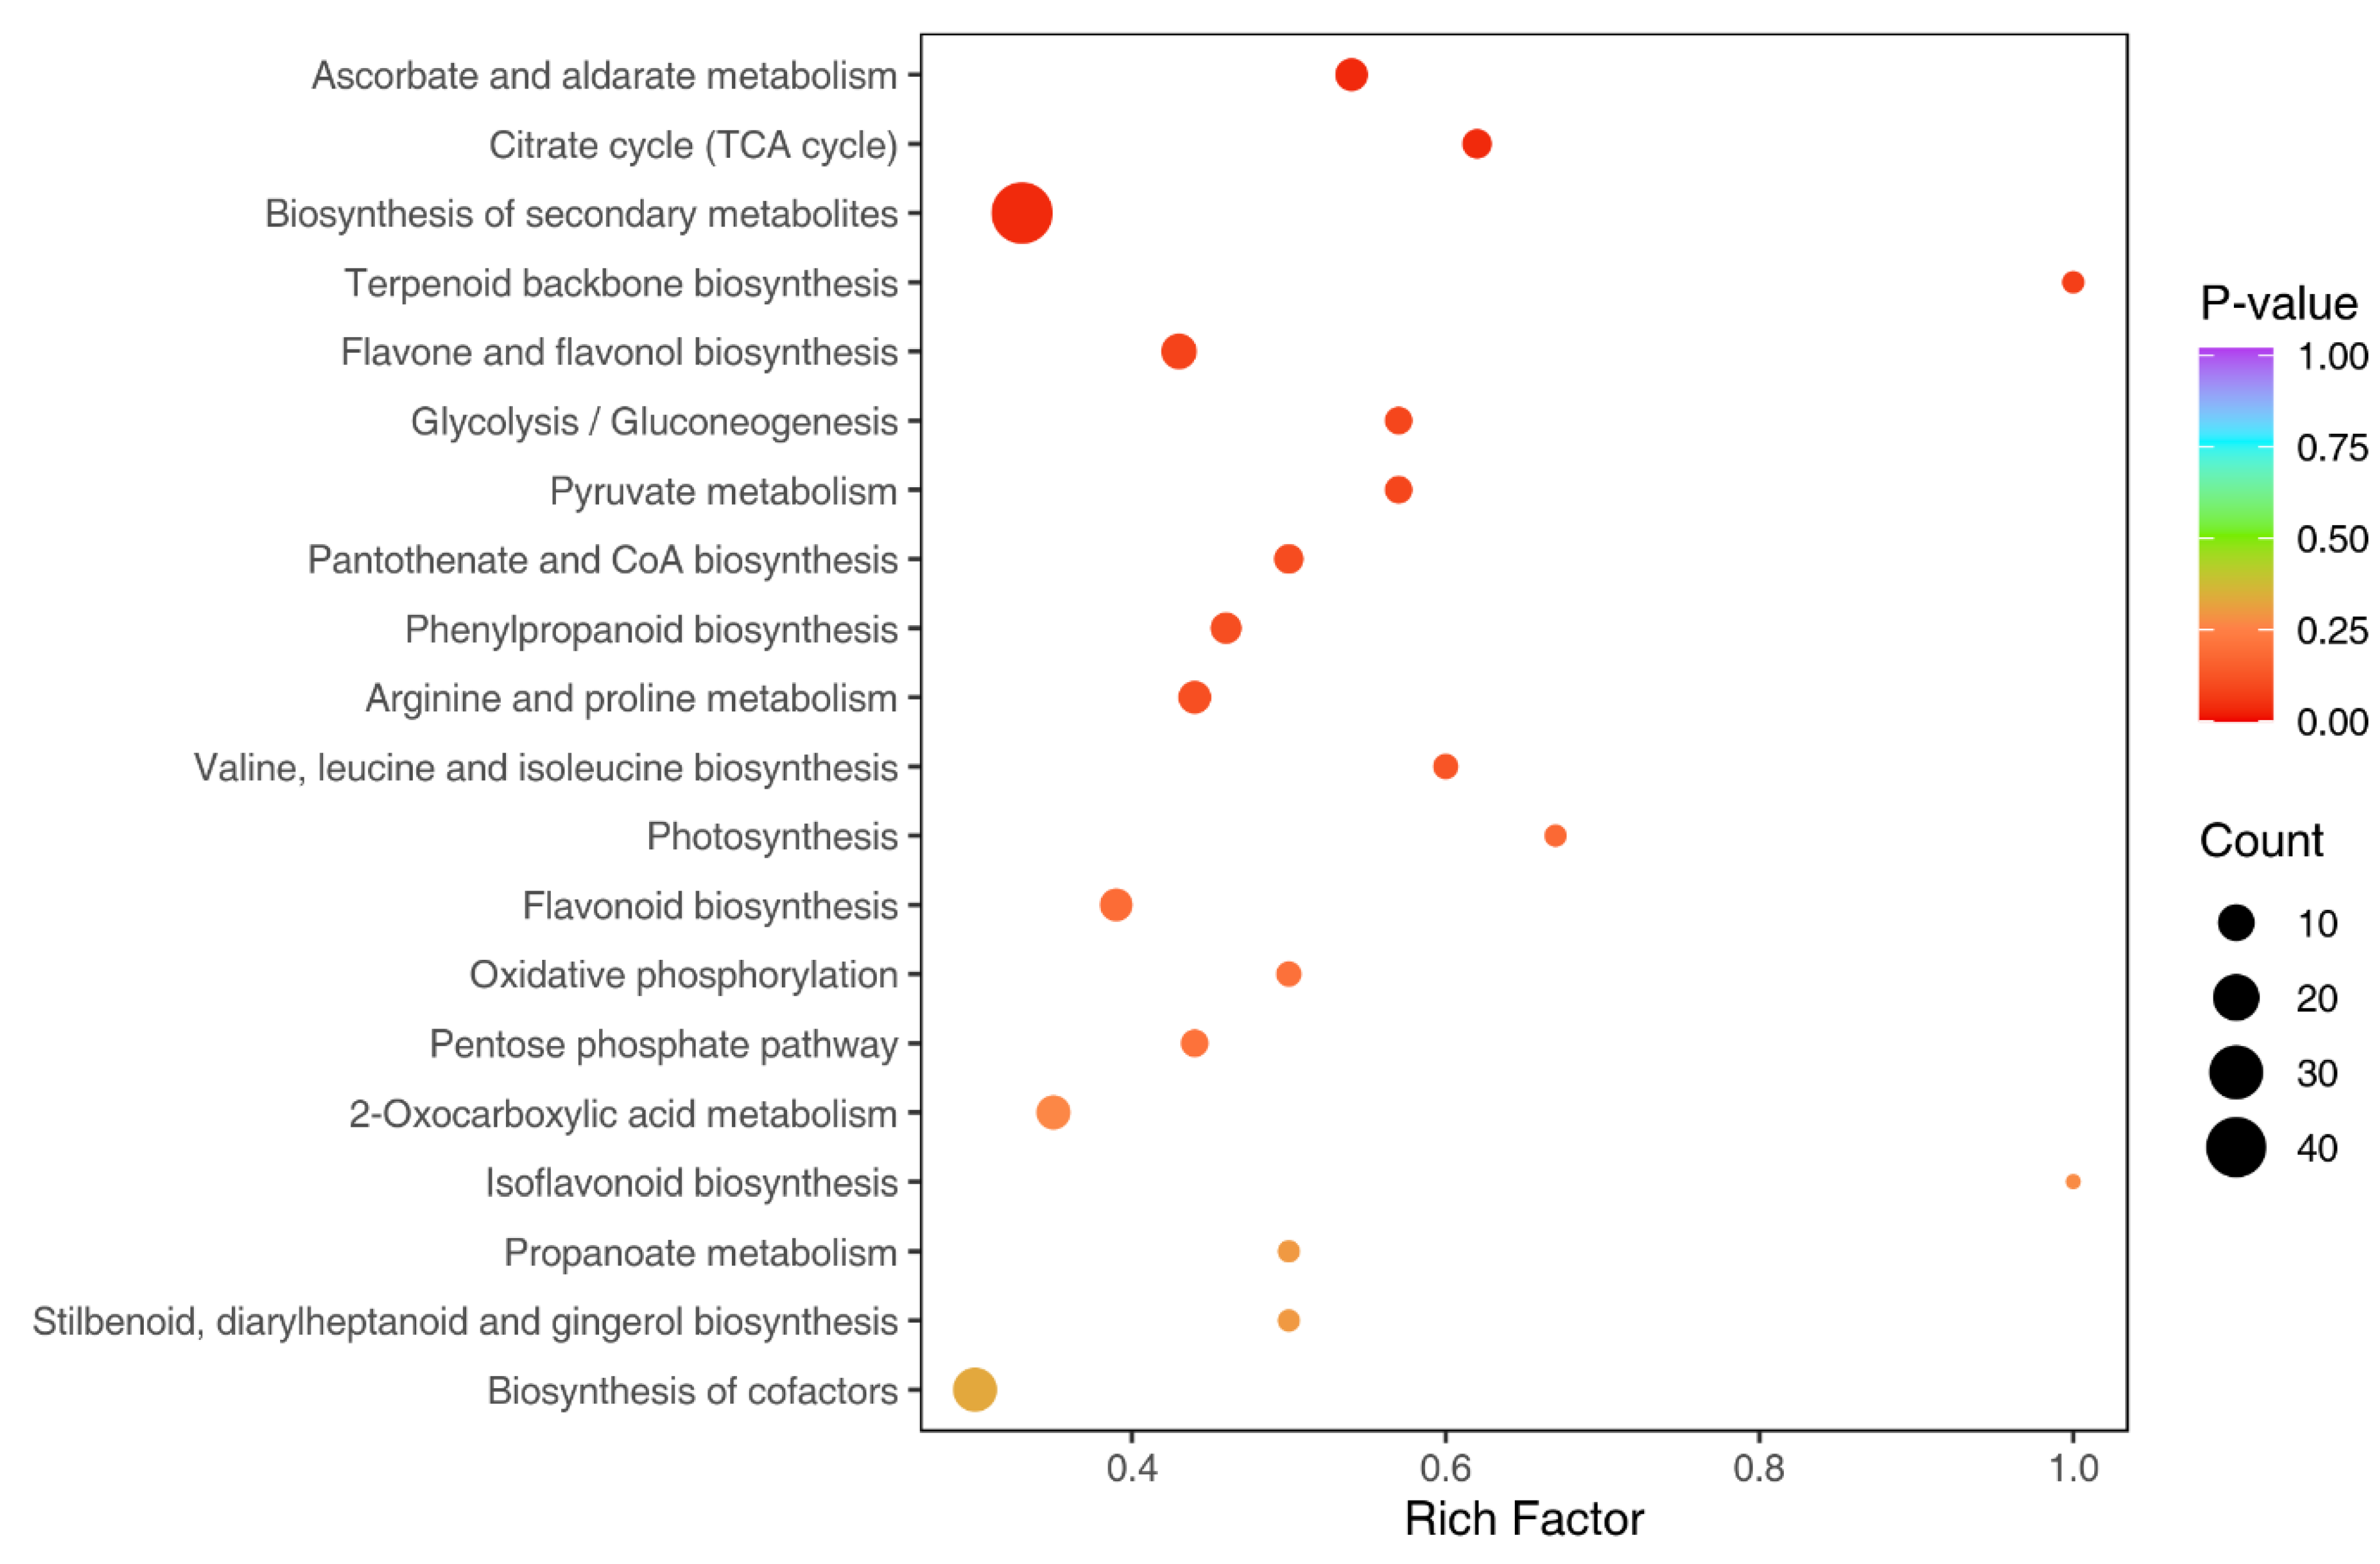
3.3. Identification and Functional Annotation of Differentially Expressed Metabolites

A total of 345 metabolites (32%) were differentially expressed, where 203 (59%) of these were downregulated and 142 (41%) were upregulated (Table S1). The upregulated metabolites were classified into 10 different classes of compounds, which mostly comprised phenolic acids (42; 30%), flavonoids (22; 15%), organic acids (13; 9%), and amino acids and derivatives (11; 8%). The downregulated metabolites mainly consisted of flavonoids (43; 21%) phenolic acids (41; 20%), and alkaloids (32; 16%), and were grouped into nine different classes. Values for log2FC of the upregulated metabolites ranged between 1 and 18, with a mean value of 2.59. An average VIP value of 1.31 was observed for all the upregulated metabolites. Capsaicin and related compounds were not differentially expressed.
Among the top 10 upregulated metabolites, eight were classified as phenolic acids, and two were flavonoids (Table 1). The average VIP and log2FC values for the top 10 upregulated metabolites were 1.42 and 9.52, respectively. 1-Phenylethanol, Dicaffeoylshikimic acid, 2-Methoxycinnamic acid, 1,3-O-Dicaffeoylquinic Acid (Cynarin), and 4-O-(4′-O-alpha-D-Glucopyranosyl)caffeoylquinic acid, all phenolic acids, were the top five upregulated metabolites, with log2FC values of 18.04, 16.4, 13.33, 8.06, and 7.52, respectively. For the top ten downregulated metabolites, three were phenolic acids, six were flavonoids, and one was an alkaloid. Mean values for the VIP and log2FC for the top 10 downregulated metabolites were 1.42 and -91.68, respectively. Phenolic acids and flavonoids comprised the top five downregulated metabolites; namely, 3,6-Di-O-caffeoyl glucose (log2FC value = −16.73), Rosmarinic acid methyl ester (−15.36), 2,3-Dimethoxybenzaldehyde(−14.93) (all three are phenolic acids), and Quercetin-3-O-(2′′-O-rhamnosyl)rutinoside-7-O-glucoside (−11.96) and Quercetin-3-O-(6′′-O-acetyl)glucosyl-(1→3)-Galactoside (−6.01) (both flavonoids).
The KEGG database was used in order to understand the metabolite content as a whole network in the form of metabolic pathways. A total of 89 differentially expressed metabolites had annotation from the KEGG database, where 36 metabolites were upregulated and 53 were downregulated (Table S2). The top 10 upregulated metabolites comprised mostly phenolic acids, whereas the top 10 downregulated metabolites with annotation consisted mostly of flavonoids (Table 2). Classification based on annotation from the KEGG database revealed that of the differentially expressed metabolites, 70 (78.65%) were annotated to be involved in metabolic pathways. A total of 42 (47.19%) and 17 (19.1%) metabolites were associated with the biosynthesis of secondary metabolites and of cofactors, respectively (Figure 5). The upregulated metabolites with KEGG annotation were classified into seven different groups that comprised organic acids, nucleotides and derivatives, and flavonoids, among others. Similarly, downregulated metabolites comprised eight different groups, including amino acids and derivatives, organic acids, alkaloids, and phenolic acids. Flavonoids, phenolic acids, organic acids, and nucleotides and derivatives comprised the top 10 differentially expressed upregulated metabolites with KEGG database map annotation. The significant enrichment of metabolites involved in terpenoid backbone biosynthesis was demonstrated (rich factor (RF) value of 1). Differential metabolites involved in photosynthesis also showed significant enrichment, with an RF value equal to 0.65 (Figure 6). Functions related to the biosynthesis of secondary metabolites including lutein (β,ε-carotene-3,3′-diol), the predominant compound in the ‘NuMex LotaLutein’ serrano pepper, have been annotated in the KEGG Orthology database for a number of differentially expressed metabolites identified.

4. Discussion

Chile pepper fruits possess many compounds of high nutritive values which can be integrated in the human diet to mitigate nutritional deficiencies. Crop nutrition is important not only for offering quality and economic value to growers, but also for providing nutritional security to consumers [27]. Since their initial application to examine plant functional genomics in the early 2000s [28,29,30], metabolomics approaches have been used to understand the different biochemical and physiological pathways for the selection of optimal alleles for the improvement of crops [31]. In the current study, a representative jalapeño and a serrano cultivar grown in New Mexico, USA, were subjected to widely targeted metabolomics to survey the different metabolites present in their fruit samples. The identified metabolites were able to distinguish the representative cultivars. The majority of the differentially expressed metabolites comprised the phenolic acids and the flavonoids. Metabolomics could be integrated with genomics-assisted approaches to facilitate the breeding and selection of chile pepper cultivars with improved nutritive value for consumers.

4.1. Metabolite Profiles Successfully Discriminate Jalapeño and Serrano Type Chile Peppers

Though crop metabolite profiling is an important area of nutritional and health research, this information can also be used for the classification of peppers. Principal components and partial least discriminant analyses are relevant for the classification of metabolomic datasets based on different factors such as variety, location, and their interactions [32]. In the current study, the jalapeño and serrano type chile peppers were differentiated based on their metabolite profiles. Both PCA and OPLS-DA showed consistent clustering based on cultivars, with total variation explained by the first two PCs reaching a total of 63%, indicating that the cultivars were significantly different from each other. The values for Q2, R2X, and R2Y derived from performing OPLS-DA further support the good predictive ability and reproducibility of the model in classifying the cultivars based on metabolomic information. Correlation analyses within sample treatments were significant (p < 0.0001), demonstrating clustering based on the cultivars. Genomic information using 66,650 single nucleotide polymorphism markers, nonetheless, previously classified ‘NuMex LotaLutein’ and ‘NuMex Pumpkin Spice’ in the same cluster [33], indicating high genetic relatedness; yet, implementing a metabolomic approach can resolve differences between the cultivars.
Metabolite profiles have been previously used for species differentiation and cultivar identification in chile peppers. Capsaicinoid and flavonoid contents, for example, were recently used as biochemical markers to distinguish Jize from Korean chile peppers [34]. In another study, an untargeted metabolomics approach identified biomarkers, including flavonoids, steroids, terpenoids, anthocyanin, and carboxylic acids, and characterized three Capsicum species (C. baccatum, C. chinense, and C. frutescens) from a collection of native South American chile peppers [35]. Eleven Mexican C. annuum cultivars were differentiated based on their metabolomic fingerprints, which consisted of sugars, amino acids, organic acids, polyphenolic acids, and alcohols [36]. Serrano peppers from Mexico were grouped in two different clusters based on their metabolite profiles, which included organic acids, sugars, amino acids, and polyphenols [37]. In contrast, using a single metabolite (i.e., capsaicin) alone did not successfully discriminate ‘Superhot’ chile peppers cultivated across multi-year trials in New Mexico [38]. Taken together, our results and those of previous studies indicate that a ‘macroscale’ metabolomic profiling would be more advantageous than using only a single metabolite in cultivar identification and species differentiation in Capsicum.

4.2. Differentially Expressed Metabolites Have Implications on Human Health and Nutrition

Widely targeted metabolomics for jalapeño and serrano peppers revealed differentially expressed metabolites comprising mostly of upregulated phenolic acids and flavonoids. Phenolic acids are among the most commonly found compounds in Capsicum fruits and have been observed to possess vital functions in human health, nutrition, and the prevention of diseases because of their antioxidant, antiviral, and antibacterial properties [5,39]. Phenolics have been previously identified in different species of peppers, including C. annuum cultivars from India [40]; C. annuum, C. chinense, and C. baccatum cultivated in New Mexico [41]; C. baccatum [42]; and C. frutescens and C. chinense cultivars from Peru, South America [35]. The human body cannot produce phenolic compounds; hence, they must be acquired from food sources [5]. Major phenolic acid derivatives, caffeic acid (CA), sinapic acid (SA), and ferulic acid (FA) [5], were observed to be differentially expressed in the present work; CA and FA were upregulated, whereas SA was downregulated. Flavonoids (e.g., quercetin and luteolin) were also detected to be differentially expressed, consistent with previous studies [43,44,45,46]. A total of 23 quercetin metabolites were found to be differentially expressed, where five metabolites (namely, quercetin-3-O-sambubioside-5-O-glucoside, 3-O-methylquercetin, 3,7-di-O-methylquercetin, quercetin-3-O-(2′′-O-malonyl)sophoroside-7-O-arabinoside, and 6-methoxyquercetin-3-O-rhamnoside) were upregulated and the remaining 18 metabolites were downregulated. A total of 10 differentially expressed metabolites belong to the luteolin class, comprising mostly upregulated compounds (luteolin-4′-O-glucoside, luteolin-7-O-glucoside (cynaroside), luteolin-7-O-sophoroside-5-O-arabinoside, luteolin-7-O-gentiobioside, luteolin-7,3′-di-O-glucoside, and luteolin-7-O-glucuronide). Capsaicin and related families of ‘pungent’ alkaloids (or ‘pseudoalkaloids’), however, were not observed to be differentially expressed in the current study, a potential consequence of the maturity (age) of the fruit samples used for analyses. Overall, the information for the differentially expressed metabolites and their corresponding chemical classes reveal that pepper fruits can be good sources of these nutritional compounds in the diet.
The KEGG map annotations for a number of the differentially expressed metabolites were related to multiple metabolic pathways such as the biosynthesis of secondary metabolites (KO01110), including lutein (β,ε-carotene-3,3′-diol), which is the predominant metabolite in the ‘NuMex LotaLutein’ serrano pepper [23]. The production of lutein in plants generally takes place through the mevalonate pathway, in which isopentyl diphosphate (IPP) is converted to geranylgeranyl pyrophosphate (GPP), which is then synthesized into phytoene and lycopene, the precursor of lutein [47,48,49]. The most upregulated phenolic acid, chlorogenic acid (3-O-caffeoylquinic acid), had four different pathway annotations related to phenylpropanoid biosynthesis (pathway ID: KO00940); flavonoid biosynthesis (KO00941); stilbenoid, diarylheptanoid, and gingerol biosynthesis (KO00945); and the biosynthesis of secondary metabolites (KO01110). 3,7-Di-O-methylquercetin (flavonoid) and phenol (phenolic acid) had two pathway annotations; namely, K00944 and KO01110 (secondary metabolite biosynthesis), and KO00350 (Tyrosine metabolism) and KO01110 (secondary metabolite biosynthesis). Adenosine 5′-triphosphate (ATP), also an upregulated metabolite, has seven different KEGG pathway annotations, including oxidative phosphorylation (KO00190), photosynthesis (KO00195), nucleotide metabolism (KO01232), and the biosynthesis of cofactors (KO01240), among others. Altogether, these functional annotations indicate the relevance of these upregulated compounds in the production of a wide array of important nutritional metabolites in Capsicum.

4.3. Integrating Metabolomics with Genomics Can Direct Breeding and Selection Decisions for Nutritional Quality Trait Improvement in Chile Pepper

Metabolomics can render insights into the different metabolites which can be targeted further for breeding and selection using different genomics tools such as metabolite-quantitative trait loci (mQTL) analyses, metabolite-based genome-wide association studies (mGWAS), and metabolite-genome predictions [50]. Variation in the phenolic acid content in chile peppers is affected by the varietal type, location, and growing season, and, hence, can impose challenges on performing breeding and selection [32]. Given the complex nature of these phenotypes, caution must be observed when performing the collection of fruit samples for metabolomics analyses to minimize the errors and variation due to sampling. The high accuracy, reliability, and stability of the widely targeted metabolomics approach implemented in the current study, as indicated by the high values of R2X, R2Y, and model prediction ability, and the low values for CV, nonetheless, can mitigate the effects of sampling and environmental variation. It might also be necessary to survey the metabolite compositions of cultivated and wild relatives of the chile pepper for a more robust foundation for targeted genomic breeding strategies [39]. Altogether, ‘multi-omics’ tools (e.g., genomics + metabolomics) can help plant breeders perform informed breeding and selection decisions for the development of cultivars with improved nutritional quality traits [51].

5. Conclusions

A widely targeted metabolomics approach revealed differentially expressed metabolites in jalapeño (‘NuMex Pumpkin Spice’) and serrano (‘NuMex LotaLutein’) type peppers grown in New Mexico. Metabolomic profiles successfully distinguished the cultivars, indicating that metabolites can serve as efficient markers to differentiate chile pepper varieties. Upregulated metabolites comprised of phenolic compounds and flavonoids, which have potential implications in improving human health and nutrition when incorporated in the diet. The diversity of metabolites observed in the present work supports the nutritional value of chile peppers and can direct important breeding and selection decisions for designing more nutritious specialty vegetable crops in the future.

Supplementary Materials

The following supporting information can be downloaded at: https://www.mdpi.com/article/10.3390/metabo13020288/s1, Table S1: Metabolites identified for jalapeno- and serrano-type chile peppers, Table S2: Differentially expressed metabolites identified for jalapeno- and serrano-type chile peppers and their corresponding map annotations from the KEGG database.

Author Contributions

Conceptualization, D.N.L.; methodology, D.N.L. and S.R.P.; resources, D.N.L.; data curation, D.N.L.; writing—original draft preparation, D.N.L.; writing—review and editing, S.R.P. and F.O.H.; supervision, D.N.L.; project administration, D.N.L.; funding acquisition, D.N.L. All authors have read and agreed to the published version of the manuscript.

Funding

This research was funded by the US Department of Agriculture National Institute of Food and Agriculture (USDA-NIFA) Grant No. 2022-67014-37078.

Institutional Review Board Statement

Not applicable.

Informed Consent Statement

Not applicable.

Data Availability Statement

Data will be available from the authors upon reasonable request due to privacy or ethical restrictions.

Acknowledgments

The Authors would like to thank Seyed Shahabeddin Nourbakhsh for assistance in collecting fruit samples and Maryfrances Miller for editing the manuscript. The assistance of Jeffrey Chu (MetWare Bio) on the metabolomic data is also appreciated.

Conflicts of Interest

The authors declare no conflict of interest.

References

  1. Martínez-Ispizua, E.; Martínez-Cuenca, M.-R.; Marsal, J.I.; Díez, M.J.; Soler, S.; Valcárcel, J.V.; Calatayud, Á. Bioactive Compounds and Antioxidant Capacity of Valencian Pepper Landraces. Molecules 2021, 26, 1031. [Google Scholar] [CrossRef]
  2. Olatunji, T.L.; Afolayan, A.J. The suitability of chili pepper (Capsicum annuum L.) for alleviating human micronutrient dietary deficiencies: A review. Food Sci. Nutr. 2018, 6, 2239–2251. [Google Scholar] [CrossRef] [Green Version]
  3. Clark, R.; Lee, S.-H. Anticancer properties of capsaicin against human cancer. Anticancer Res. 2016, 36, 837–843. [Google Scholar]
  4. Batiha, G.E.-S.; Alqahtani, A.; Ojo, O.A.; Shaheen, H.M.; Wasef, L.; Elzeiny, M.; Ismail, M.; Shalaby, M.; Murata, T.; Zaragoza-Bastida, A. Biological properties, bioactive constituents, and pharmacokinetics of some Capsicum spp. and capsaicinoids. Int. J. Mol. Sci. 2020, 21, 5179. [Google Scholar] [CrossRef]
  5. Materska, M.; Perucka, I. Antioxidant activity of the main phenolic compounds isolated from hot pepper fruit (Capsicum annuum L.). J. Agric. Food Chem. 2005, 53, 1750–1756. [Google Scholar] [CrossRef]
  6. Sadef, Y.; Javed, T.; Javed, R.; Mahmood, A.; Alwahibi, M.S.; Elshikh, M.S.; AbdelGawwa, M.R.; Alhaji, J.H.; Rasheed, R.A. Nutritional status, antioxidant activity and total phenolic content of different fruits and vegetables’ peels. PLoS ONE 2022, 17, e0265566. [Google Scholar] [CrossRef]
  7. Lutz, M.; Hernández, J.; Henríquez, C. Phenolic content and antioxidant capacity in fresh and dry fruits and vegetables grown in Chile. CyTA-J. Food 2015, 13, 541–547. [Google Scholar]
  8. Taofiq, O.; González-Paramás, A.M.; Barreiro, M.F.; Ferreira, I.C.F.R. Hydroxycinnamic acids and their derivatives: Cosmeceutical significance, challenges and future perspectives, a review. Molecules 2017, 22, 281. [Google Scholar] [CrossRef]
  9. Kantar, M.B.; Anderson, J.E.; Lucht, S.A.; Mercer, K.; Bernau, V.; Case, K.A.; Le, N.C.; Frederiksen, M.K.; DeKeyser, H.C.; Wong, Z.-Z. Vitamin variation in Capsicum spp. provides opportunities to improve nutritional value of human diets. PLoS ONE 2016, 11, e0161464. [Google Scholar] [CrossRef]
  10. Luo, J. Metabolite-based genome-wide association studies in plants. Curr. Opin. Plant Biol. 2015, 24, 31–38. [Google Scholar] [CrossRef]
  11. Fiehn, O.; Kloska, S.; Altmann, T. Integrated studies on plant biology using multiparallel techniques. Curr. Opin. Biotechnol. 2001, 12, 82–86. [Google Scholar] [CrossRef]
  12. Taiti, C.; Costa, C.; Migliori, C.A.; Comparini, D.; Figorilli, S.; Mancuso, S. Correlation between volatile compounds and spiciness in domesticated and wild fresh chili peppers. Food Bioprocess Technol. 2019, 12, 1366–1380. [Google Scholar] [CrossRef]
  13. Barrajon-Catalan, E.; Álvarez-Martínez, F.J.; Borras, F.; Perez, D.; Herrero, N.; Ruiz, J.J.; Micol, V. Metabolomic analysis of the effects of a commercial complex biostimulant on pepper crops. Food Chem. 2020, 310, 125818. [Google Scholar] [CrossRef]
  14. Osorio, S.; Alba, R.; Nikoloski, Z.; Kochevenko, A.; Fernie, A.R.; Giovannoni, J.J. Integrative comparative analyses of transcript and metabolite profiles from pepper and tomato ripening and development stages uncovers species-specific patterns of network regulatory behavior. Plant Physiol. 2012, 159, 1713–1729. [Google Scholar] [CrossRef] [Green Version]
  15. Tang, Y.; Zhang, G.; Yang, T.; Yang, S.; Aisimutuola, P.; Wang, B.; Li, N.; Wang, J.; Yu, Q. Biochemical variances through metabolomic profile analysis of Jacq. during fruit development. Folia Hortic. 2021, 33, 17–26. [Google Scholar] [CrossRef]
  16. Feng, X.; Yu, Q.; Li, B.; Kan, J. Comparative analysis of carotenoids and metabolite characteristics in discolored red pepper and normal red pepper based on non-targeted metabolomics. LWT 2022, 153, 112398. [Google Scholar] [CrossRef]
  17. Cervantes-Hernández, F.; Ochoa-Alejo, N.; Martínez, O.; Ordaz-Ortiz, J.J. Metabolomic Analysis Identifies Differences Between Wild and Domesticated Chili Pepper Fruits During Development (Capsicum annuum L.). Front. Plant Sci. 2022, 13, 893055. [Google Scholar] [CrossRef]
  18. Zhou, Y.; Shao, L.; Zhu, J.; Li, H.; Duan, H. Comparative analysis of tuberous root metabolites between cultivated and wild varieties of Rehmannia glutinosa by widely targeted metabolomics. Sci. Rep. 2021, 11, 11460. [Google Scholar] [CrossRef]
  19. Adamski, J.; Suhre, K. Metabolomics platforms for genome wide association studies—Linking the genome to the metabolome. Curr. Opin. Biotechnol. 2013, 24, 39–47. [Google Scholar] [CrossRef]
  20. Sawada, Y.; Akiyama, K.; Sakata, A.; Kuwahara, A.; Otsuki, H.; Sakurai, T.; Saito, K.; Hirai, M.Y. Widely targeted metabolomics based on large-scale MS/MS data for elucidating metabolite accumulation patterns in plants. Plant Cell Physiol. 2009, 50, 37–47. [Google Scholar] [CrossRef]
  21. Chen, W.; Gong, L.; Guo, Z.; Wang, W.; Zhang, H.; Liu, X.; Yu, S.; Xiong, L.; Luo, J. A novel integrated method for large-scale detection, identification, and quantification of widely targeted metabolites: Application in the study of rice metabolomics. Mol. Plant 2013, 6, 1769–1780. [Google Scholar] [CrossRef] [Green Version]
  22. Bosland, P.W.; Coon, D. ‘NuMex Lemon Spice’,‘NuMex Pumpkin Spice’, and ‘NuMex Orange Spice’Jalapenos. HortScience 2015, 50, 1104–1105. [Google Scholar] [CrossRef] [Green Version]
  23. Guzman, I.; Coon, D.; Vargas, K.; Bosland, P.W. NuMex LotaLutein, a Lutein-rich Serrano Pepper. HortScience 2020, 55, 2052–2055. [Google Scholar] [CrossRef]
  24. Fraga, C.G.; Clowers, B.H.; Moore, R.J.; Zink, E.M. Signature-discovery approach for sample matching of a nerve-agent precursor using liquid chromatography− mass spectrometry, XCMS, and chemometrics. Anal. Chem. 2010, 82, 4165–4173. [Google Scholar] [CrossRef]
  25. Bujak, R.; Daghir-Wojtkowiak, E.; Kaliszan, R.; Markuszewski, M.J. PLS-based and regularization-based methods for the selection of relevant variables in non-targeted metabolomics data. Front. Mol. Biosci. 2016, 3, 35. [Google Scholar] [CrossRef] [Green Version]
  26. Kanehisa, M.; Goto, S. KEGG: Kyoto encyclopedia of genes and genomes. Nucleic Acids Res. 2000, 28, 27–30. [Google Scholar] [CrossRef]
  27. Singh, D.P.; Bisen, M.S.; Shukla, R.; Prabha, R.; Maurya, S.; Reddy, Y.S.; Singh, P.M.; Rai, N.; Chaubey, T.; Chaturvedi, K.K. Metabolomics-Driven Mining of Metabolite Resources: Applications and Prospects for Improving Vegetable Crops. Int. J. Mol. Sci. 2022, 23, 12062. [Google Scholar] [CrossRef]
  28. Fiehn, O.; Kopka, J.; Dörmann, P.; Altmann, T.; Trethewey, R.N.; Willmitzer, L. Metabolite profiling for plant functional genomics. Nat. Biotechnol. 2000, 18, 1157–1161. [Google Scholar] [CrossRef]
  29. Ward, J.L.; Harris, C.; Lewis, J.; Beale, M.H. Assessment of 1H NMR spectroscopy and multivariate analysis as a technique for metabolite fingerprinting of Arabidopsis thaliana. Phytochemistry 2003, 62, 949–957. [Google Scholar] [CrossRef]
  30. Tohge, T.; Nishiyama, Y.; Hirai, M.Y.; Yano, M.; Nakajima, J.; Awazuhara, M.; Inoue, E.; Takahashi, H.; Goodenowe, D.B.; Kitayama, M. Functional genomics by integrated analysis of metabolome and transcriptome of Arabidopsis plants over-expressing an MYB transcription factor. Plant J. 2005, 42, 218–235. [Google Scholar] [CrossRef]
  31. Litvinov, D.Y.; Karlov, G.I.; Divashuk, M.G. Metabolomics for Crop Breeding: General Considerations. Genes 2021, 12, 1602. [Google Scholar] [CrossRef]
  32. Kim, E.-H.; Lee, K.M.; Lee, S.-Y.; Kil, M.; Kwon, O.-H.; Lee, S.-G.; Lee, S.-K.; Ryu, T.-H.; Oh, S.-W.; Park, S.-Y. Influence of genetic and environmental factors on the contents of carotenoids and phenolic acids in red pepper fruits (Capsicum annuum L.). Appl. Biol. Chem. 2021, 64, 1–11. [Google Scholar] [CrossRef]
  33. Lozada, D.N.; Bhatta, M.; Coon, D.; Bosland, P.W. Single Nucleotide Polymorphisms Reveal Genetic Diversity in New Mexican Chile Peppers (Capsicum spp.). BMC Genom. 2021, 22, 356. [Google Scholar] [CrossRef]
  34. Mi, S.; Yu, W.; Li, J.; Liu, M.; Sang, Y.; Wang, X. Characterization and discrimination of chilli peppers based on multi-element and non-targeted metabolomics analysis. LWT 2020, 131, 109742. [Google Scholar] [CrossRef]
  35. Espichán, F.; Rojas, R.; Quispe, F.; Cabanac, G.; Marti, G. Metabolomic characterization of 5 native Peruvian chili peppers (Capsicum spp.) as a tool for species discrimination. Food Chem. 2022, 386, 132704. [Google Scholar] [CrossRef]
  36. Florentino-Ramos, E.; Villa-Ruano, N.; Hidalgo-Martínez, D.; Ramírez-Meraz, M.; Méndez-Aguilar, R.; Velásquez-Valle, R.; Zepeda-Vallejo, L.G.; Pérez-Hernández, N.; Becerra-Martínez, E. 1H NMR-based fingerprinting of eleven Mexican Capsicum annuum cultivars. Food Res. Int. 2019, 121, 12–19. [Google Scholar] [CrossRef]
  37. Villa-Ruano, N.; Ramírez-Meraz, M.; Méndez-Aguilar, R.; Zepeda-Vallejo, L.G.; Álvarez-Bravo, A.; Pérez-Hernández, N.; Becerra-Martínez, E. 1H NMR-based metabolomics profiling of ten new races from Capsicum annuum cv. serrano produced in Mexico. Food Res. Int. 2019, 119, 785–792. [Google Scholar] [CrossRef]
  38. Lozada, D.N.; Coon, D.L.; Guzmán, I.; Bosland, P.W. Heat profiles of ‘superhot’and New Mexican type chile peppers (Capsicum spp.). Sci. Hortic. 2021, 283, 110088. [Google Scholar] [CrossRef]
  39. Carvalho Lemos, V.; Reimer, J.J.; Wormit, A. Color for life: Biosynthesis and distribution of phenolic compounds in pepper (Capsicum annuum). Agriculture 2019, 9, 81. [Google Scholar] [CrossRef] [Green Version]
  40. Kumar, O.A.; Rao, S.A.; Tata, S.S. Phenolics quantification in some genotypes of Capsicum annuum L. J. Phytol. 2010, 2, 87–90. [Google Scholar]
  41. Guzman, I.; Vargas, K.; Chacon, F.; McKenzie, C.; Bosland, P.W. Health-promoting carotenoids and phenolics in 31 Capsicum accessions. HortScience 2021, 56, 36–41. [Google Scholar] [CrossRef]
  42. De Sa Mendes, N.; Santos, M.C.P.; Santos, M.C.B.; Cameron, L.C.; Ferreira, M.S.L.; Goncalves, E.C.B.A. Characterization of pepper (Capsicum baccatum)—A potential functional ingredient. LWT 2019, 112, 108209. [Google Scholar] [CrossRef]
  43. Lee, Y.; Howard, L.R.; Villalon, B. Flavonoids and antioxidant activity of fresh pepper (Capsicum annuum) cultivars. J. Food Sci. 1995, 60, 473–476. [Google Scholar] [CrossRef]
  44. Chen, L.; Kang, Y.-H. Anti-inflammatory and antioxidant activities of red pepper (Capsicum annuum L.) stalk extracts: Comparison of pericarp and placenta extracts. J. Funct. Foods 2013, 5, 1724–1731. [Google Scholar] [CrossRef]
  45. Mokhtar, M.; Soukup, J.; Donato, P.; Cacciola, F.; Dugo, P.; Riazi, A.; Jandera, P.; Mondello, L. Determination of the polyphenolic content of a Capsicum annuum L. extract by liquid chromatography coupled to photodiode array and mass spectrometry detection and evaluation of its biological activity. J. Sep. Sci. 2015, 38, 171–178. [Google Scholar] [CrossRef]
  46. Jeong, W.Y.; Jin, J.S.; Cho, Y.A.; Lee, J.H.; Park, S.; Jeong, S.W.; Kim, Y.; Lim, C.; El-Aty, A.M.A.; Kim, G. Determination of polyphenols in three Capsicum annuum L. (bell pepper) varieties using high-performance liquid chromatography-tandem mass spectrometry: Their contribution to overall antioxidant and anticancer activity. J. Sep. Sci. 2011, 34, 2967–2974. [Google Scholar] [CrossRef]
  47. Rodrıguez-Concepción, M.; Boronat, A. Elucidation of the methylerythritol phosphate pathway for isoprenoid biosynthesis in bacteria and plastids. A metabolic milestone achieved through genomics. Plant Physiol. 2002, 130, 1079–1089. [Google Scholar] [CrossRef] [Green Version]
  48. Lehmann, M.; Vamvaka, E.; Torrado, A.; Jahns, P.; Dann, M.; Rosenhammer, L.; Aziba, A.; Leister, D.; Rühle, T. Introduction of the carotenoid biosynthesis α-branch into Synechocystis sp. PCC 6803 for lutein production. Front. Plant Sci. 2021, 12, 699424. [Google Scholar] [CrossRef]
  49. Zafar, J.; Aqeel, A.; Shah, F.I.; Ehsan, N.; Gohar, U.F.; Moga, M.A.; Festila, D.; Ciurea, C.; Irimie, M.; Chicea, R. Biochemical and Immunological implications of Lutein and Zeaxanthin. Int. J. Mol. Sci. 2021, 22, 10910. [Google Scholar] [CrossRef]
  50. Sakurai, N. Recent applications of metabolomics in plant breeding. Breed. Sci. 2022, 72, 56–65. [Google Scholar] [CrossRef]
  51. Lozada, D.N.; Bosland, P.; Barchenger, D.W.; Haghshenas-Jaryani, M.; Sanogo, S.; Walker, S. Chile Pepper (Capsicum) Breeding and Improvement in the “Multi-Omics” Era. Front. Plant Sci. 2022, 13, 879182. [Google Scholar] [CrossRef] [PubMed]
Figure 1. ‘Numex Pumpkin Spice’ (a) and ‘NuMex LotaLutein’ (b) fruits showing their characteristic orange and yellow colors, respectively. ‘NuMex Pumpkin Spice’ is a colored jalapeño, whereas ‘NuMex LotaLutein’ is a biofortified serrano type with improved lutein content. Adapted with permission from Refs. [22,23]. ©2015, 2020, American Society for Horticultural Science.
Metabolites 13 00288 g001
Figure 2. Proportion of different classes of compounds for the metabolites detected from jalapeño and serrano chile peppers using a widely targeted metabolomics approach.
Metabolites 13 00288 g002
Figure 3. (a) Principal component (PC) biplot for the PC1 and PC2 reveal the overall variation between the cultivars in terms of metabolomic profiles. (b) Orthogonal partial least squares discriminant plot for the chile pepper cultivars. Treatment 1: ‘NuMex LotaLutein’; treatment 2: ‘NuMex Pumpkin Spice’. Numbers 1, 2, and 3 correspond to the first, second, and third biological replications, respectively.
Metabolites 13 00288 g003
Figure 4. Pearson correlation coefficients among the biological replicates for the cultivars. Numbers 1, 2, and 3 correspond to the first, second, and third biological replications, respectively. Correlation coefficients were significant at p < 0.0001.
Metabolites 13 00288 g004
Figure 5. Summary of the different functions annotated for the differentially expressed metabolites (DEMs) using the KEGG database. Annotations revealed that the majority of the DEMs are involved in metabolic pathways and in the biosynthesis of secondary metabolites and cofactors. Note: A DEM can have multiple annotated functions.
Metabolites 13 00288 g005
Figure 6. Rich factor (RF) values for the differentially expressed metabolites with annotated functions on the KEGG database. RF is the ratio of the number of differentially expressed metabolites in a pathway to the total number of metabolites annotated in the same pathway (RF for a pathway = no. of differentially expressed metabolites/total number of metabolites). Terpenoid backbone biosynthesis had significant enrichments, with an RF value of 1.
Metabolites 13 00288 g006
Table 1. Top 10 most highly upregulated and downregulated metabolites.
MetaboliteClassVIP 1Fold Change (FC)log2FC 2
1-PhenylethanolPhenolic acids1.44269,754.8018.04
Dicaffeoylshikimic acidPhenolic acids1.4486,594.4216.40
2-Methoxycinnamic acidPhenolic acids1.4410,264.5313.33
1,3-O-Dicaffeoylquinic Acid (Cynarin)Phenolic acids1.42266.718.06
4-O-(4′-O-alpha-D-Glucopyranosyl)caffeoylquinic acidPhenolic acids1.43182.937.52
Chlorogenic acid methyl esterPhenolic acids1.44103.946.70
Cyanidin-3-O-(6′′-O-caffeoyl-2′′-O-xylosyl)glucosideFlavonoids1.4382.456.37
Tri-O-galloyl Methyl gallatePhenolic acids1.4182.206.36
Luteolin-7-O-Sophoroside-5-O-arabinosideFlavonoids1.4374.076.21
5-O-Feruloyl quinic acid glucosidePhenolic acids1.3773.706.20
3,6-Di-O-caffeoyl glucosePhenolic acids1.449.18 × 10−6−16.73
Rosmarinic acid methyl esterPhenolic acids1.442.37 × 10−5−15.36
2,3-DimethoxybenzaldehydePhenolic acids1.443.2 × 10−5−14.93
Quercetin-3-O-(2′′-O-rhamnosyl)rutinoside-7-O-glucosideFlavonoids1.442.5 × 10−4−11.96
Quercetin-3-O-(6′′-O-acetyl)glucosyl-(1→3)-GalactosideFlavonoids1.410.016−6.01
p-CoumaroylagmatineAlkaloids1.430.020−5.64
Quercetin-7-O-(6′′-malonyl)glucosyl-5-O-glucosideFlavonoids1.420.023−5.43
Quercetin-3-O-rutinoside-7-O-rhamnosideFlavonoids1.400.0251−5.31
Quercetin-3-O-xylosyl(1→2)glucosyl(1→2)glucosideFlavonoids1.400.0253−5.30
Quercetin-3-O-(6′′-O-malonyl)glucosyl-5-O-glucosideFlavonoids1.380.031−5.00
1 VIP—Variable importance in projection value. 2 Positive and negative values for log2FC indicate upregulation and downregulation, respectively. Screening results were based on a comparison where ‘NuMex LotaLutein’ was used as the control. Upregulation signifies that the relative content of the metabolite is higher in ‘NuMex Pumpkin Spice’ than in ‘NuMex LotaLutein’ and vice versa.
Table 2. Top 10 differentially expressed upregulated metabolites with KEGG database annotation.
MetaboliteClassVariable Importance in Projection (VIP) Value Fold
Change (FC)
log2FCKEGG Orthology
(KO) Index
Annotation
Chlorogenic acid
(3-O-Caffeoylquinic acid)
Phenolic acids1.4320.464.35KO00940; KO00941; KO00945; KO01110Phenylpropanoid biosynthesis; flavonoid biosynthesis; stilbenoid, diarylheptanoid and gingerol biosynthesis; metabolic pathways
3,7-Di-O-methylquercetinFlavonoids1.3411.213.49KO00944; KO01110Flavone and flavonol biosynthesis; metabolic pathways
PhenolPhenolic acids1.4211.013.46KO00350; KO01100Tyrosine metabolism; metabolic pathways
ATP; Adenosine
5′-Triphosphate
Nucleotides and derivatives1.428.393.07KO00190; KO00195; KO00230; KO00908
KO01100; KO01110; KO01232; KO01240
Oxidative phosphorylation; photosynthesis; purine metabolism; zeatin biosynthesis; metabolic pathways; nucleotide metabolism; biosynthesis of cofactors
2-Furoic acidOrganic acids1.385.772.53KO01100Metabolic pathways
Kaempferol-3-O-rutinoside(Nicotiflorin)Flavonoids1.185.612.49KO00944; KO01110Flavone and flavonol biosynthesis; metabolic pathways
2-Oxoheptanedionic acidOrganic acids1.375.552.47KO01100; KO01210; KO01240Metabolic pathways; 2-oxocarboxylic acid metabolism; biosynthesis of cofactors
Kaempferol-3-O-rhamnoside (Afzelin)(Kaempferin)Flavonoids1.314.922.30KO00944Flavone and flavonol biosynthesis
Luteolin-7-O-glucuronideFlavonoids1.264.762.25KO00944Flavone and flavonol biosynthesis
3-O-MethylquercetinFlavonoids1.404.562.19KO00944; KO01110Flavone and flavonol biosynthesis; metabolic pathways
Disclaimer/Publisher’s Note: The statements, opinions and data contained in all publications are solely those of the individual author(s) and contributor(s) and not of MDPI and/or the editor(s). MDPI and/or the editor(s) disclaim responsibility for any injury to people or property resulting from any ideas, methods, instructions or products referred to in the content.

