Article

Effects of Cadmium on Liver Function and Its Metabolomics Profile in the Guizhou Black Goat

1
College of Life Science and Engineering, Southwest University of Science and Technology, Mianyang 621010, China
2
State Key Laboratory of Sheep Genetic Improvement and Healthy Production, Xinjiang Academy of Agricultural and Reclamation Sciences, Shihezi 832000, China
*
Author to whom correspondence should be addressed.
Metabolites 2023, 13(2), 268; https://doi.org/10.3390/metabo13020268
Submission received: 25 January 2023 / Revised: 6 February 2023 / Accepted: 9 February 2023 / Published: 13 February 2023

Abstract

:
Cadmium (Cd) is a toxic heavy metal, which will lead to ecosystem contamination, threatening the life of grazing animals. Goats are an important grazing animal biomarker to evaluate Cd toxicity, but the effect of short-term and high-concentration Cd toxicity on goat liver function and its latent mechanism is still unclear. A total of ten male Guizhou black goats were randomly divided into two groups: CON group, sterilized tap water (no CdCl2), and Cd group (20 mg Cd·kg−1·BW, CdCl2⋅2.5H2O). The test lasted for 30 days. In this study, we found that Cd poisoning in drinking water affected significantly the distribution of Cd in the goat offal and tissues, and damaged the goat’s immune function of the liver. With a metabolomics approach, 59 metabolites were identified. Metabolomics analysis suggested that Cd affected lipid and amino acid metabolism of the goat liver. Collectively, our results confirmed the effect of Cd on liver function and liver metabolism, and provided insights on the molecular basis for early warnings of Cd poisoning in goats.

Graphical Abstract

1. Introduction

Cadmium (Cd) is a heavy metal element with long biological half-life, slow metabolism, and strong toxicity, which easily accumulates in the body. Cd can cause damages to a variety of tissues and organs [1], thereby seriously threatening human health. With the extensive use of Cd in industrial production, environmental Cd pollution is becoming more and more serious. Cd and other heavy metals migrate and circulate in the ecosystem in various ways, and are accumulated in animals through different intake pathways, which will eventually lead to animal death or affect food safety. Long-term Cd exposure may directly cause diseases of the immune, respiratory, digestive, nervous, and reproductive systems [2]. Poisoning caused by long-term chronic accumulation of Cd has attracted more and more social attention, but the pathogenesis of short-term toxicity of high-dose Cd is not completely clear.
Omics techniques, a high-throughput method, has been popularly applied in the process of disease diagnosis [3]. Metabolomics has been proved to be conducive to toxicological mechanism study, disease diagnosis, and treatment assessment [4]. Metabolomics also offers an opportunity to discover biomarkers for premalignant liver disease, thereby alerting the potential risk of impending hepatocellular carcinoma [5]. Metabolomics analyzes the changes of the total metabolites of biological samples affected by the environment. This helps to understand how animals and plants respond to various hostile factors at the molecular level [6]. At present, it is widely used in the study of environmental pollutants, such as investigating the mechanism of Cd poisoning in rat urine [7] and kidneys [6], which provides the possibility for directly evaluating the health effects of low-dose environmental poisons [8].
The purpose of this experiment was to explore whether oral Cd affected liver function, thereby indirectly interfering with liver metabolism. Screening of metabolic markers may provide a new method for the early diagnosis of Cd poisoning.

2. Animals, Materials and Methods

2.1. Reagents and Chemicals

Cadmium chloride (CdCl2) was purchased from Tianjinzhiyuan Chemical Reagen Co., Ltd. Formic acid (FC, MS grade) and acetonitrile (CAN, MS grade) were purchased from TCI (Shanghai, China) and Merck (Rahway, NJ, USA), respectively.

2.2. Animal Handing and Sample Collection

A total of ten male Guizhou black goats, 10.72 ± 0.35 kg, were purchased from the goat breeding farm in Guizhou Academy of Agricultural Sciences, Guiyang, China. The goats were maintained in a sheepfold with wooden leak floor, and were provided with a standard diet [9] (CP 14.75%, ME 9.80 MJ/kg, NDF 20.40%) and sterilized tap water (Zn 0.52 mg/L, Cu 0.52 mg/L, Fe 0.11 mg/L, pH 6.70) freely. All the animals in the Cd group were provided with drinking water containing Cd (20 mg Cd·kg−1·BW, CdCl2⋅2.5H2O) according to the recommended dose of previous studies [10] and investigation results of our team [11], and the experimental diets were simultaneously provided.
CdCl2 was prepared in 5.7% aqueous solution, and each goat drank 1000 mL per day (containing 5 mL CdCl2 aqueous solution). Goats in the control group were treated with identical quantity of disinfected tap water, so as to clear up the impacts of CdCl2. After 1-week adaptation, all the goats were fed tap water or water added with CdCl2 for 30 days, then were fixed. On day 1 and day 30, the blood samples were collected into vacuum tubes with heparin sodium and were centrifuged at 3000× g for 10 min (4 °C), then were cryopreserved at −80 °C for mineral elements and omics analysis. After the tested animals were slaughtered using an electric shock gun (ASS-1, Jarvis Machinery Manufacturing Co., Ltd., Beijing, China), the organs and tissues of (heart, liver, spleen, etc.) were cryopreserved at −80 °C for further analysis. The liver tissues were fixed with 4% paraformaldehyde and then were embedded in paraffin to make a 5 μm–thick section for hematoxylin-eosin (HE) staining. An optical microscope was used to observe histopathological changes. Preparation and determination of liver pathological sections (HE staining) was tested by Wuhan Servicebio Biological Co., Ltd., Wuhan, China.
The levels of minerals (Zn, Cu, iron (Fe), and Cd), were measured using a graphite furnace atomic absorption spectrophotometer (AA–7000, Shimadzu Corporation, Kyoto, Japan). Commercial test kits, purchased from Nanjing Jiancheng Bio-Engineering Institute, China, were used to analyze the concentrations of immunoglobulin G (IgG), immunoglobulin M (IgM), immunoglobulin A (IgA), interleukin 6 (IL-6), interleukin-1β (IL-1β), and tumor necrosis factor-alpha (TNF-α) [9].

2.3. Metabolomics Analysis in the Liver

2.3.1. Liver Preparation for Metabolomics

Liver samples were processed in the same manner as described by Li et al. [12]. A total of 2μL supernatant was leached through a 0.22 μm nylon filter and was injected for HILIC UHPLC-Q-EXACTIVE/MS analysis. The stability of the LC-MS/MS system was tested with five quality control samples in the analysis sequence, prepared from the pooled liver samples.

2.3.2. Metabolomics Data Capture

An ultraperformance liquid chromatography system was used to carry out chromatographic separation of the liver (Ultimate 3000, Thermo Fisher, Waltham, MA, USA). The liver was injected on an ACQUITY UPLC BEH C18 column (2.1 × 100 mm, 1.7 μm) at 40 °C (0.30 mL/min flow rate). The optimal linear gradient program referred to the description of Shen et al. [13], and the optimal mobile phase included 0.1% formic acid in water (A) and acetonitrile (B).
HILIC UHPLC-Q-Exactive/MS (Thermo Fisher, Greenville, NC, USA), fitted with a dual electrospray ionization source (ESI) operating in positive and negative ion modes, was used to carry out mass data acquisition. The scan time was set at 5 spectra/s and the centroid mode was from 50 to 1000 m/z. The optimal conditions of analysis referred to the description of Shen et al. [13].

2.3.3. Multivariate Statistical Analysis

A Compound Discoverer 3.0 (Thermo Fisher, USA) was used to convert the raw MS spectra to common data format (.mzML). Candidate metabolites (VIP > 1 and adjusted p value < 0.05) were regarded as potential biomarkers. The supporting files provided further details regarding metabolomic analysis.

2.3.4. Metabolites Identification and Pathway Analysis

The metabolite structure was confirmed through LS-MS/MS analysis. The basis of the METLIN were used to search the accurate mass values of the metabolites and MS/MS fragment ions. The KEGG and HMDB database were used to search metabolic pathways and biochemical reactions. Pathway analysis and visualization were performed on Compound Discoverer 3.0 (Thermo Fisher Scientific) software.

2.4. Statistical Analysis

Data were analyzed using independent sample t-test of one-way ANOVA program of SPSS software (version 23.0, Inc., Chicago, IL, USA), and were expressed as the mean. The fixed factor was the concentration of Cd, and the dependent factors were the contents of minerals in organs and tissues, and the levels of immune factors in serums and livers. A p value < 0.05 was considered statistically different.

3. Results

3.1. The Effect of Cd on the Pathological Structure in the Liver of the Guizhou Black Goat

The liver pathological structure under a light microscope showed that the hepatocytes of the black goat in the control group were closely arranged together with clear cells and outlines and clearly visible liver lobules. Hepatocyte cords were radially arranged around the central vein, and the trend was relatively clear (Figure 1a). Sheet necrosis could be seen in the hepatocytes of the black goat in the Cd group, with light and no staining in the nuclei, unclear boundaries of liver lobules, and disordered arrangement of hepatocyte cords (Figure 1b).

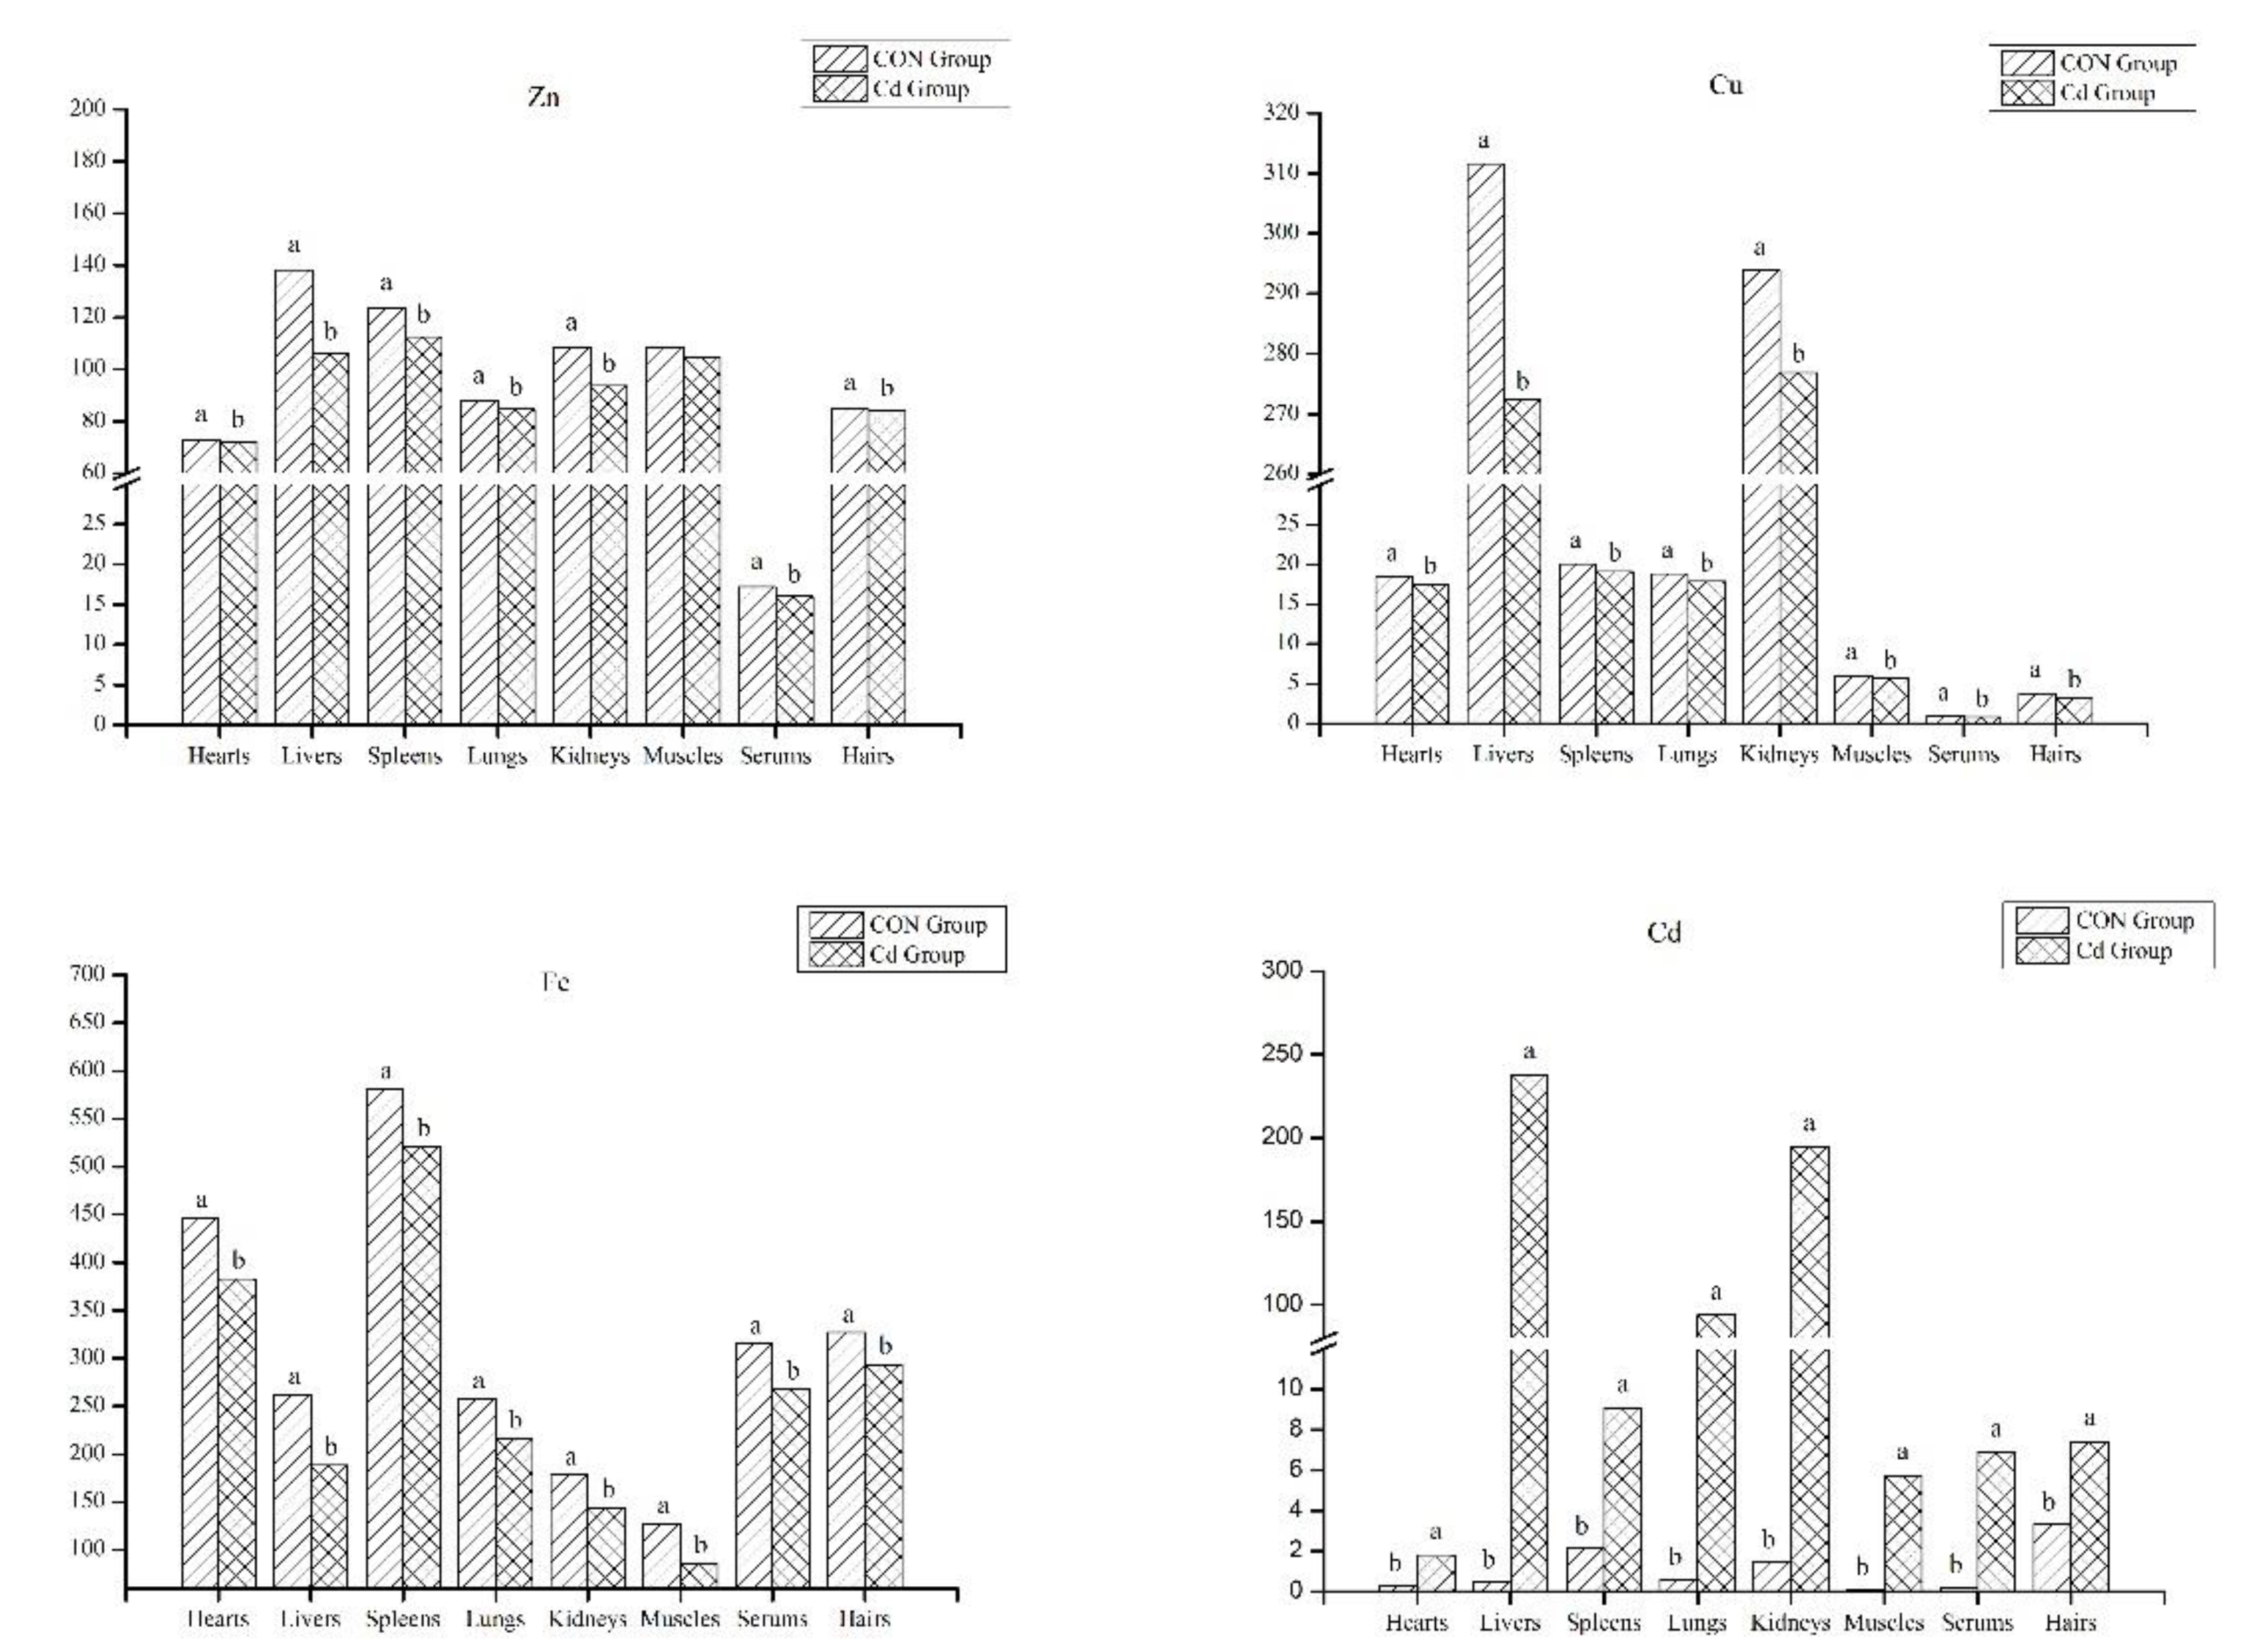
3.2. The Analysis of Mineral Contents in the Organ and Tissue

Metal contaminants can effectively be bioaccumulated by animals from the environment. The supplementation of Cd in drinking water significantly increased the Cd content in the organs (heart, liver, spleen, lung, kidney, muscle), serum, and hair of the Guizhou black goat (heart 1.82 vs. 0.31 ug/g, liver 237.94 vs. 0.46 ug/g, spleen 9.06 vs. 2.12 ug/g, lung 93.77 vs. 0.60 ug/g, kidney 194.65 vs. 1.44 ug/g, muscle 5.74 vs. 0.11 ug/g, serum 6.88 vs. 0.22 ug/mL, hair 7.41 vs. 3.32 ug/g, respectively) (p < 0.05, Figure 2), and greatly decreased the Cu and Fe levels compared with the control group (p < 0.05, Figure 2). The Cu levels in the heart, liver, spleen, lung, kidney, muscle, serum, and hair between the Cd group and the control group were 17.54 vs. 18.50 ug/g, 272.36 vs. 311.60 ug/g, 19.12 vs. 20.08 ug/g, 17.86 vs. 18.82 ug/g, 276.93 vs. 293.86 ug/g, 5.70 vs. 6.01 ug/g, 0.86 vs. 0.97 ug/mL, 3.20 vs. 3.80 ug/g, respectively (Figure 2). The Fe level in the heart, liver, spleen, lung, kidney, muscle, serum, and hair between the Cd group and the control group was 382.79 vs. 447.13 ug/g, 188.36 vs. 262.21 ug/g, 520.93 vs. 580.82 ug/g, 216.22 vs. 257.90 ug/g, 143.97 vs. 178.24 ug/g, 85.80 vs. 127.57 ug/g, 267.30 vs. 315.17 ug/mL, 293.67 vs. 327.12 ug/g, respectively (Figure 2). Compared with the control group, the Zn content in the heart, liver, spleen, lung, kidney, serum, and hair of the Guizhou black goat was significantly increased (72.20 vs. 73.08 ug/g, 105.97 vs. 138.32 ug/g, 112.56 vs. 123.62 ug/g, 84.70 vs. 87.86 ug/g, 93.63 vs. 108.39 ug/g, 104.81 vs. 108.64 ug/g, 15.99 vs. 17.19 ug/mL, 84.16 vs. 85.23 ug/g, respectively) (p < 0.05, Figure 2). Goats from the Cd group exhibited significant Cd accumulation in the offal.

3.3. The Effect of Cd on the Immune Function of the Goat Serum and Liver

Compared with the control group, the levels of serum IgG and IgA in the Cd group were significantly decreased (2.05 vs. 1.70 g/L, 34.56 vs. 33.56 g/L, respectively), and the levels of serum IL-6, IL-1β, and TNF-α were significantly increased (78.82 vs. 91.05 ng/L, 6.27 vs. 7.41 ng/L, 0.72 vs. 0.83 ng/L, respectively) (p < 0.05, Figure 3). Compared with the control group, the levels of liver IgG and IgA in the Cd group were significantly decreased (44.90 vs. 33.10 g/kg, 10.80 vs. 7.23 g/kg, respectively), and the levels of liver IL-6, IL-1β, and TNF-α were significantly increased (0.69 vs. 0.84 ng/kg, 6.59 vs. 7.42 ng/kg, 5.66 vs. 7.09 ng/kg, respectively) (p < 0.05, Figure 3).

3.4. Liver Metabolic Responses in the Goat to Cd Exposure

The typical total ion chromatograms of liver samples through the HILIC UHPLC−Q−EXACTIVE/MS analysis displayed good separation, peak shape, and strong intensity. Clear separations were displayed between the control and Cd groups in the well-fitting OPLS−DA models (Figure 4a,b). According to the VIP value (>1) and p-value (<0.05), 59 differential metabolites, including 31 up−regulated metabolites and 28 down−regulated metabolites, were identified (Table 1). Liver samples in the Cd group were separately clustered from the control group in the dendrogram of hierarchical clustering (Figure 4c,d). These results confirmed that the levels of most metabolites were affected by Cd.
The liver differentially-expressed metabolites that were obtained in the treatment group were submitted to KEGG website for relevant pathway analysis. The most significant metabolic pathway was insulin resistance (Figure 5). Cd poisoning extremely altered metabolic pathways. The predominant metabolites were involved in insulin resistance, alanine, aspartate, and glutamate metabolism, arginine and proline metabolism, citrate cycle (TCA cycle), AMPK signaling pathway, etc. The details of related metabolic pathways are shown in Table 1. KEGG pathway analysis for the corresponding metabolic pathways found similar results that lipid metabolism was the main metabolic pathway (Table 2).

4. Discussion

4.1. Mineral Accumulation in the Goat Offal and Tissue and Liver Immune Function

In Cd-treated goat samples, severe Cd accumulation was observed in the Guizhou black goat. In the case of chronic Cd poisoning, about 8 % of Cd that is ingested will be absorbed by the body through the gastrointestinal tract [14]. In a previous study, Zalups [15] reported that rats were intravenously injected with 5 mol/kg Cd (source of CdCl2), and 50–60% of the administered dose of Cd was significantly accumulated in the liver. Cd is metabolized very slowly in the body, and its half-life is as long as 20~30 years. The human body can only excrete 0.005~0.015 % of the total amount of Cd in the body every day. In the case of chronic Cd poisoning, daily fecal Cd emission accounts for about 0.03 % of the total Cd in human body [16]. Long-term Cd accumulation will lead to oxidative stress, apoptosis or necrosis of generous cells, and even tumors [17]. In this trial, after high dose Cd was orally fed to the goats for 30 days, significant Cd accumulation occurred in the offal and tissue.
Antibodies and immunoglobulins that were produced by B cells, including IgG, IgM, and IgA, are important indicators of humoral immunity [18]. The synergy of immunoglobulin in the body can prevent body infection and resist the invasion of various bacteria and toxins. IgG plays a major role in immunity. After infection, IgM combines with complement to dissolve pathogens [19]. In local mucosal immunity, IgA mainly plays the role of an antibacterial, antiviral, and a “barrier” [20]. TNF-α is the most important inflammatory cytokine in the body’s stress response, and its biological effect can be expanded by inducing the synergistic effect of other inflammatory mediators [21]. IL-1β is a pro-inflammatory medium that mediates the inflammatory response [22]. IL-6 is a pro-inflammatory transmitter, which may aggravate the inflammatory reaction in the body and even lead to the deterioration of some diseases [23,24]. This study found that Cd poisoning decreased significantly the levels of IgG and IgA in the serum and liver, and increased significantly the levels of IL-6, IL-1β, and TNF-α in the serum and liver, which caused damage to the immune system of black goats. The results of liver immune functions further confirmed that Cd exposure damaged the immune function of goats and caused toxic damage to the liver.

4.2. Alteration of Energy and Lipid Metabolism Associated with Cd Exposures

The liver is the center of material storage and transformation. In mammals, glucose is preferentially used as an energy source, and the effect of fatty acid oxidation on energy supply is often related to the fat level in feed [25]. Under Cd poisoning, the energy metabolism state of black goats can be reshaped to adapt to a higher metabolic rate.
The tricarboxylic acid cycle (TCA cycle) is the link and transformation hub of sugar, fats, proteins, and even nucleic acid metabolism. Produced during aerobic oxidation of sugar, α-Ketoglutaric acid, pyruvic acid, and oxaloacetic acid can be converted into corresponding amino acids by combining with ammonia. The deamination of these amino acids can be converted into corresponding keto acids and enter the aerobic oxidation pathway of sugar. At the same time, glycerol that is produced by lipid catabolism and acetyl CoA that is produced by fatty acid metabolism can also enter the aerobic oxidation pathway of sugar for metabolism [26]. With the decrease of energy intake and the increase of consumption in the Cd poisoning stage of black goats, it is particularly important to study the physiological mechanism of metabolic disorders that are related to negative energy balance. Negative energy balance will cause changes in multiple metabolic pathways to maintain the physiological conditions that are required for growth [27].
Amino acids play an important role in the energy production of the TCA cycle [28]. After deamination, they can be converted into fat through gluconeogenesis, indicating that Cd-induced lipid metabolism disorder in goats has changed the metabolites that are related to lipid metabolism (D-glucosamine 6-phosphate and pyruvate). The up-regulation of D-glucosamine 6-phosphate and down-regulation of pyruvate in the Cd group showed that amino acid metabolism was related to lipid metabolism. Since pyruvate played a key role in energy, amino acid, and lipid metabolism, down-regulated pyruvate indicated that there was also interference in lipid synthesis/degradation [29]. In the KEGG enrichment analysis of different metabolites of Cd poisoning in this chapter, many pathways related to lipid metabolism, such as the metabolism of arachidonic acid and linoleic acid, were also significantly enriched by NADPH, GPX, etc.

4.3. Alteration of Amino Acid Metabolism Associated with Cd Exposures

Previous studies have reported that amino acid metabolism of male rats exposed to Cd was disturbed [30]. Compared with the adolescent rats in the control group, the levels of these amino acids (glutamic acid, aspartic acid, etc.) in the anterior part of the hypothalamus in the Cd group were decreased, thus regulating various physiological functions including the endocrine system, and the content of glutamine in the basal part of the hypothalamus was increased [30]. However, Cd exposure can induce inflammation in animals by increasing the excessive accumulation of ROS [31,32] or the disorder of glucose metabolism in animals [33]. Valine, one of the eight essential amino acids for the human body, can promote normal growth of the body, repair tissues, regulate blood sugar, and provide necessary energy. Leucine and valine are branched-chain amino acids. Together with isoleucine and valine, they repair muscles, control blood sugar, decompose and convert into glucose faster, provide energy to body tissues quickly, promote energy metabolism (glucose uptake, mitochondrial biogenesis, and fatty acid oxidation), provide energy for protein synthesis, and inhibit protein degradation [34]. In our work, metabolomic analysis showed that the D-glucosamine 6-phosphate regulating the metabolism of alanine, aspartic acid, glutamic acid, cysteine, and methionine in Cd-treated goats increased significantly, while the pyruvate regulating the metabolism of alanine, aspartic acid, and glutamic acid decreased significantly. In this study, many differential metabolites were enriched in pathways that were related to amino acid metabolism, and the abundance of essential amino acids such as valine and L-leucine in the liver of Cd-poisoned black goats was significantly down-regulated or up-regulated. In addition, many amino acid metabolic pathways changed significantly, such as alanine, aspartic acid, and glutamic acid metabolism, arginine and proline metabolism, valine, leucine and isoleucine biosynthesis, histidine metabolism, glycine, serine and threonine metabolism, phenylalanine metabolism, cysteine and methionine metabolism, tyrosine metabolism, amino acid biosynthesis, etc. Therefore, Cd poisoning may affect the tricarboxylic acid cycle, gluconeogenesis/glycolysis, and amino acid metabolism of black goats.

5. Conclusions

This study focused on the effect of oral Cd on the liver function and liver metabolism in goats. Cd altered the contents of mineral elements in the goat’s organs and tissues, and reduced significantly liver immune functions. The metabolomic analysis showed that the differential metabolites were significantly enriched in the pathways related to lipid metabolism, such as linoleic acid metabolism and arachidonic acid metabolism. Embelin may be potential metabolic markers of Cd poisoning in the goat liver. In general, oral Cd interfered with liver metabolism by decreasing the liver immune function, causing liver damage.

Author Contributions

Y.L.: Conceptualization, methodology, software, formal analysis, investigation, resources, data curation, writing-original draft. X.S.: Conceptualization, methodology, resources, writing—reviewing and editing, supervision, project administration, funding acquisition. All authors have read and agreed to the published version of the manuscript.

Funding

This research was funded by the National Natural Science Foundation of China (42171060), the Innovation and Development Supporting Plan Project of Key Industries in Southern Xinjiang (2021DB014), and the modern agricultural industry technology system (CARS-38). The APC was funded by Xiaoyun Shen.

Institutional Review Board Statement

The animal study protocol was approved by the Institutional Animal Care and Use Committee of Southwest University of Science and Technology (SWUST2021009, 25 January 2021).

Informed Consent Statement

Not applicable.

Data Availability Statement

The datasets that were generated during and/or analyzed during the current study are available from the corresponding author on reasonable request. The data are not publicly available due to the school regulations.

Conflicts of Interest

The authors declare that they have no known competing financial interests or personal relationships that could have appeared to influence the work reported in this paper.

References

  1. Renu, K.; Chakraborty, R.; Myakala, H.; Koti, R.; Famurewa, A.C.; Madhyastha, H.; Vellingiri, B.; George, A.; Gopalakrishnan, A.V. Molecular mechanism of heavy metals (Lead, Chromium, Arsenic, Mercury, Nickel and Cadmium)—Induced hepatotoxicity—A review. Chemosphere 2021, 271, 129735. [Google Scholar] [CrossRef] [PubMed]
  2. García-Niño, W.R.; Pedraza-Chaverrí, J. Protective effect of curcumin against heavy metals-induced liver damage. Food Chem. Toxicol. 2014, 69, 182–201. [Google Scholar] [CrossRef]
  3. Ma, N.; Yang, Y.J.; Liu, X.W.; Li, S.H.; Qin, Z.; Li, J.Y. Plasma metabonomics and proteomics studies on the anti-thrombosis mechanism of aspirin eugenol ester in rat tail thrombosis model. J. Proteom. 2020, 215, 103631. [Google Scholar] [CrossRef] [PubMed]
  4. Wu, G.X.; Zhu, J.Y.; Li, K.; Gao, X.; Hu, C.; Cheng, J.A.; Ye, G.Y. A proteomic analysis of larval midguts of Boettcherisca peregrina in response to cadmium exposure. Bull. Ins. 2013, 66, 225–229. [Google Scholar]
  5. Beyoğlu, D.; Idle, J.R. Metabolomic and lipidomic biomarkers for premalignant liver disease diagnosis and therapy. Metabolites 2020, 10, 50. [Google Scholar] [CrossRef]
  6. Zhang, M.Y.; Jia, S.Q.; Liu, Y.J.; Liu, Y.L.; Li, S.Q.; Bo, L.; Zhao, X.J.; Sun, C.H. Metabonomics analysis of kidneys in rats administered with chronic low-dose cadmium by ultra-performance liquid chromatography-mass spectrometry. J. Appl. Toxicol. 2019, 39, 441–450. [Google Scholar] [CrossRef]
  7. Chen, S.; Zhang, M.Y.; Bo, L.; Li, S.Q.; Hu, L.Y.; Zhao, X.J.; Sun, C.H. Metabolomic analysis of the toxic effect of chronic exposure of cadmium on rat urine. Environ. Sci. Pollut. Res. 2018, 25, 3765–3774. [Google Scholar] [CrossRef]
  8. Eriksson, L.; Trygg, J.; Wold, S. CV-ANOVA for significance testing of PLS and OPLS® models. J. Chem. 2008, 22, 594–600. [Google Scholar] [CrossRef]
  9. Li, Y.F.; Liu, H.W.; He, J.; Shen, X.Y.; Zhao, K.; Wang, Y.C. The effects of oral administration of molybdenum fertilizers on immune function of Nanjiang brown goat grazing on natural pastures contaminated by mixed heavy metal. Biol. Trace Elem. Res. 2021, 200, 2750–2757. [Google Scholar] [CrossRef] [PubMed]
  10. Liu, Z.P.; Ma, Z.; Li, W.F.; Cheng, X.F.; Hui, T.C. Toxicological study of cadmium on sheep. Acta Veter. Zoot. Sin. 1996, 27, 546–553. [Google Scholar]
  11. Shen, X.Y.; Chi, Y.K.; Xiong, K.N. The effect of heavy metal contamination on humans and animals in the vicinity of a zinc smelting facility. PLoS ONE 2019, 14, e0207423. [Google Scholar] [CrossRef]
  12. Li, Y.F.; Shen, X.Y.; Liu, F.Y.; Luo, L.; Wang, Y.C. Molybdenum fertilization improved antioxidant capacity of grazing Nanjiang brown goat on copper-contaminated pasture. Biol. Trace Elem. Res. 2021, 200, 1156–1163. [Google Scholar] [CrossRef]
  13. Shen, X.Y.; Huo, B.; Li, Y.F.; Song, C.J.; Wu, T.; He, J. Response of the critically endangered Przewalski’s gazelle (Procapra przewalskii) to selenium deprived environment. J. Proteom. 2021, 241, 104218. [Google Scholar] [CrossRef]
  14. Kippler, M.; Nermell, B.; Hamadani, J.; Tofail, F.; Moore, S.; Vahter, M. Burden of cadmium in early childhood: Longitudinal assessment of urinary cadmium in rural Bangladesh. Toxicol. Lett. 2010, 198, 20–25. [Google Scholar] [CrossRef]
  15. Zalups, R.K. Evidence for basolateral uptake of cadmium in the kidneys of rats. Toxicol. Appl. Pharm. 2000, 164, 15–23. [Google Scholar] [CrossRef] [PubMed]
  16. Stoica, A.; Katzenellenbogen, B.S.; Martin, M.B. Activation of estrogen receptor-α by the heavy metal cadmium. Mol. Endocrinol. 2000, 14, 545–553. [Google Scholar]
  17. Shah, S.W.A.; Zhang, S.; Ishfaq, M.; Tang, Y.; Teng, X.H. PTEN/AKT/mTOR pathway involvement in autophagy, mediated by miR-99a-3p and energy metabolism in ammonia exposed chicken bursal lymphocytes. Poul. Sci. 2021, 100, 553–564. [Google Scholar] [CrossRef]
  18. Weiss, H.J.; Angiari, S. Metabolite transporters as regulators of immunity. Metabolites 2020, 10, 418. [Google Scholar] [CrossRef] [PubMed]
  19. Zhong, R.Z.; Liu, H.W.; Sun, H.X. Effects of dietary Astra-galus polysaccharide and Astragalus membranaceus root supplementation on growth performance, rumen fermentation, immune responses, and antioxidant status of lambs. Anim. Feed Sci. Tech. 2012, 174, 60–67. [Google Scholar] [CrossRef]
  20. Zhao, M.; Yu, J.S.; Yu, J.P.; Du, W. Effects of ampelopsis grossedentata flavonoids on serum biochemical indexes and immune function of piglets. China Anim. Husband. Vet. Med. 2016, 43, 1221–1225. [Google Scholar]
  21. Hu, H.; Xie, T.; Yang, S.; Gao, M.; Yao, Y. Effects of subacute ruminal acidosis on plasma cytokine and hormone contents in dairy goats. Chin. J. Anim. Nutr. 2015, 27, 418–425. [Google Scholar]
  22. Peng, S.L.; Yang, S.J. Effect of Jiuweibaizhutang on serum levels of interleukin -1β and interleukin-10 in ulcerative colitis rats. China Med. Herald. 2013, 10, 40–42. [Google Scholar]
  23. Michal, K.; Szabo, P.; Barbora, D.; Lukáš, L.; Hans-Joachim, G.; Hynek, S.; Jana, S.; Cestmír, V.; Jan, P.; Martin, C.; et al. Upregulation of IL-6, IL-8 and CXCL-1 production in dermal fibroblasts by normal/malignant epithelial cells in vitro: Immunohistochemical and transcriptomic analyses. Biol. Cell 2012, 104, 738–751. [Google Scholar]
  24. Wu, X.Z.; Dai, S.F.; Hua, J.L.; Hu, H.; Wang, S.J.; Wen, A.Y. Influence of dietary copper methionine concentrations on growth performance, digestibility of nutrients, serum lipid profiles, and immune defenses in broilers. Biol. Trace Elem. Res. 2019, 191, 199–206. [Google Scholar] [CrossRef]
  25. Hocquette, J.F.; Bauchart, D. Intestinal absorption, blood transport and hepatic and muscle metabolism of fatty acids in preruminant and ruminant animals. Reprod. Nutr. Dev. 1999, 39, 27–48. [Google Scholar] [CrossRef]
  26. Martínez-Reyes, I.; Chandel, N.S. Mitochondrial TCA cycle metabolites control physiology and disease. Nat. Commun. 2020, 11, 102. [Google Scholar] [CrossRef]
  27. Robert, R.; Soni, S.; Houle, S.A. Negative energy balance induced by exercise or diet: Effects on visceral adipose tissue and liver fat. Nutrients 2020, 12, 891. [Google Scholar]
  28. Sears, D.D.; Hsiao, G.; Hsiao, A.; Yu, J.G.; Courtney, C.H.; Ofrecio, J.M.; Chapman, J.; Subramaniam, S. Mechanisms of human insulin resistance and thiazolidinedione-mediated insulin sensitization. Proc. Natl. Acad. Sci. USA 2009, 106, 18745–18750. [Google Scholar] [CrossRef] [Green Version]
  29. Ahmad, M.I.; Ijaz, M.U.; Hussain, M.; Khan, I.A.; Mehmood, N.; Siddiqi, S.M.; Liu, C.C.; Zhao, D.; Xu, X.L.; Zhou, G.H.; et al. High fat diet incorporated with meat proteins changes biomarkers of lipid metabolism, antioxidant activities, and the serum metabolomic profile in Glrx1 (-/-) mice. Food Funct. 2020, 11, 236–252. [Google Scholar] [CrossRef]
  30. Lafuente, A.; Fenandez-Rey, E.; Seara, R.; Pérez-Lorenzo, M.; Esquifino, A.I. Alternate cadmium exposure differentially affects amino acid metabolism within the hypothalamus, median eminence, striatum and prefrontal cortex of male rats. Neurochem. Int. 2001, 39, 187–192. [Google Scholar] [CrossRef]
  31. Chen, X.M.; Bi, M.Y.; Yang, J.; Cai, J.Z.; Zhang, H.R.; Zhu, Y.; Zheng, Y.Y.; Liu, Q.; Shi, G.L.; Zhang, Z.W. Cadmium exposure triggers oxidative stress, necroptosis, Th1/Th2 imbalance and promotes inflammation through the TNF-alpha/NF-Kappa B pathway in swine small intestine. J. Hazard. Mater. 2021, 421, 126704. [Google Scholar] [CrossRef]
  32. Chen, J.Q.; Xu, Y.M.; Han, Q.; Yao, Y.C.; Xing, H.J.; Teng, X.H. Immunosuppression, oxidative stress, and glycometabolism disorder caused by cadmium in common carp (Cyprinus carpio L.): Application of transcriptome analysis in risk assessment of environmental contaminant cadmium. J. Hazard. Mater. 2019, 366, 386–394. [Google Scholar] [CrossRef]
  33. Hashim, M.; Arif, H.; Tabassum, B.; Arif, A.; Rehman, A.A.; Rehman, S.; Khanam, R.; Khan, B.; Hussain, A.; Barnawi, J.; et al. Protective effect of catharanthus roseus extract on cadmium-induced toxicity in albino rats: A putative mechanism of detoxification. Metabolites 2022, 12, 1059. [Google Scholar] [CrossRef] [PubMed]
  34. Duan, Y.H.; Li, F.N.; Li, Y.H.; Tang, Y.L.; Kong, X.F.; Feng, Z.M.; Anthony, T.G.; Watford, M.; Hou, Y.Q.; Wu, G.Y.; et al. The role of leucine and its metabolites in protein and energy metabolism. Amino Acids 2016, 48, 41–51. [Google Scholar] [CrossRef] [PubMed]
Figure 1. Histopathological changes of the liver in the Guizhou black goat (HE × 400).
Metabolites 13 00268 g001
Figure 2. Mineral elements in the goat organ and tissue (ug/g). Zn, zinc; Cu, copper; Fe, iron; Cd, cadmium. Different small letters of superscript indicate significant differences (p < 0.05), and the same small letters or no letters indicate no significant difference (p > 0.05).
Metabolites 13 00268 g002
Figure 3. Immune functions in the goat serum and liver. IgG, Immunoglobulin G; IgM, Immunoglobulin M; IgA, Immunoglobulin A; IL-6, interleukin 6; IL-1β, interleukin-1β; TNF-α, tumor necrosis factor-alpha. CON Group, the control group; Cd Group, the cadmium group. Different small letters of superscript indicate significant differences (p < 0.05), and the same small letters or no letters indicate no significant difference (p > 0.05).
Metabolites 13 00268 g003
Figure 4. OPLS−DA score plots derived from HILIC UHPLC−Q−EXACTIVE/MS in positive (a) and negative (b) ionization modes. Samples in the Cd group were separated from those in the control group. R2 X and R2 Y indicate the fraction of the variables explained by the model, and the Q2 shows the predictive abilities of the model. Control versus Cd, ESI+: R2 X = 0.781, R2 Y = 1.000 and Q2 = 0.794; ESI-: R2 X = 0.799, R2 Y = 1.000 and Q2 = 0.802. Hierarchical clustering heat map, correction analysis, and pathway analysis of metabolites that were obtained from the liver. Unsupervised hierarchical clustering heat map of metabolites from liver of goats in the positive mode (c) and negative mode (d). Cluster of the changed metabolites (right side) and the samples in different groups (bottom). The color of the heatmap from red to blue indicated the relative intensity of the metabolites.
Metabolites 13 00268 g004
Figure 5. KEGG metabolic pathway analysis diagram of metabolites from livers of goats.
Metabolites 13 00268 g005
Table 1. Metabolic pathways of candidate biomarkers in the goat liver related to Cd exposure.
Pathway IDPathway NameTotalPop Hitp-Value_Adjusted
oas04931Insulin resistance 12190.000834
oas00250Alanine, aspartate, and glutamate metabolism12280.00139
oas04930Type II diabetes mellitus1260.00179
oas04911Insulin secretion 12120.00583
oas04066HIF-1 signaling pathway 12150.00739
oas00330Arginine and proline metabolism12780.00878
oas00020Citrate cycle (TCA cycle) 12200.00878
oas04152AMPK signaling pathway 12220.00878
oas00430Taurine and hypotaurine metabolism12220.00878
oas00290Valine, leucine, and isoleucine biosynthesis 12230.00878
oas04922Glucagon signaling pathway 12260.0102
oas00770Pantothenate and CoA biosynthesis 12280.0106
oas00010Glycolysis/Gluconeogenesis 12310.0106
oas00620Pyruvate metabolism 12310.0106
oas00730Thiamine metabolism 12310.0106
oas00030Pentose phosphate pathway 12350.0127
oas05230Central carbon metabolism in cancer 12370.0133
oas00650Butanoate metabolism 12420.0161
oas00900Terpenoid backbone biosynthesis 12450.0175
oas00340Histidine metabolism 12470.018
oas00053Ascorbate and aldarate metabolism 12490.0185
oas00260Glycine, serine, and threonine metabolism 12500.0185
oas00564Glycerophospholipid metabolism 12520.0191
oas00760Nicotinate and nicotinamide metabolism 12550.0195
oas00040Pentose and glucuronate interconversions 12550.0195
oas00440Phosphonate and phosphinate metabolism12560.0195
oas00360Phenylalanine metabolism12600.0214
oas00630Glyoxylate and dicarboxylate metabolism 12620.0219
oas00270Cysteine and methionine metabolism 12630.0219
oas00350Tyrosine metabolism 12780.0318
oas05231Choline metabolism in cancer 12110.0465
oas01200Carbon metabolism 121140.0602
oas01230Biosynthesis of amino acids 121280.072
oas012102-Oxocarboxylic acid metabolism121340.0759
oas00565Ether lipid metabolism 12250.0893
oas00600Sphingolipid metabolism 12250.0893
oas00062Fatty acid elongation 12400.136
oas00071Fatty acid degradation 12500.164
oas00061Fatty acid biosynthesis 12580.183
oas01100Metabolic pathways 1227020.199
oas01040Biosynthesis of unsaturated fatty acids 12740.217
oas00230Purine metabolism 12950.265
oas00520Amino sugar and nucleotide sugar metabolism121080.289
oas01212Fatty acid metabolism 121220.314
oas02010ABC transporters ABC121370.338
Table 2. Significantly modulated metabolites in the goat liver with Cd poisoning based on OPLS-DA.
NOAdductionRT (min)m/zFormulaMetaboliteKEGG PathwayVIPChangep-Value
1[M + H]+0.161142.02649C6H6O4Kojic acid-1.730.034
2[M + H]+6.872405.3448C22H47NO5Hydrolyzed fumonisin B1-2.030.007
3[M + H]+10.033715.51426C39H74NO8P1-Palmitoyl-2-linoleoyl PE-1.660.045
4[M + H]+5.051202.0293C8H10O4S4-ethylphenylsulfonic acid-2.150.003
5[M + H]+6.84317.29251C18H39NO32-Amino-1,3,4-octadecanetriol-2.160.002
6[M + H]+10.02753.52898C42H76NO8P1-hexadecanoyl-2-[(6Z,9Z,12Z,15Z)-octadecatetraenoyl]-sn-glycero-3-phosphocholine-1.910.015
7[M + H]+10.023837.62212C48H88NO8P1-octadecanoyl-2-(7Z,10Z,13Z,16Z-docosatetraenoyl)-sn-glycero-3-phosphocholine-1.680.040
8[M + H]+0.114151.98775C3H5O5P3-[hydroxyl (oxido) phosphoranyl]pyruvic acid-2.280.001
9[M + H]+0.1179.01454C9H6ClNOcloxyquin-1.790.026
10[M + H]+6.802273.26635C16H32O2Palmitic Acidmap01100, Metabolic pathways|map00062, Fatty acid elongation|map01212, Fatty acid metabolism|map00061, Fatty acid biosynthesis|map00071, Fatty acid degradation|map01040, Biosynthesis of unsaturated fatty acids2.120.004
11[M + H]+0.157220.05786C8H12O7(-)-threo-isodihomocitric acid-2.350.000
12[M + H]+10.156511.49544C32H65NO3N-tetradecanoylsphinganine-1.780.027
13[M + H]+7.502414.20355C24H30O6Bis (4-ethylbenzylidene) sorbitol-1.770.029
14[M + H]+9.484335.31808C22H41NO(2E,4Z)-N-Isobutyl-2,4-octadecadienamide-1.690.039
15[M + H]+6.556227.18827C13H25NO2Cyprodenate-1.650.046
16[M + H]+7.953196.08868C14H12OMFCD00005122-1.790.026
17[M + H]+7.251310.17798C17H26O5Botrydial-2.340.000
18[M + H]+7.19494.1179C26H24Cl2N4O21-benzyl-3-(tert-butyl)-N-[6-(2,6-dichlorophenoxy)-3-pyridinyl]-1H-pyrazole-5-carboxamide-1.710.037
19[M + H]+7.078294.18313C17H26O4Embelin-2.440.000
20[M + H]+1.004268.08046C10H12N4O5Inosinemap01100, Metabolic pathways|map02010, ABC transporters|map00230, Purine metabolism1.760.030
21[M + H]+1.307268.08064C10H12N4O5Arabinosylhypoxanthine-1.770.028
22[M + H]+4.912242.08048C12H10N4O23-amino-2-phenyl-2H-pyrazolo [4,3-c]pyridine-4,6-diol-1.630.049
23[M + H]+9.156300.26627C18H36O312-HSA-1.630.050
24[M + H]+0.997147.03538C5H9NO2S3-Thiomorpholinecarboxylic acid-1.810.024
25[M + H]+0.943259.04518C6H14NO8PD-Glucosamine 6-phosphatemap01100, Metabolic pathways|map00520, Amino sugar and nucleotide sugar metabolism|map00250, Alanine, aspartate and glutamate metabolism|map04931, Insulin resistance1.840.021
26[M + H]+0.833125.09551C6H11N3N-Methylhistaminemap01100, Metabolic pathways|map00340, Histidine metabolism1.830.021
27[M + H]+1.012145.01971C5H7NO2S3,4-dehydrothiomorpholine-3-carboxylic acid-1.720.035
28[M + H]+10.5765.5307C43H76NO8P1-oleoyl-2-arachidonoyl-sn-glycerol-3-phosphoethanolamine-1.740.033
29[M + H]+9.744779.54458C44H78NO8PPC(18:3(9Z,12Z,15Z)/18:2(9Z,12Z))-1.640.048
30[M − H]-0.175142.02648C6H6O4Kojic acid-1.700.035
31[M − H]-5.08202.0293C8H10O4S4-ethylphenylsulfonic acid-2.120.003
32[M − H]-1.082231.14672C11H21NO4N-(tert-Butoxycarbonyl)-L-leucine-1.700.035
33[M − H]-6.882317.2925C18H39NO3Phytosphingosinemap00600, Sphingolipid metabolism|map01100, Metabolic pathways2.120.003
34[M − H]-6.844273.26635C16H35NO2Hexadecasphinganine-2.080.004
35[M − H]-0.145220.05786C8H12O7(-)-threo-isodihomocitric acid-2.300.000
36[M − H]-10.195511.49544C32H65NO3N-tetradecanoylsphinganine-1.780.025
37[M − H]-1.006134.0203C4H6O5DL-Malic acid-1.990.008
38[M − H]-8.716295.13857C19H21NSPizotifen-1.660.042
39[M − H]-1.00188.01482C3H4O3Pyruvic acid-1.940.011
40[M − H]-9.524335.31808C22H41NO(2E,4Z)-N-Isobutyl-2,4-octadecadienamide-1.660.041
41[M − H]-7.997196.08868C14H12Ostilben-4-ol-1.650.044
42[M − H]-7.294310.17798C17H26O56-Hydroxy-4,9a-dimethoxy-3,4a,5-trimethyl-4a,5,6,7,8,8a,9,9a-octahydronaphtho[2,3-b]furan-2(4H)-one-2.330.000
43[M − H]-7.421196.14558C12H20O2cis-4-Hydroxy-6-decenoic acid lactone-2.220.001
44[M − H]-7.121294.18313C17H26O4(+)-[6]-Gingerol-2.430.000
45[M − H]-0.905193.02524C4H8N3O4Pfosfocreatinine-1.630.046
46[M − H]-0.937155.03456C3H10NO4PN-methylethanolamine phosphatemap00564, Glycerophospholipid metabolism1.680.039
47[M − H]-4.526173.10491C8H15NO3Acexamic acid-1.610.049
48[M − H]-9.199300.26627C18H36O312-HSA-1.630.046
49[M − H]-1.011129.04142C5H7NO34-Oxoprolinemap01100, Metabolic pathways|map00330, Arginine and proline metabolism1.680.038
51[M − H]-0.956259.04518C6H14NO8PD-Glucosamine 6-phosphatemap01100, Metabolic pathways|map00520, Amino sugar and nucleotide sugar metabolism|map00250, Alanine, aspartate and glutamate metabolism|map04931, Insulin resistance1.790.023
52[M − H]-3.594159.08951C7H13NO3N-Acetylvaline-1.730.031
53[M − H]-1.023147.03538C5H9NO2S3-Thiomorpholinecarboxylic acid-1.820.020
54[M − H]-0.857125.09551C6H11N31-Methylhistaminemap01100, Metabolic pathways|map00340, Histidine metabolism1.770.026
55[M − H]-1.04145.01971C5H7NO2S3,4-dehydrothiomorpholine-3-carboxylic acid-1.710.034
56[M − H]-10.536765.53073C43H76NO8P1-oleoyl-2-arachidonoyl-sn-glycerol-3-phosphoethanolamine-1.700.035
57[M − H]-10.028743.54515C41H78NO8P1,2-Dioleoyl-sn-glycero-3-PE-2.260.001
58[M − H]-0.985234.08487C8H14N2O6glu-ser-1.781.782
59[M − H]-0.159150.05415C6H6N4ODezaguanine-1.631.633
RT: retention time. ↑ indicates up-regulation and ↓ indicates down-regulation.
Disclaimer/Publisher’s Note: The statements, opinions and data contained in all publications are solely those of the individual author(s) and contributor(s) and not of MDPI and/or the editor(s). MDPI and/or the editor(s) disclaim responsibility for any injury to people or property resulting from any ideas, methods, instructions or products referred to in the content.

