
Metabolic Modeling Identifies a Novel Molecular Type of Glioblastoma Associated with Good Prognosis

Abstract
:1. Introduction
2. Materials and Methods
2.1. GBM Gene Expression Data
2.2. Metabolic Modeling
2.3. Survival Analysis
2.4. Differential Gene Expression and Metabolic Flux Analysis
2.5. Statistical Analysis for Identifying Metabolic Reactions Related to Prognosis
2.6. Flux Pathway Analysis
3. Results
3.1. Metabolic Profiles of GBM by Metabolic Modeling
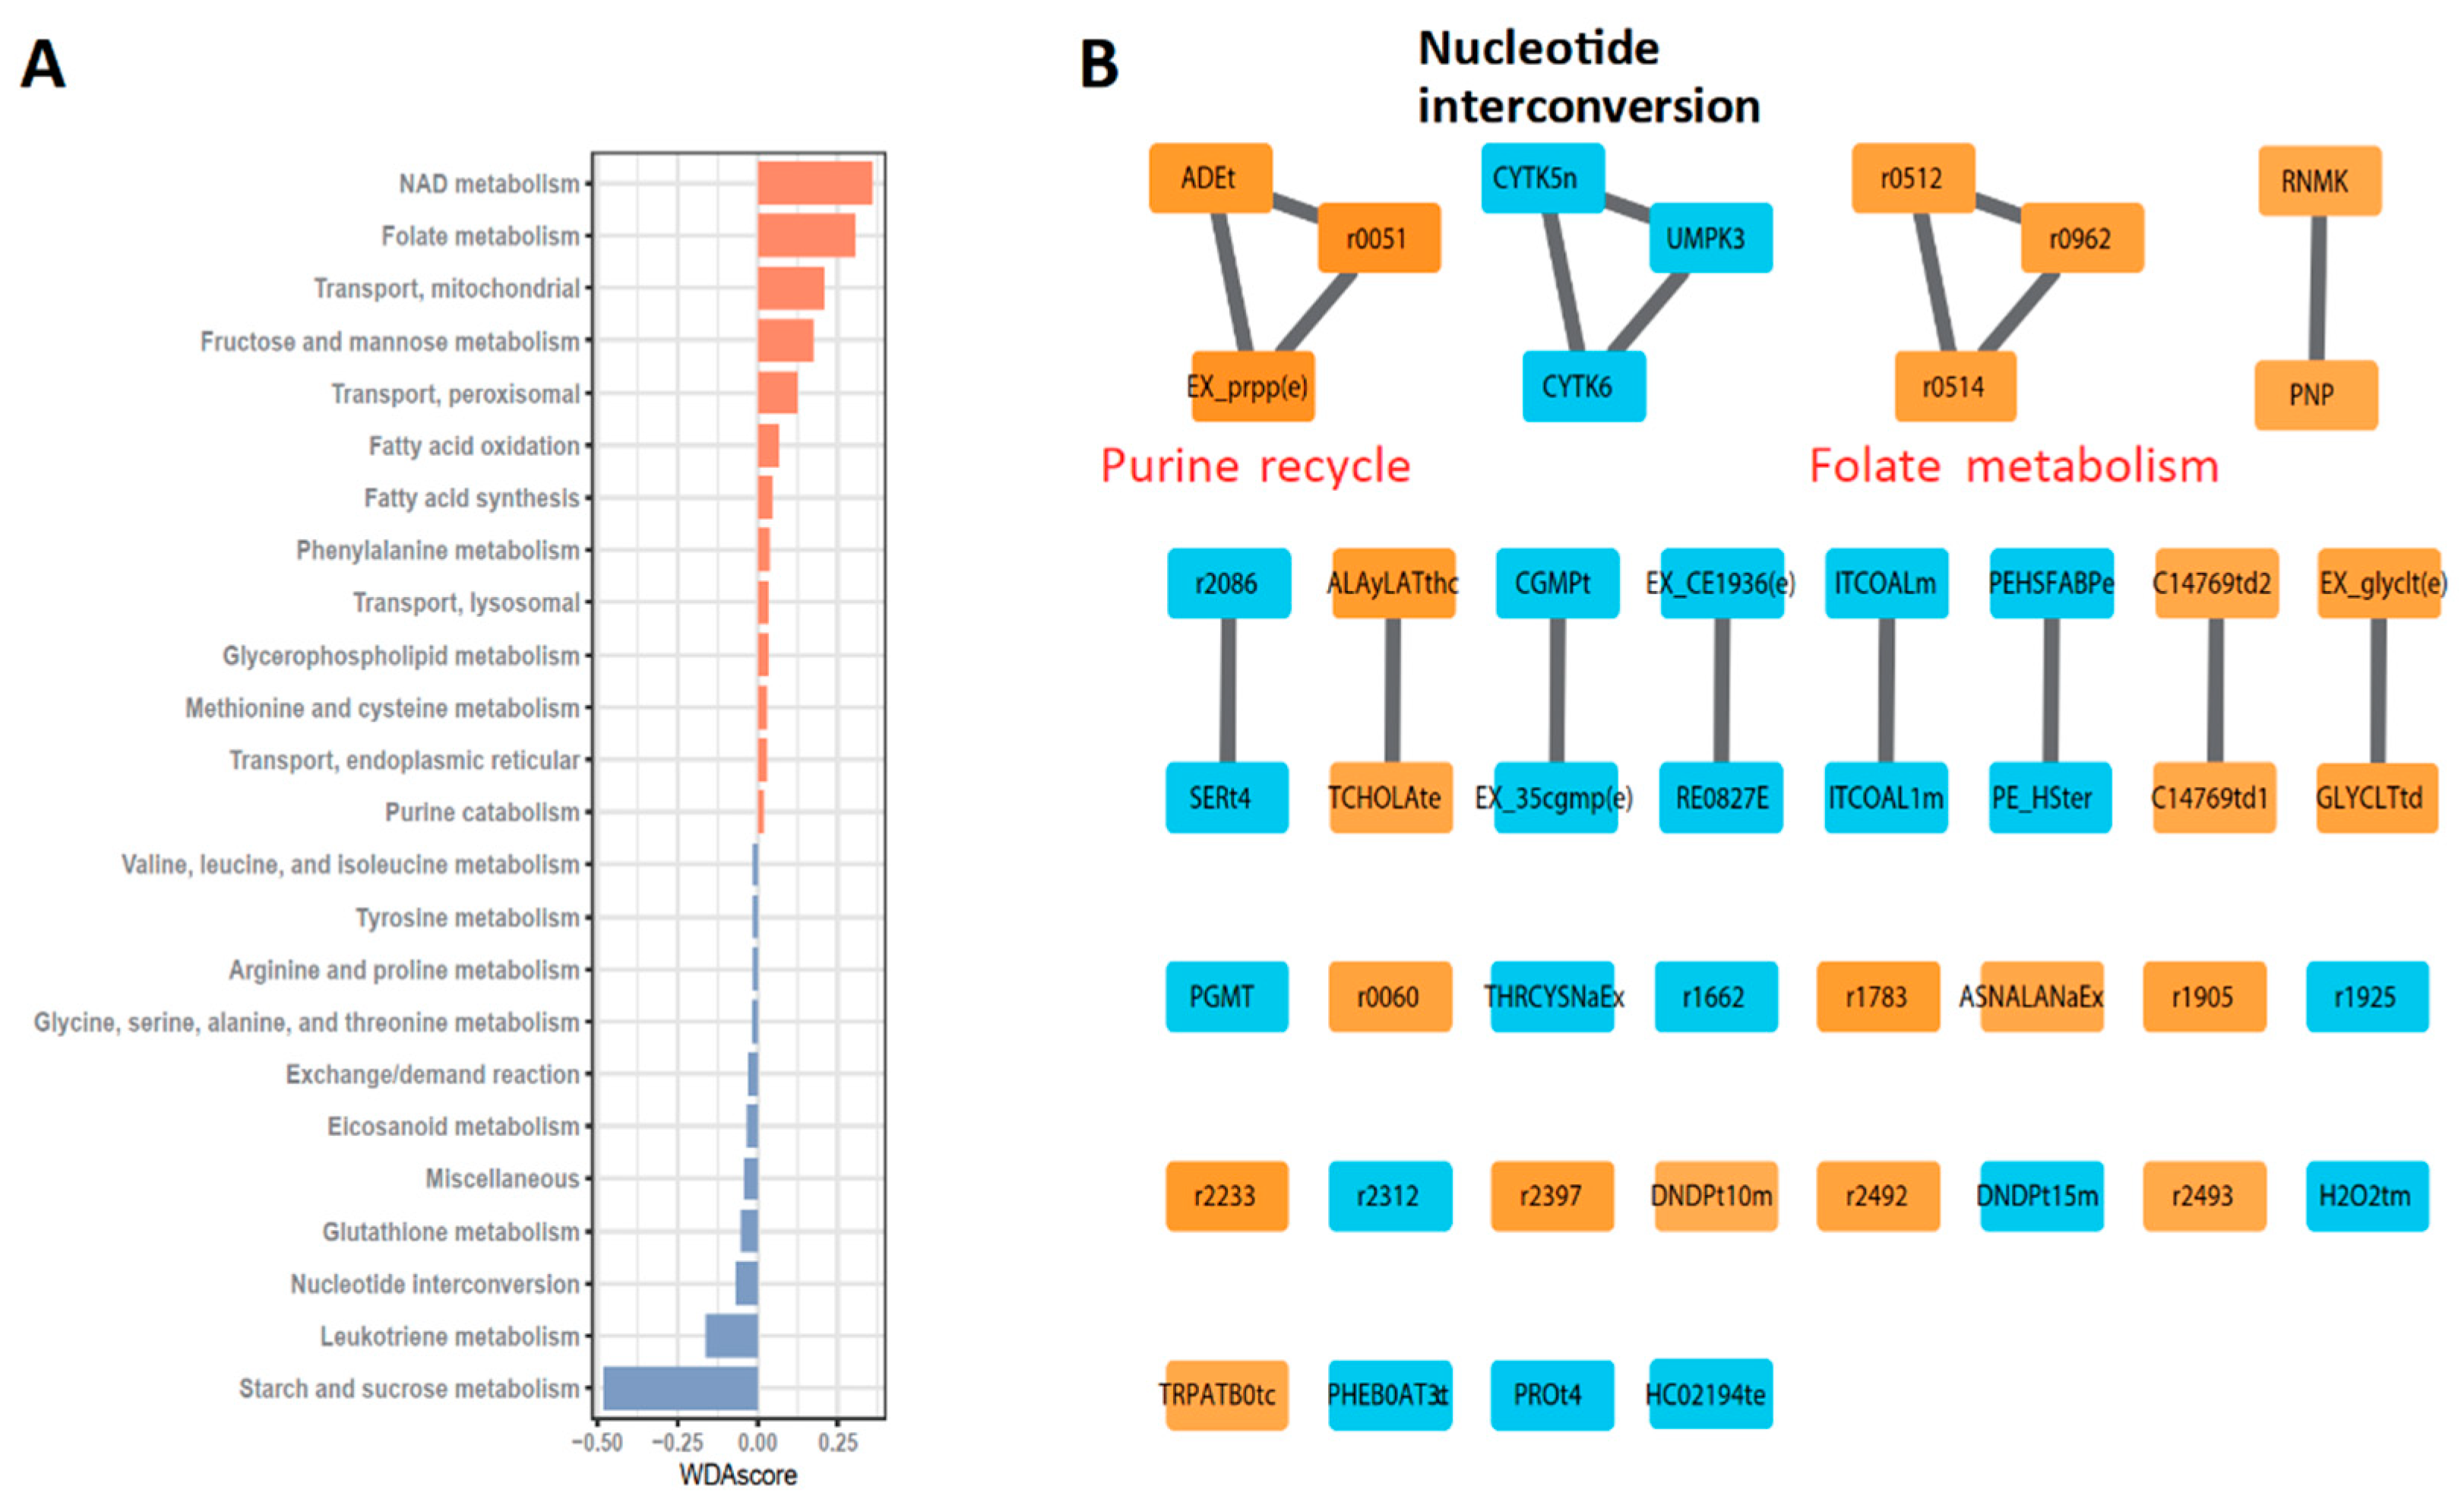
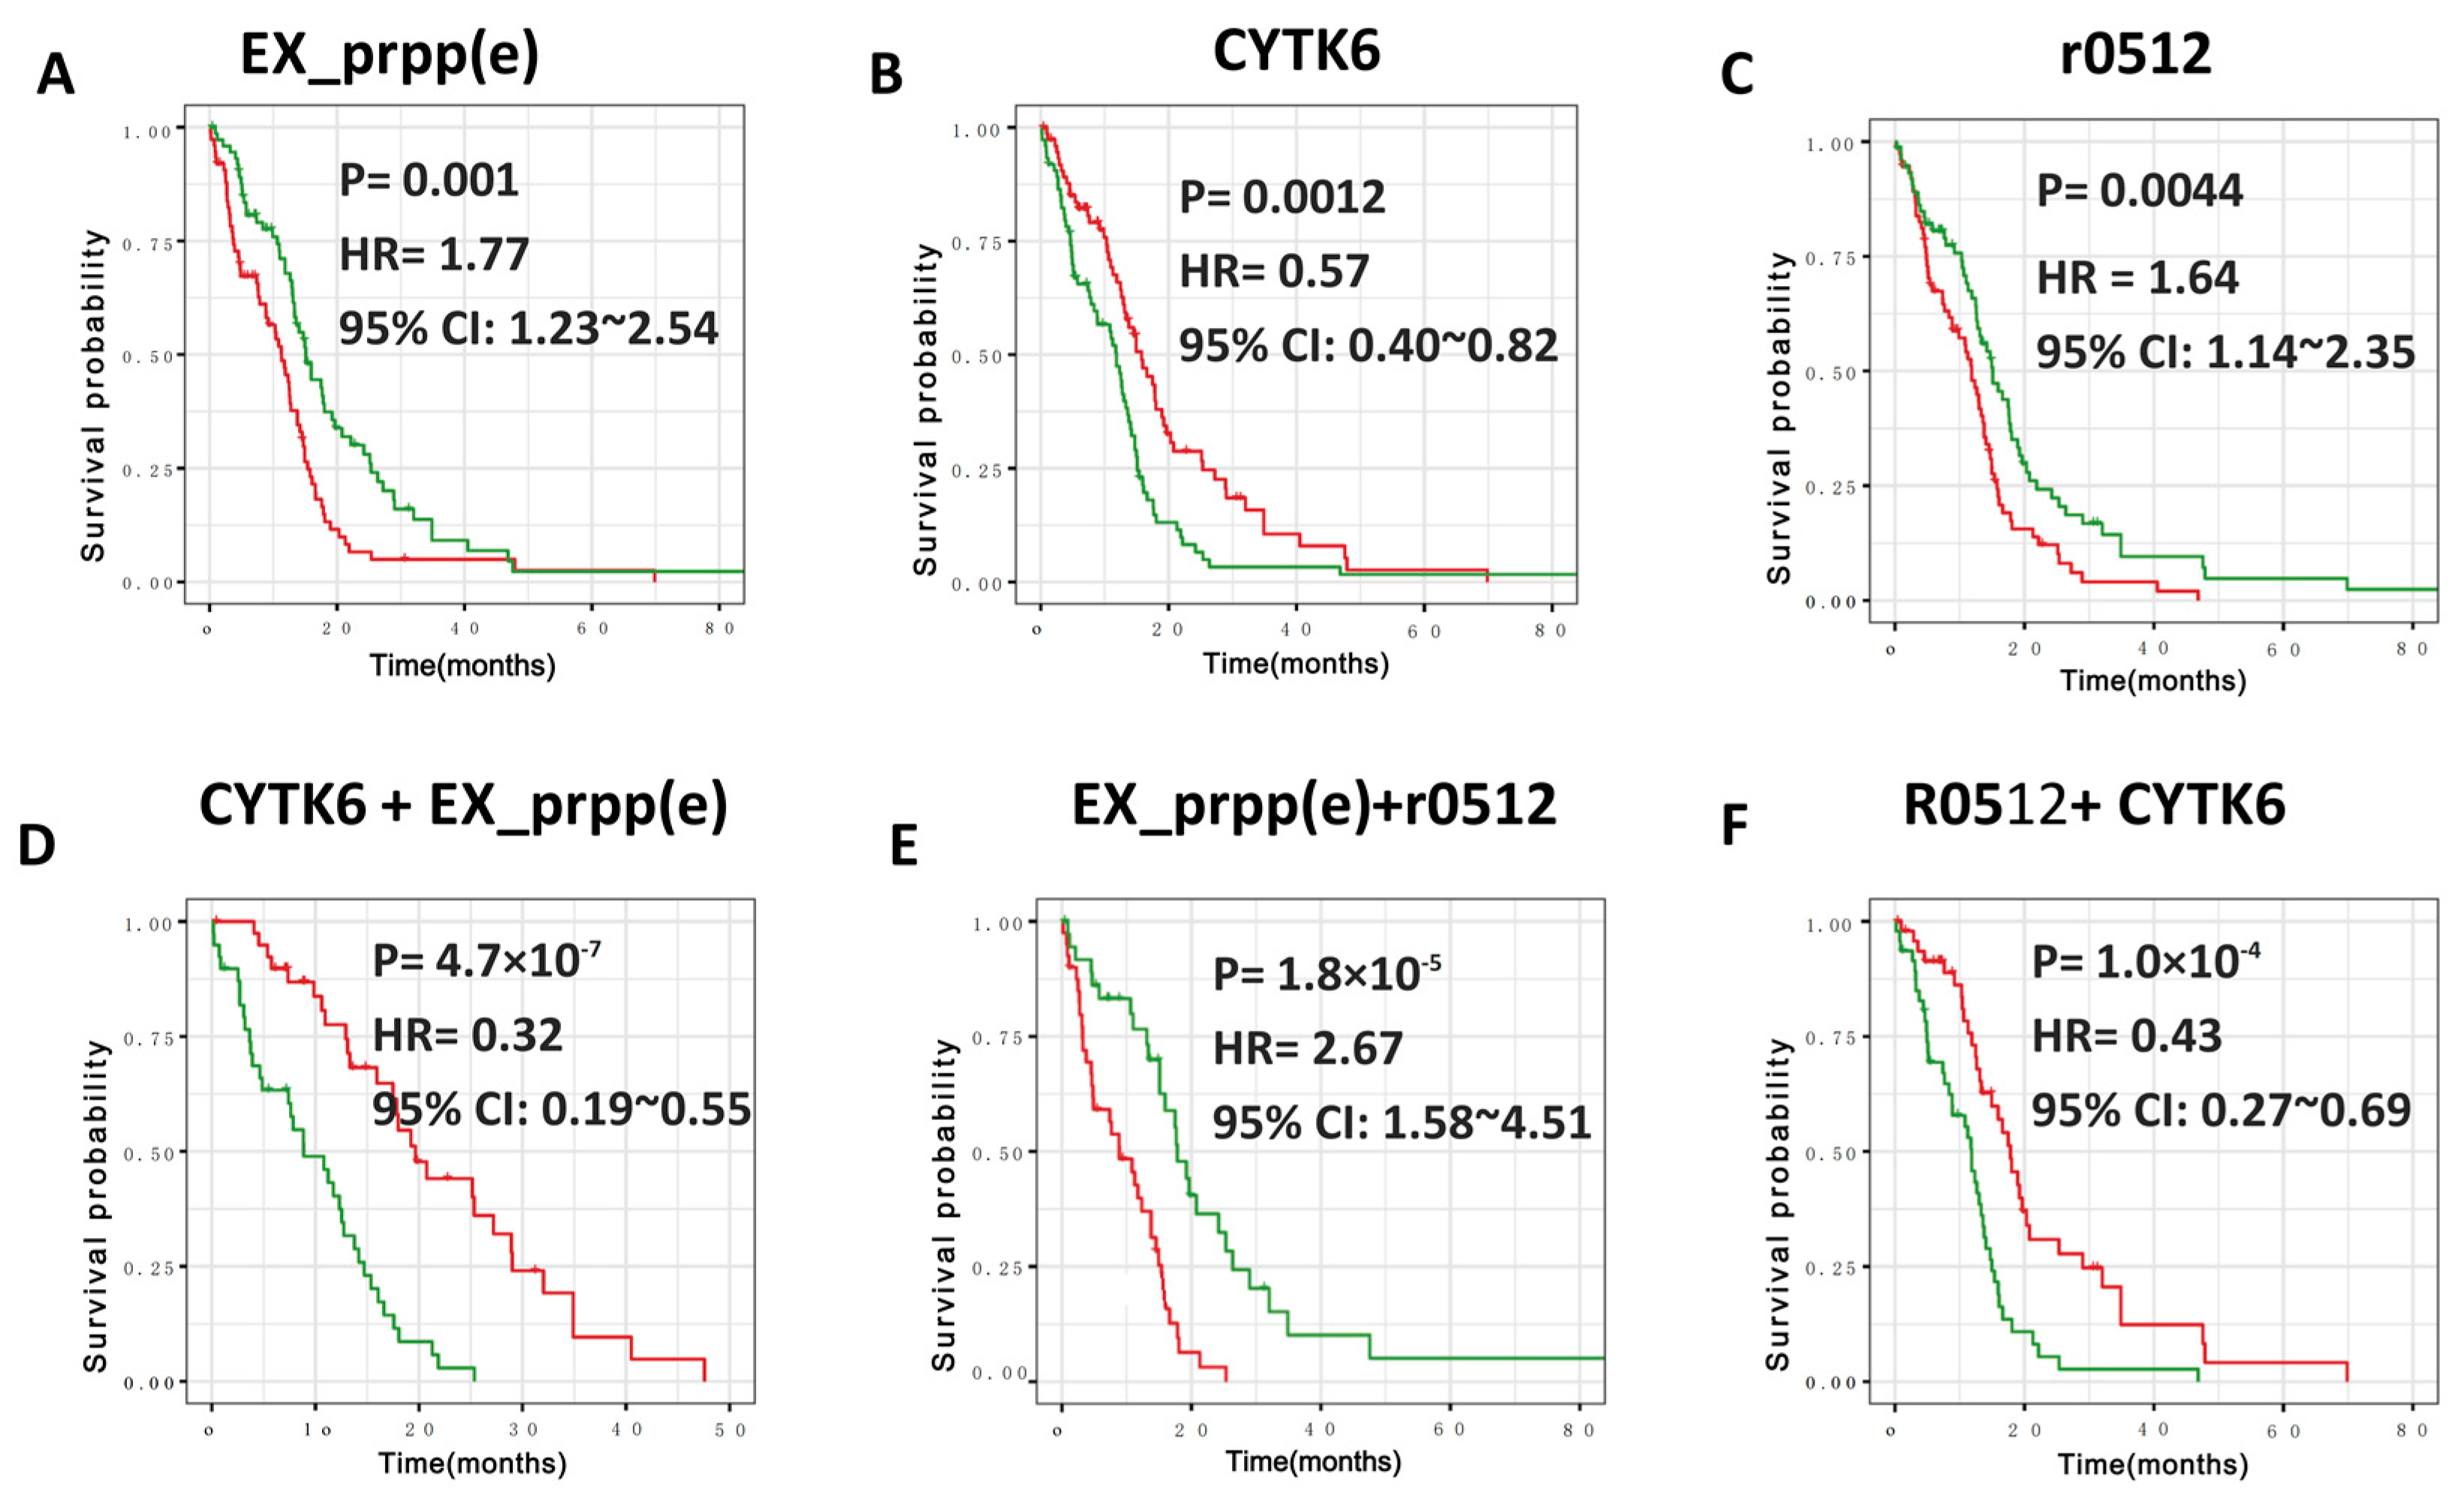
3.2. Robust Metabolic Modules Related to Prognosis
3.3. Defining New GBM Type with Better Prognosis Than IDH1 Mutant-Type
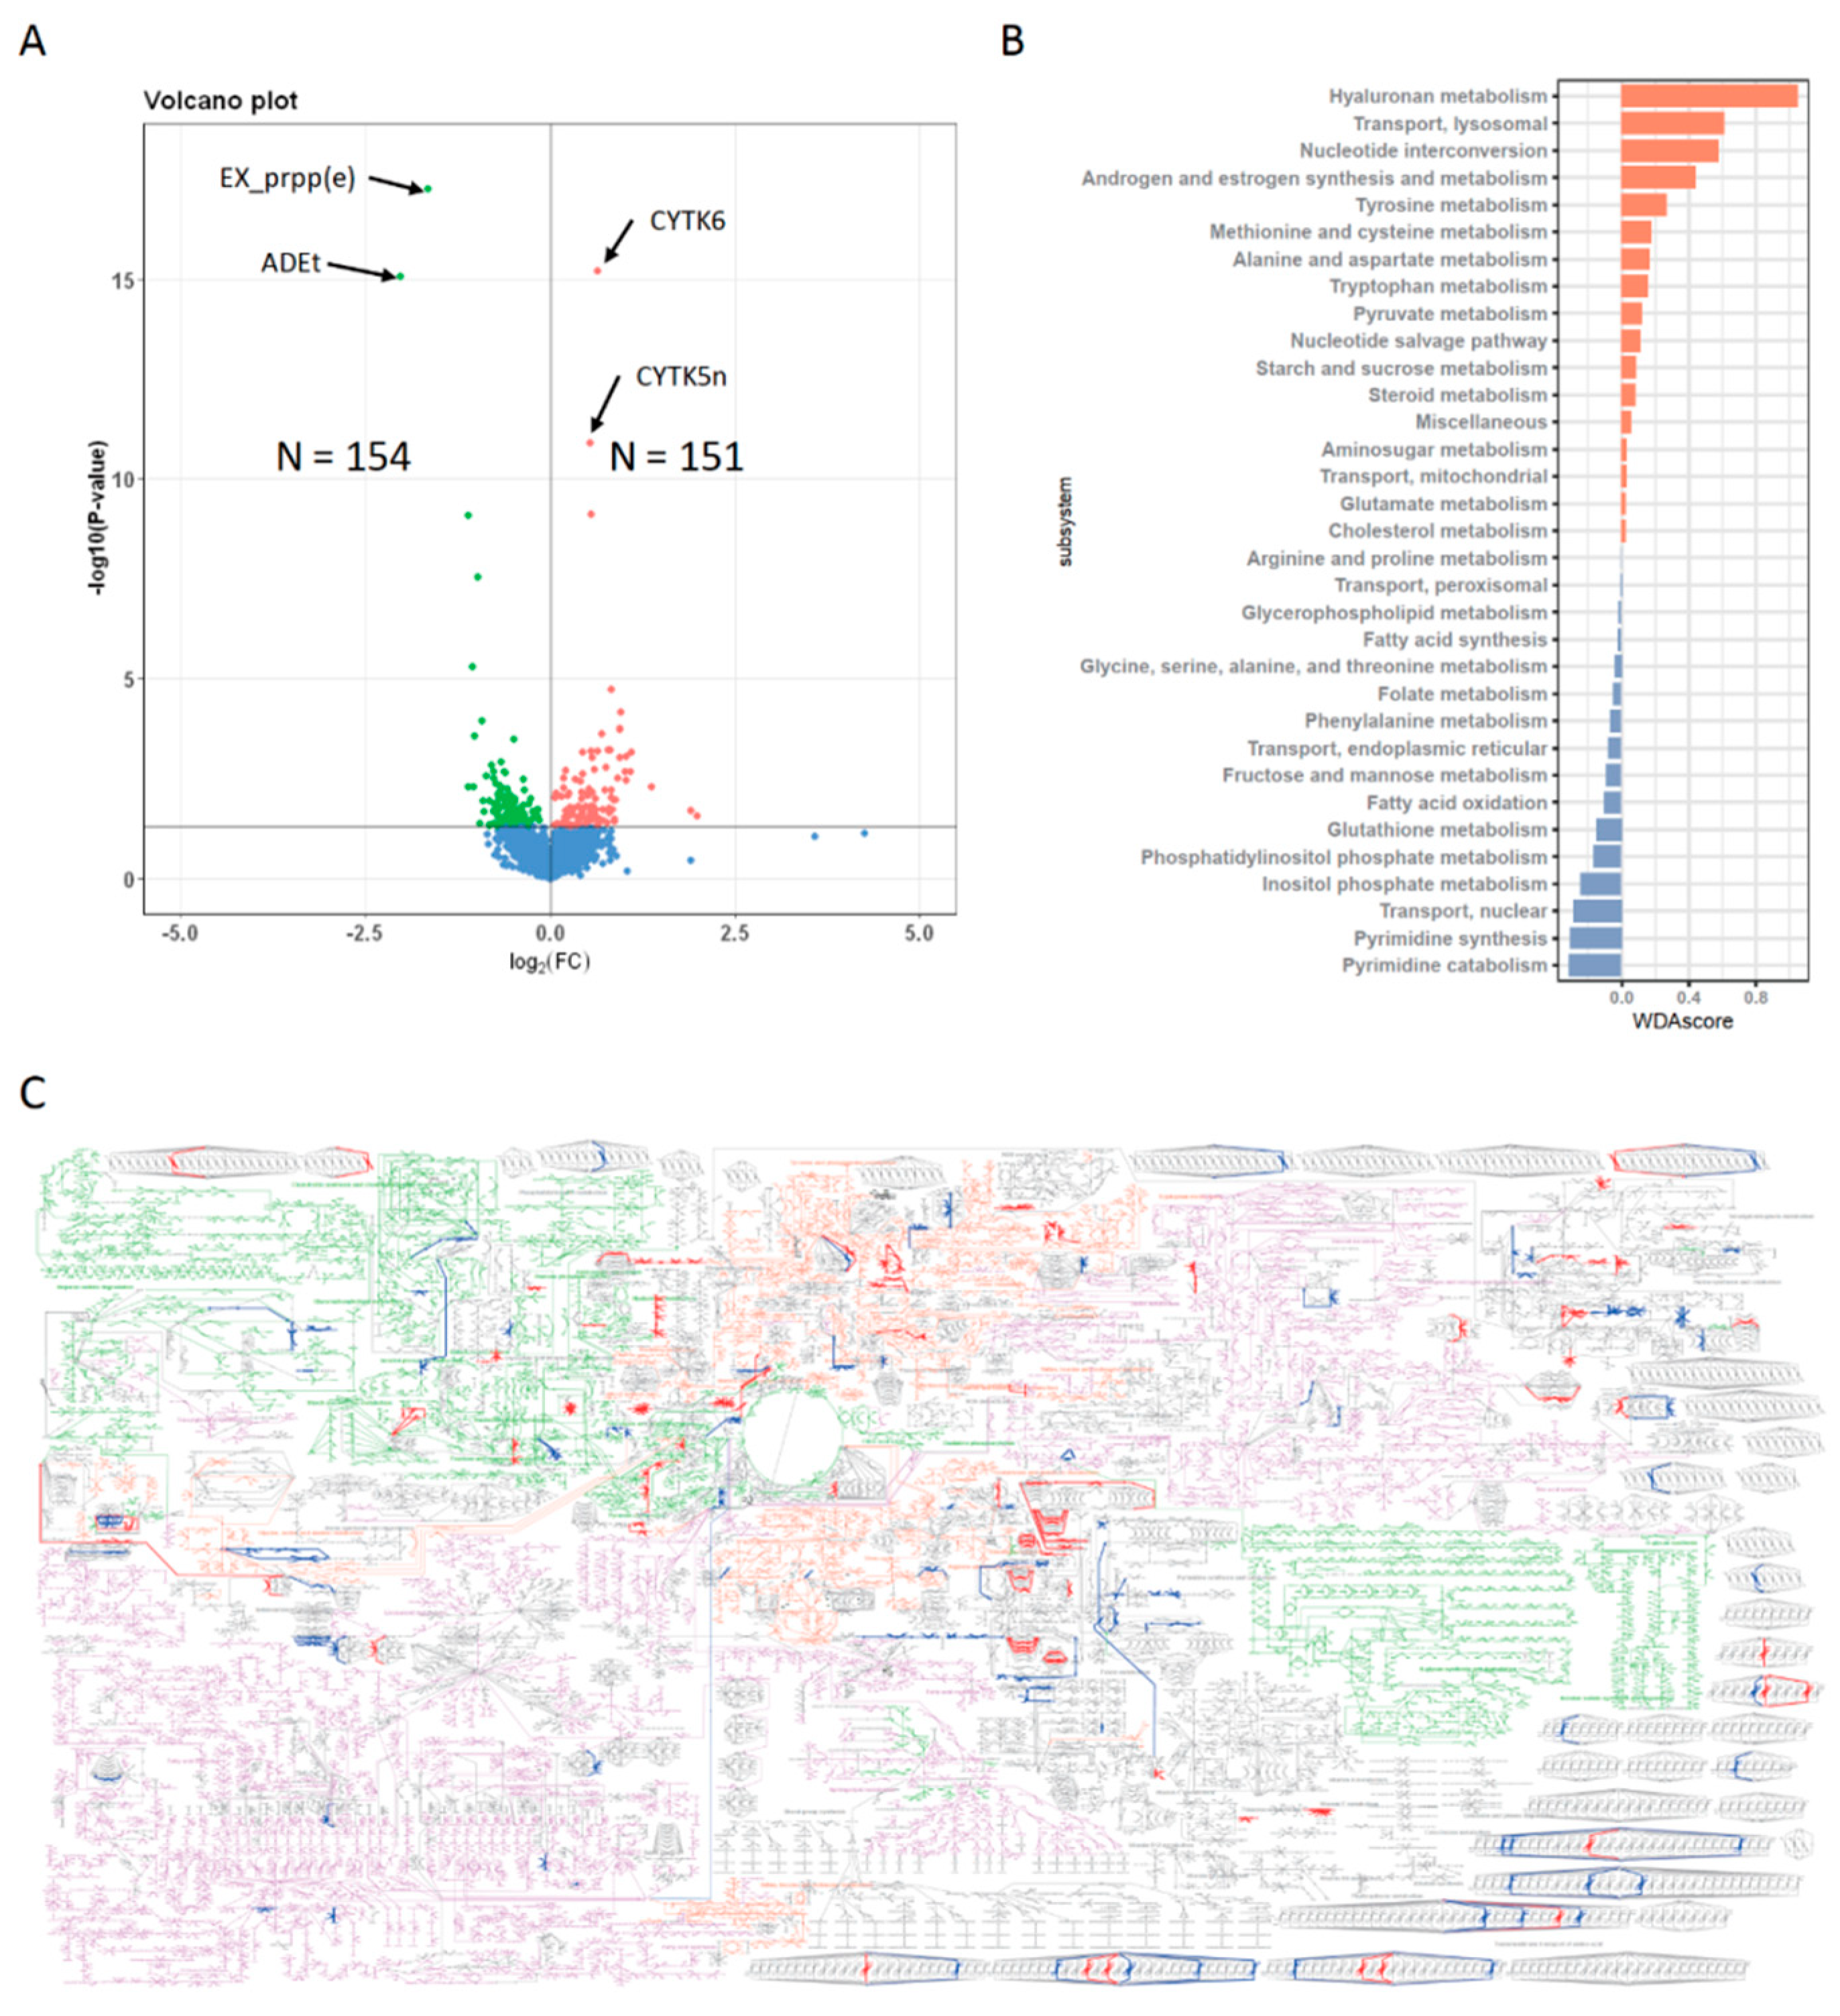
3.4. Metabolic Profiles of N+P− Type
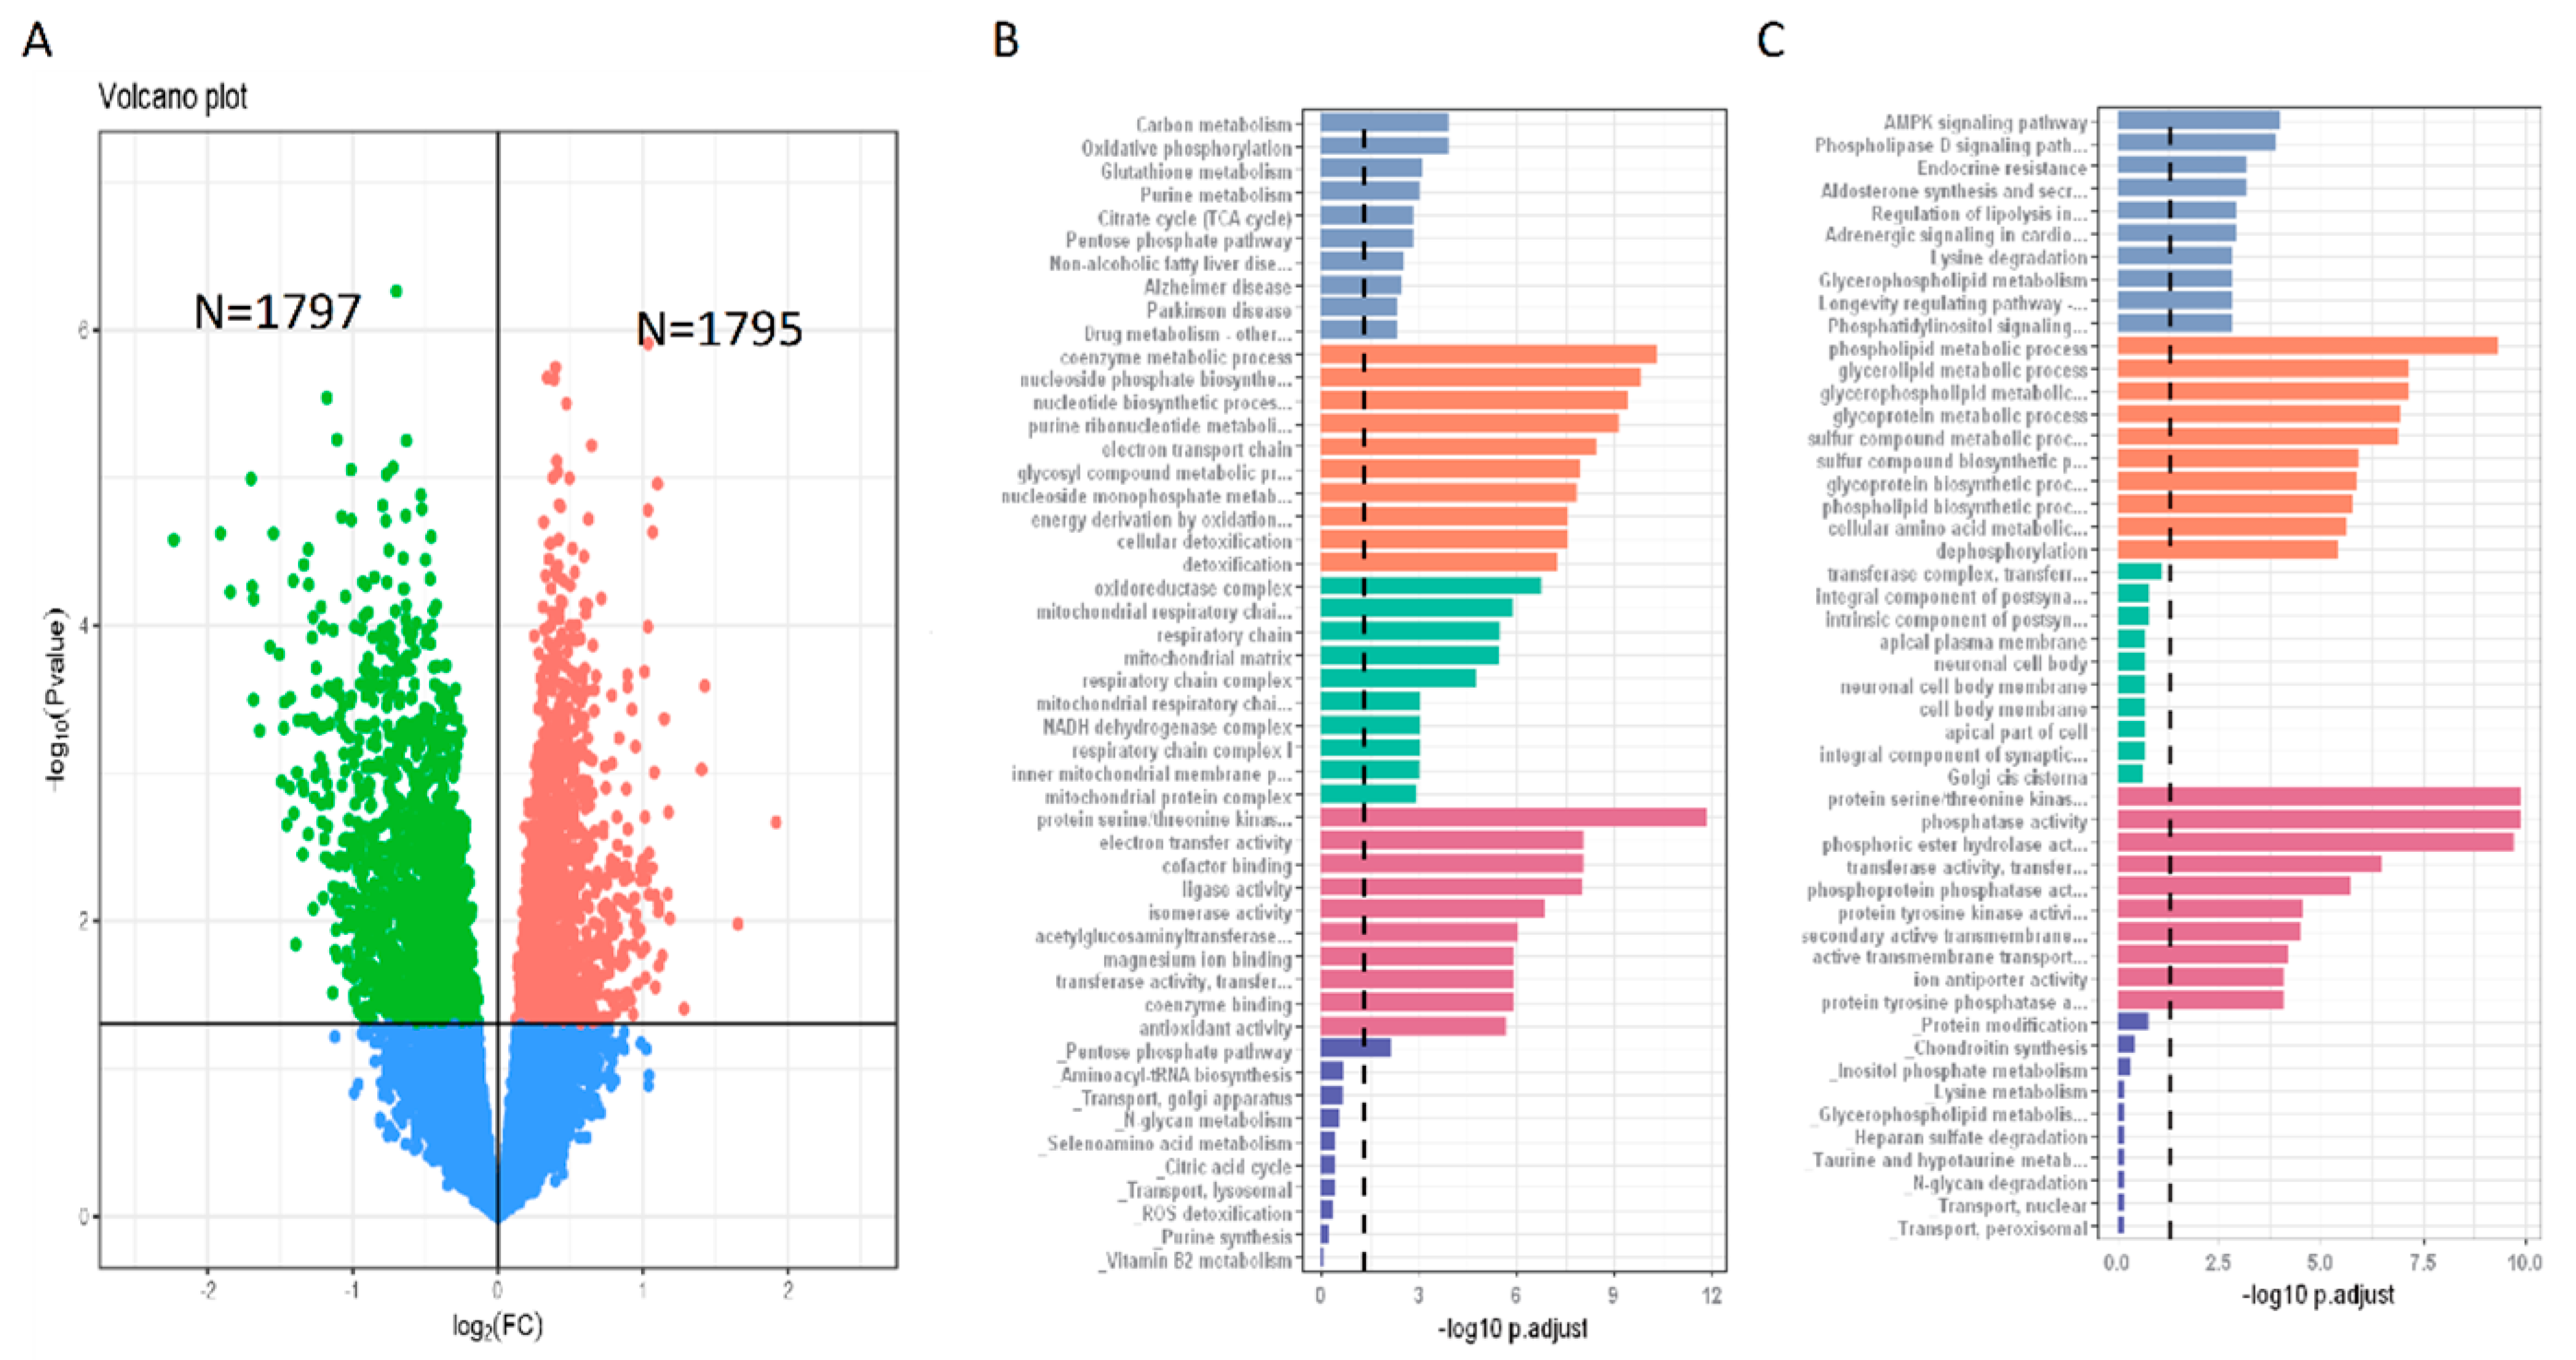
3.5. Gene Expression Features of N+P− Type
4. Discussion
5. Conclusions
Supplementary Materials
Author Contributions
Funding
Institutional Review Board Statement
Informed Consent Statement
Data Availability Statement
Acknowledgments
Conflicts of Interest
References
- Ludwig, K.; Kornblum, H.I. Molecular Markers in Glioma. J. Neurooncol. 2017, 134, 505–512. [Google Scholar] [CrossRef]
- Zhang, R.Q.; Shi, Z.; Chen, H.; Chung, N.Y.-F.; Yin, Z.; Li, K.K.-W.; Chan, D.T.-M.; Poon, W.S.; Wu, J.; Zhou, L.; et al. Biomarker-based prognostic stratifi cation of young adult glioblastoma. Oncotarget 2016, 7, 5030–5041. [Google Scholar] [CrossRef] [Green Version]
- Wang, G.; Fu, X.L.; Wang, J.J.; Guan, R.; Tang, X.J. Novel Strategies to Discover Effective Drug Targets in Metabolic and Immune Therapy for Glioblastoma. Curr. Cancer Drug Targets 2017, 17, 17–39. [Google Scholar] [CrossRef]
- Louis, D.N.; Perry, A.; Wesseling, P.; Brat, D.J.; Cree, I.A.; Figarella-Branger, D.; Hawkins, C.; Ng, H.K.; Pfister, S.M.; Reifenberger, G.; et al. The 2021 WHO classification of tumors of the central nervous system: A summary. Neuro-Oncol. 2021, 23, 1231–1251. [Google Scholar] [CrossRef] [PubMed]
- Wirsching, H.G.; Galanis, E.; Weller, M. Glioblastoma. Handb. Clin. Neurol. 2016, 134, 381–397. [Google Scholar] [CrossRef] [PubMed]
- Hanahan, D.; Weinberg, R.A. Hallmarks of cancer: The next generation. Cell 2011, 144, 646–674. [Google Scholar] [CrossRef] [Green Version]
- Qi, Z.; Voit, E.O. Strategies for Comparing Metabolic Profiles: Implications for the Inference of Biochemical Mechanisms from Metabolomics Data. IEEE/ACM Trans. Comput. Biol. Bioinform. 2017, 14, 1434–1445. [Google Scholar] [CrossRef] [Green Version]
- Xu, X.; Wang, L.; Zang, Q.; Li, S.; Li, L.; Wang, Z.; He, J.; Qiang, B.; Han, W.; Zhang, R.; et al. Rewiring of purine metabolism in response to acidosis stress in glioma stem cells. Cell. Death Dis. 2021, 12, 1–12. [Google Scholar] [CrossRef]
- Schroeder, A.; Pointer, K.; Clark, P.; Datta, R.; Kuo, J.; Eliceiri, K. Metabolic mapping of glioblastoma stem cells reveals NADH fluxes associated with glioblastoma phenotype and survival. J. Biomed. Opt. 2020, 25, e036502. [Google Scholar] [CrossRef]
- Björkblom, B.; Wibom, C.; Eriksson, M.; Bergenheim, A.T.; Sjöberg, R.L.; Jonsson, P.; Brännström, T.; Antti, H.; Sandström, M.; Melin, B. Distinct metabolic hallmarks of WHO classified adult glioma subtypes. Neuro-Oncol. 2022, 24, 1454–1468. [Google Scholar] [CrossRef]
- Hakimi, A.A.; Reznik, E.; Lee, C.H.; Creighton, C.J.; Brannon, A.R.; Luna, A. An Integrated Metabolic Atlas of Clear Cell Renal Cell Carcinoma. Cancer Cell 2016, 29, 104–116. [Google Scholar] [CrossRef] [PubMed] [Green Version]
- Li, G.H.; Han, F.F.; Xiao, F.H.; Gu, K.S.Y.; Shen, Q.; Xu, W.; Li, W.X.; Wang, Y.L.; Liang, B.; Huang, J.F.; et al. System-level metabolic modeling facilitates unveiling metabolic signature in exceptional longevity. Aging Cell 2022, 21, e13595. [Google Scholar] [CrossRef] [PubMed]
- Brunk, E.; Sahoo, S.; Zielinski, D.C.; Altunkaya, A.; Dräger, A.; Mih, N.; Gatto, F.; Nilsson, A.; Preciat Gonzalez, G.A.; Aurich, M.K.; et al. Recon3D enables a three-dimensional view of gene variation in human metabolism. Nat. Biotechnol. 2018, 36, 272–281. [Google Scholar] [CrossRef] [PubMed]
- Kim, M.S.; Pinto, S.M.; Getnet, D.; Nirujogi, R.S.; Manda, S.S.; Chaerkady, R.; Madugundu, A.K.; Kelkar, D.S.; Isserlin, R.; Jain, S.; et al. A draft map of the human proteome. Nature 2014, 509, 575–581. [Google Scholar] [CrossRef] [PubMed] [Green Version]
- Heirendt, L.; Arreckx, S.; Pfau, T.; Mendoza, S.N.; Richelle, A.; Heinken, A.; Haraldsdóttir, H.S.; Wachowiak, J.; Keating, S.M.; Vlasov, V.; et al. Creation and analysis of biochemical constraint-based models using the COBRA Toolbox v.3.0. Nat. Protoc. 2019, 14, 639–702. [Google Scholar] [CrossRef] [PubMed] [Green Version]
- Newman, A.C.; Maddocks, O.D.K. One-carbon metabolism in cancer. Br. J. Cancer 2017, 116, 1499–1504. [Google Scholar] [CrossRef] [Green Version]
- Wong, T.L.; Che, N.; Ma, S. Reprogramming of central carbon metabolism in cancer stem cells. Biochim. Biophys. Acta Mol. Basis Dis. 2017, 1863, 1728–1738. [Google Scholar] [CrossRef] [PubMed]
- Zadra, G.; Batista, J.L.; Loda, M. Dissecting the dual role of AMPK in cancer: From experimental to human studiescancer. Mol. Cancer Res. 2015, 13, 1059–1072. [Google Scholar] [CrossRef] [Green Version]
- Cardon, T.; Franck, J.; Coyaud, E.; Laurent, E.M.; Damato, M.; Maffia, M.; Vergara, D.; Fournier, I.; Salzet, M. Alternative proteins are functional regulators in cell reprogramming by PKA activation. Nucleic Acids Res. 2020, 48, 7864–7882. [Google Scholar] [CrossRef]
- Duhamel, M.; Drelich, L.; Wisztorski, M.; Aboulouard, S.; Gimeno, J.P.; Ogrinc, N.; Devos, P.; Cardon, T.; Weller, M.; Escande, F.; et al. Spatial analysis of the glioblastoma proteome reveals specific molecular signatures and markers of survival. Nat. Commun. 2022, 13, 6665. [Google Scholar] [CrossRef]
- O’Brien, E.J.; Monk, J.M.; Palsson, B.O. Using Genome-scale Models to Predict Biological Capabilities. Cell 2015, 161, 971–987. [Google Scholar] [CrossRef] [PubMed] [Green Version]
- Yin, J.; Ren, W.K.; Huang, X.; Deng, J.; Li, T.; Yin, Y. Potential Mechanisms Connecting Purine Metabolism and Cancer Therapy. Front. Immunol. 2018, 9, 1697. [Google Scholar] [CrossRef] [PubMed] [Green Version]
- Moffatt, B.A.; Ashihara, H. Purine and pyrimidine nucleotide synthesis and metabolism. Arab. Book 2002, 1, e0018. [Google Scholar] [CrossRef] [Green Version]
- Merighi, S.; Mirandola, P.; Varani, K.; Gessi, S.; Leung, E.; Baraldi, P.G.; Tabrizi, M.A.; Borea, P.A. A glance at adenosine receptors: Novel target for antitumor therapy. Pharmacol. Ther. 2003, 100, 31–48. [Google Scholar] [CrossRef]
- Wang, L.-B.; Karpova, A.; Gritsenko, M.A.; Kyle, J.E.; Cao, S.; Li, Y.; Rykunov, D.; Colaprico, A.; Rothstein, J.H.; Hong, R.; et al. Proteogenomic and metabolomic characterization of human glioblastoma. Cancer Cell 2021, 39, 509–528. [Google Scholar] [CrossRef]
- Burrell, H.E.; Wlodarski, B.; Foster, B.J.; Buckley, K.A.; Sharpe, G.R.; Quayle, J.M.; Simpson, A.W.M.; Gallagher, J.A. Human Keratinocytes Release ATP and Utilize Three Mechanisms for Nucleotide Interconversion at the Cell Surface. J. Biol. Chem. 2005, 280, 29667–29676. [Google Scholar] [CrossRef] [PubMed] [Green Version]
- Deli, T.; Csernoch, L. Extracellular ATP and Cancer—An Overview with Special Reference to P2 Purinergic Receptors. Pathol. Oncol. Res. 2008, 14, 219–231. [Google Scholar] [CrossRef]
- Abraham, E.H.; Salikhova, A.Y.; Rapaport, E. ATP in the treatment of advanced cancer. Curr. Top. Membr. 2003, 54, 415–452. [Google Scholar]
- Baba, T.; Fukui, M.; Sakata, S.; Tashima, T.; Takeshita, I.; Nakamura, T.; Inoue, T. Selective enhancement of intratumoural blood flow in malignant gliomas: Experimental study in rats by intracarotid administration of adenosine or adenosine triphosphate. Acta Neurochir. 1989, 101, 66–74. [Google Scholar] [CrossRef]
- Chhipa, R.R.; Fan, Q.; Anderson, J.; Muraleedharan, R.; Huang, Y.; Ciraolo, G.; Chen, X.; Waclaw, R.; Chow, L.M.; Khuchua, Z.; et al. AMP kinase promotes glioblastoma bioenergetics and tumour growth. Nat. Cell Biol. 2018, 20, 823–835. [Google Scholar] [CrossRef]


Disclaimer/Publisher’s Note: The statements, opinions and data contained in all publications are solely those of the individual author(s) and contributor(s) and not of MDPI and/or the editor(s). MDPI and/or the editor(s) disclaim responsibility for any injury to people or property resulting from any ideas, methods, instructions or products referred to in the content. |
© 2023 by the authors. Licensee MDPI, Basel, Switzerland. This article is an open access article distributed under the terms and conditions of the Creative Commons Attribution (CC BY) license (https://creativecommons.org/licenses/by/4.0/).
Share and Cite
Shen, Q.; Yang, H.; Kong, Q.-P.; Li, G.-H.; Li, L. Metabolic Modeling Identifies a Novel Molecular Type of Glioblastoma Associated with Good Prognosis. Metabolites 2023, 13, 172. https://doi.org/10.3390/metabo13020172
Shen Q, Yang H, Kong Q-P, Li G-H, Li L. Metabolic Modeling Identifies a Novel Molecular Type of Glioblastoma Associated with Good Prognosis. Metabolites. 2023; 13(2):172. https://doi.org/10.3390/metabo13020172
Chicago/Turabian StyleShen, Qiu, Hua Yang, Qing-Peng Kong, Gong-Hua Li, and Li Li. 2023. "Metabolic Modeling Identifies a Novel Molecular Type of Glioblastoma Associated with Good Prognosis" Metabolites 13, no. 2: 172. https://doi.org/10.3390/metabo13020172