
Updates and Original Case Studies Focused on the NMR-Linked Metabolomics Analysis of Human Oral Fluids Part III: Implementations for the Diagnosis of Non-Cancerous Disorders, Both Oral and Systemic

Abstract
:1. Introduction
2. Scientific and Clinical Benefits Offered by Salivary Metabolomics Investigations
2.1. Further Recent Developments on the Advantages, Collection, Laboratory Processing, Storage, Spectral/Data Acquisition, Data Analysis and ‘Policing’ of Salivary Metabolomics Investigations Using 1H NMR Analysis and Other Techniques
2.1.1. Updated Treatise on Saliva Sample Collection, Laboratory Processing and Storage
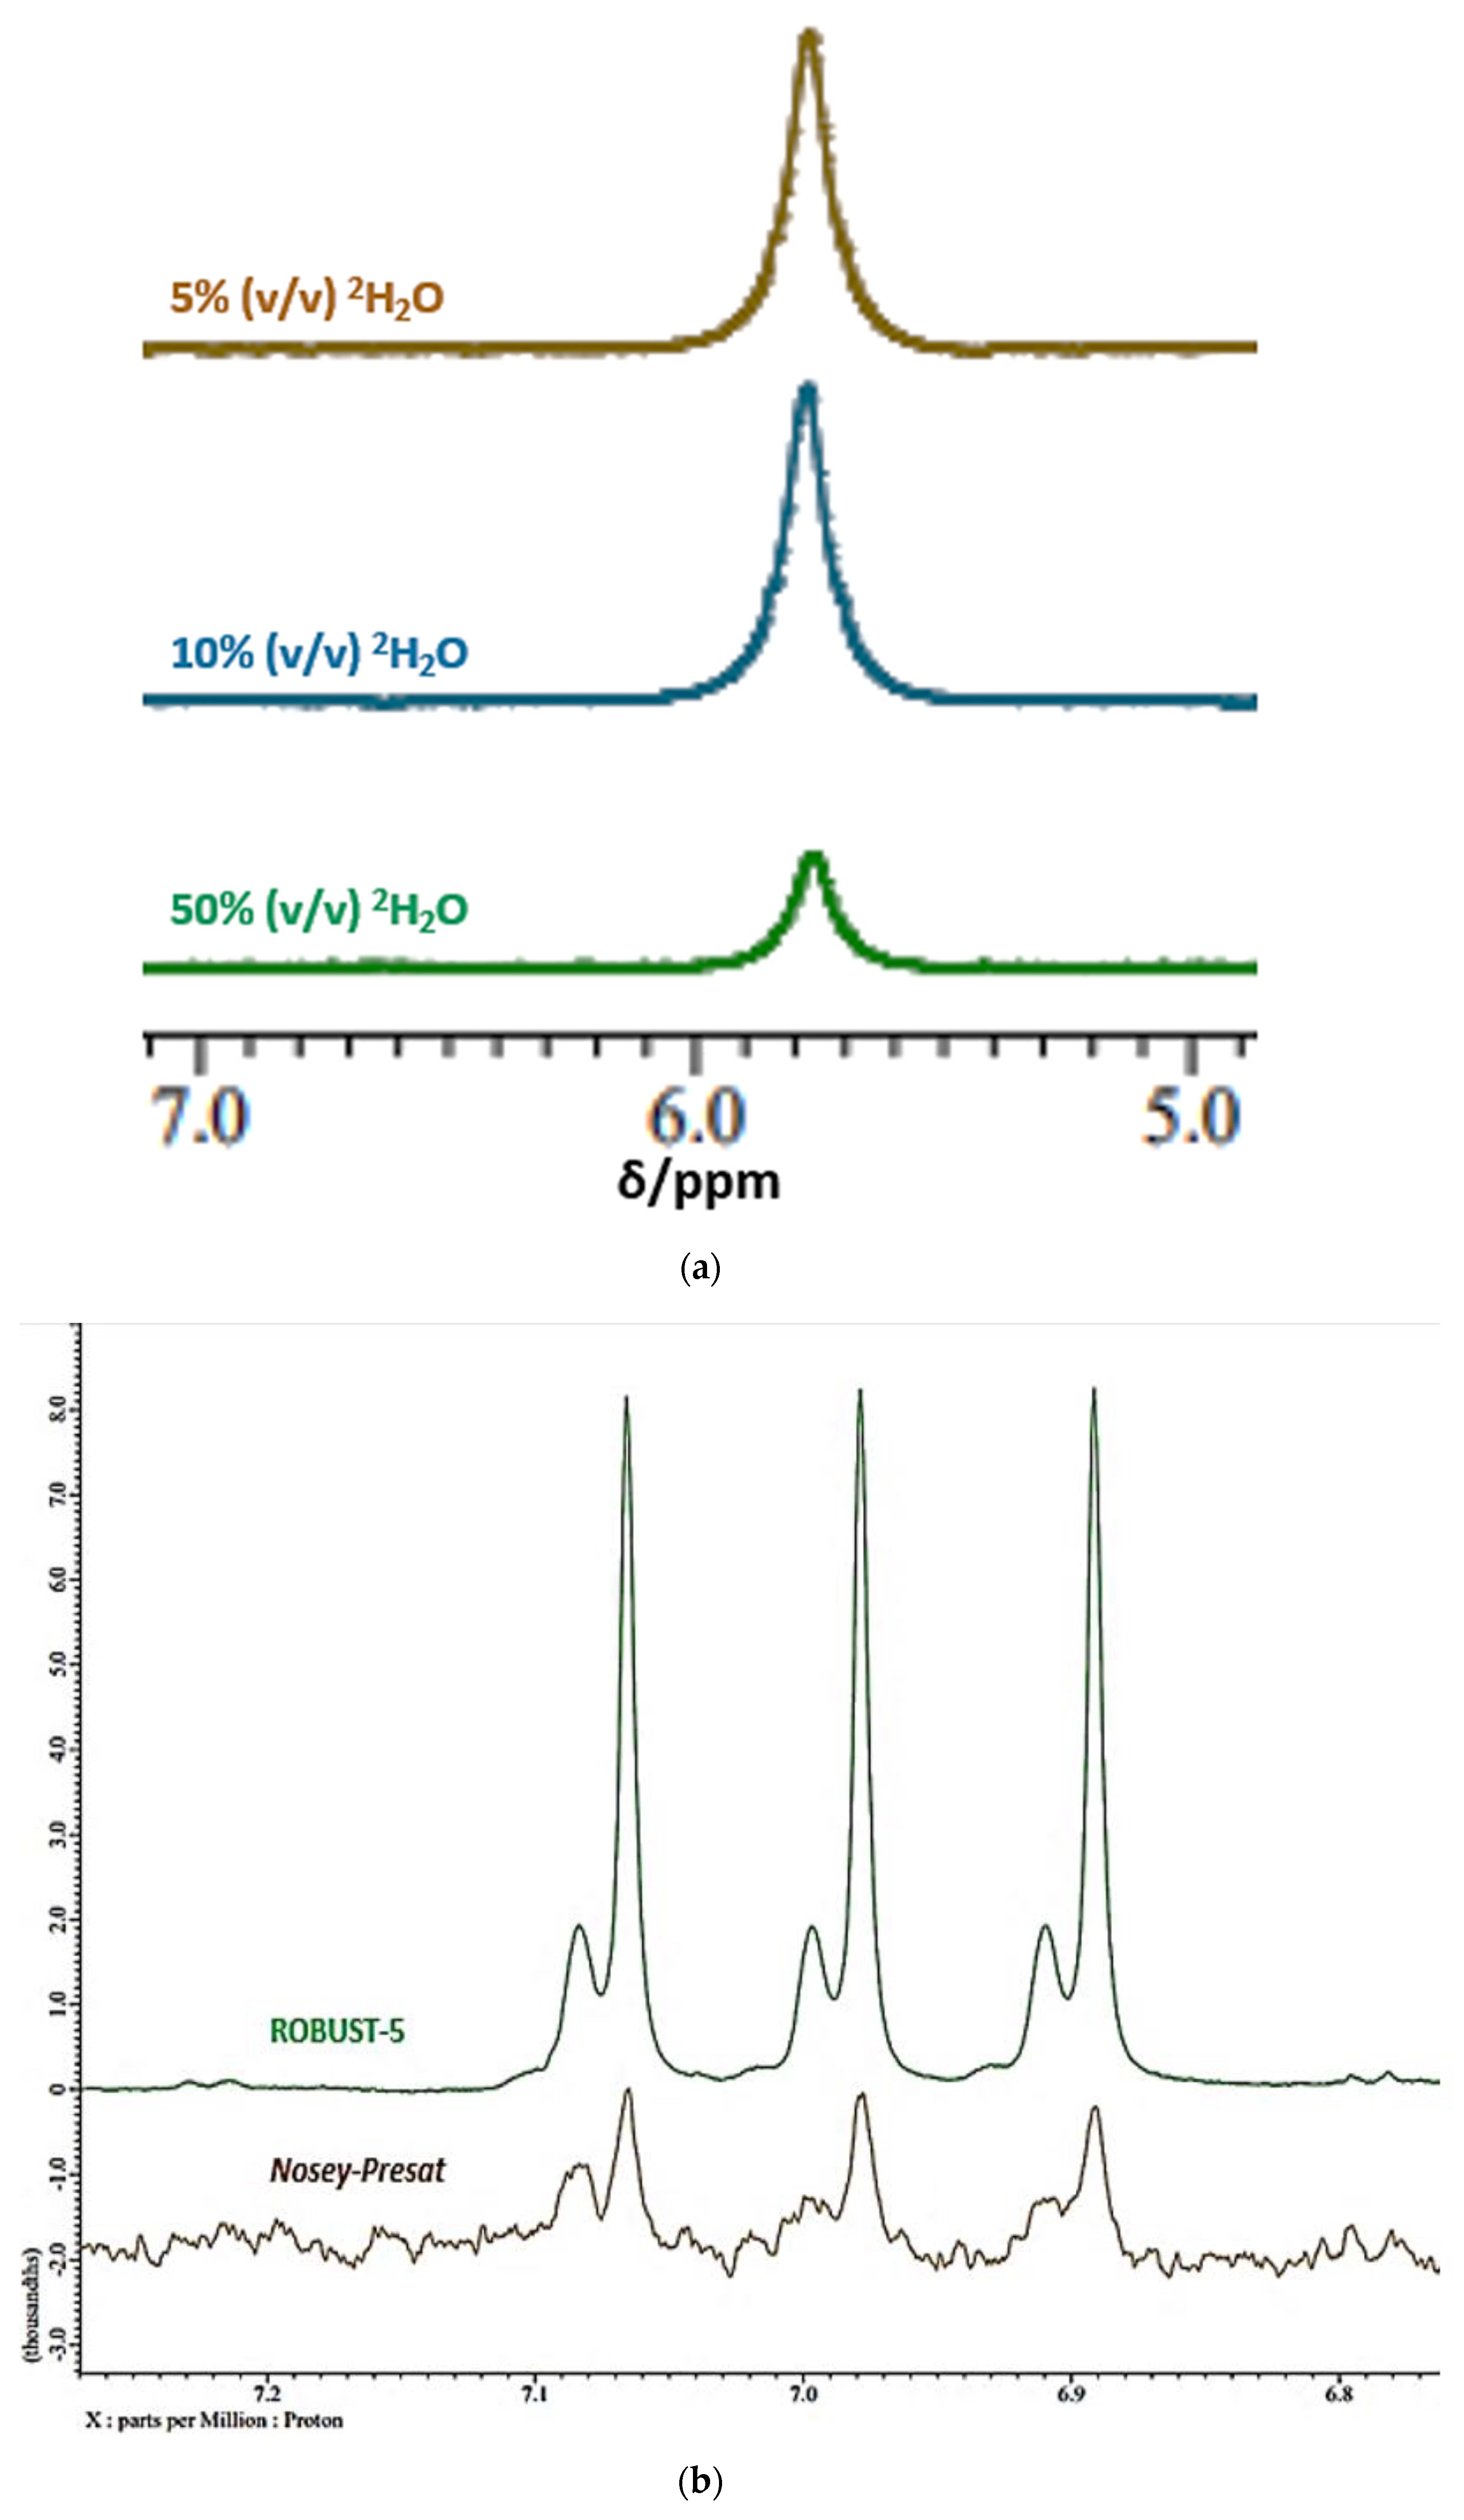
2.1.2. Complications Arising from the 1H NMR Analysis of Metabolites with Exchangeable 1H Nuclei
2.2. Mouth-Rinsed Water Washouts as an Alternative Diagnostic Medium to WMSS Samples
2.3. Influence of Prior Oral Cavity Cleansing Episodes on the Metabolic Profile of Human Saliva
2.4. Comparisons between the Metabolic Profiles of Whole, Parotid and Submandibular/Sublingual Saliva Specimens
3. Diagnosis and Monitoring of Human Oral Diseases Using Metabolomics Approaches, NMR-Based or Otherwise
3.1. Periodontal Diseases (Types 1–4)
3.1.1. Gingivitis (Type 1)
3.1.2. Early (Type 2) Periodontitis
3.1.3. Moderate (Type 3) Periodontitis
3.1.4. Advanced (Type 4) Periodontitis
3.1.5. Salivary Metabolomics Investigations of PDs
3.2. Dental Caries
3.2.1. Analysis of Primary Root Carious Lesion Biopsies
3.2.2. Analysis of Human Saliva for the Diagnosis and Prognostic Monitoring of Dental Caries
4. Extra-Oral (Systemic) Diseases
4.1. Bioanalytical Considerations for Extra-Oral Diseases
4.2. Types 1 and 2 Diabetes
4.3. Cardiovascular Diseases
4.4. Sjörgen’s Syndrome
4.5. Neurological Conditions
4.5.1. Parkinson’s Disease
4.5.2. Alzheimer’s Disease and Age-Related Dementia
4.6. Chronic Apical Abscess
4.7. Respiratory Diseases
4.8. Viral Infections
4.8.1. General Overview of the Influence of Viral Infections on Human Host Metabolism
4.8.2. Influenza
4.8.3. HIV Infection
4.8.4. SARS-CoV-2 Infection
4.8.5. Pharyngitis (Acute Sore Throat Conditions)
5. Original Case Study: Further Investigations of the NMR-Based Diagnosis and Pathogenesis of Acute Sore Throat Conditions in Humans
5.1. Introduction
5.2. Transport, Preparation and Storage of WMS Samples Prior to 1H NMR Analysis
5.3. Acquisition of 600 MHz 1H NMR Spectra of WMS Supernatant Samples
5.4. Preprocessing of Salivary 1H NMR Spectral Profiles, and Statistical Analyses of MV Datasets Arising Therefrom
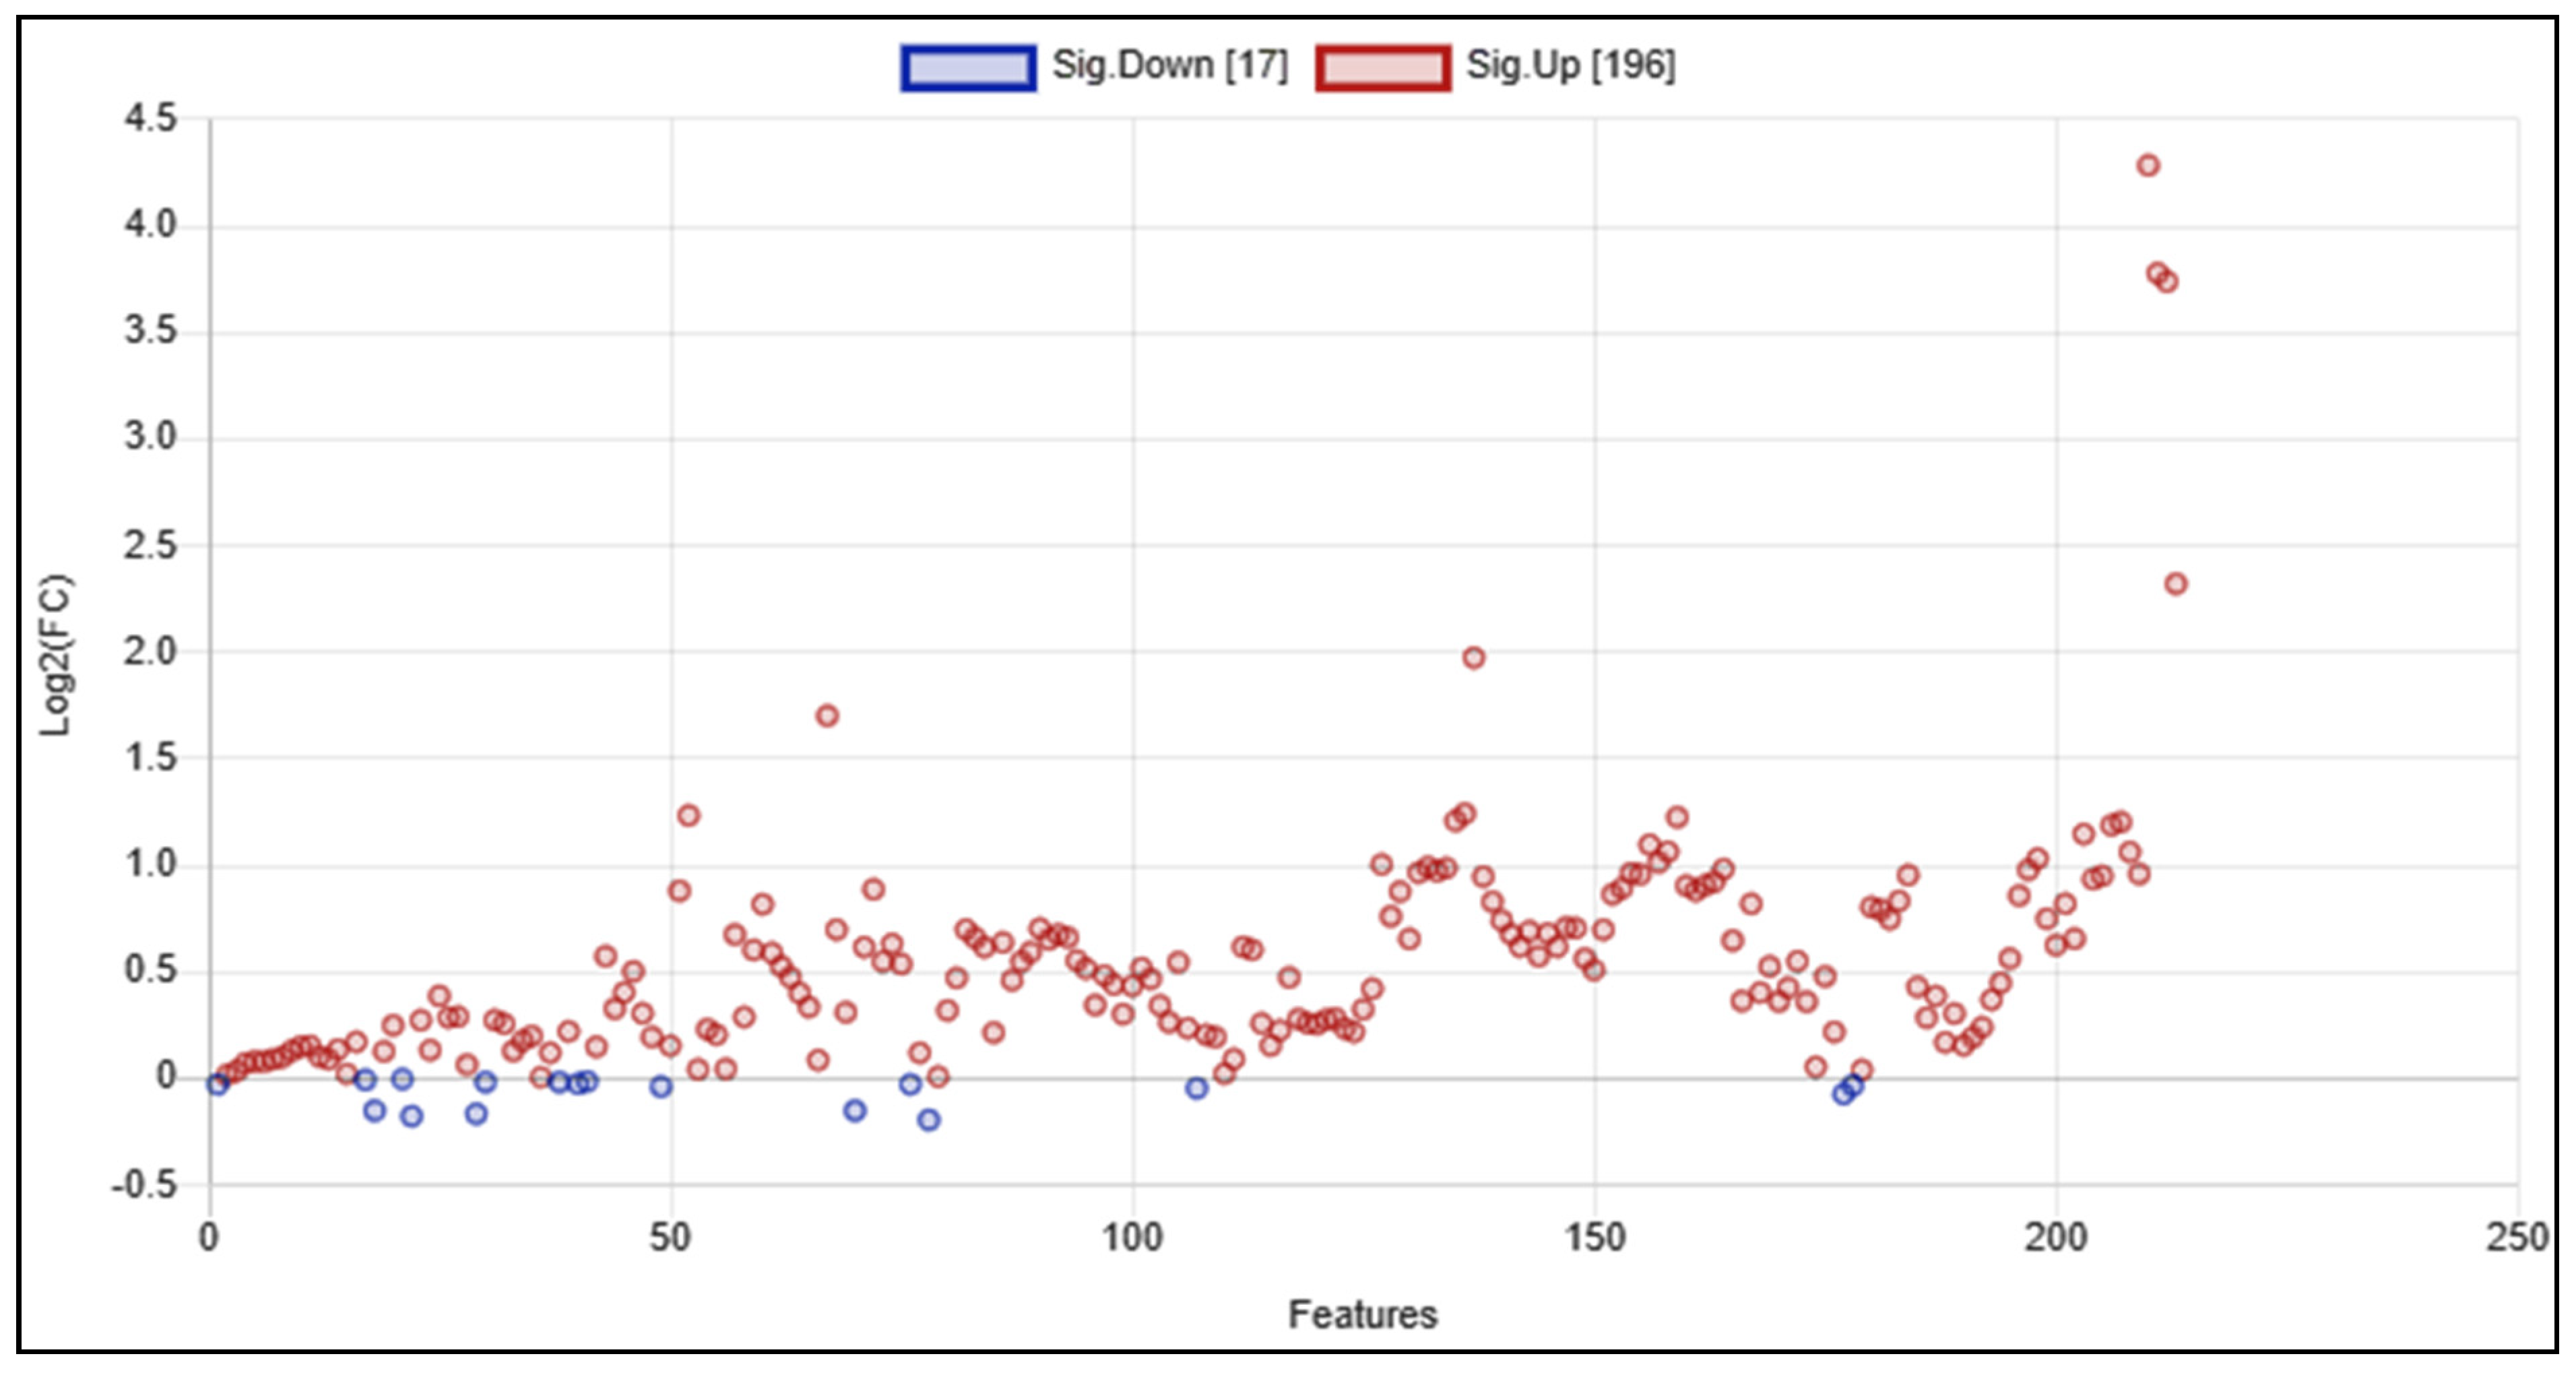
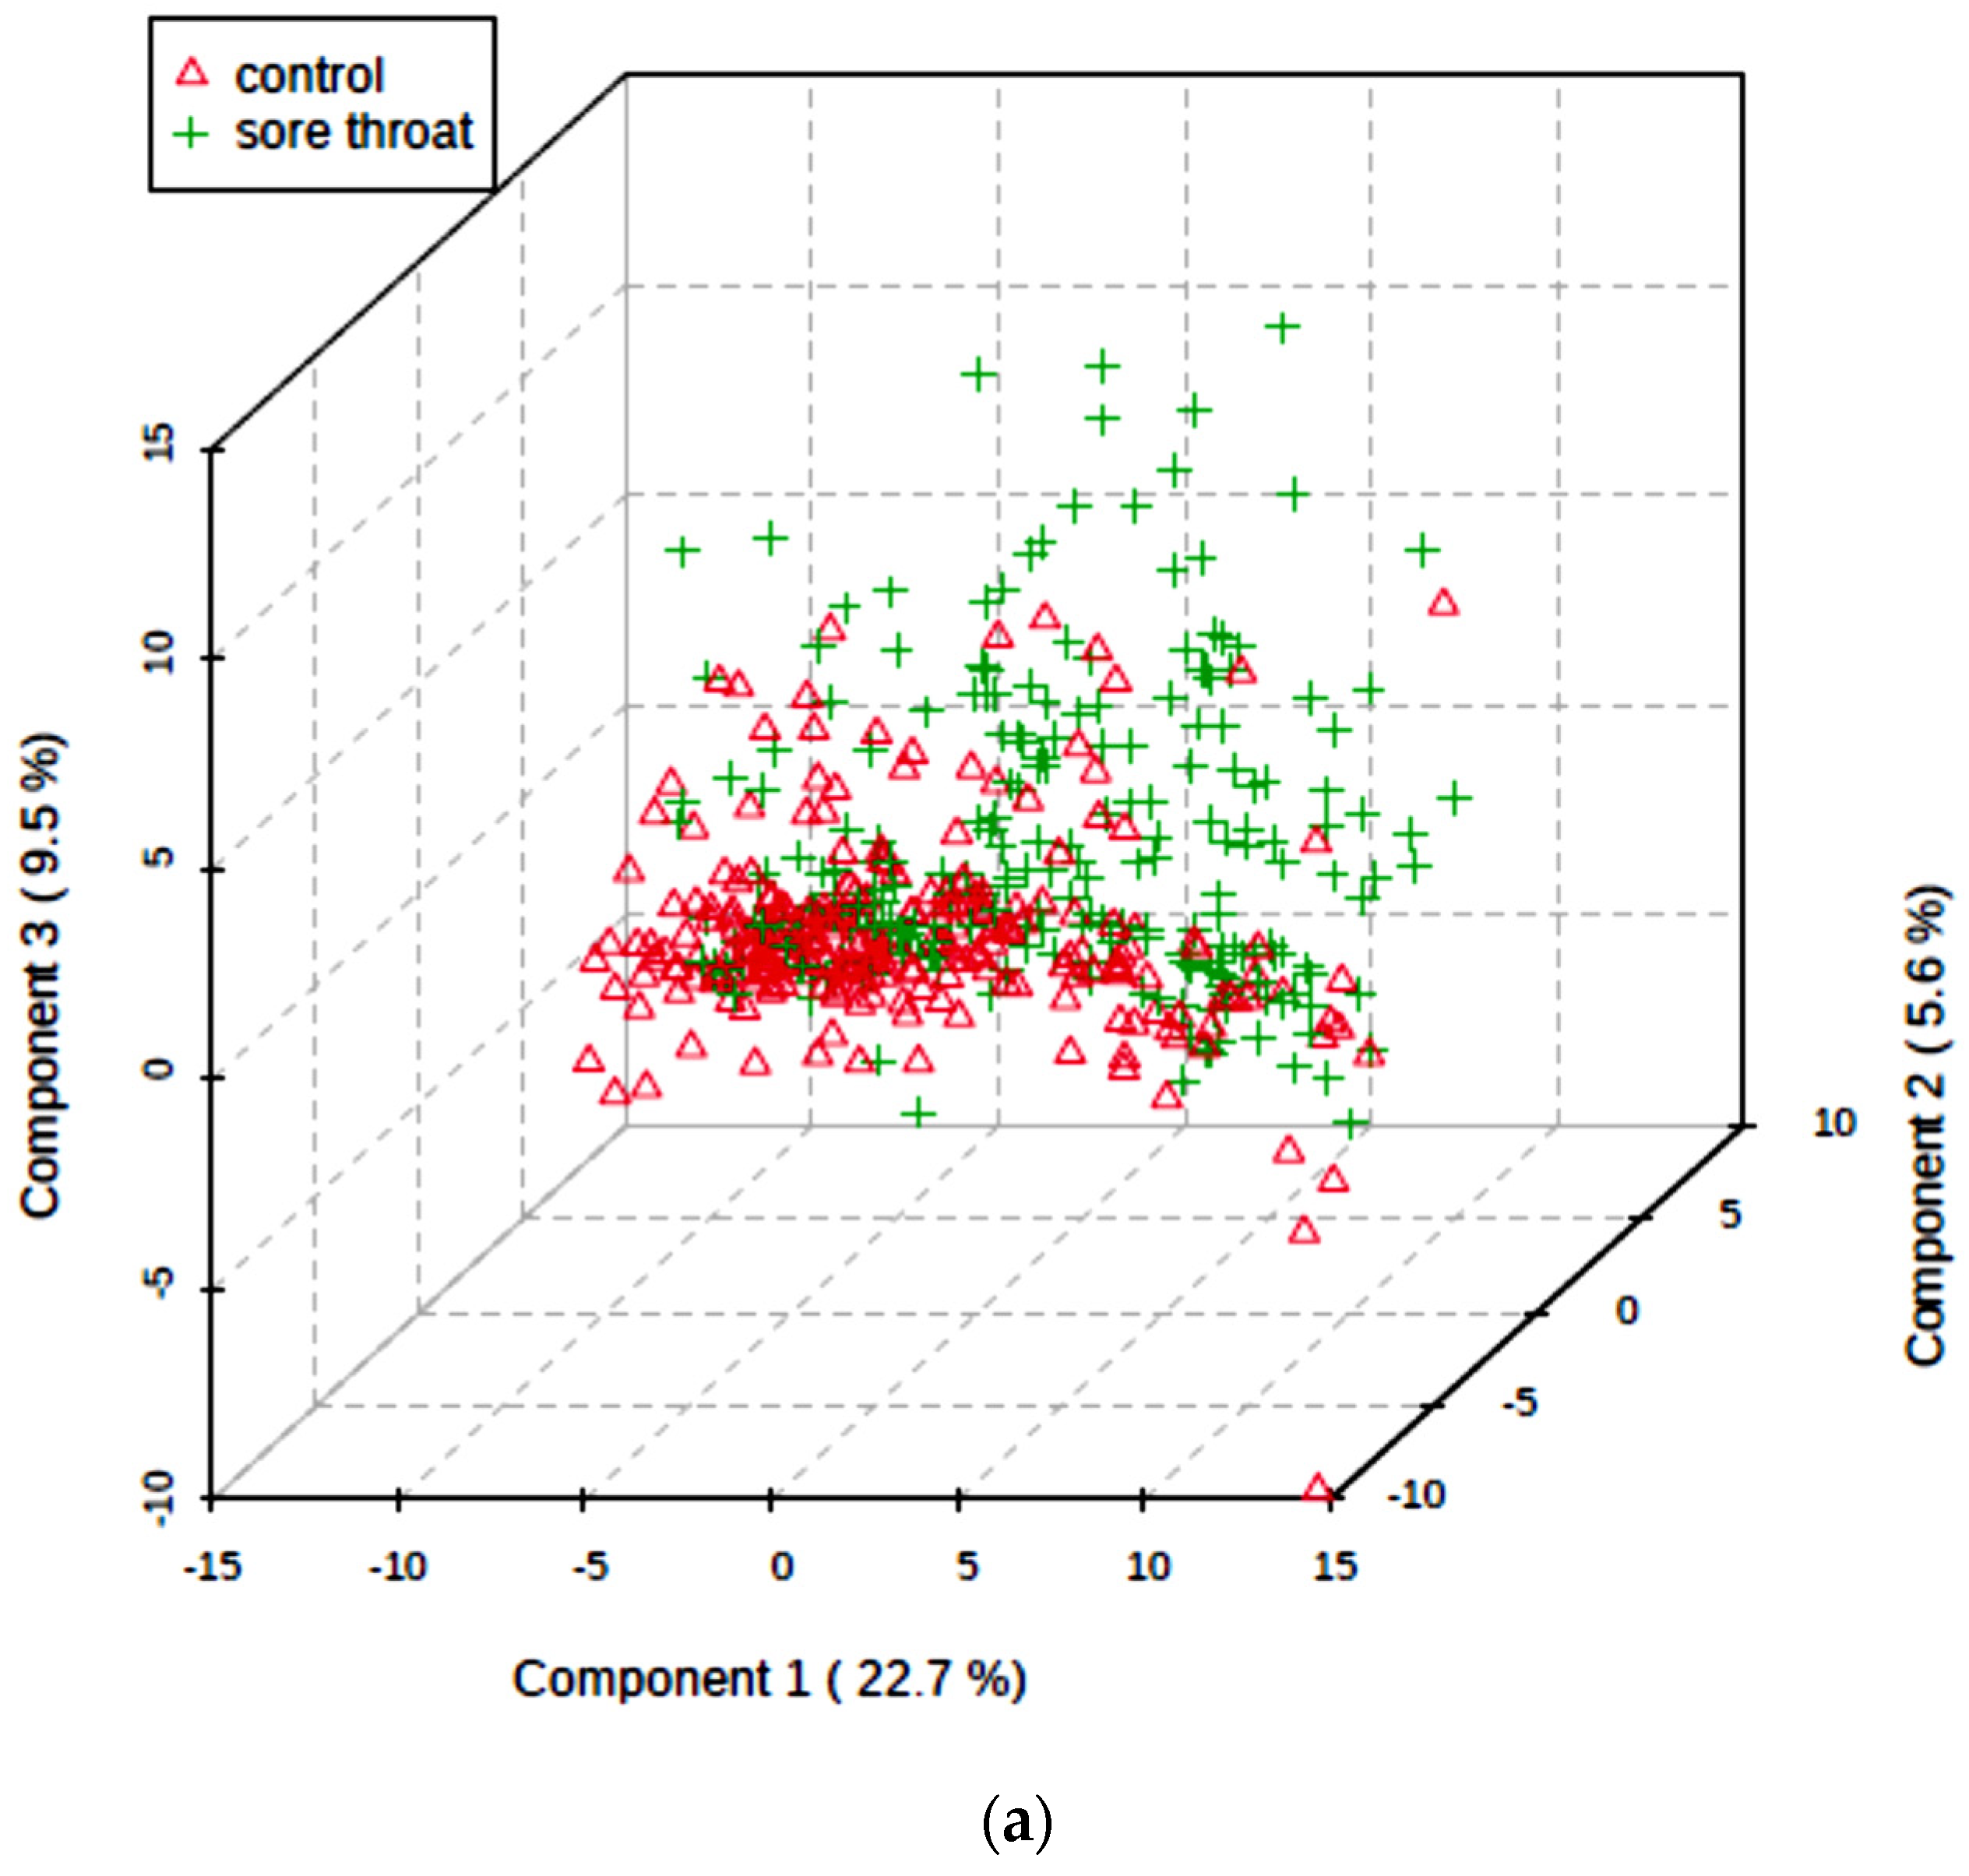
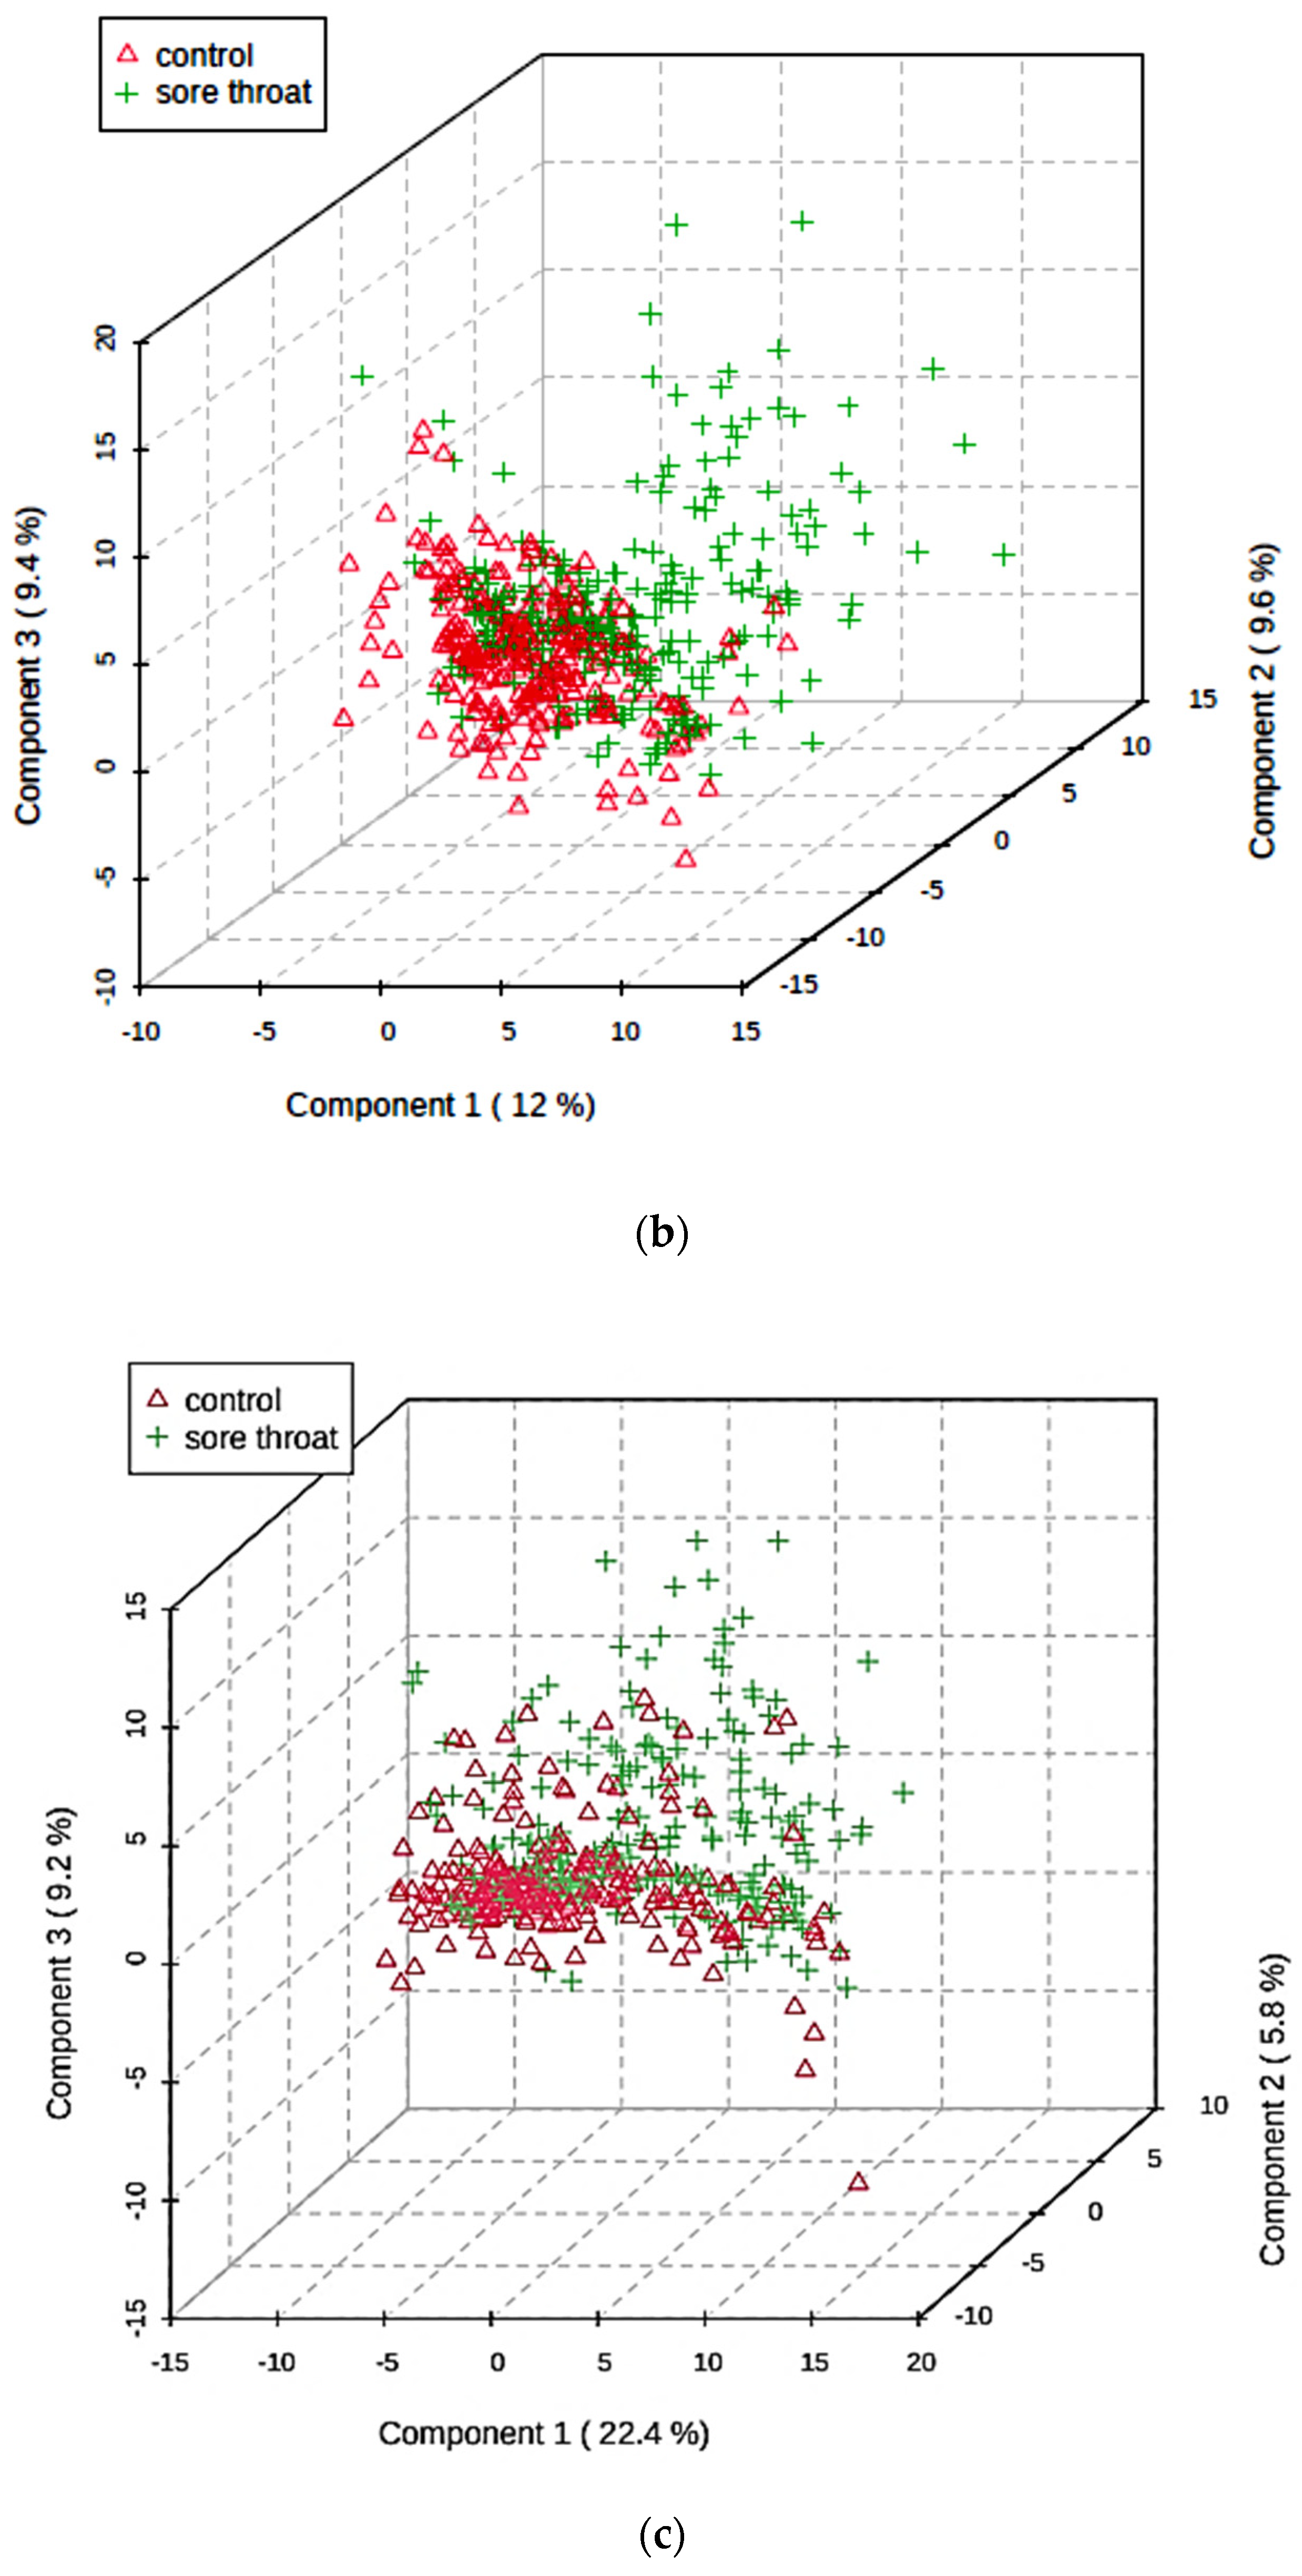
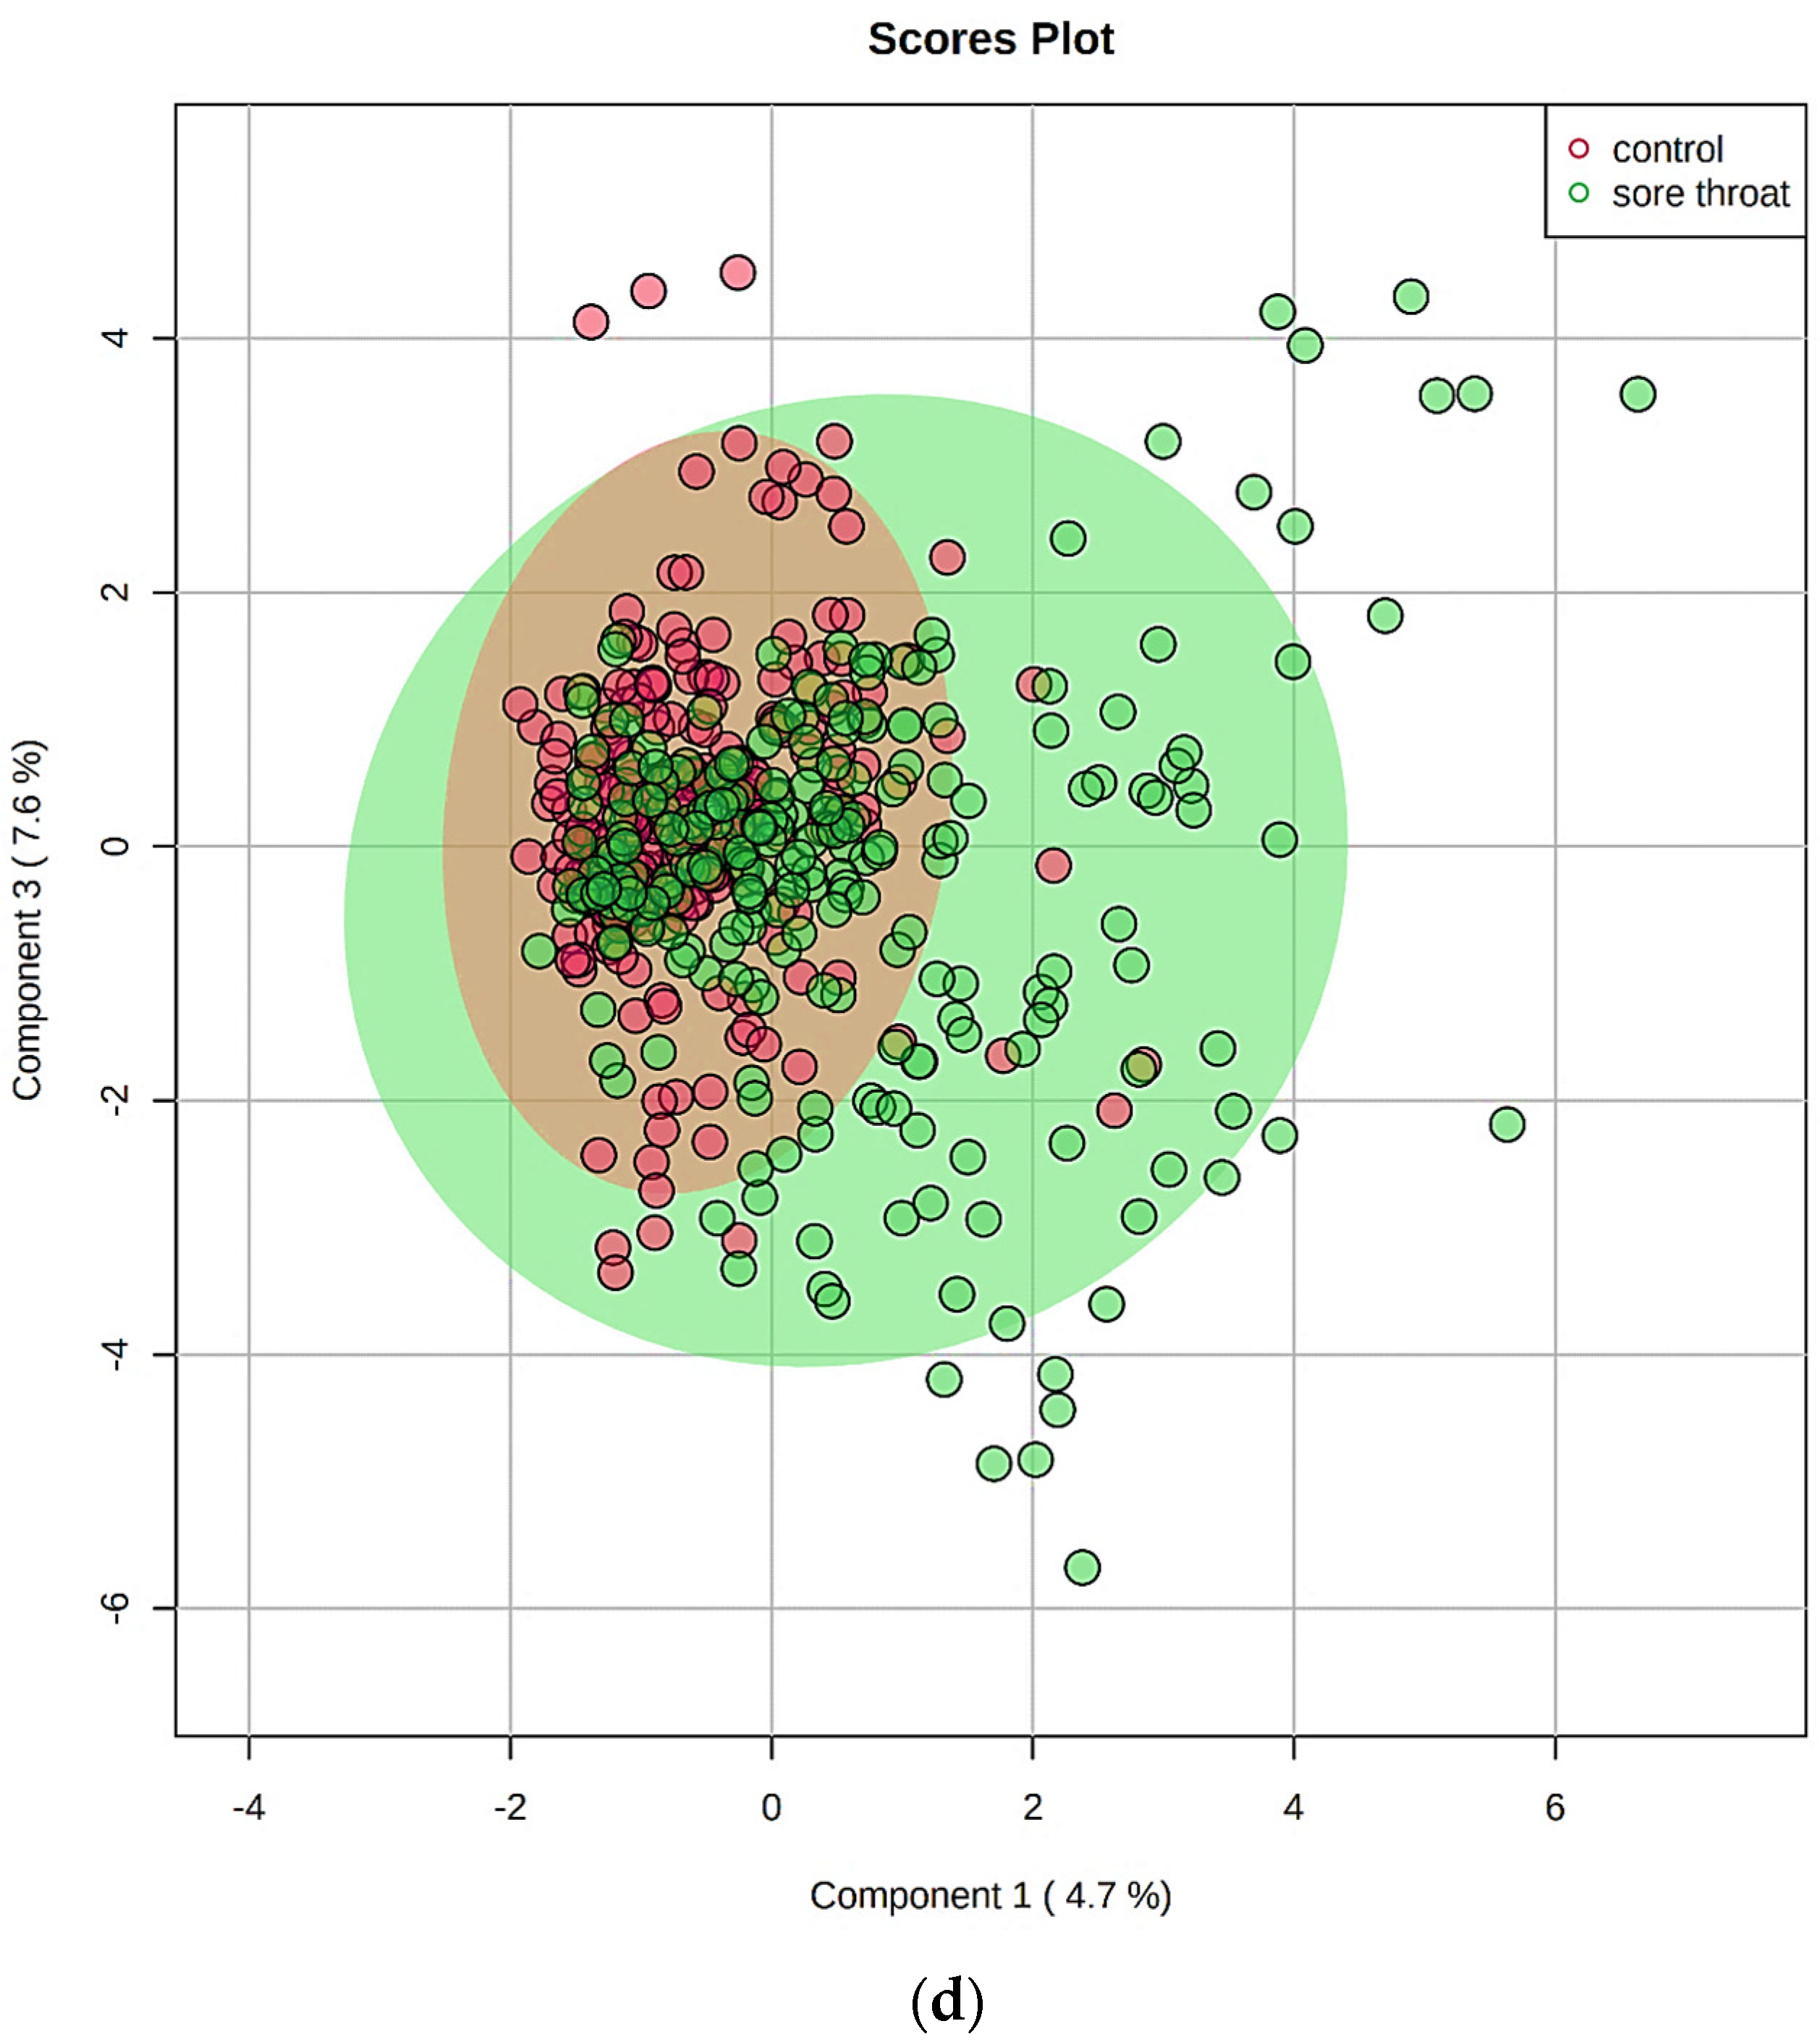
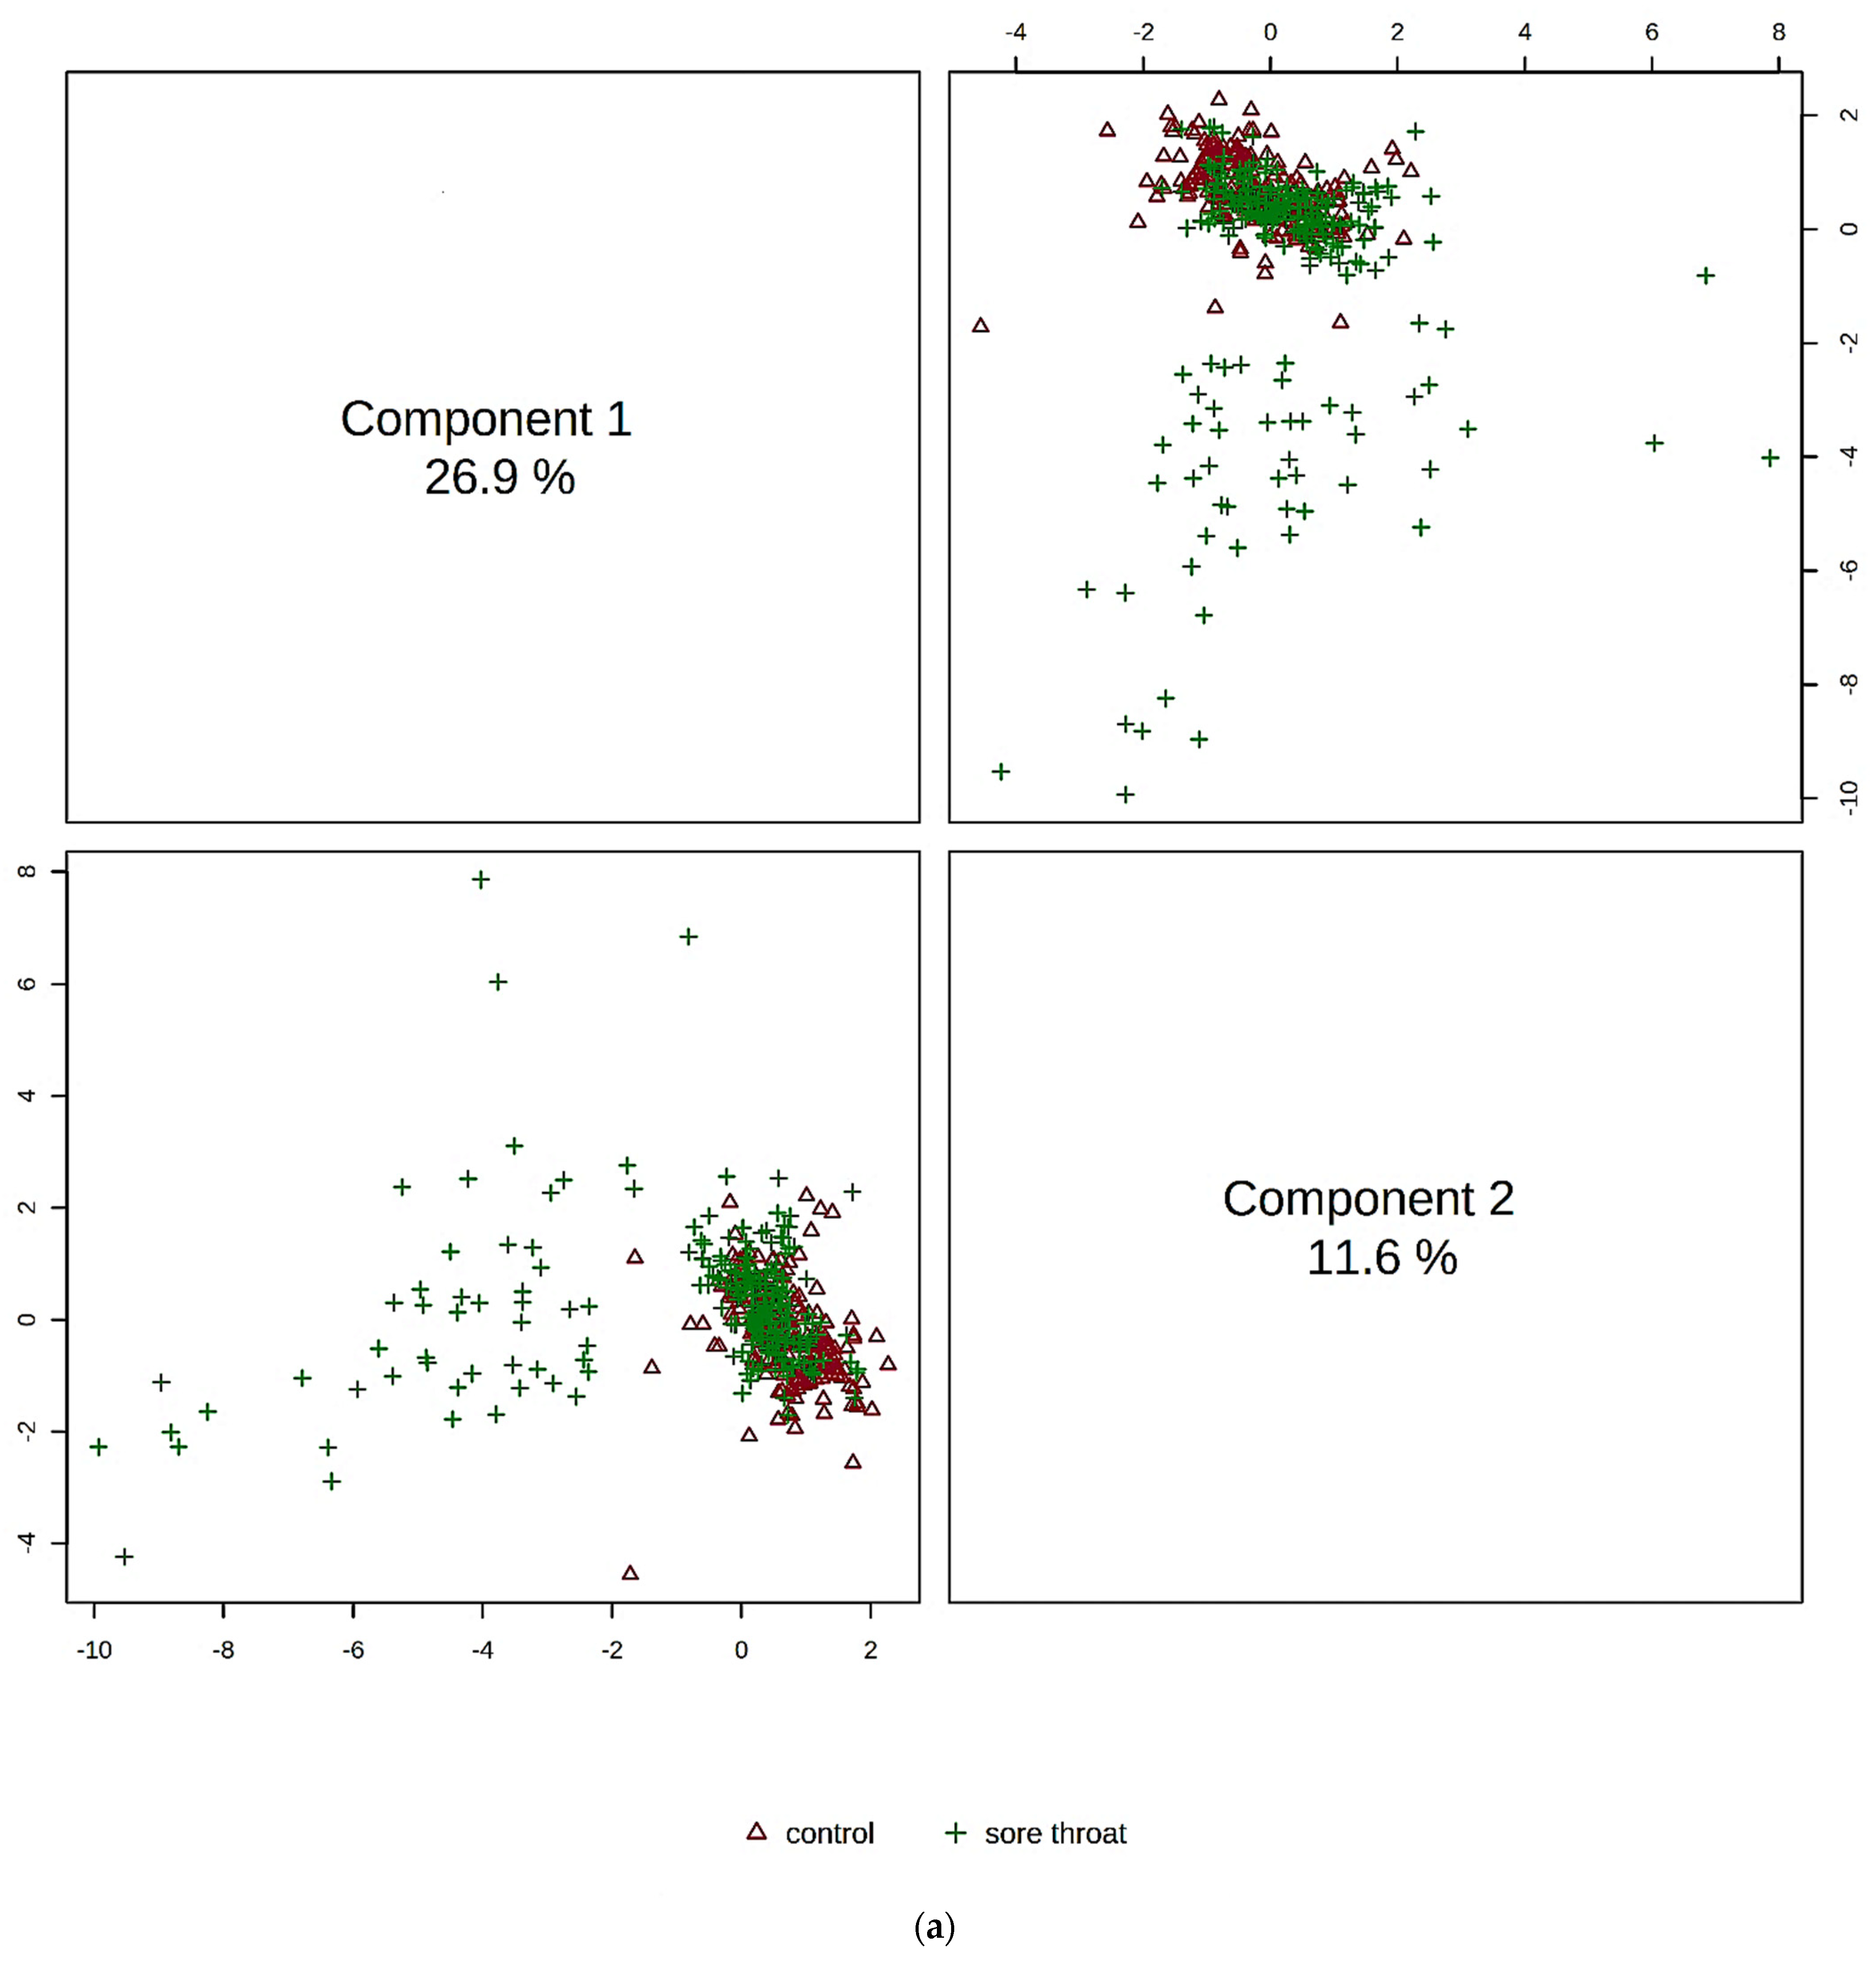
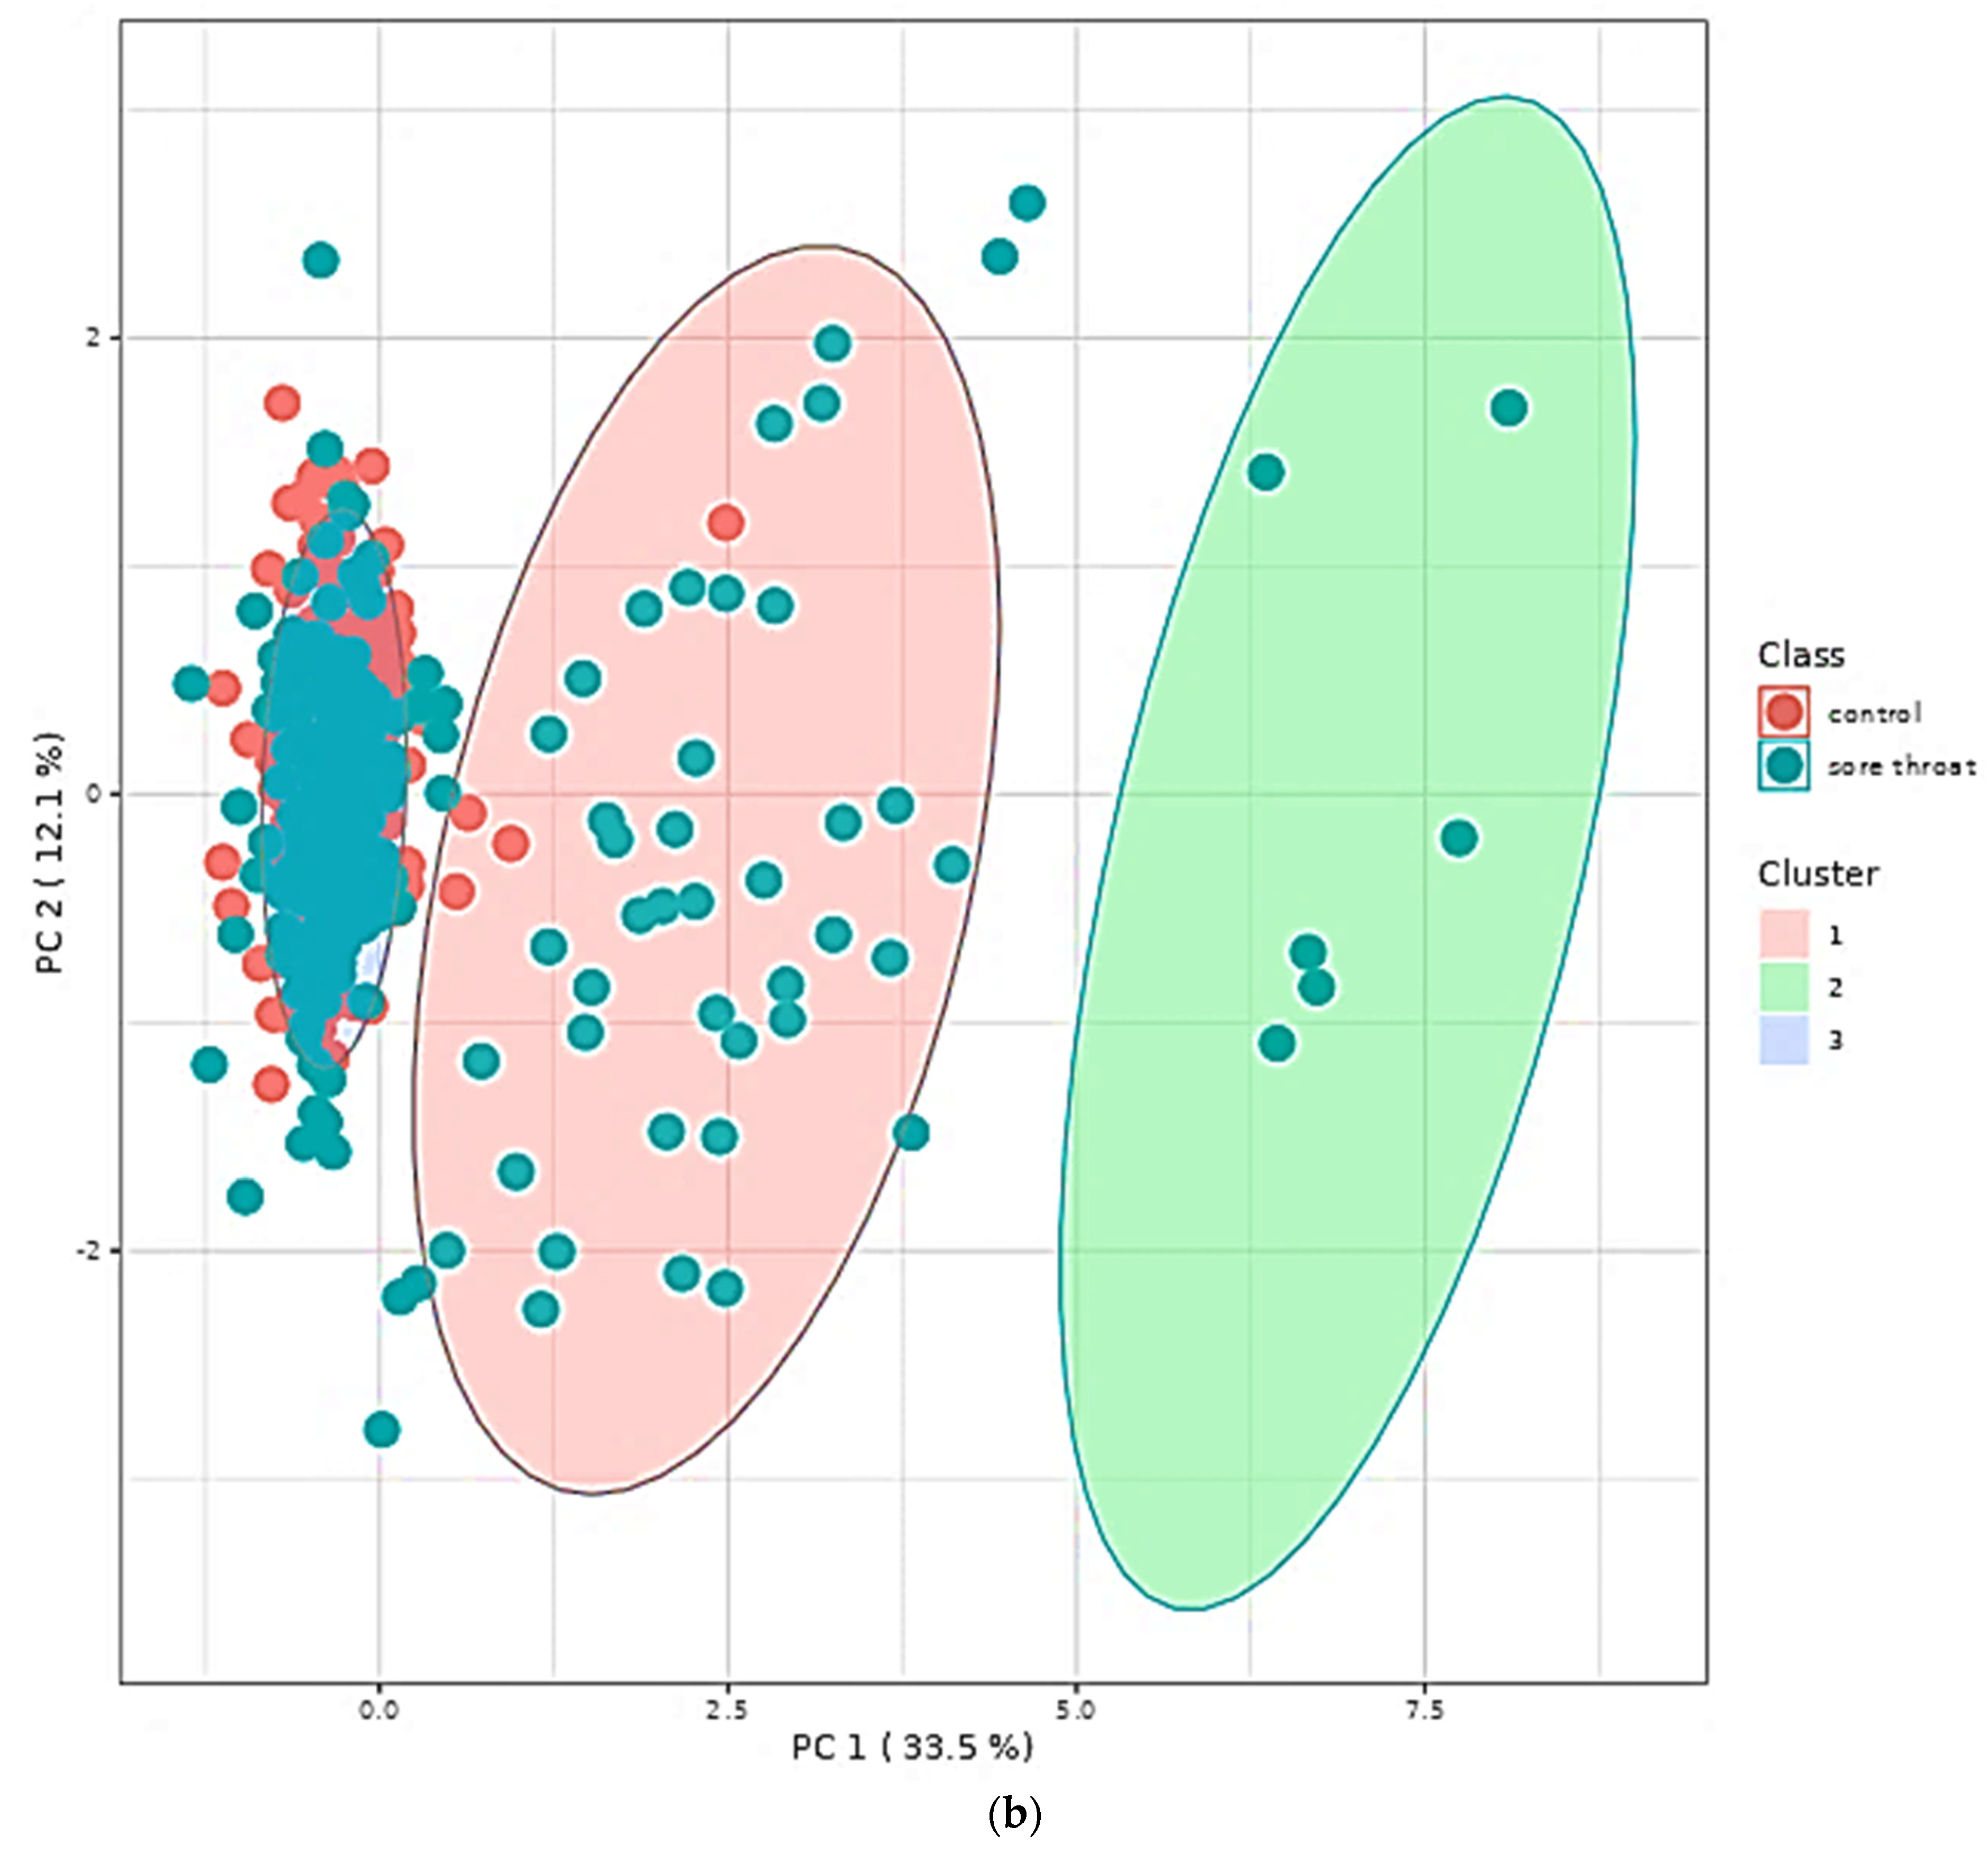
5.5. Multivariate Metabolomics Analysis of 1H NMR Datasets
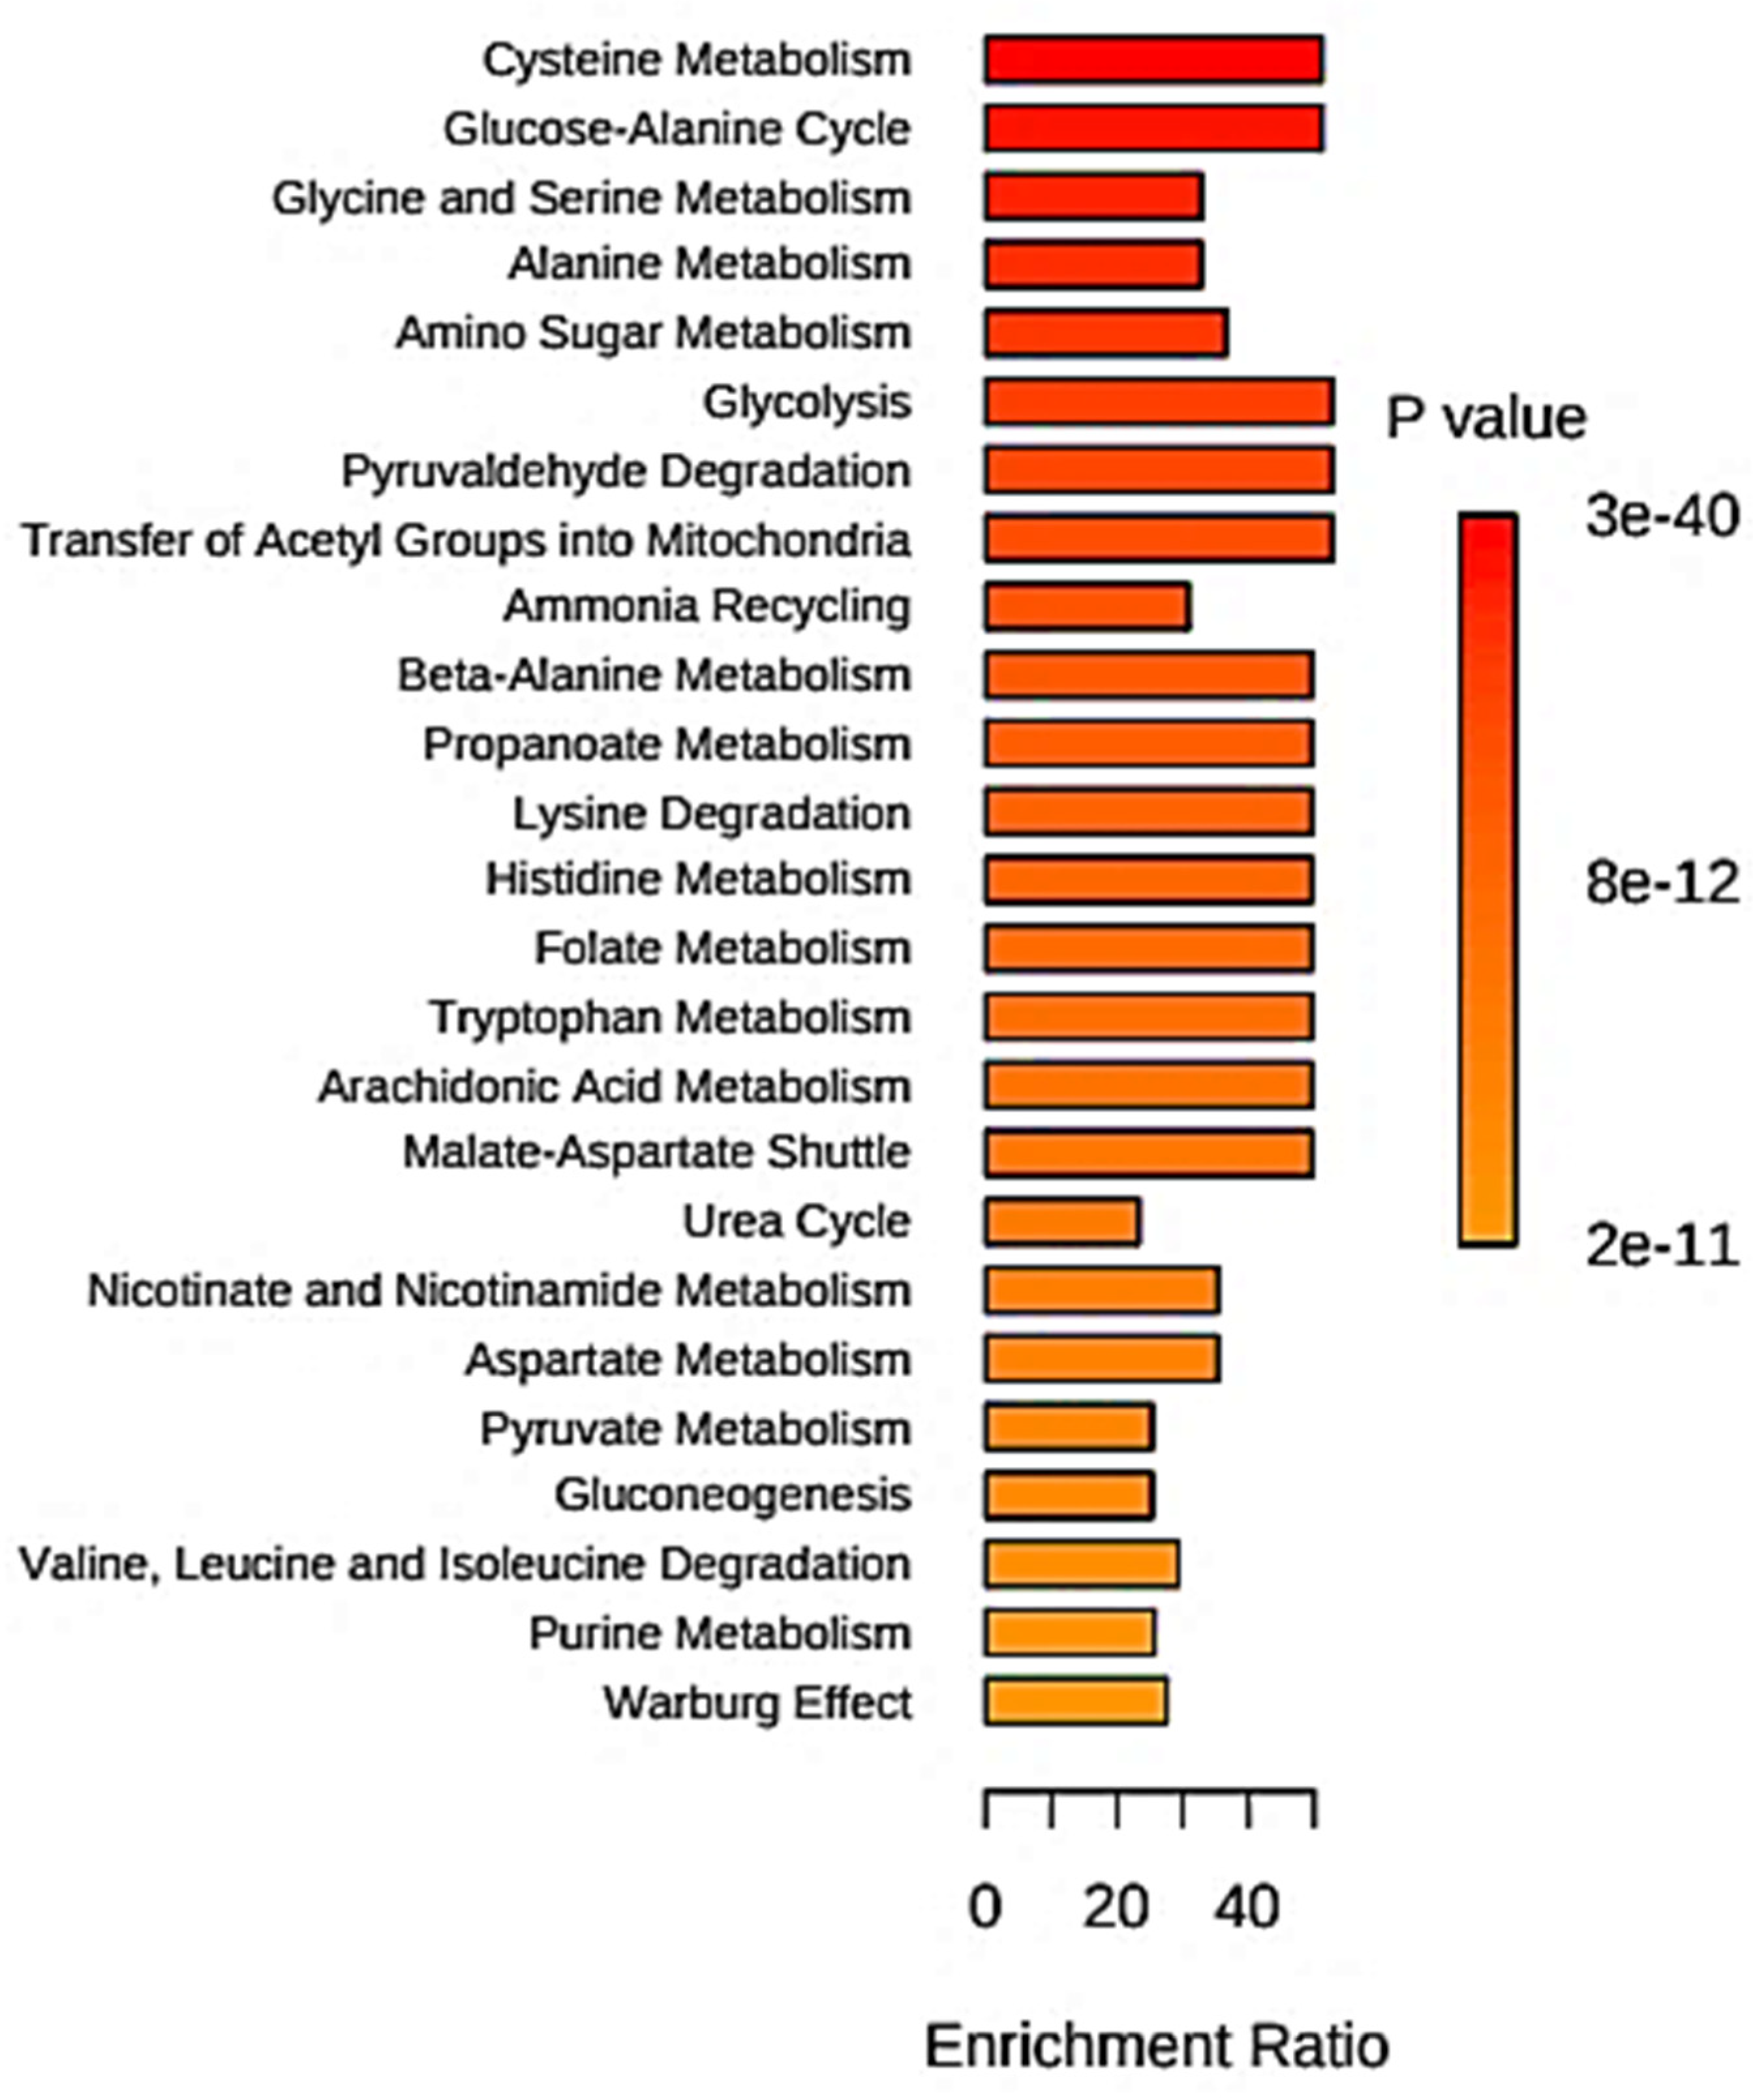
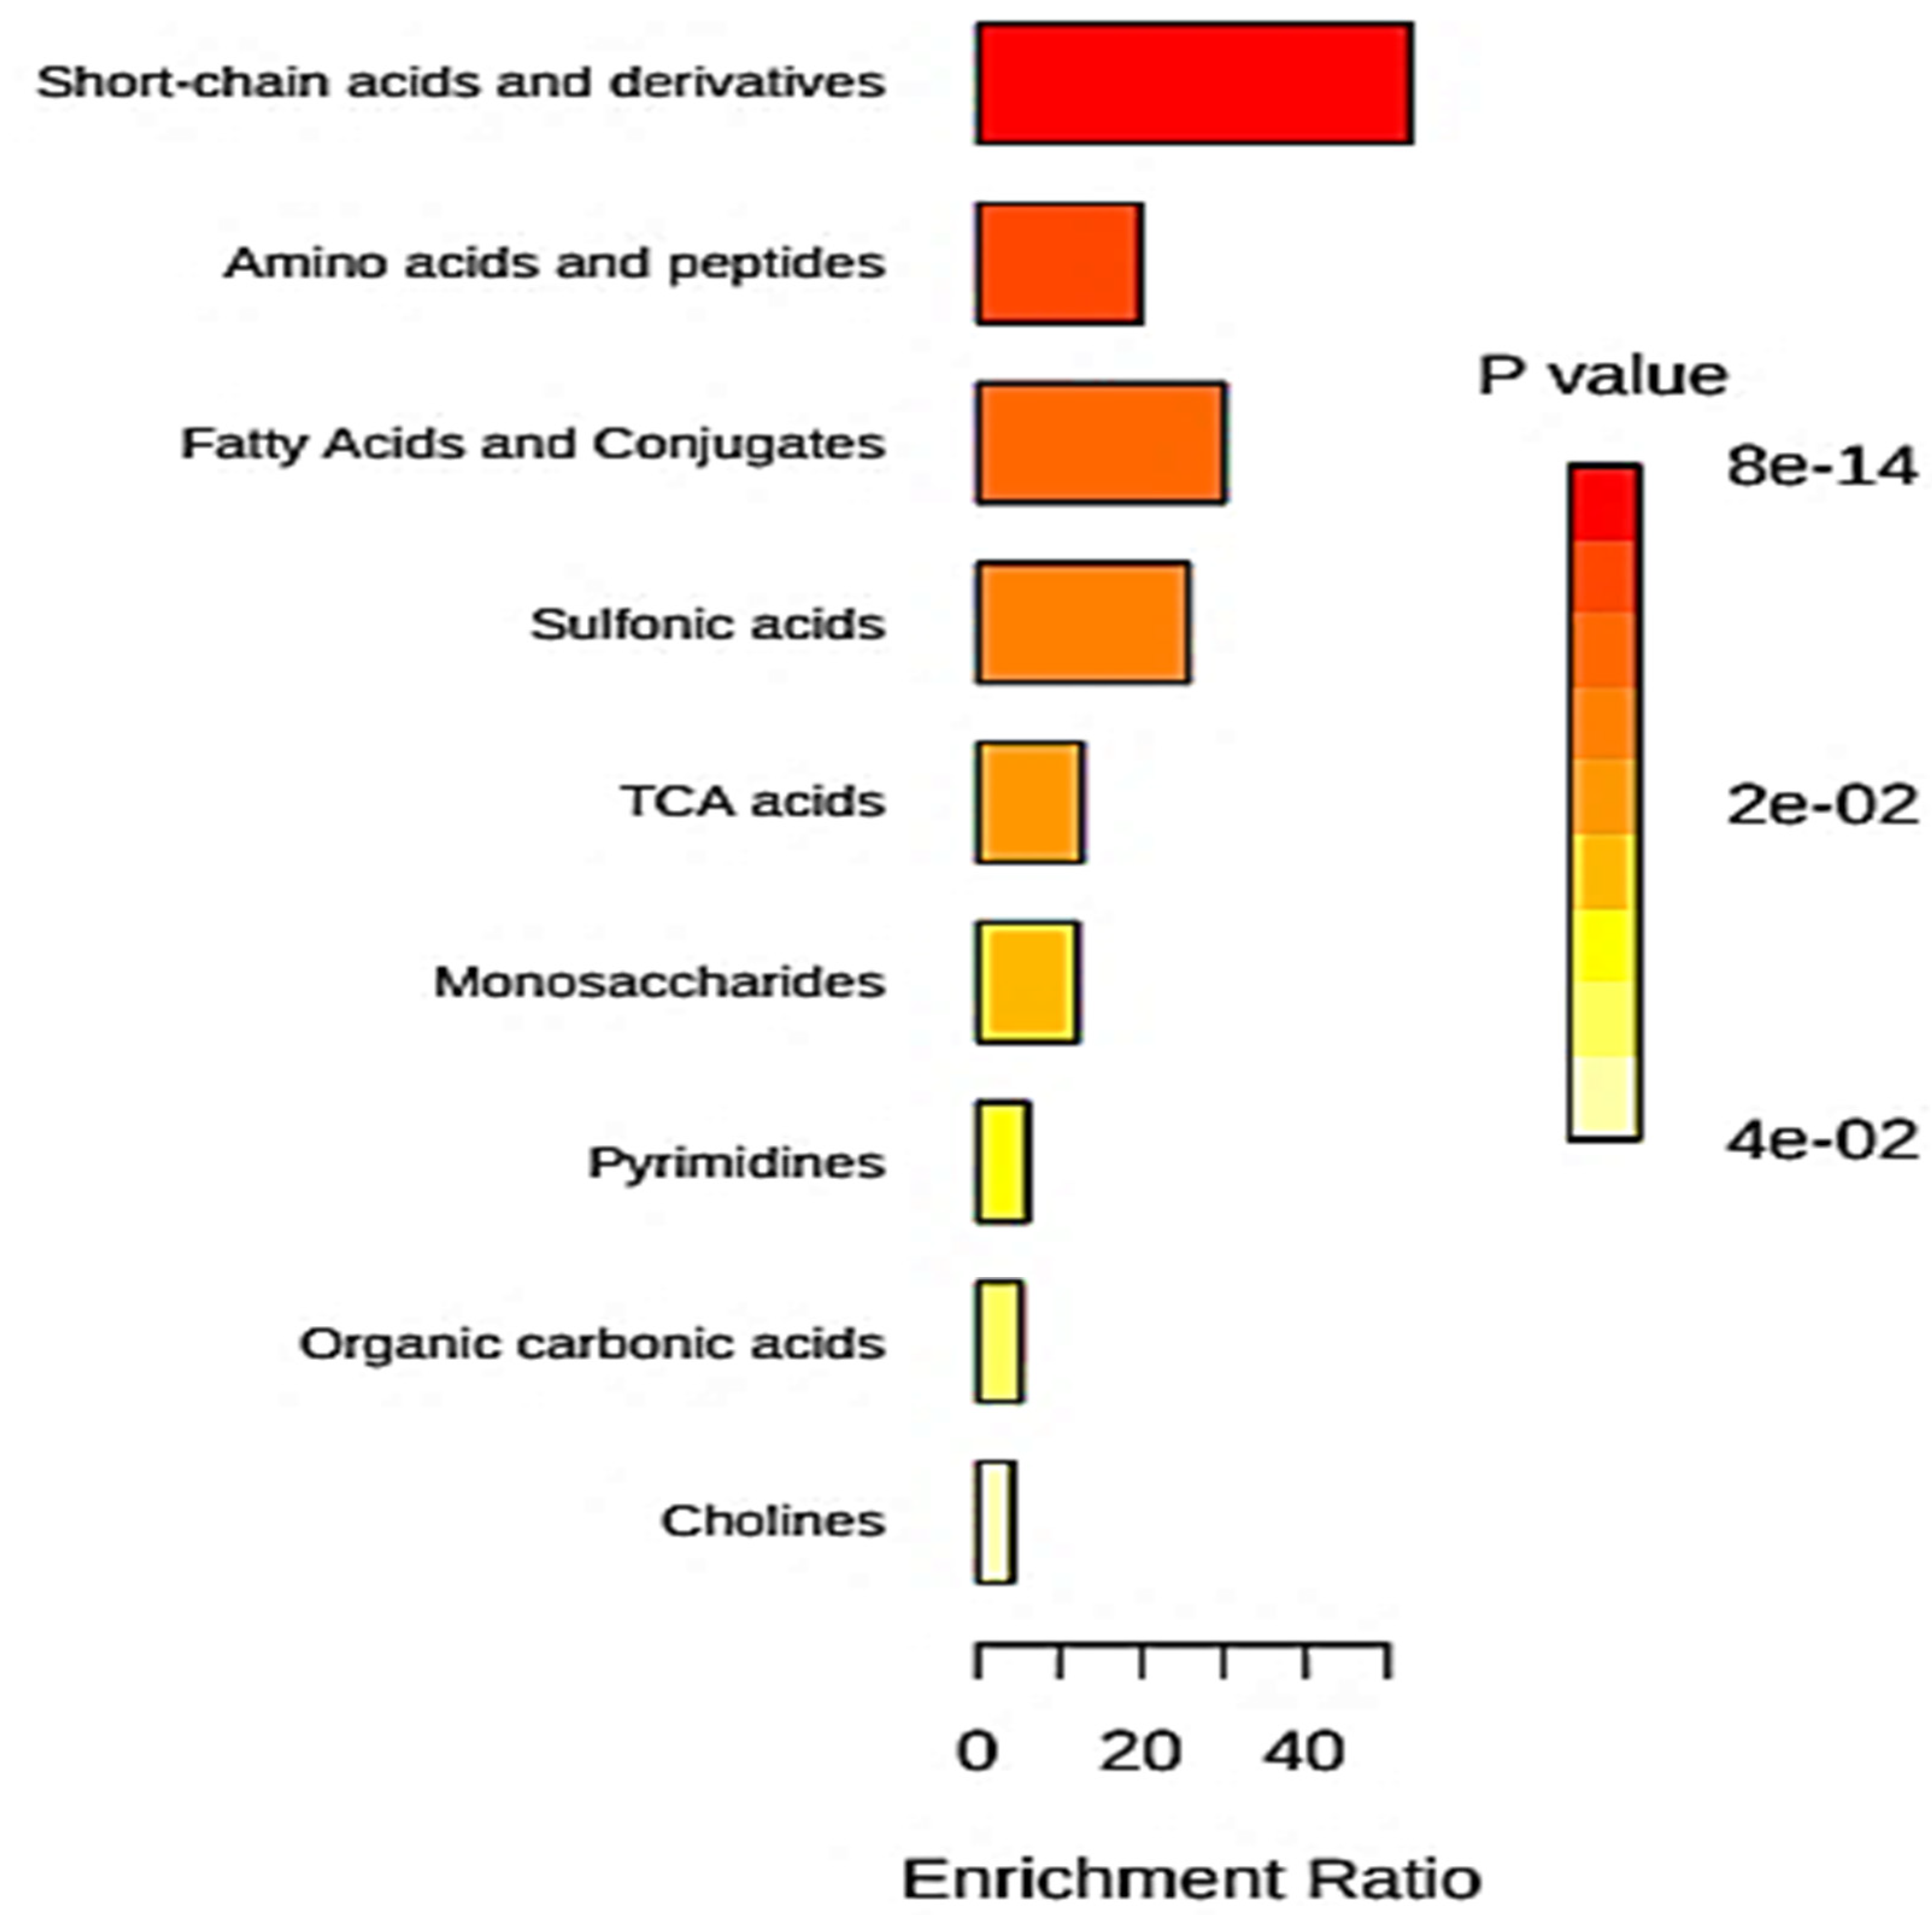
5.6. Quantitative Metabolite Enrichment and Pathway Topological Analyses
6. Diagnostic Metabolomics Analysis of Saliva Samples Collected from Animals in Veterinary Studies
7. Discussion Featuring (1) Considerations of Salivary Biomarker Validation; (2) Prospective Applications of Metabolomics Data to ‘Real-Life’ Clinical Diagnoses and Disease Severity Monitoring; and (3) Potential Global Applications of the Techniques Developed
7.1. Recommended Strategies for the Validation of Salivary Biomarkers Discovered in Metabolomics Studies
7.1.1. Bioanalytical and Statistical Validation of Biomarkers (Internal and External)
7.1.2. Clinical Validation of Biomarkers
7.2. Translation of Biomarkers Discovered by Metabolomics Techniques to ‘Real-Life’ Clinical Diagnoses and Monitoring of Human Diseases
7.3. Comparisons of the Salivary Microbiome and Metabolome to Those to Those of the Human Gut: Potential Global Applications of Developed Salivary Metabolomics Techniques
8. Concluding Remarks
Author Contributions
Funding
Institutional Review Board Statement
Informed Consent Statement
Data Availability Statement
Acknowledgments
Conflicts of Interest
References
- Grootveld, M.; Page, G.; Bhogadia, M.; Edgar, M. Updates and original case studies focused on the NMR-linked metabolomics analysis of human oral fluids Part I: Emerging platforms and perspectives. Appl. Sci. 2022, 12, 1235. [Google Scholar] [CrossRef]
- Grootveld, M.; Percival, B.C.; Page, G.; Hunwin, K.; Bhogadia, M.; Chan, W.; Edgar, M. Updates and original case studies focused on the NMR-linked metabolomics analysis of human oral fluids Part II: Applications to the diagnosis and prognostic monitoring of oral and systemic cancers. Metabolites 2022, 12, 778. [Google Scholar] [CrossRef] [PubMed]
- Miller, S. Saliva testing—A non-traditional diagnostic tool. Clin. Lab. Sci. 1994, 7, 39–44. [Google Scholar] [PubMed]
- Henson, B.; Wong, D. Collection, storage, and processing of saliva samples for downstream molecular applications. Methods Molec. Biol. 2010, 666, 21–30. [Google Scholar] [CrossRef]
- Martias, C.; Baroukh, N.; Mavel, S.; Blasco, H.; Lefèvre, A.; Roch, L.; Montigny, F.; Gatien, J.; Schibler, L.; Dufour-Rainfray, D.; et al. Optimization of sample preparation for metabolomics exploration of urine, feces, blood and saliva in humans using combined NMR and UHPLC-HRMS platforms. Molecules 2021, 26, 4111. [Google Scholar] [CrossRef] [PubMed]
- Boroumand, M.; Olianas, A.; Cabras, T.; Manconi, B.; Fanni, D.; Faa, G.; Desiderio, C.; Messana, I.; Castagnola, M. Saliva, a bodily fluid with recognized and potential diagnostic applications. J. Sep. Sci. 2021, 44, 3677–3690. [Google Scholar] [CrossRef]
- Grootveld, M.; Algeo, D.; Silwood, C.J.; Blackburn, J.C.; Clark, A.D. Determination of the illicit drug gamma-hydroxybutyrate (GHB) in human saliva and beverages by 1H NMR analysis. BioFactors 2006, 27, 121–136. [Google Scholar] [CrossRef]
- Gardner, A.; Parkes, H.G.; Carpenter, G.H.; So, P.-W. Developing and standardizing a protocol for quantitative proton nuclear magnetic resonance (1 h nmr) spectroscopy of saliva. J. Proteome Res. 2018, 17, 1521–1531. [Google Scholar] [CrossRef] [Green Version]
- Percival, B.C.; Wann, A.; Masania, J.; Sinclair, J.; Sullo, N.; Grootveld, M. Detection and determination of methanol and further potential toxins in human saliva collected from cigarette smokers: A 1H NMR investigation. JSM Biotechnol. Biomed. Eng. 2018, 5, 1081–1088. [Google Scholar]
- Aguilar, J.A.; Kenwright, S.J. Robust NMR water signal suppression for demanding analytical applications. Analyst 2016, 141, 236–242. [Google Scholar] [CrossRef] [Green Version]
- Katsavochristou, A.; Koumoulis, D. Current status of magnetic resonance on saliva for oral and dental health early diagnosis. Magnetochemistry 2020, 6, 18. [Google Scholar] [CrossRef]
- Duarte, D.; Castro, B.; Pereira, J.L.; Marques, J.F.; Costa, A.L.; Gil, A.M. Evaluation of saliva stability for nmr metabolomics: Collection and handling protocols. Metabolites 2020, 10, 515. [Google Scholar] [CrossRef] [PubMed]
- Martina, E.; Campanati, A.; Diotallevi, F.; Offidani, A. Saliva and oral diseases. J. Clin. Med. 2020, 9, 466. [Google Scholar] [CrossRef] [PubMed] [Green Version]
- Haslauer, K.E.; Hemmler, D.; Schmitt-Kopplin, P.; Heinzmann, S.S. Guidelines for the use of deuterium oxide (D2O) in 1H NMR metabolomics. Anal. Chem. 2019, 91, 11063–11069. [Google Scholar] [CrossRef] [PubMed]
- Maruyama, Y.; Nishimoto, Y.; Umezawa, K.; Kawamata, R.; Ichiba, Y.; Tsutsumi, K.; Kimura, M.; Murakami, S.; Kakizawa, Y.; Kumagai, T.; et al. Comparison of oral metabolome profiles of stimulated saliva, unstimulated saliva, and mouth-rinsed water. Sci. Rep. 2022, 12, 689. [Google Scholar] [CrossRef] [PubMed]
- Letieri, A.; Freitas-Fernandes, L.B.; Albarello, L.; Fontes, G.; Souza, I.; Valente, A.; Fidalgo, T. Analysis of salivary metabolites by nuclear magnetic resonance before and after oral mucosa cleaning of infants in the pre-dental period. Front. Dent. Med. 2021, 2, 667365. [Google Scholar] [CrossRef]
- Meleti, M.; Quartieri, E.; Antonelli, R.; Pezzi, M.E.; Ghezzi, B.; Viani, M.V.; Setti, G.; Casali, E.; Ferrari, E.; Ciociola, T.; et al. Metabolic profiles of whole, parotid and submandibular/sublingual saliva. Metabolites 2020, 10, 318. [Google Scholar] [CrossRef]
- Silwood, C.J.L.; Lynch, E.; Claxson, A.W.D.; Grootveld, M.C. 1H and 13C NMR spectroscopic analysis of human saliva. J. Dent. Res. 2002, 81, 422–427. [Google Scholar] [CrossRef]
- Aimetti, M.; Cacciatore, S.; Graziano, A.; Tenori, L. Metabonomic analysis of saliva reveals generalized chronic periodontitis signature. Metabolomics 2012, 8, 465–474. [Google Scholar] [CrossRef]
- Yoshida, Y. Analysis of the Butyrate-Producing Pathway in Porphyromonas gingivalis. In Periodontal Pathogens; Methods in Molecular Biology; Nagano, K., Hasegawa, Y., Eds.; Humana: New York, NY, USA, 2021; Volume 2210. [Google Scholar] [CrossRef]
- Pogrel, M.A.; Low, M.A.; Stern, R. Hyaluronan (hyaluronic acid) and its regulation in human saliva by hyaluronidase and its inhibitors. J. Oral Sci. 2003, 45, 85–91. [Google Scholar] [CrossRef]
- Silwood, C.J.L.; Lynch, E.J.; Seddon, S.; Sheerin, A.; Claxson, A.W.D.; Grootveld, M.C. 1H NMR analysis of microbial-derived organic acids in primary root carious lesions and saliva. NMR Biomed. 1999, 12, 345–356. [Google Scholar] [CrossRef]
- Makino, Y.; Yamaga, T.; Yoshihara, A.; Nohno, K.; Miyazaki, H. Association between volatile sulfur compounds and periodontal disease progression in elderly non-smokers. J. Periodont. 2012, 83, 635–643. [Google Scholar] [CrossRef] [PubMed]
- Highfield, J. Diagnosis and classification of periodontal disease. Aust. Dent. J. 2009, 54, 11–26. [Google Scholar] [CrossRef] [PubMed]
- Lang, N.P.; Bartold, P.M. Periodontal health. J. Periodontol. 2018, 89 (Suppl. 1), S9–S16. [Google Scholar] [CrossRef] [Green Version]
- Rzeznik, M.; Triba, M.N.; Levy, P.; Jungo, S.; Botosoa, E.; Duchemann, B.; Le Moyec, L.; Bernaudin, J.-F.; Savarin, P.; Guez, D. Identification of a discriminative metabolomic fingerprint of potential clinical relevance in saliva of patients with periodontitis using 1H nuclear magnetic resonance (NMR) spectroscopy. PLoS ONE 2017, 12, e0182767. [Google Scholar] [CrossRef] [Green Version]
- O’Brien-Simpson, N.M.; Burgess, K.; Brammar, G.C.; Darby, I.B.; Reynolds, E.C. Development and evaluation of a saliva-based chair-side diagnostic for the detection of Porphyromonas gingivalis. J. Oral Microbiol. 2015, 7, 29129. [Google Scholar] [CrossRef]
- Gawron, K.; Wojtowicz, W.; Łazarz-Bartyzel, K.; Łamasz, A.; Qasem, B.; Mydel, P.; Chomyszyn-Gajewska, M.; Potempa, J.; Mlynarz, P. Metabolomic status of the oral cavity in chronic periodontitis. Vivo 2019, 33, 1165–1174. [Google Scholar] [CrossRef] [Green Version]
- Dieterle, F.; Ross, A.; Schlotterbeck, G.; Senn, H. Probabilistic quotient normalization as robust method to account for dilution of complex biological mixtures. Application in 1H NMR metabonomics. Anal. Chem. 2006, 78, 4281–4290. [Google Scholar] [CrossRef]
- Nobuhiro, T. Microbial ecosystem in the oral cavity, metabolic diversity in an ecological niche and its relationship with oral diseases. Int. Congr. Ser. 2005, 1284, 103–112. [Google Scholar] [CrossRef]
- Lu, R.; Meng, H.; Gao, X.; Xu, L.; Feng, X. Effect of non-surgical periodontal treatment on short chain fatty acid levels in gingival crevicular fluid of patients with generalized aggressive periodontitis. J. Periodontal Res. 2014, 49, 574–583. [Google Scholar] [CrossRef]
- Chen, H.W.; Zhou, W.; Liao, Y.; Hu, S.C.; Chen, T.L.; Song, Z.C. Analysis of metabolic profiles of generalized aggressive periodontitis. J. Periodontal Res. 2018, 53, 894–901. [Google Scholar] [CrossRef] [PubMed]
- Barros, S.P.; Williams, R.; Offenbacher, S.; Morelli, T. Gingival crevicular fluid as a source of biomarkers for periodontitis. Periodontol. 2000 2016, 70, 53–64. [Google Scholar] [CrossRef] [PubMed]
- Baima, G.; Iaderosa, G.; Citterio, F.; Grossi, S.; Romano, F.; Berta, G.N.; Buduneli, N.; Aimetti, M. Salivary metabolomics for the diagnosis of periodontal diseases: A systematic review with methodological quality assessment. Metabolomics 2021, 17, 1. [Google Scholar] [CrossRef] [PubMed]
- Shi, M.; Wei, Y.; Nie, Y.; Wang, C.; Sun, F.; Jiang, W.; Hu, W.; Wu, X. Alterations and correlations in microbial community and metabolome characteristics in generalized aggressive periodontitis. Front. Microbiol. 2020, 30, 573196. [Google Scholar] [CrossRef] [PubMed]
- Pereira, J.A.M.; Porto-Figueira, P.; Taware, R.; Sukul, P.; Rapole, S.; Câmara, J.S. Unravelling the potential of salivary volatile metabolites in oral diseases. A review. Molecules 2020, 25, 3098. [Google Scholar] [CrossRef]
- Bostanci, N.; Grant, M.; Bao, K.; Silbereisen, A.; Hetrodt, F.; Manoil, D.; Belibasakis, G. Metaproteome and metabolome of oral microbial communities. Periodontology 2021, 85, 46–81. [Google Scholar] [CrossRef]
- Wu, Z.S.; Xiao, C.; Chen, F.H.; Wang, Y.; Guo, Z.D. Pulmonary disease and periodontal health: A meta-analysis. Sleep Breath. 2022, 26, 1857–1868. [Google Scholar] [CrossRef]
- Na, H.; Kim, K.; Kim, S.; Yu, Y.; Kim, S.; Kim, H.-J.; Lee, J.-Y.; Lee, J.-H.; Chung, J. Molecular subgroup of periodontitis revealed by integrated analysis of the microbiome and metabolome in a cross-sectional observational study. J. Oral Microbiol. 2021, 13, 1902707. [Google Scholar] [CrossRef]
- Grootveld, M. High-resolution NMR analysis of human saliva, carious dentin, plaque and extrinsic tooth discoloration biopsies: Future research potential. J. Dent. Res. 2007, 86. [Google Scholar]
- Minah, G.E.; Loesche, W.J. Sucrose metabolism by prominent members of the flora isolated from cariogenic and non-cariogenic dental plaques. Infect Immun. 1977, 17, 55–61. [Google Scholar] [CrossRef] [Green Version]
- Dame, Z.T.; Aziat, F.; Mandal, R.; Krishnamurthy, R.; Bouatra, S.; Borzouie, S.; Guo, A.C.; Sajed, T.; Deng, L.; Lin, H. The human saliva metabolome. Metabolomics 2015, 11, 1864–1883. [Google Scholar] [CrossRef]
- Featherstone, J.D.B.; Rodgers, B.E. Effect of acetic, lactic and other organic acids on the formation of artificial carious lesions. Caries Res. 1981, 15, 377–385. [Google Scholar] [CrossRef] [PubMed]
- Hojo, S.; Takahashi, N.; Yamada, T. Acid profile in carious dentin. J. Dent. Res. 1991, 70, 182–186. [Google Scholar] [CrossRef] [PubMed]
- Edwardsson, S. Bacteriological studies on deep areas of carious dentine. Odontol. Rev. 1974, 25 (Suppl. 32), 1–143. [Google Scholar]
- Pereira, J.L.; Duarte, D.; Carneiro, T.J.; Ferreira, S.; Cunha, B.; Soares, D.; Costa, A.L.; Gil, A.M. Saliva NMR metabolomics: Analytical issues in pediatric oral health research. Oral Dis. 2019, 8, 1545–1554. [Google Scholar] [CrossRef]
- Fidalgo, T.K.S.; Freitas-Fernandes, L.B.; Angeli, R.; Muniz, A.M.S.; Gonsalves, E.; Santos, R.; Nadal, J.; Almeida, F.C.L.; Valente, A.P.; Souza, I.P.R. Salivary metabolite signatures of children with and without dental caries lesions. Metabolomics 2012, 9, 657–666. [Google Scholar] [CrossRef]
- Fidalgo, T.K.S.; Freitas-Fernandes, L.B.; Almeida, F.C.L.; Valente, A.P.; Souza, I.P.R. Longitudinal evaluation of salivary profile from children with dental caries before and after treatment. Metabolomics 2014, 11, 583–593. [Google Scholar] [CrossRef]
- Da Silva, L.P.; da Silva Bastos, V.D.A.; da Silva Fidalgo, T.K.; de Oliveira, C.M.; Pomarico, L.; Valente, A.P.; Freitas-Fernandes, L.B.; Pomari, I. Oral health of babies and mothers during the breastfeeding period. J. Clin. Diagn. Res. 2019, 13, ZC09–ZC13. [Google Scholar] [CrossRef]
- Granger, D.A.; Kivlighan, K.T.; Fortunato, C.; Harmon, A.G.; Hibel, L.C.; Schwartz, E.B.; Whembolua, G.L. Integration of salivary biomarkers into developmental and behaviorally-oriented research: Problems and solutions for collecting specimens. Physiol. Behav. 2007, 92, 583–590. [Google Scholar] [CrossRef]
- Rosa, T.; Neves, A.; Azcárate-Peril, M.; Divaris, K.; Wu, D.; Cho, H.; Moss, K.; Paster, B.; Chen, T.; Freitas-Fernandes, L.B.; et al. The bacterial microbiome and metabolome in caries progression and arrest. J. Oral Microbiol. 2021, 13, 1886748. [Google Scholar] [CrossRef]
- Javaid, M.A.; Ahmed, A.S.; Durand, R.; Tran, S.D. Saliva as a diagnostic tool for oral and systemic diseases. J. Oral Biol. Craniofac. Res. 2016, 6, 67–76. [Google Scholar] [CrossRef] [PubMed] [Green Version]
- Zhang, C.Z.; Cheng, X.Q.; Li, J.Y.; Zhang, P.; Yi, P.; Xu, X.; Zhou, X.D. Saliva in the diagnosis of diseases. Int. J. Oral Sci. 2016, 8, 133–137. [Google Scholar] [CrossRef] [PubMed]
- De Oliveira, L.R.; Martins, C.; Fidalgo, T.K.; Freitas-Fernandes, L.B.; de Oliveira Torres, R.; Soares, A.L.; Almeida, F.C.; Valente, A.P.; de Souza, I.P. Salivary metabolite fingerprint of type 1 diabetes in young children. J. Proteome Res. 2016, 15, 2491–2499. [Google Scholar] [CrossRef] [PubMed]
- Das, S.; Pal, S.; Mitra, M. Significance of exhaled breath test in clinical diagnosis: A special focus on the detection of diabetes mellitus. J. Med. Biol. Eng. 2016, 36, 605–624. [Google Scholar] [CrossRef] [PubMed] [Green Version]
- Gardner, A.; Parkes, H.G.; So, P.-W.; Carpenter, G.H. Determining bacterial and host contributions to the human salivary metabolome. J. Oral Microbiol. 2019, 11, 1617014. [Google Scholar] [CrossRef] [Green Version]
- Aitken-Saavedra, J.; Rojas-Alcayaga, G.; Maturana-Ramírez, A.; Escobar-Álvarez, A.; Cortes-Coloma, A.; Reyes-Rojas, M.; Viera-Sapiain, V.; Villablanca-Martínez., C.; Morales-Bozo, I. Salivary gland dysfunction markers in type 2 diabetes mellitus patients. J. Clin. Exp. Dent. 2015, 7, e501–e505. [Google Scholar] [CrossRef] [Green Version]
- Barnes, V.M.; Kennedy, A.D.; Panagakos, F.; Devizio, W.; Trivedi, H.M.; Jönsson, T.; Guo, L.; Cervi, S.; Scannapieco, F.A. Global metabolomic analysis of human saliva and plasma from healthy and diabetic subjects, with and without periodontal disease. PLoS ONE 2014, 9, e105181. [Google Scholar] [CrossRef]
- Bahbah, E.I.; Noehammer, C.; Pulverer, W.; Jung, M.; Weinhaeusel, A. Salivary biomarkers in cardiovascular disease: An insight into the current evidence. FEBS J. 2021, 288, 6392–6405. [Google Scholar] [CrossRef]
- Kosaka, T.; Kokubo, Y.; Ono, T.; Sekine, S.; Kida, M.; Kikui, M.; Yamamoto, M.; Watanabe, M.; Amano, A.; Maeda, Y.; et al. Salivary inflammatory cytokines may be novel markers of carotid atherosclerosis in a Japanese general population: The Suita study. Atherosclerosis 2014, 237, 123–128. [Google Scholar] [CrossRef]
- Zheng, H.; Li, R.; Zhang, J.; Zhou, S.; Ma, O.; Zhou, Y.; Chen, F.; Lin, J. Salivary biomarkers indicate obstructive sleep apnea patients with cardiovascular diseases. Sci. Rep. 2014, 4, 7046. [Google Scholar] [CrossRef] [PubMed] [Green Version]
- Delaleu, N.; Mydel, P.; Kwee, I.; Brun, J.G.; Jonsson, M.V.; Jonsson, R. High fidelity between saliva proteomics and the biologic state of salivary glands defines biomarker signatures for primary Sjögren’s syndrome. Arthritis Rheum. 2015, 67, 1084–1095. [Google Scholar] [CrossRef] [PubMed]
- Khuder, S.A.; Al-Hashimi, I.; Mutgi, A.B.; Altorok, N. Identification of potential genomic biomarkers for Sjögren’s syndrome using data pooling of gene expression microarrays. Rheumatol. Int. 2015, 35, 829–836. [Google Scholar] [CrossRef] [PubMed]
- Hu, S.; Gao, K.; Pollard, R.; Arellano-Garcia, M.; Zhou, H.; Zhang, L.; Elashoff, D.; Kallenberg, C.G.M.; Vissink, A.; Wong, D.T.; et al. Preclinical validation of salivary biomarkers for primary Sjögren’s syndrome. Arthritis Care Res. 2010, 62, 1633–1638. [Google Scholar] [CrossRef] [PubMed] [Green Version]
- Mikkonen, J.J.W.; Herrala, M.; Soininen, P.; Lappalainen, R.; Tjäderhane, L.; Seitsalo, H.; Niemelä, R.; Salo, T.; Kullaa, A.M.; Myllymaa, S. Metabolic profiling of saliva in patients with primary Sjögren’s syndrome. Metabolomics 2013, 3, 1000128. [Google Scholar] [CrossRef] [Green Version]
- Herrala, M.; Mikkonen, J.J.; Pesonen, P.; Lappalainen, R.; Tjäderhane, L.; Niemelä, R.K.; Seitsalo, H.; Salo, T.; Myllymaa, S.; Kullaa, A.M. Variability of salivary metabolite levels in patients with Sjögren’s syndrome. J. Oral Sci. 2021, 63, 22–26. [Google Scholar] [CrossRef]
- Herrala, M.; Turunen, S.; Hanhineva, K.; Lehtonen, M.; Mikkonen, J.; Seitsalo, H.; Lappalainen, R.; Tjäderhane, L.; Niemelä, R.; Salo, T.; et al. Low-dose doxycycline treatment normalizes levels of some salivary metabolites associated with oral microbiota in patients with primary Sjögren’s syndrome. Metabolites 2021, 11, 595. [Google Scholar] [CrossRef]
- Kumari, S.; Goyal, V.; Kumaran, S.S.; Dwivedi, S.N.; Srivastava, A.; Jagannathan, N.R. Quantitative metabolomics of saliva using proton NMR spectroscopy in patients with Parkinson’s disease and healthy controls. Neurol. Sci. 2020, 41, 1201–1210. [Google Scholar] [CrossRef]
- Yilmaz, A.; Geddes, T.; Han, B.S.; Bahado-Singh, R.O.; Wilson, G.D.; Imam, K.; Maddens, M.; Graham, S.F. Diagnostic biomarkers of Alzheimer’s disease as identified in saliva using 1H NMR-based metabolomics. J. Alzheim. Dis. 2017, 58, 355–359. [Google Scholar] [CrossRef]
- Figueira, J.; Jonsson, P.; Nordin Adolfsson, A.; Adolfsson, R.; Nyberg, L.; Öhman, A. NMR analysis of the human saliva metabolome distinguishes dementia patients from matched controls. Mol. Biosyst. 2016, 12, 2562–2571. [Google Scholar] [CrossRef] [Green Version]
- Montis, N.; Cotti, E.; Noto, A.; Fattuoni, C.; Barberini, L. Salivary metabolomics fingerprint of chronic apical abscess with sinus tract: A pilot study. Sci. World J. 2019, 2019, 3162063. [Google Scholar] [CrossRef] [Green Version]
- Imai, K.; Iinuma, T.; Sato, S. Relationship between the oral cavity and respiratory diseases: Aspiration of oral bacteria possibly contributes to the progression of lower airway inflammation. Jap. Dent. Sci. Rev. 2021, 57, 224–230. [Google Scholar] [CrossRef] [PubMed]
- Girdhar, K.; Powis, A.; Raisingani, A.; Chrudinová, M.; Huang, R.; Tran, T.; Sevgi, K.; Dogru, U.D.; Altindis, E. Viruses and Metabolism: The effects of viral infections and viral insulins on host metabolism. Ann. Rev. Virol. 2021, 8, 373–391. [Google Scholar] [CrossRef] [PubMed]
- Keshavarz, M.; Solaymani-Mohammadi, F.; Namdari, H.; Arjeini, Y.; Mousavi, M.J.; Farhad, R. Metabolic host response and therapeutic approaches to influenza infection. Cell Mol. Biol. Lett. 2020, 25, 15–19. [Google Scholar] [CrossRef] [PubMed]
- Nishikawa, T.; Shimizu, K.; Tanaka, T.; Kuroda, K.; Takayama, T.; Yamamoto, T.; Hanada, N.; Hamada, Y. Bacterial neuraminidase rescues influenza virus replication from inhibition by a neuraminidase inhibitor. PLoS ONE 2012, 7, e45371. [Google Scholar] [CrossRef] [Green Version]
- Sitole, L.J.; Williams, A.A.; Meyer, D. Metabonomic analysis of HIV-infected biofluids. Mol. Biosyst. 2013, 9, 18–28. [Google Scholar] [CrossRef] [Green Version]
- Munshi, S.U.; Rewari, B.B.; Bhavesh, N.S.; Jameel, S. Nuclear magnetic resonance based profiling of biofluids reveals metabolic dysregulation in HIV-infected persons and those on anti-retroviral therapy. PLoS ONE 2013, 8, e64298. [Google Scholar] [CrossRef] [Green Version]
- Dos Santos, G.C., Jr.; Pereira, C.M.; da Silva, K.; Fidalgo, T.; Valente, A.P. Saliva NMR-based metabolomics in the war against COVID-19. Anal. Chem. 2020, 92, 15688–15692. [Google Scholar] [CrossRef]
- Xu, J.; Li, Y.; Gan, F.; Du, Y.; Yao, Y. Salivary glands: Potential reservoirs for COVID-19 asymptomatic infection. J. Dent. Res. 2020, 99, 989. [Google Scholar] [CrossRef] [Green Version]
- Marques, M.V.C.; de Brito, A.A., Jr.; de Jesus Abel, C.M.; Ricarte, R.G.; Reis, J.V.N.A.; de Lima Dantas, J.B. Oral manifestations associated with COVID-19: A critical review. J. Health Sci. 2022, 24, 28–34. [Google Scholar] [CrossRef]
- Worrall, G. Acute sore throat. In There’s a Lot of It About: Acute Respiratory Infection in Primary Care; Worrall, G., Ed.; Radcliffe Publishing Ltd.: Abingdon, UK, 2006; pp. 24–36. [Google Scholar]
- Bisno, A.L.; Gerber, M.A.; Gwaltney, J.M., Jr.; Kaplan, E.L.; Schwartz, R.H. Infectious diseases society of America. Practice guidelines for the diagnosis and management of group A streptococcal pharyngitis. Clin. Infect. Dis. 2002, 35, 113–125. [Google Scholar] [CrossRef] [Green Version]
- Carmona, C.J.; Ruiz-Rodado, V.; del Jesus, M.J.; Weber, A.; Grootveld, M.; González, P.; Elizondo, D. A fuzzy genetic programming-based algorithm for subgroup discovery and the application to one problem of pathogenesis of acute sore throat conditions in humans. Inf. Sci. 2015, 298, 180–197, ISSN 0020-0255. [Google Scholar] [CrossRef]
- Fothergill, J.C.; Guest, J.R. Catabolism of L-lysine by Pseudomonas aeruginosa. J. Gen. Microbiol. 1977, 99, 139–155. [Google Scholar] [CrossRef] [PubMed]
- Callery, P.S.; Geelhaar, L.A. Biosynthesis of 5-aminopentanoic acid and 2-piperidone from cadaverine and 1-piperideine in the mouse. J. Neurochem. 1984, 43, 1631–1634. [Google Scholar] [CrossRef] [PubMed]
- Wu, J.; Li, Y.; Cai, Z.; Jin, Y. Pyruvate-associated acid resistance in bacteria. Appl. Environ. Microbiol. 2014, 80, 4108–4113. [Google Scholar] [CrossRef] [PubMed] [Green Version]
- Ruby, E.G.; Nealson, K.H. Pyruvate production and excretion by the luminous marine bacteria. Appl. Environ. Microbiol. 1977, 34, 164–169. [Google Scholar] [CrossRef] [PubMed] [Green Version]
- Goeman, J.J.; van de Geer, S.A.; de Kort, F.; van Houwelingen, H.C. A global test for groups of genes: Testing association with a clinical outcome. Bioinformatics 2004, 20, 93–99. [Google Scholar] [CrossRef] [Green Version]
- KEGG: Kyoto Encyclopedia of Genes and Genomes. 1995–2022. Available online: http://www.kegg.jp/ (accessed on 22 October 2022).
- Zeisel, S.H. Choline: Critical role during fetal development and dietary requirements in adults. Annu. Rev. Nutr. 2006, 26, 229–250. [Google Scholar] [CrossRef] [Green Version]
- Sánchez, J.; Fuentes, N.; Ibañez-López, F.J.; López-García, I.; Gutiérrez, A.M. A multi-herd study shows that saliva is more than a reflection of serum biomarkers in pigs. Animal 2021, 15, 100413. [Google Scholar] [CrossRef]
- Turunen, S.; Puurunen, J.; Auriola, S.; Kullaa, A.; Kärkkäinen, O.; Lohi, H.; Hanhineva, K. Metabolome of canine and human saliva: A non-targeted metabolomics study. Metabolomics 2020, 16, 90. [Google Scholar] [CrossRef]
- Ramadan, Z.; Zhang, P.; Jacobs, D.M.; Tavazzi, I.; Kochhar, S. An NMR- and MS-based metabonomic investigation of saliva metabolic changes in feline odontoclastic resorptive lesions (FORL)-diseased cats. Metabolomics 2007, 3, 113–119. [Google Scholar] [CrossRef]
- FDA-NIH Biomarker Working Group. BEST (Biomarkers, EndpointS, and Other Tools) Resource; Food and Drug Administration: Silver Spring, MD, USA, 2016.
- Ou, F.-S.; Michiels, S.; Shyr, Y.; Adjei, A.A.; Oberg, A.L. Biomarker discovery and validation: Statistical considerations. J. Thorac. Oncol. 2021, 16, 537–545. [Google Scholar] [CrossRef] [PubMed]
- Grootveld, M. Metabolic Profiling: Disease and Xenobiotics; Issues in Toxicology Series; Royal Society of Chemistry: Cambridge, UK, 2014; ISBN 1849731632. [Google Scholar]
- Harrell, F.E., Jr. Regression Modeling Strategies with Applications to Linear Models, Logistic and Ordinal Regression, and Survival Analysis, 2nd ed.; Springer: Berlin, Germany, 2015. [Google Scholar]
- Teutsch, S.M.; Bradley, L.A.; Palomaki, G.E.; Haddow, J.E.; Piper, M.; Calonge, N.; Dotson, W.D.; Douglas, M.P.; Berg, A.O.; EGAPP Working Group. The evaluation of genomic applications in practice and prevention (EGAPP) initiative: Methods of the EGAPP working group. Genet. Med. 2009, 11, 3–14. [Google Scholar] [CrossRef] [PubMed]
- Boyiadzis, M.M.; Kirkwood, I.M.; Marshall, I.L.; Pritchard, C.C.; Azad, N.S.; Gulley, J.L. Significance and implications of FDA approval of pembrolizumab for biomarker-defined disease. J. Immunother. Cancer 2018, 6, 35. [Google Scholar] [CrossRef] [PubMed] [Green Version]
- Marcus, L.; Lemery, S.J.; Keegan, P.; Pazdur, R. FDA approval summary: Pembrolizumab for the treatment of microsatellite instability-high solid tumors. Clin. Cancer Res. 2019, 25, 3753–3758. [Google Scholar] [CrossRef] [Green Version]
- Andre, F.; McShane, L.M.; Michiels, S.; Ransohoff, D.F.; Altman, D.G.; Reis-Filho, J.S.; Hayes, D.E.; Pusztai, L. Biomarker studies: A call for a comprehensive biomarker study registry. Nat. Rev. Clin. Oncol 2011, 8, 171–176. [Google Scholar] [CrossRef]
- Pepe, M.S.; Feng, Z.; Janes, H.; Bossuyt, P.M.; Potter, I.D. Pivotal evaluation of the accuracy of a biomarker used for classification or prediction: Standards for study design. J. Natl. Cancer Inst. 2008, 100, 1432–1438. [Google Scholar] [CrossRef] [Green Version]
- Yang, S.-M.; Lv, S.; Zhang, W.; Cui, Y. Microfluidic point-of-care (POC) devices in early diagnosis: A review of opportunities and challenges. Sensors 2022, 22, 1620. [Google Scholar] [CrossRef]
- Khanna, P.; Walt, D.R. Salivary diagnostics using a portable point-of-service platform: A review. Clin. Therapeut. 2015, 37, 498–504. [Google Scholar] [CrossRef] [Green Version]
- Edgar, M.; Kuhn, S.; Page, G.; Grootveld, M. Computational simulation of 1H NMR profiles of complex biofluid analyte mixtures at differential operating frequencies: Applications to low-field benchtop spectra. Mag. Res. Chem. 2021, 60, 1097–1112. [Google Scholar] [CrossRef]
- Percival, B.C.; Wann, A.; Taylor, S.; Edgar, M.; Gibson, M.; Grootveld, M. Metabolomics distinction of smokers from non-smokers using non-stationary benchtop NMR analysis of human saliva. In Open Access Research E-Book Entitled “Oral Health Care”; Ardelean, L., Ed.; Sage Publications Inc.: Newbury Park, CA, USA, 2021. [Google Scholar]
- Mani, V.; Beduk, T.; Khushaim, W.; Elcin Ceylan, A.; Timur, S.; Wolfbeis, O.S.; Salama, K.N. Electrochemical sensors targeting salivary biomarkers: A comprehensive review. TrAC Trends Anal. Chem. 2021, 135, 16164. [Google Scholar] [CrossRef]
- Zheng, X.; Zhang, F.; Wang, K.; Zhang, W.; Li, Y.; Sun, Y.; Sun, X.; Li, C.; Dong, B.; Wang, L.; et al. Smart biosensors and intelligent devices for salivary biomarker detection. TrAC Trends Anal. Chem. 2021, 140, 116281. [Google Scholar] [CrossRef]
- Radha, S.P.; Malon, R.S.P.; Sadir, S.; Balakrishnan, M.; Córcoles, E.P. Saliva-based biosensors: Noninvasive monitoring tool for clinical diagnostics. BioMed Res. Internat. 2014, 2014, 962903. [Google Scholar] [CrossRef]
- Yao, Y.; Li, H.; Wang, D.; Liu, C.; Zhang, C. An electrochemiluminescence cloth-based biosensor with smartphone-based imaging for detection of lactate in saliva. Analyst 2017, 142, 3715–3724. [Google Scholar] [CrossRef] [PubMed]
- Khelifa, L.; Hu, Y.; Jiang, N.; Yetisen, A.K. Lateral flow assays for hormone detection. Lab. Chip 2022, 22, 2451–2475. [Google Scholar] [CrossRef] [PubMed]
- Kwagala, B.; Ndugga, P.; Nankinga, O.; Wamala, T.; Zarugaba, I.T.; Richard, S.; Misinde, C.; Nansubuga, E.; Katende, D.; Mbonye, M.K. Illicit drug use among commercial ‘Boda Boda’ motorcyclists in Uganda. Subst. Use Misuse 2022, 57, 1545–1551. [Google Scholar] [CrossRef] [PubMed]
- Schmidt, T.S.B.; Hayward, M.R.; Coelho, L.P.; Li, S.S.; Costea, P.I.; Voigt, A.Y.; Wirbel, J.; Maistrenko, O.M.; Alves, R.J.; Bergsten, E.; et al. Extensive transmission of microbes along the gastrointestinal tract. eLife 2019, 8, e42693. [Google Scholar] [CrossRef]
- Valdes, A.M.; Walter, J.; Segal, E.; Spector, T.D. Role of the gut microbiota in nutrition and health. BMJ 2018, 361, k2179. [Google Scholar] [CrossRef] [PubMed] [Green Version]
- Ridlon, J.M.; Kang, D.J.; Hylemon, P.B.; Bajaj, J.S. Bile acids and the gut microbiome. Curr. Opin. Gastroentorol. 2014, 30, 332–338. [Google Scholar] [CrossRef] [PubMed] [Green Version]
- Morrison, D.J.; Preston, T. Formation of short chain fatty acids by the gut microbiota and their impact on human metabolism. Gut Microbes 2016, 7, 189–200. [Google Scholar] [CrossRef] [PubMed] [Green Version]
- Koh, A.; De Vadder, F.; Kovatcheva-Datchary, P.; Bäckhed, F. From dietary fiber to host physiology: Short-chain fatty acids as key bacterial metabolites. Cell 2016, 165, 1332–1345. [Google Scholar] [CrossRef] [PubMed] [Green Version]
- Louis, P.; Hold, G.L.; Flint, H.J. The gut microbiota, bacterial metabolites and colorectal cancer. Nat. Rev. Microbiol. 2014, 12, 661–672. [Google Scholar] [CrossRef] [PubMed]
- Richards, J.L.; Yap, Y.A.; McLeod, K.H.; MacKay, C.R.; Marinõ, E. Dietary metabolites and the gut microbiota: An alternative approach to control inflammatory and autoimmune diseases. Clin. Transl. Immunol. 2016, 5, e82. [Google Scholar] [CrossRef] [PubMed]
- Bolognini, D.; Tobin, A.B.; Milligan, G.; Moss, C.E. The pharmacology and function of receptors for short-chain fatty acids. Mol. Pharmacol. 2016, 89, 388–398. [Google Scholar] [CrossRef] [Green Version]
- Louis, P.; Flint, H.J. Formation of propionate and butyrate by the human colonic microbiota. Environ. Microbiol. 2017, 19, 29–41. [Google Scholar] [CrossRef] [PubMed] [Green Version]
- Fernández, J.; Redondo-Blanco, S.; Gutierrez-del-Rio, I.; Miguelez, E.M.; Villar, C.J.; Lombo, F. Colon microbiota fermentation of dietary prebiotics towards short-chain fatty acids and their roles as anti-inflammatory and antitumour agents: A review. J. Funct. Foods 2016, 25, 511–522. [Google Scholar] [CrossRef]
- Van de Wouw, M.; Schellekens, H.; Dinan, T.G.; Cryan, J.F. Microbiota-gut-brain axis: Modulator of host metabolism and appetite. J. Nutri. 2017, 147, 727–745. [Google Scholar] [CrossRef] [Green Version]
- Takahashi, N. Oral microbiome metabolism: From “who are they?” to “what are they doing?”. J. Dent. Res. 2015, 94, 1628–1637. [Google Scholar] [CrossRef]
- Gardner, A.; Carpenter, G.; So, P.W. Salivary metabolomics: From diagnostic biomarker discovery to investigating biological function. Metabolites 2020, 10, 47. [Google Scholar] [CrossRef] [Green Version]
- Wu, G.D. The gut microbiome, Its metabolome, and their relationship to health and disease. Nestle Nutr. Inst. Workshop Ser. 2016, 84, 103–110. [Google Scholar] [CrossRef]
- Vojinovic, D.; Radjabzadeh, D.; Kurilshikov, A.; Amin, N.; Wijmenga, C.; Franke, L.; Ikram, M.A.; Uitterlinden, A.G.; Zhernakova, A.; Fu, J.; et al. Relationship between gut microbiota and circulating metabolites in population-based cohorts. Nat. Commun. 2019, 10, 5813. [Google Scholar] [CrossRef] [Green Version]
- De Filippis, F.; Vannini, L.; La Storia, A.; Laghi, L.; Piombino, P.; Stellato, G.; Serrazanetti, D.I.; Gozzi, G.; Turroni, S.; Ferrocino, I.; et al. The same microbiota and a potentially discriminant metabolome in the saliva of omnivore, ovo-lacto-vegetarian and Vegan individuals. PLoS ONE 2014, 9, e112373. [Google Scholar] [CrossRef] [PubMed] [Green Version]
- Rosen Vollmar, A.K.; Rattray, N.J.W.; Cai, Y.; Santos-Neto, Á.J.; Deziel, N.C.; Jukic, A.M.Z.; Johnson, C.H. Normalizing untargeted periconceptional urinary metabolomics data: A comparison of approaches. Metabolites 2019, 9, 198. [Google Scholar] [CrossRef] [PubMed]
- Mikkonen, J.J.; Singh, S.P.; Herrala, M.; Lappalainen, R.; Myllymaa, S.; Kullaa, A.M. Salivary metabolomics in the diagnosis of oral cancer and periodontal diseases. J. Periodontal Res. 2016, 51, 431–437. [Google Scholar] [CrossRef] [PubMed]
- Porto-Mascarenhas, E.C.; Assad, D.Z.; Chardin, H.; Gozal, D.; De Luca Canto, G.; Acevedo, A.C.; Neves, E.; Guerra, S. Salivary biomarkers in the diagnosis of breast cancer: A review. Crit. Rev. Oncol./Hematol. 2017, 110, 62–73. [Google Scholar] [CrossRef]
- Bigler, L.R.; Streckfus, C.F.; Copeland, L.; Burns, R.; Dai, X.; Kuhn, M.; Martin, P.; Bigler, S.A. The potential use of saliva to detect recurrence of disease in women with breast carcinoma. J Oral. Pathol. Med. 2002, 31, 421–431. [Google Scholar] [CrossRef]
- Li, X.; Yang, T.; Linb, J. Spectral analysis of human saliva for detection of lung cancer using surface-enhanced Raman spectroscopy. J. Biomed. Opt. 2012, 17, 037003. [Google Scholar] [CrossRef] [Green Version]
- Takamori, S.; Ishikawa, S.; Suzuki, J.; Oizumi, H.; Uchida, T.; Ueda, S.; Edamatsu, K.; Iino, M.; Sugimoto, M. Differential diagnosis of lung cancer and benign lung lesion using salivary metabolites: A preliminary study. Thorac. Cancer 2021, 13, 460–465. [Google Scholar] [CrossRef]
- Hizir, M.S.; Balcioglu, M.; Rana, M.; Robertson, N.M.; Yigit, M.V. Simultaneous detection of circulating oncomiRs from body fluids for prostate cancer staging using nanographene oxide. ACS Appl. Mater. Interfaces 2014, 6, 14772–14778. [Google Scholar] [CrossRef]
- Department of Scientific Information, Evidence Synthesis & Translation Research, ADA Science & Research Institute, LLC. Available online: https://www.ada.org/.../oral-health-topics/oral-systemic-health (accessed on 19 October 2022).
- Kane, S.F. The effects of oral health on systemic health. Gen. Dent. 2017, 65, 30–34. [Google Scholar]


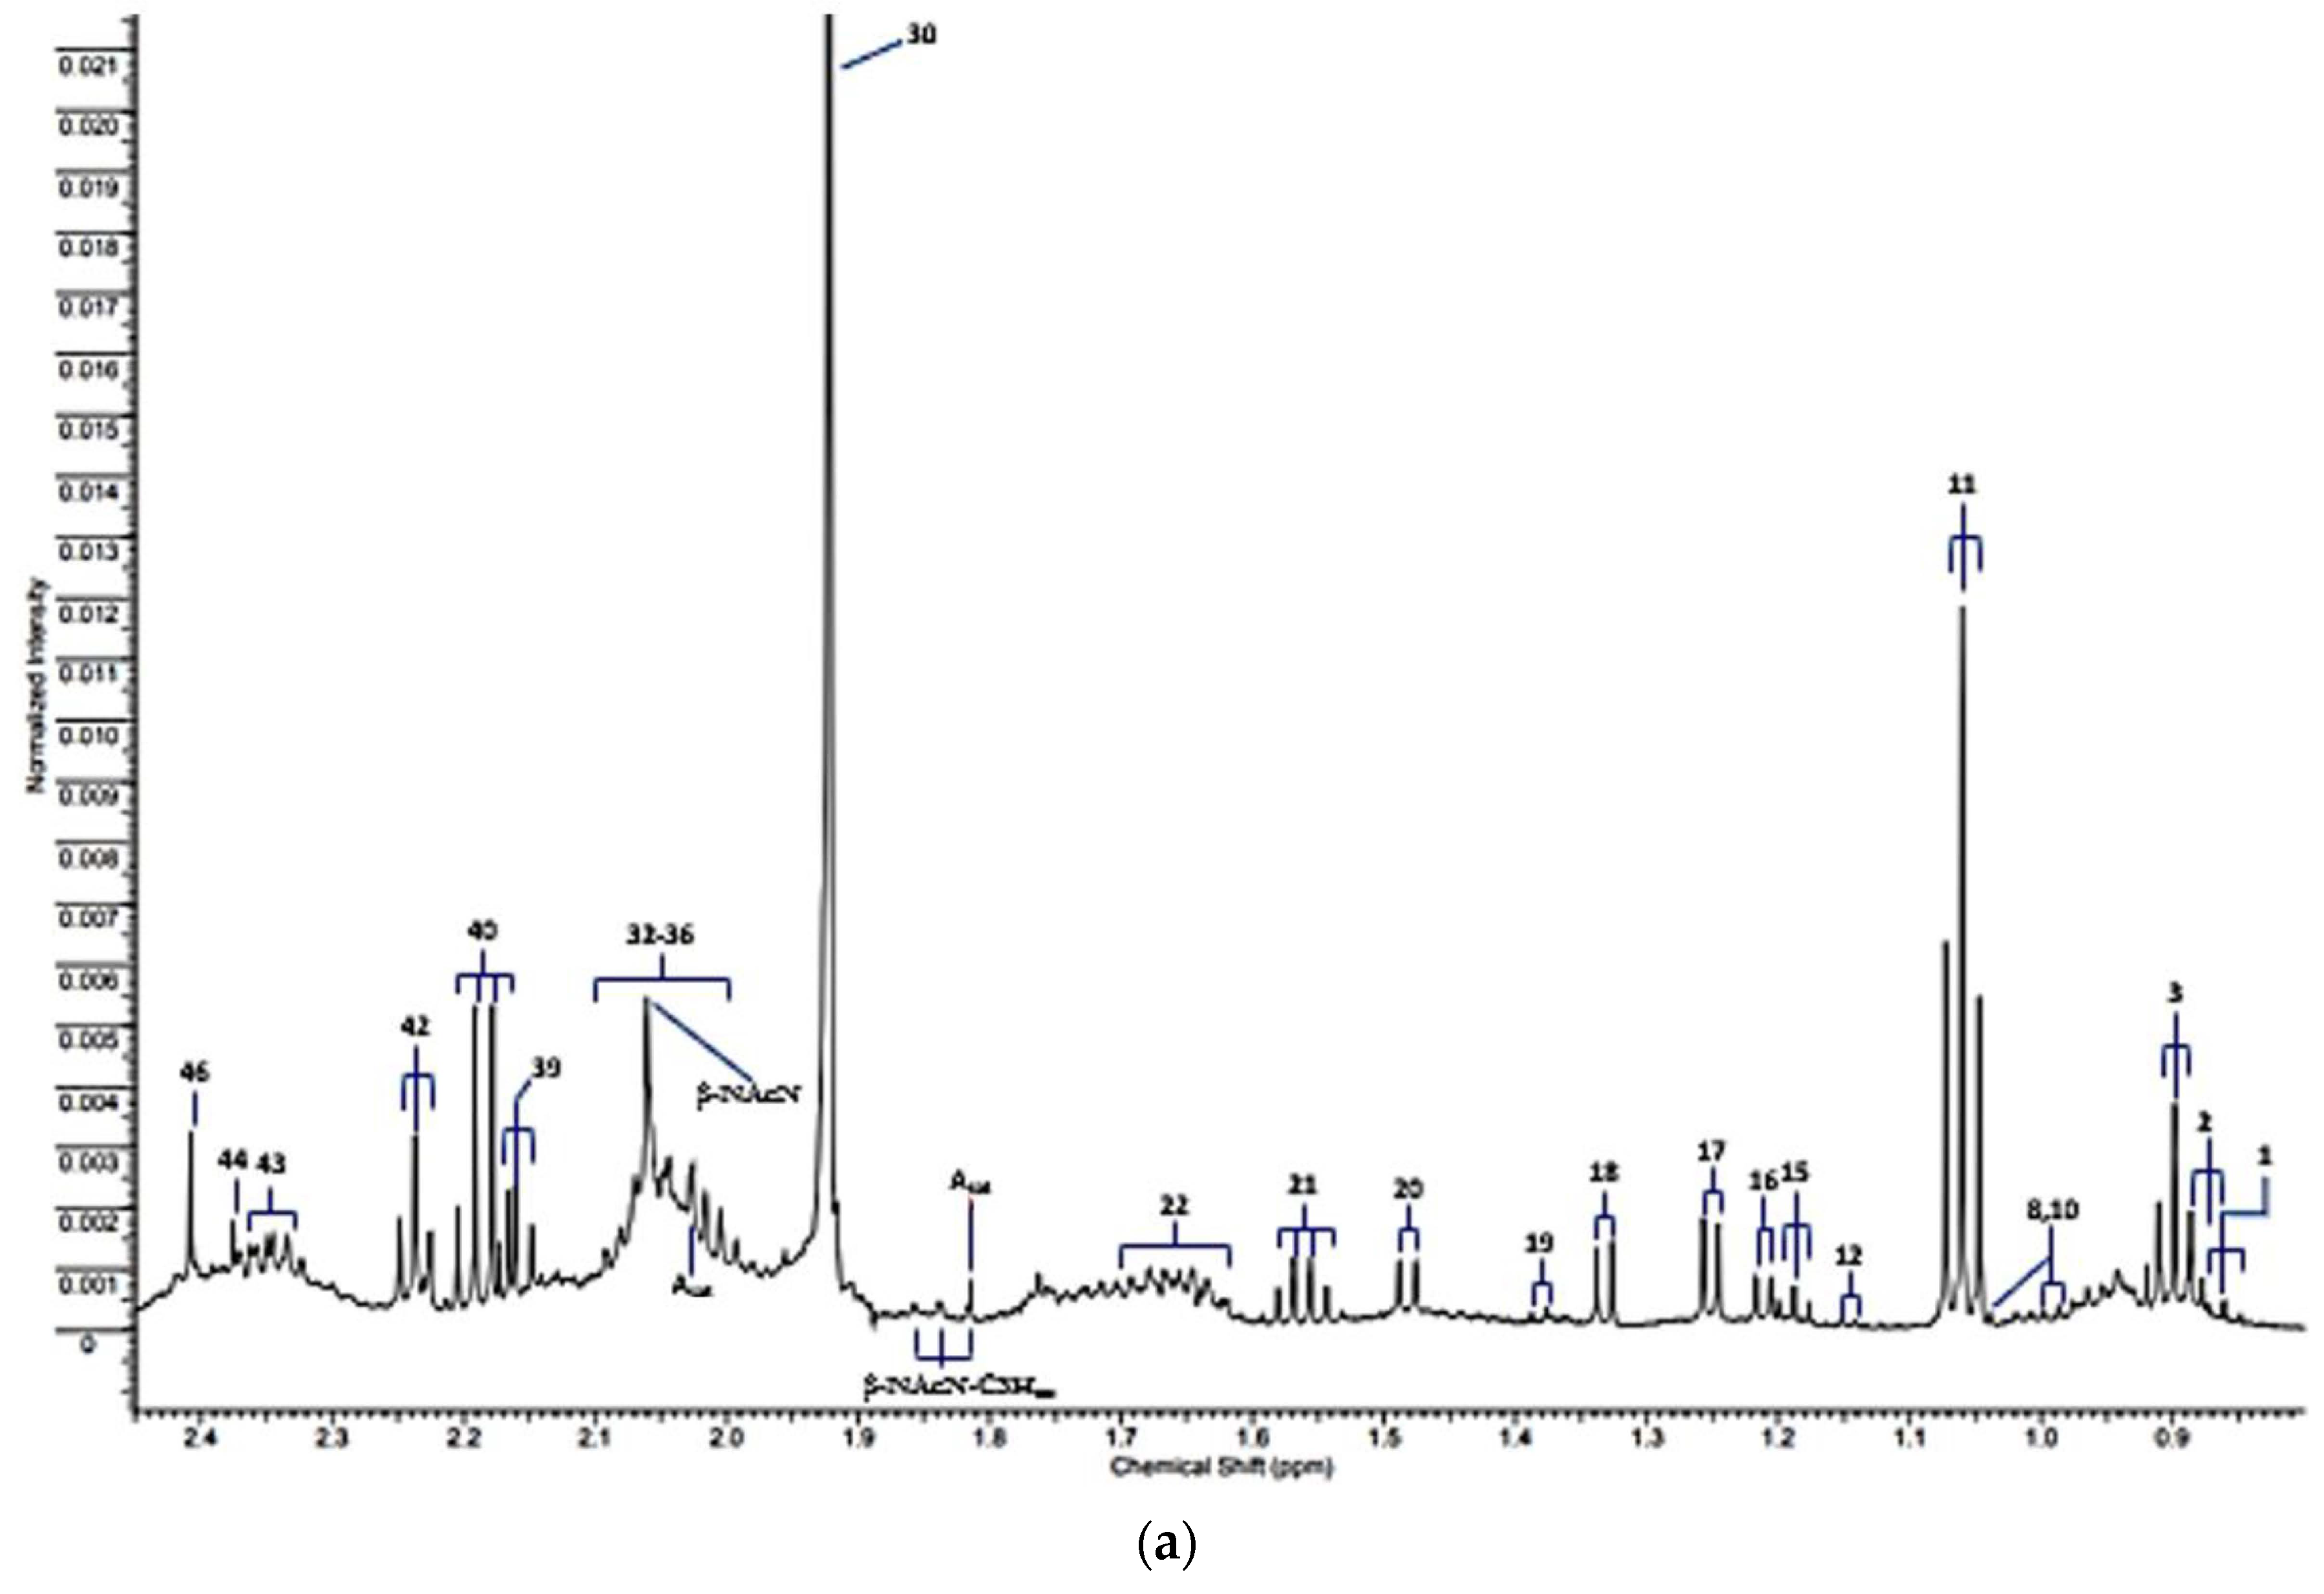
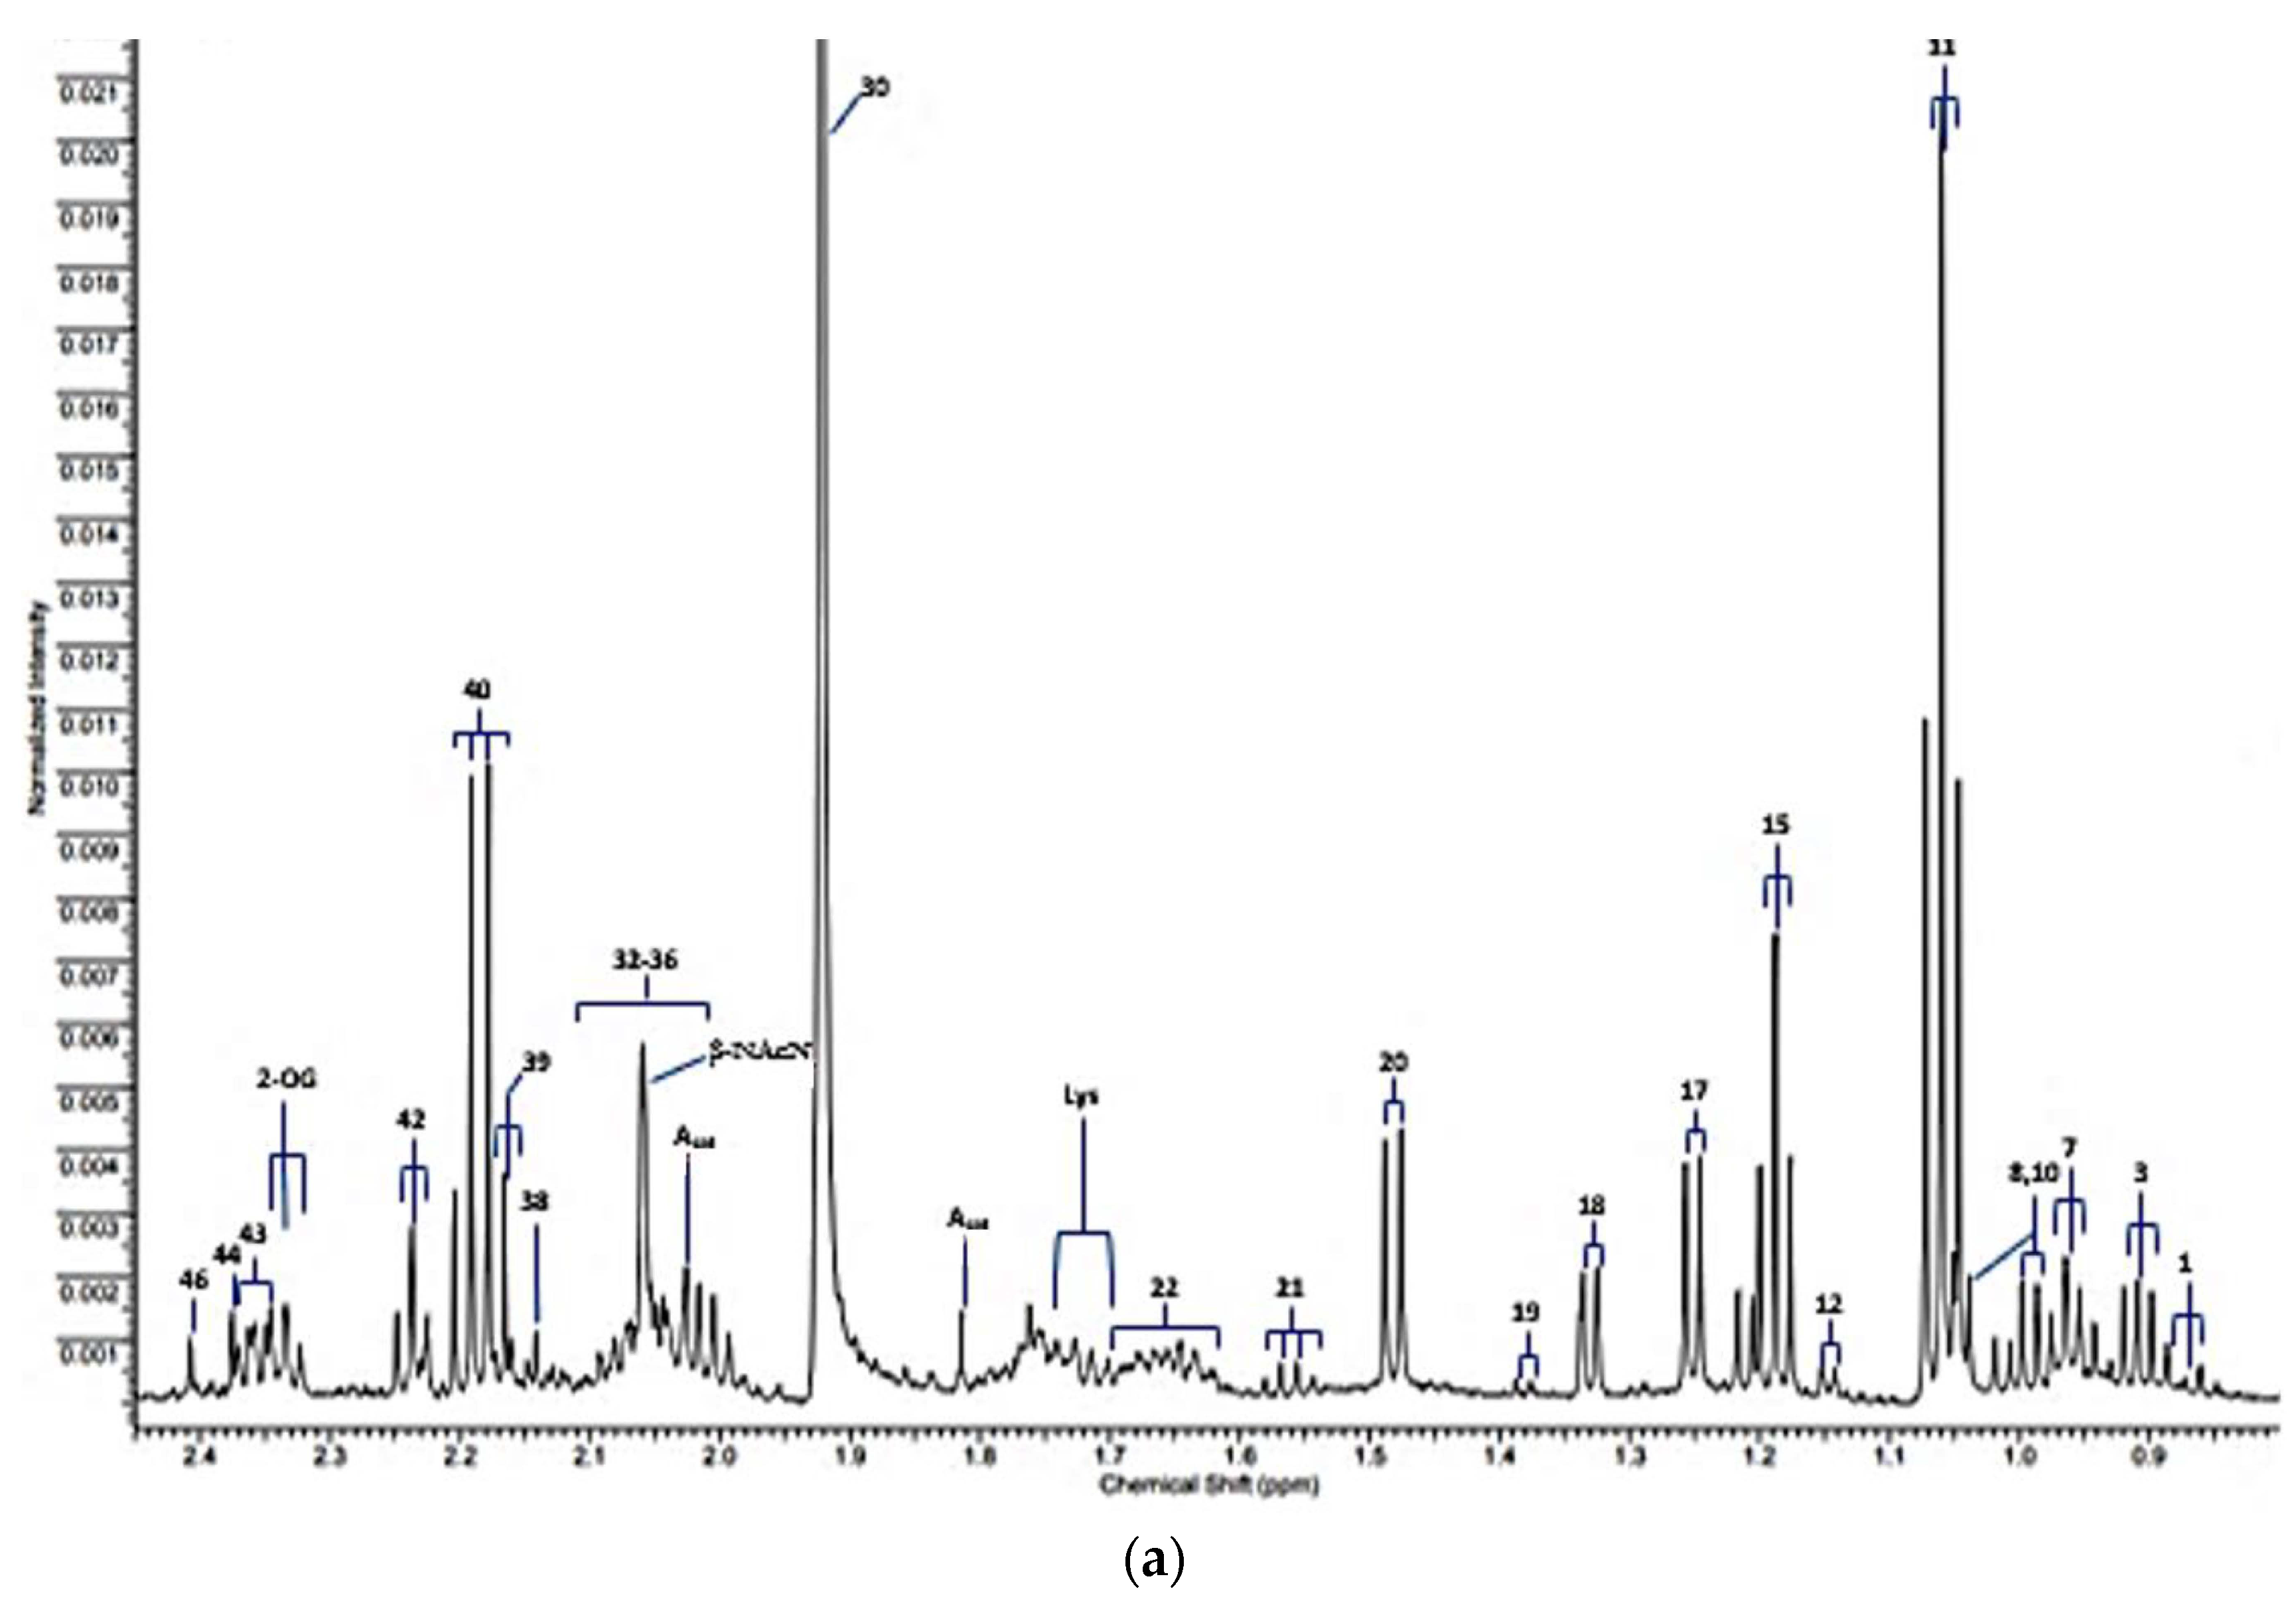
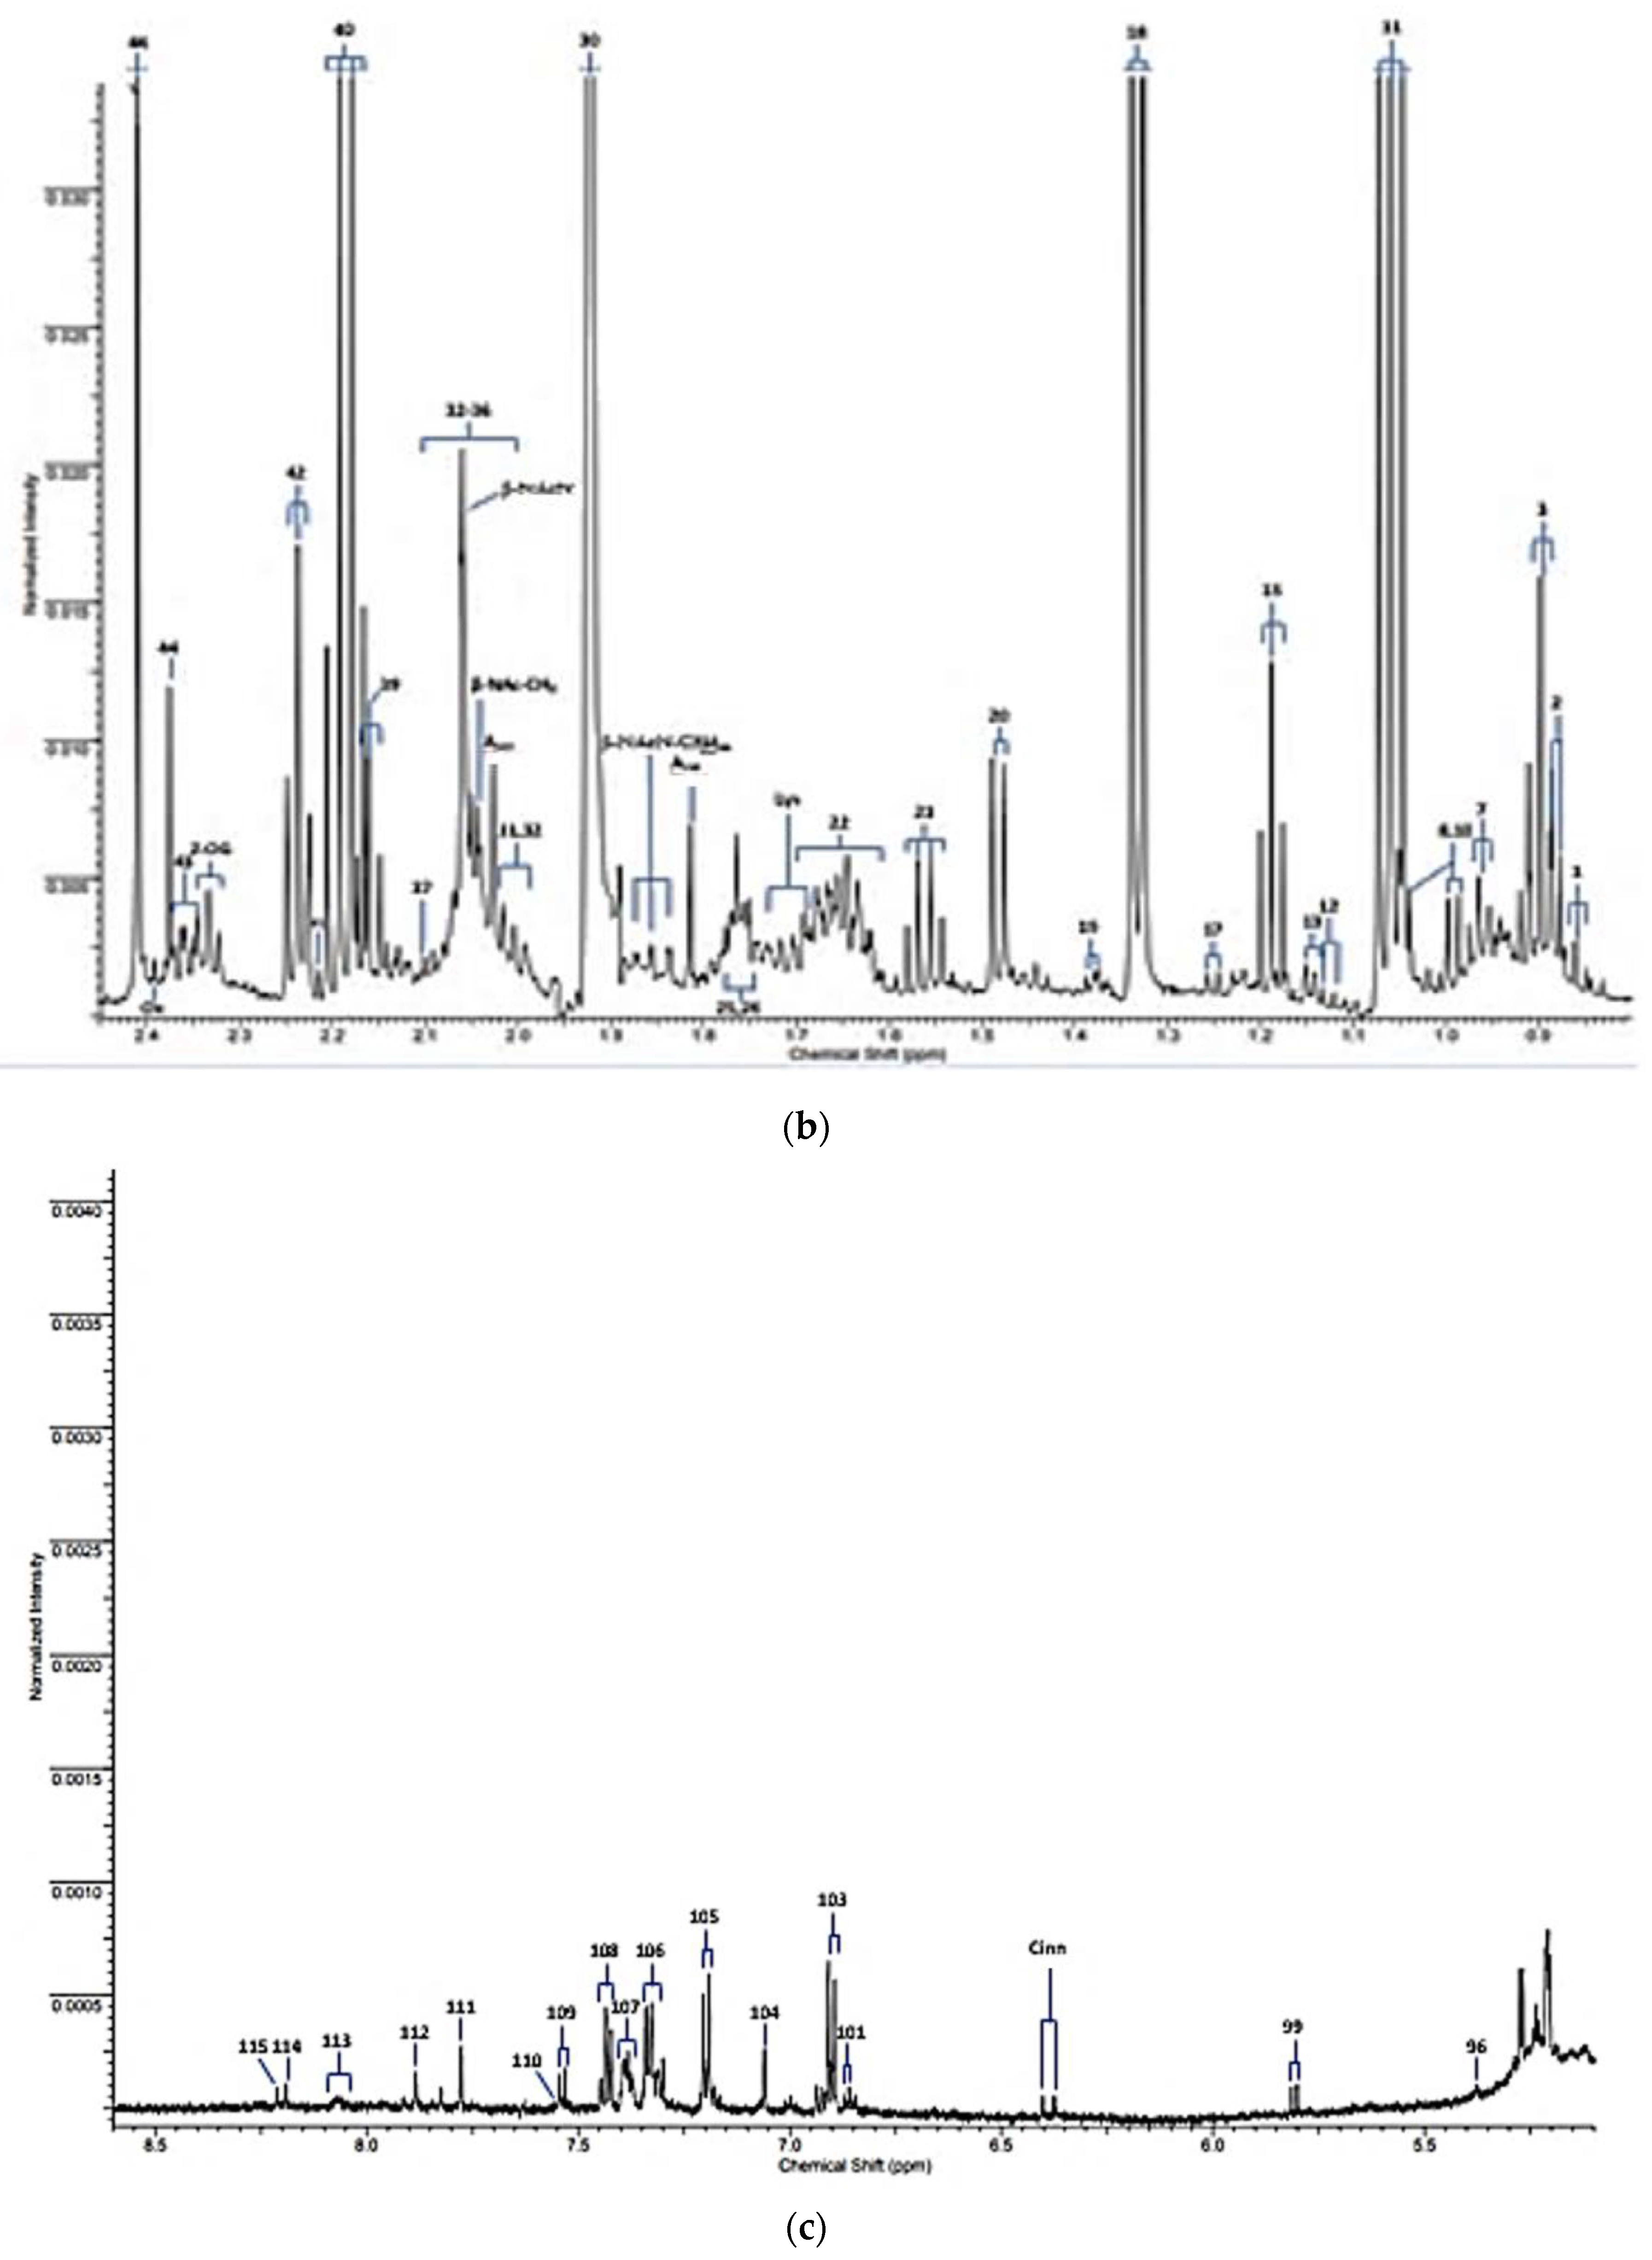
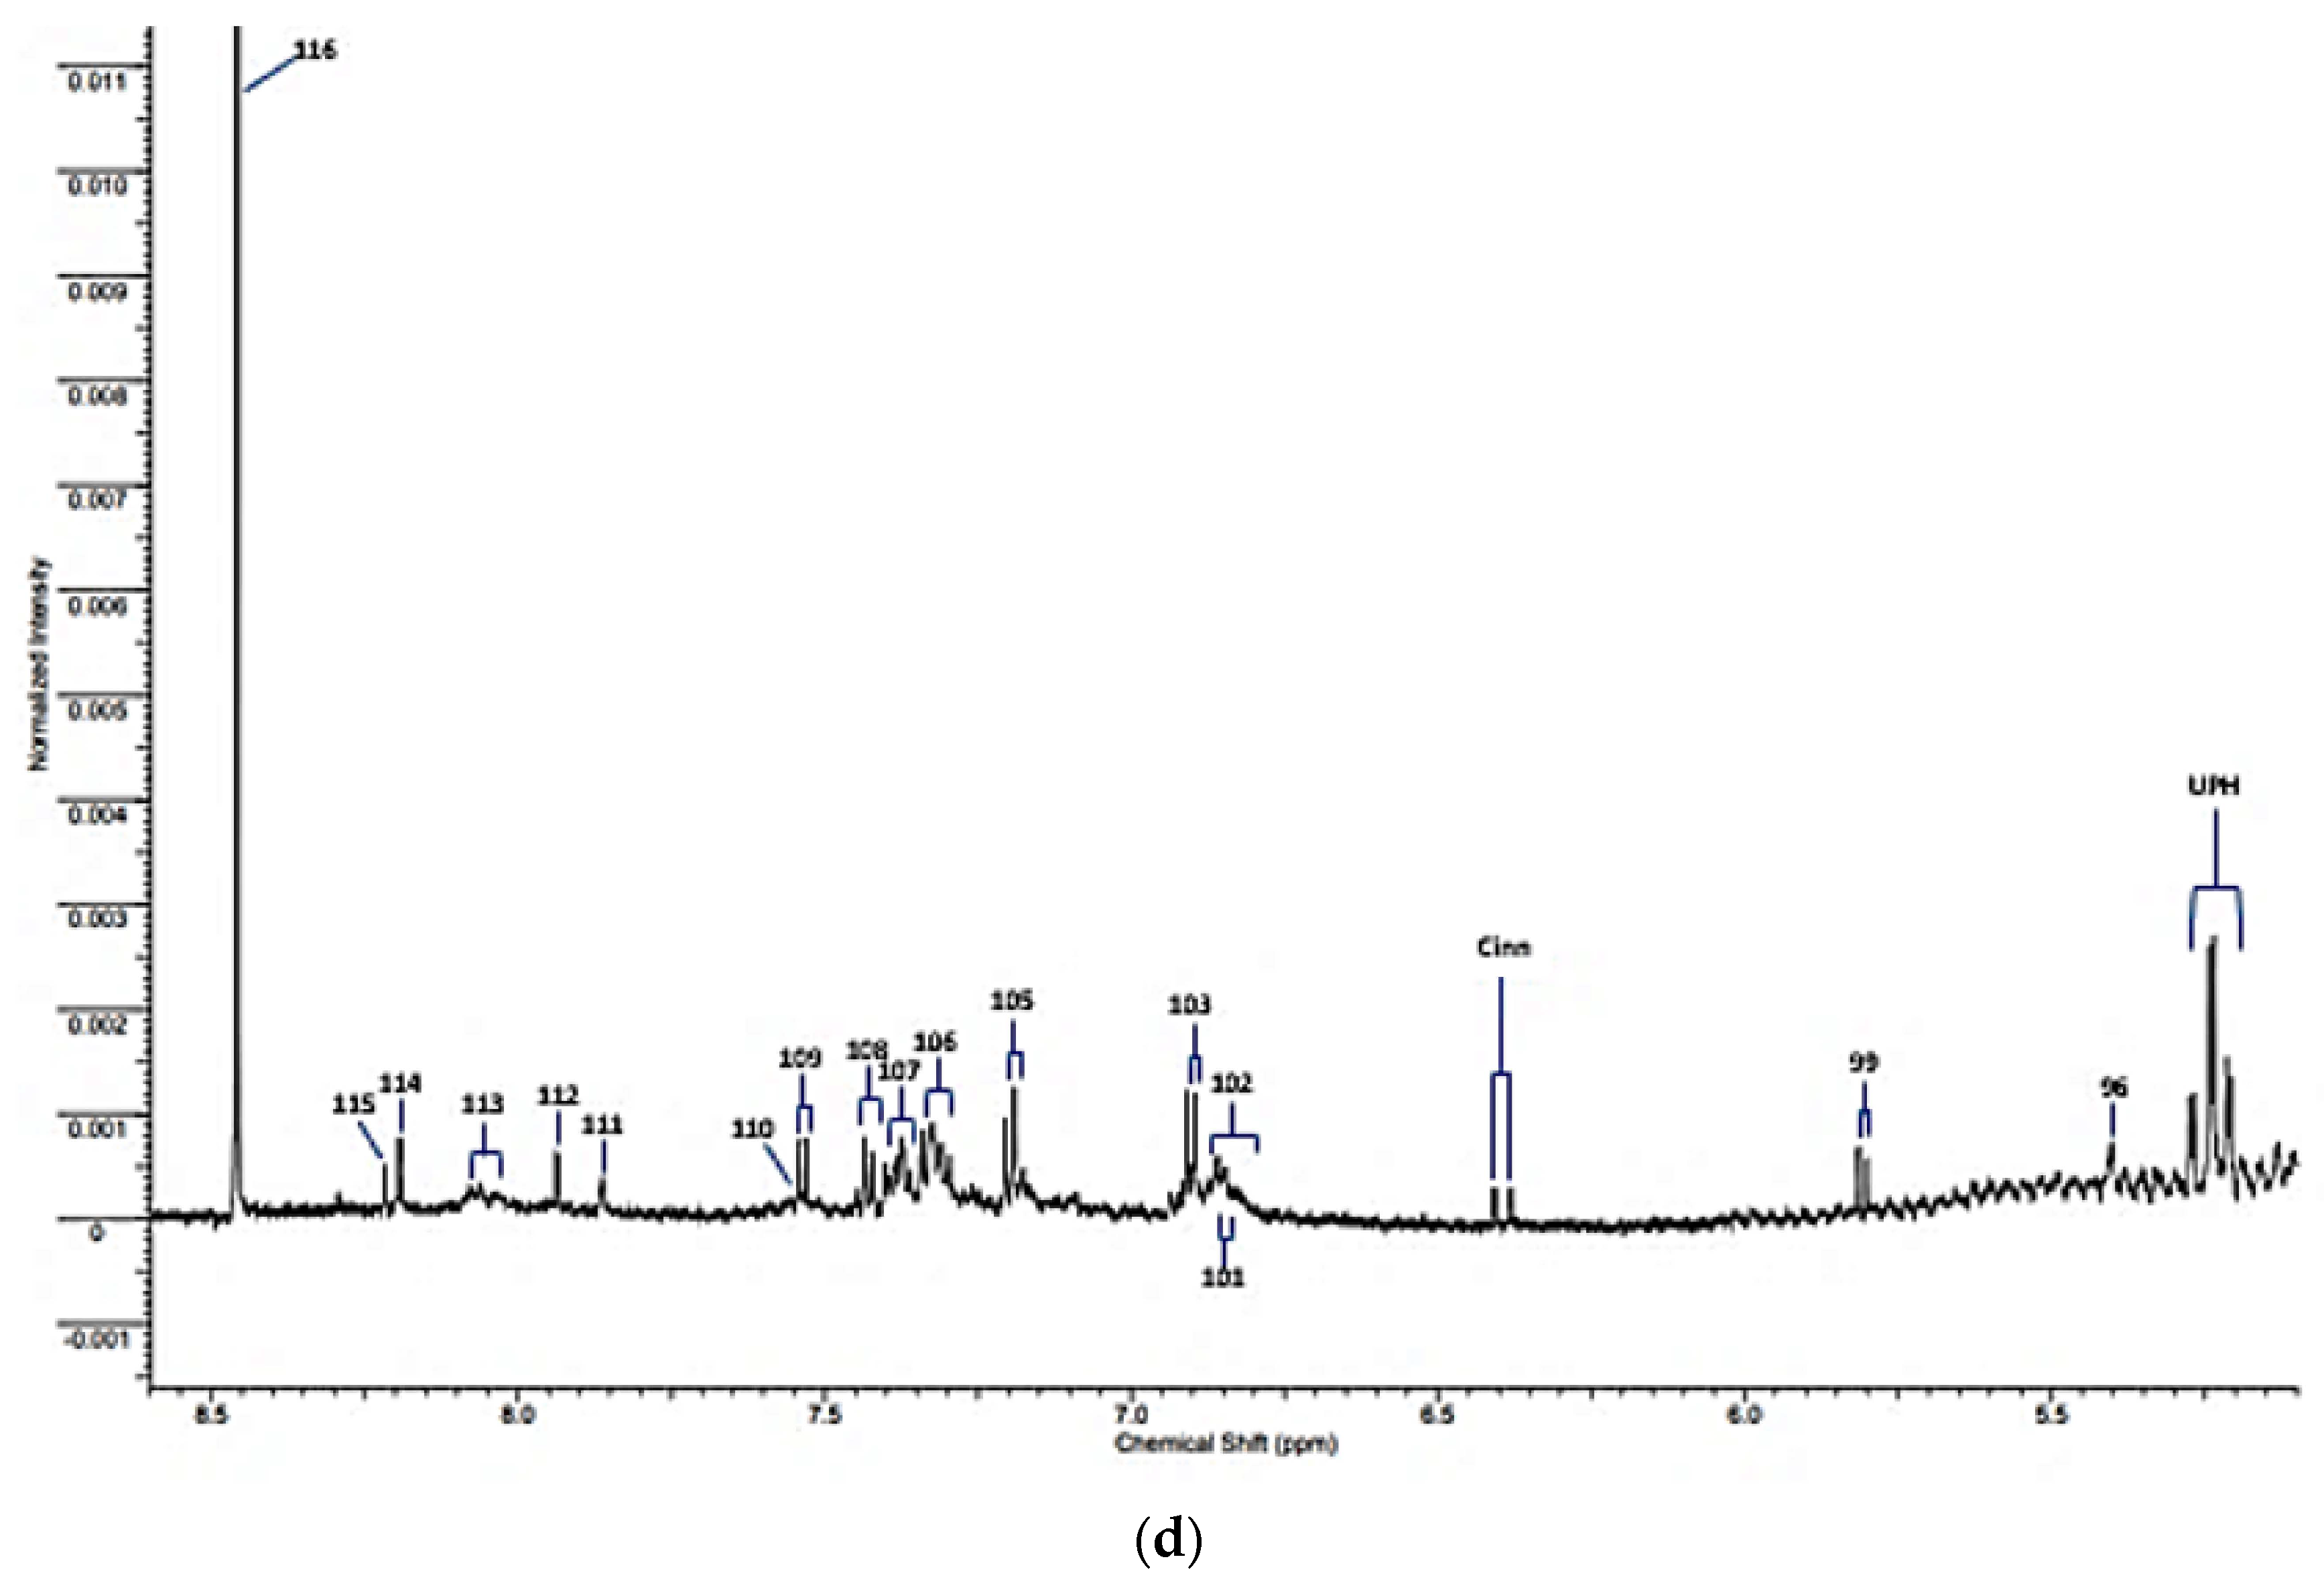
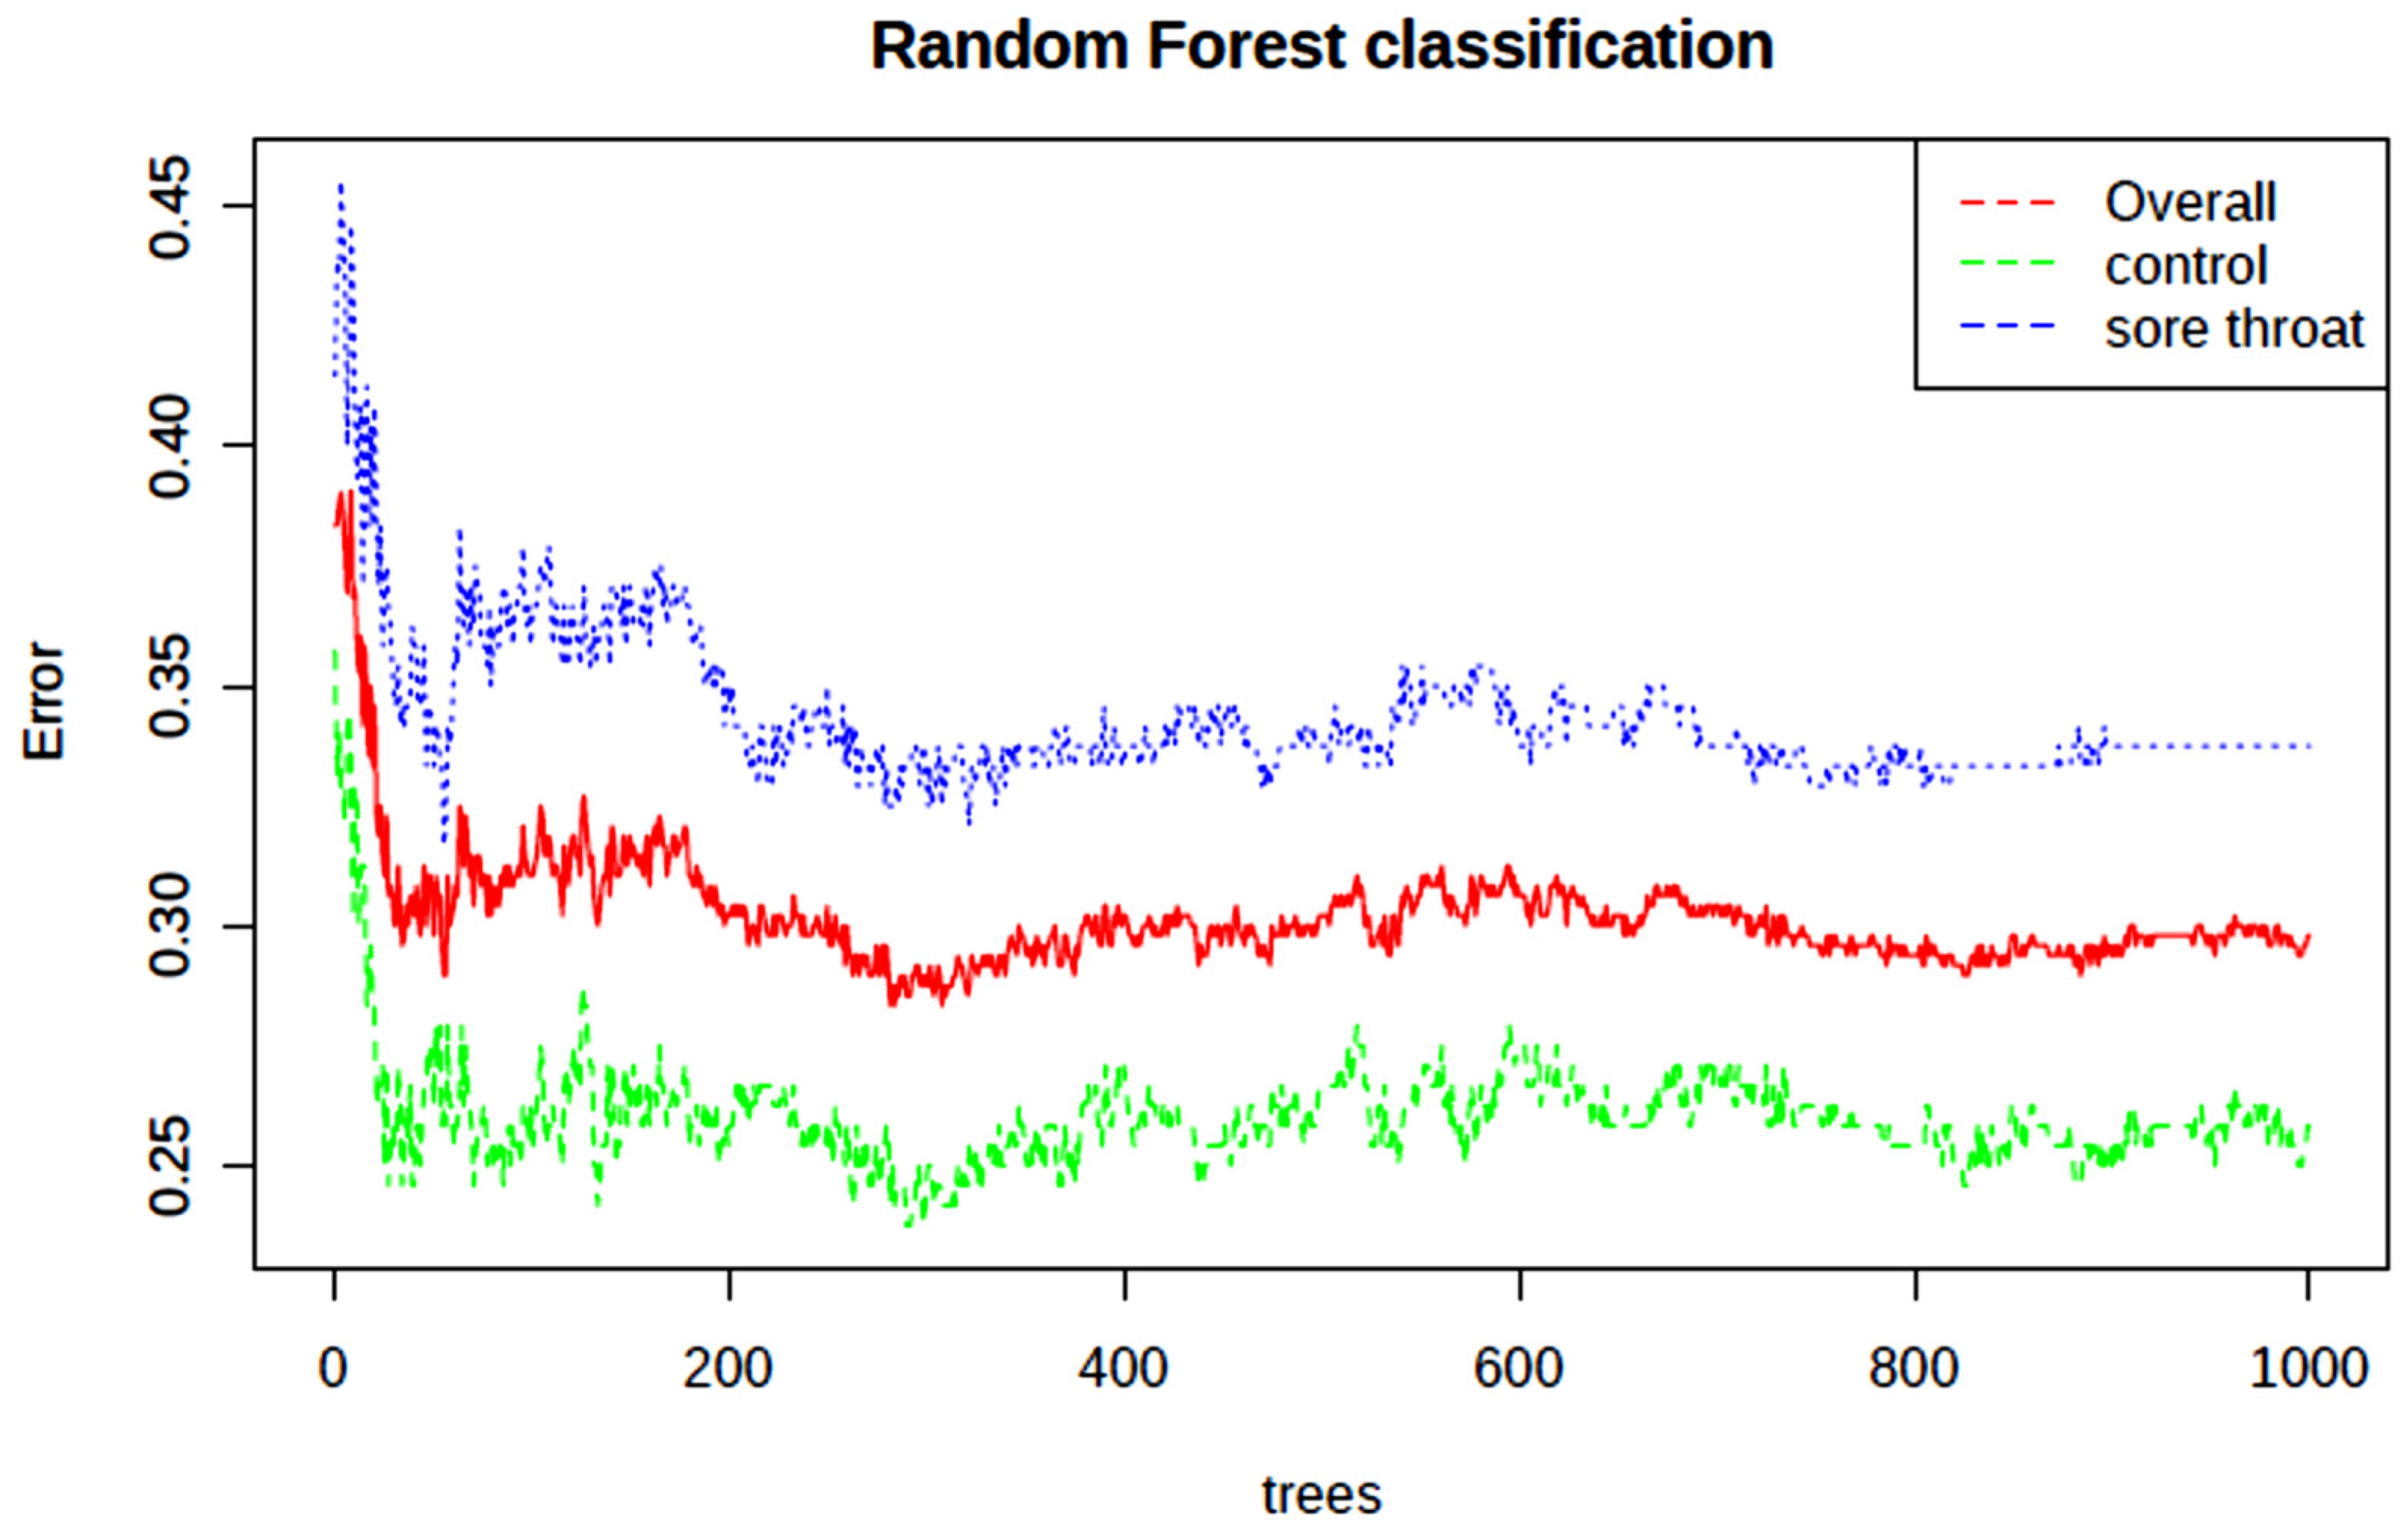
| Assignment Code | Chemical Shift (δ/ppm) | Coupling Pattern | Assignment |
|---|---|---|---|
| 1 | 0.861 | t | n-Caproate-CH3 |
| 2 | 0.885 | d | iso-Valerate-CH3′s |
| 3 | 0.893 | t | n-Butyrate-CH3 |
| 7 | 0.962 | t | Leucine-CH3 |
| 8 | 0.982/0.996 | 2 × d | Valine-CH3/Isoleucine-CH3 |
| 10 | 1.035 | d | Valine-CH3 |
| 11 | 1.058 | t | Propioniate-CH3 |
| 12 | 1.125 | d | iso-Butyrate-CH3 |
| 13 | 1.150 | d | 3-Amino-iso-butyrate-CH3 |
| 15 | 1.183 | t | Ethanol-CH3 |
| 16 | 1.211 | d | Methylmalonate-CH3/α-Fucose |
| 17 | 1.242 | d | 3-D-hydroxybutyrate-CH3/β-Fucose |
| 18 | 1.330 | d | Lactate-CH3 |
| 19 | 1.371 | d | Acetoin-CH3 |
| 20 | 1.486 | d | Alanine-CH3 |
| 21 | 1.551 | q | n-Butyrate-β-CH2 |
| 22 | 1.641 | m | 5-Aminovalerate-β,γ-CH2′s |
| Lys | 1.71 | m | Lysine-δ-CH2 |
| 25 | 1.76 | m | Putrescine-β-CH2 |
| 26 | 1.77 | m | Ornithine-β-CH2/Propane-1,3-diol-CH2-β-CH2 |
| Asat | 1.813/2.026 | 2 × s | Acetate-CH3 13C satellite signals |
| β-NAcN-C3Hax | 1.83 | pseudo-dd | β-N-Acetylneuraminate-C3H position axial proton |
| 30 | 1.92 | s | Acetate-CH3 |
| 31 | 1.954 | m | * 2-Hydroxyglutarate-γ-CH2 |
| 32 | 2.005 | m | Proline-γ-CH2/N-Acetylneuraminate-C3H |
| 33 | 2.02–2.080 | broad | Glycoprotein-/Hyaluronate-/Glycoprotein carbohydrate side-chain N-acetylsugar-NHCOCH3 functions |
| 34 | 2.025/2.030 | s | N-Acetylglutamate-/N-Acetylaspartate-NHCOCH3 (2 signals) |
| β-Nac-CH3 | 2.041 | s | β-N-Acetylglucosamine-NHCOCH3 |
| β-NacN | 2.06 | s | β-N-Acetylneuraminate-NHCOCH3 |
| 37 | 2.098 | s | Dimethylsulphide-S-CH3 |
| 38 | 2.140 | s | Methionone-S-CH3 |
| 39 | 2.164 | t | n-Butyrate-α-CH2 |
| 40 | 2.193 | q | Propioniate-CH2 |
| 41 | 2.215 | s | Acetone-CO-CH3 |
| 42 | 2.235 | t | 5-Aminovalerate-α-CH2 |
| AcAc | 2.27 | s | Acetocaetate-CH3 |
| 2-OG | 2.331 | t | 2-Oxoglutarate-4-CH2 |
| 43 | 2.334 | m | Glutamate-γ-CH2 |
| 44 | 2.377 | s | Pyruvate-CH3 |
| Ox | 2389 | s | Oxaloacetate-CH2 |
| 46 | 2.415 | s | Succinate-CH2 |
| α-Fuc | 5.209 | d | α-Fucose-C1H |
| α-Glc | 5.232 | d | α-Glucose-C1H |
| UPH | 5.24 | m | Unassigned polyhroxy- species |
| 96 | 5.392 | s | Allantoin-CH |
| Sucr | 5.414 | d | Sucrose-C1H |
| CD-CH=CH | 5.62 | m | Conjugated diene species olefinic proton |
| 97 | 5.67 | s | Unassigned |
| 98 | 5.79 | broad (s) | Urea-CO-NH2 |
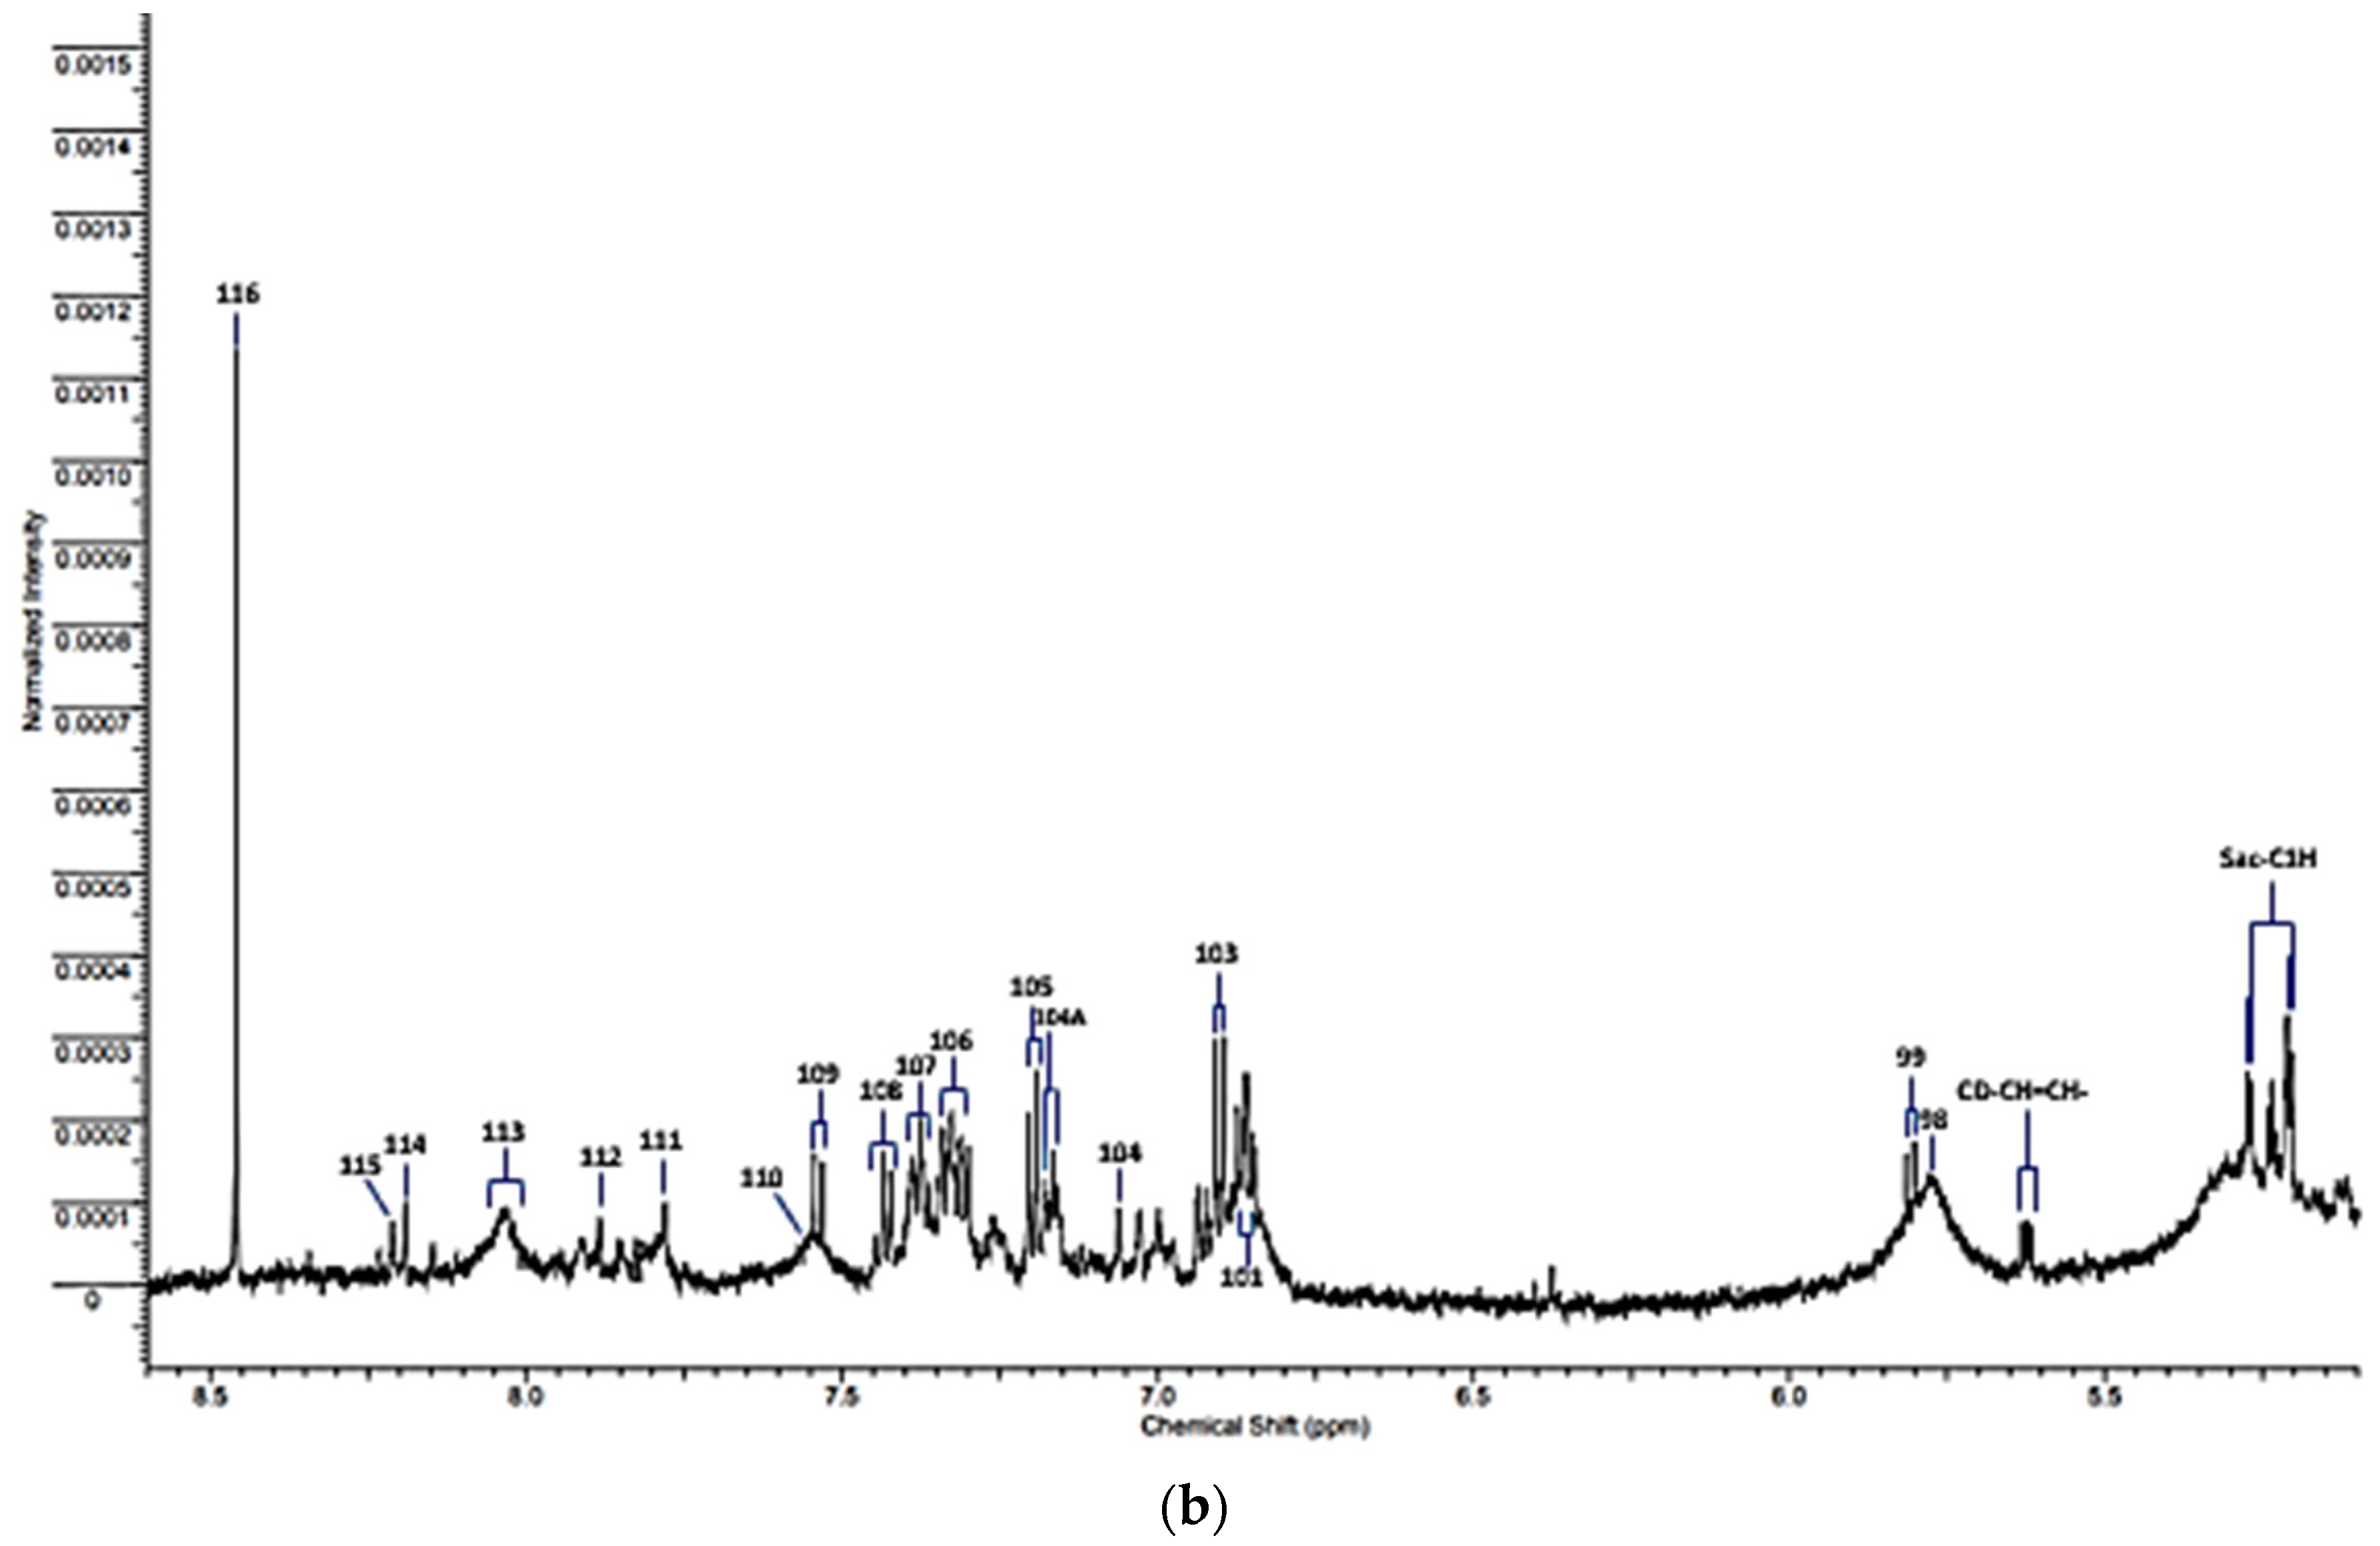
| 99 | 5.800 | d | Uracil-C2H |
| Cinn | 6.375 | d | Cinnamate derivative-CH=CH-Ar |
| 100 | 6.52 | s | Fumarate-CH=CH- |
| 101 | 6.84 | d | 4-Hydroxyphenylacaetate aromatic ring-C3H/C5H |
| 102 | 6.85 | broad | * Protein aromatic amino acid residue(s) |
| 103 | 6.880 | d | Tyrosine aromatic ring-C2H/C6H |
| 104 | 7.071 | s | Histidine imidazole ring-C5H |
| 104A | 7.155 | d | 4-hydroxyphenylacetate aromatic ring-C2H/C6H |
| 105 | 7.237 | d | Tyrosine aromatic ring-C3H/C5H |
| 106 | 7.320 | m | Phenylalanine aromatic Ring-C2H/C6H |
| 107 | 7.375 | m | Phenylalanine aromatic ring-C4H |
| 108 | 7.43 | m | Phenylalanine aromatic ring-C3H/C5H |
| 109 | 7.533 | d | Uracil-C1H |
| 110 | 7.552 | m | * Protein aromatic amino acid residue(s) |
| 111 | 7.812 | s | Histidine imidazole ring-C2H |
| 112 | 7.913 | s | 3-Methylhisitidine imidazole ring-C2H |
| 113 | 8.05 | 2 × broad signals | * Protein aromatic amino acid residue(s) |
| 114 | 8.175 | s | Hypoxanthine-C8H |
| 115 | 8.219 | s | Hypoxanthine-C3H |
| 116 | 8.456 | s | Formate-CH |
| Metabolic Pathway | Total Metabolites | No. of Hits | FDR | Impact |
|---|---|---|---|---|
| Arginine and proline metabolism | 38 | 2 | 7.94 × 10−39 | 0.09 |
| Alanine, aspartate and glutamate metabolism | 28 | 4 | 3.38 × 10⁻³⁴ | 0.31 |
| Cysteine and methionine metabolism | 33 | 1 | 6.94 × 10⁻¹³ | 0.00 |
| Glyoxylate and dicarboxylate metabolism | 32 | 4 | 6.94 × 10⁻¹³ | 0.11 |
| Histidine metabolism | 16 | 1 | 2.50 × 10⁻¹² | 0.00 |
| Nitrogen metabolism | 6 | 2 | 1.99 × 10⁻¹¹ | 0.00 |
| Pyruvate metabolism | 22 | 2 | 1.99 × 10⁻¹¹ | 0.21 |
| Glycolysis/Gluconeogenesis | 26 | 2 | 1.99 × 10⁻¹¹ | 0.10 |
| Butanoate metabolism | 15 | 2 | 2.27 × 10⁻¹¹ | 0.00 |
| Glutathione metabolism | 28 | 2 | 7.18 × 10⁻¹¹ | 0.10 |
Disclaimer/Publisher’s Note: The statements, opinions and data contained in all publications are solely those of the individual author(s) and contributor(s) and not of MDPI and/or the editor(s). MDPI and/or the editor(s) disclaim responsibility for any injury to people or property resulting from any ideas, methods, instructions or products referred to in the content. |
© 2023 by the authors. Licensee MDPI, Basel, Switzerland. This article is an open access article distributed under the terms and conditions of the Creative Commons Attribution (CC BY) license (https://creativecommons.org/licenses/by/4.0/).
Share and Cite
Grootveld, M.; Page, G.; Bhogadia, M.; Hunwin, K.; Edgar, M. Updates and Original Case Studies Focused on the NMR-Linked Metabolomics Analysis of Human Oral Fluids Part III: Implementations for the Diagnosis of Non-Cancerous Disorders, Both Oral and Systemic. Metabolites 2023, 13, 66. https://doi.org/10.3390/metabo13010066
Grootveld M, Page G, Bhogadia M, Hunwin K, Edgar M. Updates and Original Case Studies Focused on the NMR-Linked Metabolomics Analysis of Human Oral Fluids Part III: Implementations for the Diagnosis of Non-Cancerous Disorders, Both Oral and Systemic. Metabolites. 2023; 13(1):66. https://doi.org/10.3390/metabo13010066
Chicago/Turabian StyleGrootveld, Martin, Georgina Page, Mohammed Bhogadia, Kayleigh Hunwin, and Mark Edgar. 2023. "Updates and Original Case Studies Focused on the NMR-Linked Metabolomics Analysis of Human Oral Fluids Part III: Implementations for the Diagnosis of Non-Cancerous Disorders, Both Oral and Systemic" Metabolites 13, no. 1: 66. https://doi.org/10.3390/metabo13010066