
Multi-Tissue Time-Domain NMR Metabolomics Investigation of Time-Restricted Feeding in Male and Female Nile Grass Rats

 , , , and
Abstract
:
1. Introduction
2. Results
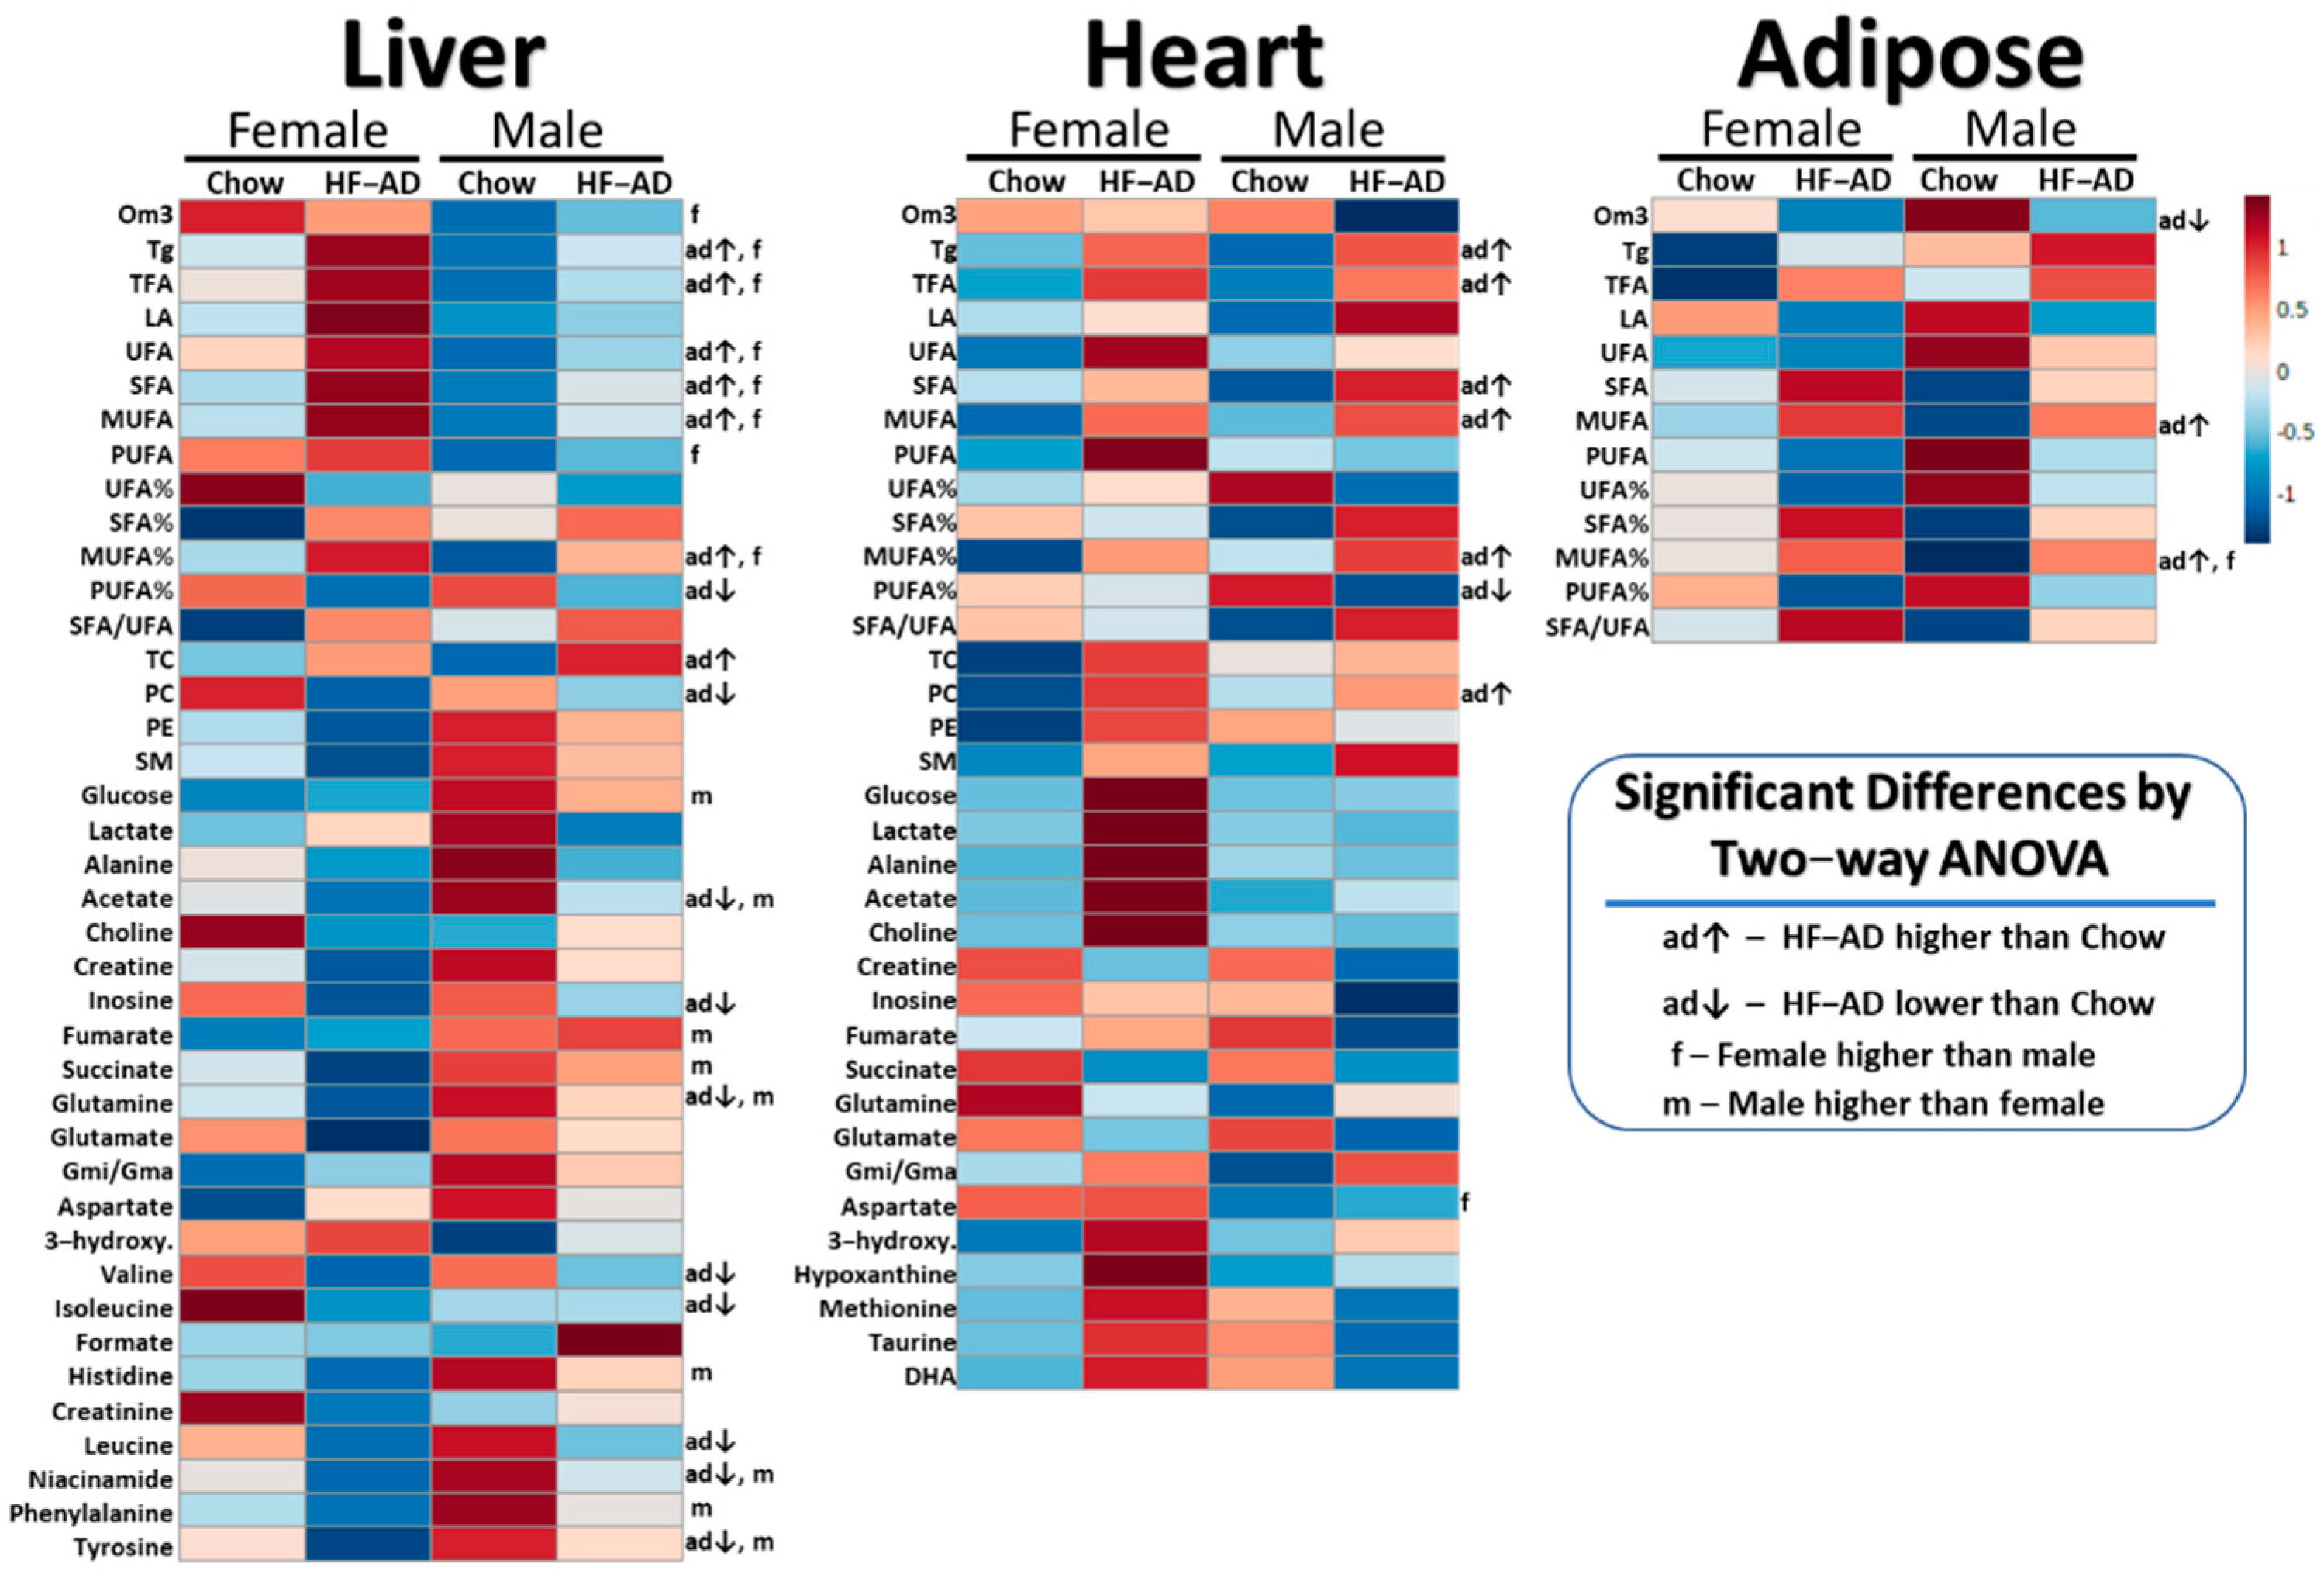
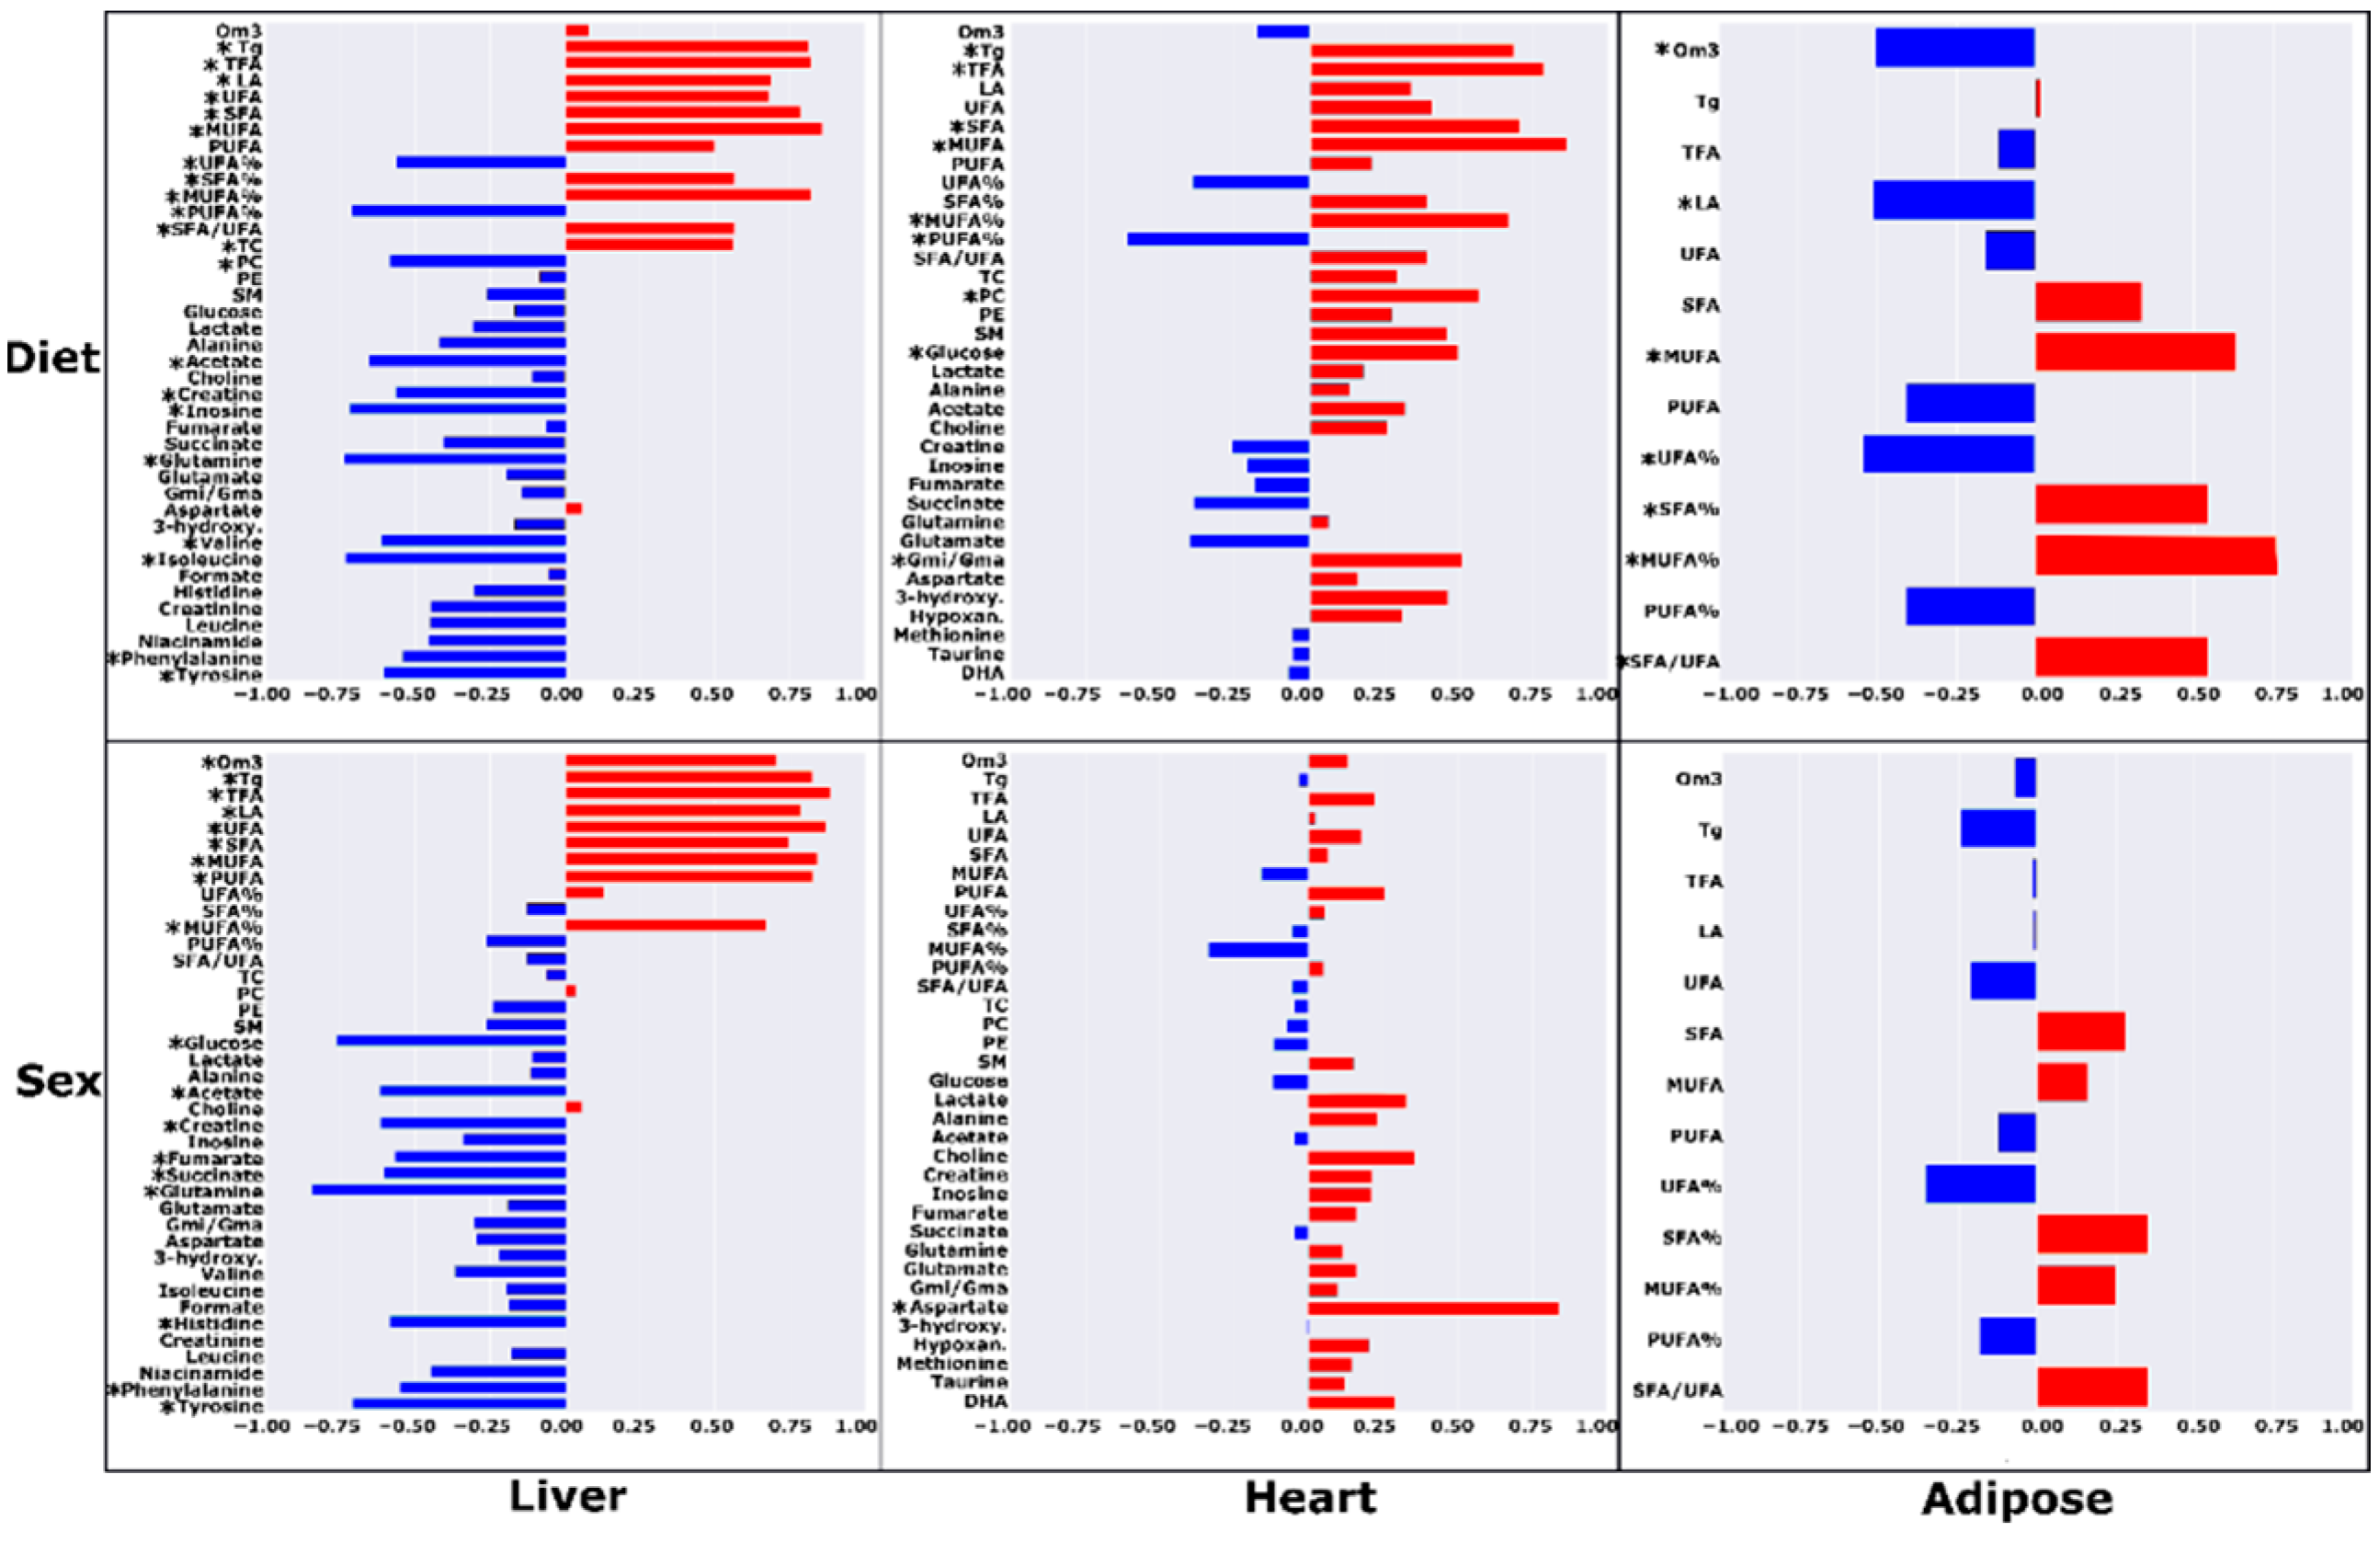
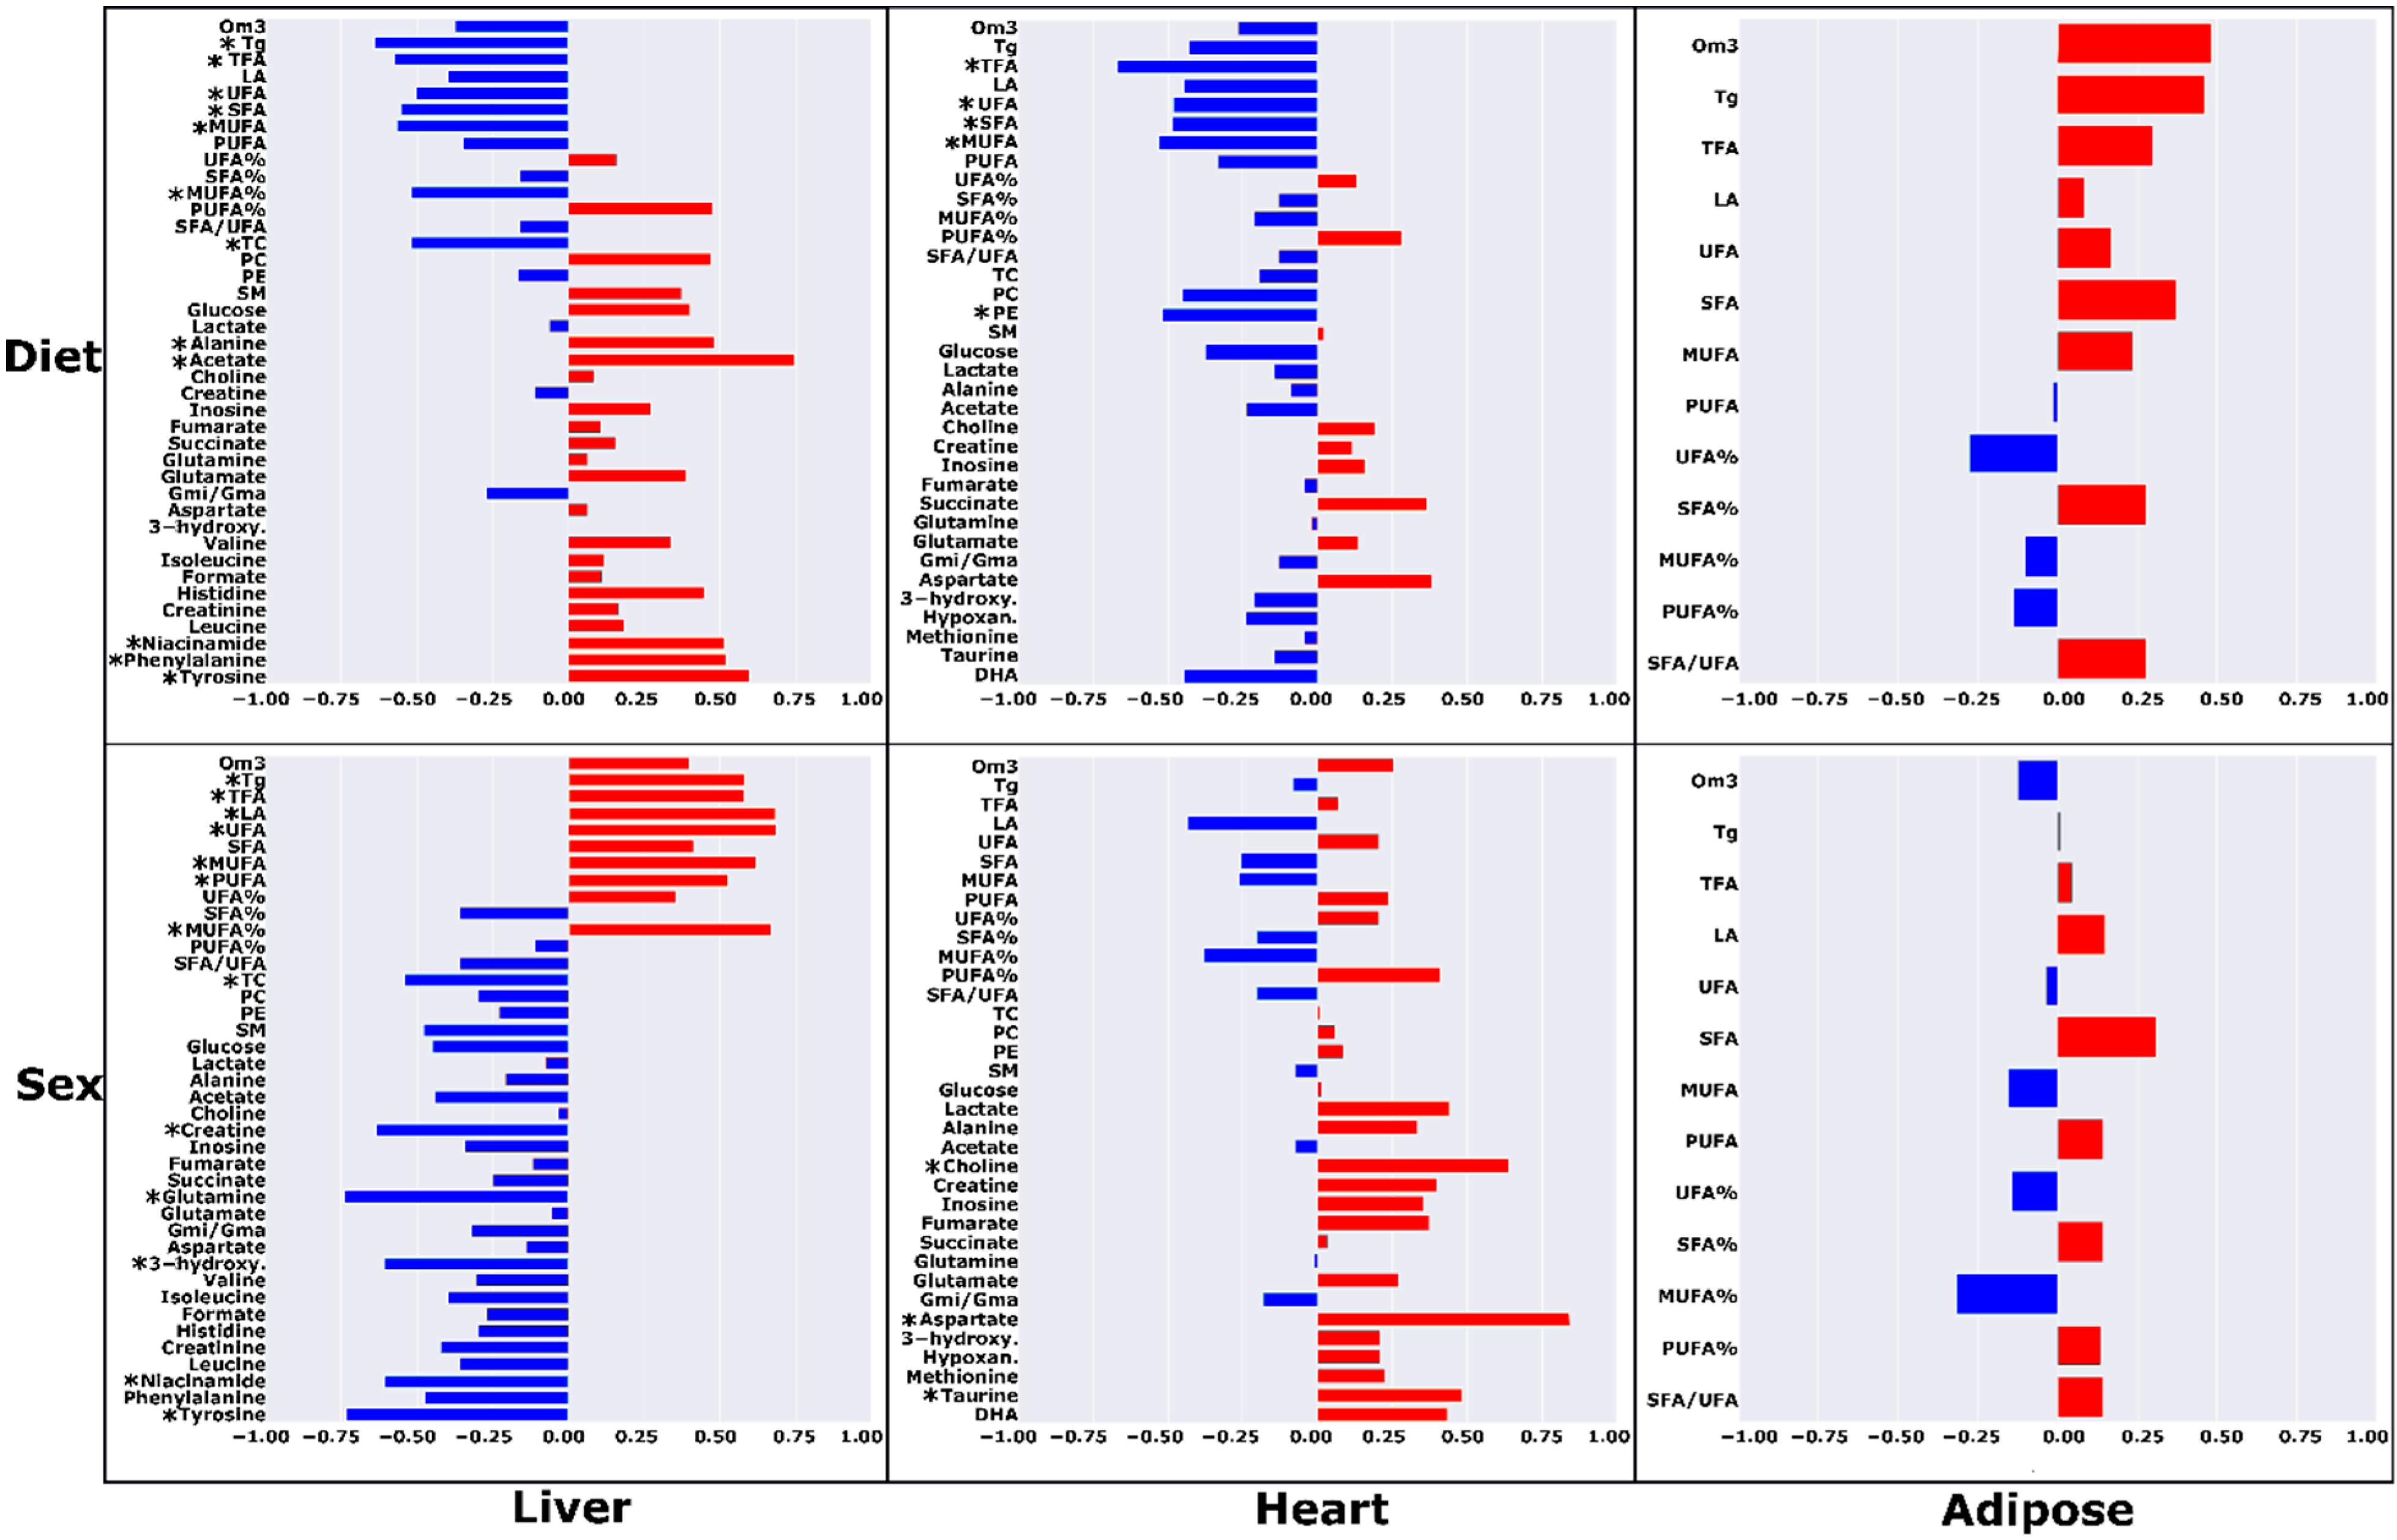
2.1. High-Fat Ad Libitum versus Chow
2.2. High-Fat Ad Libitum Sex Differences
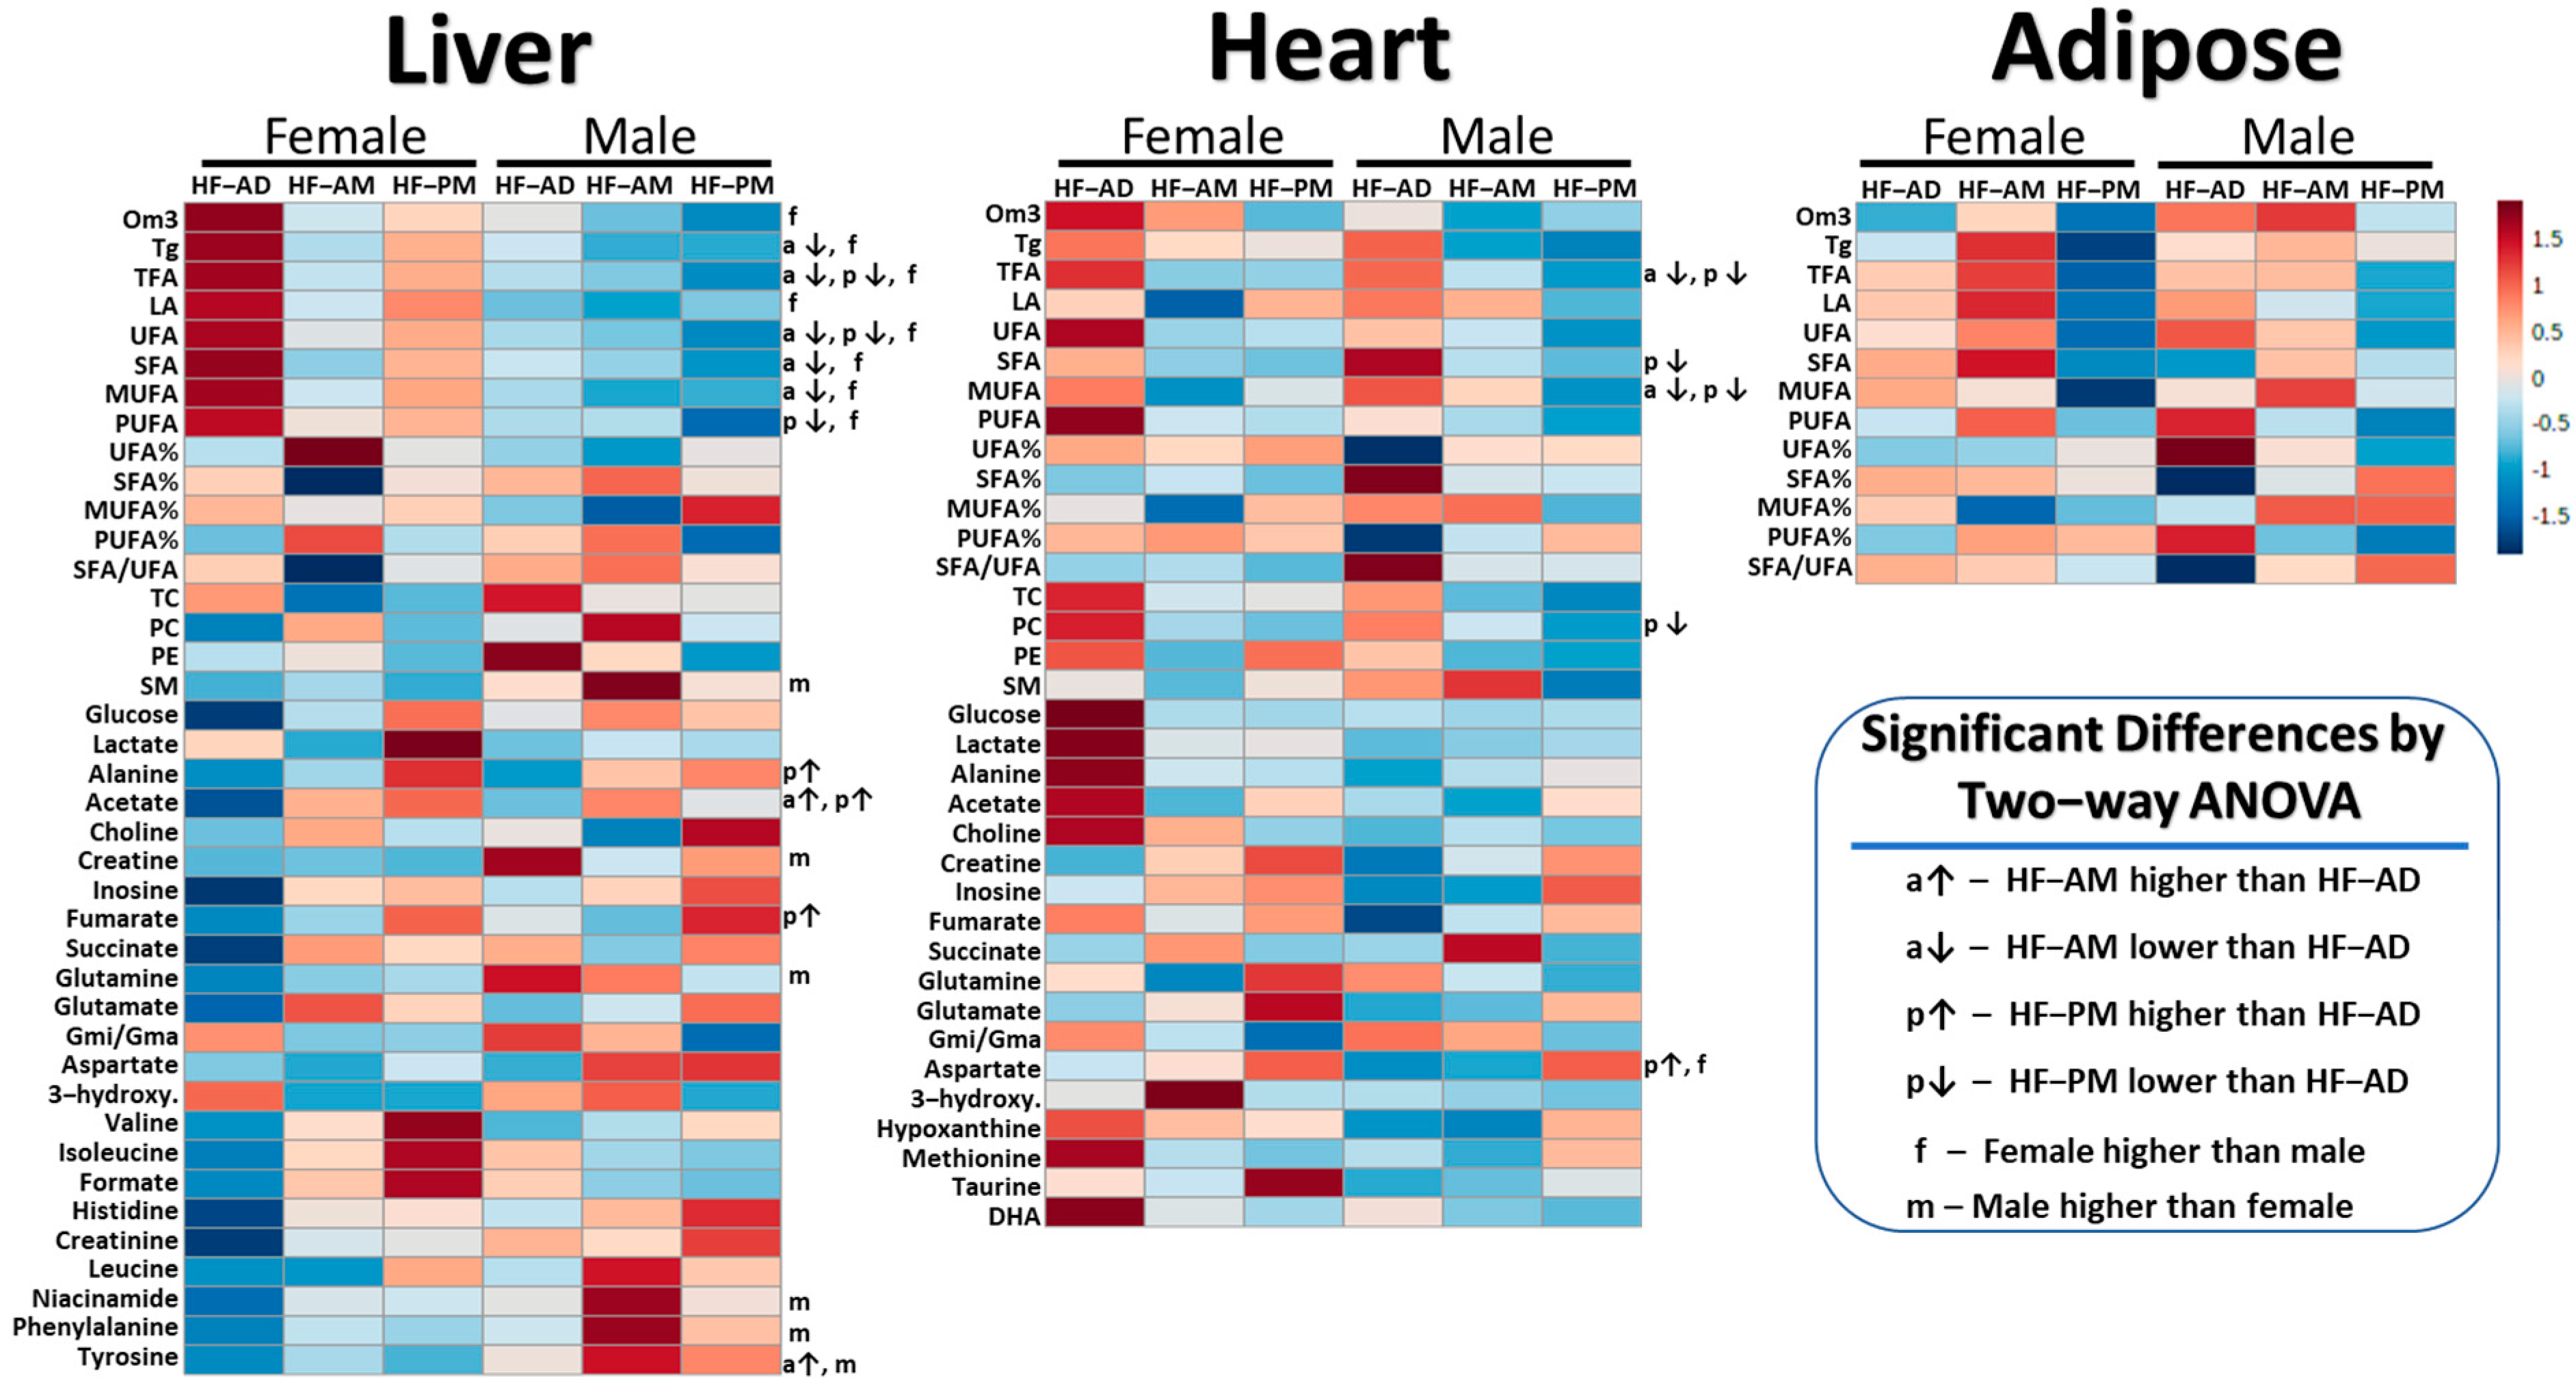
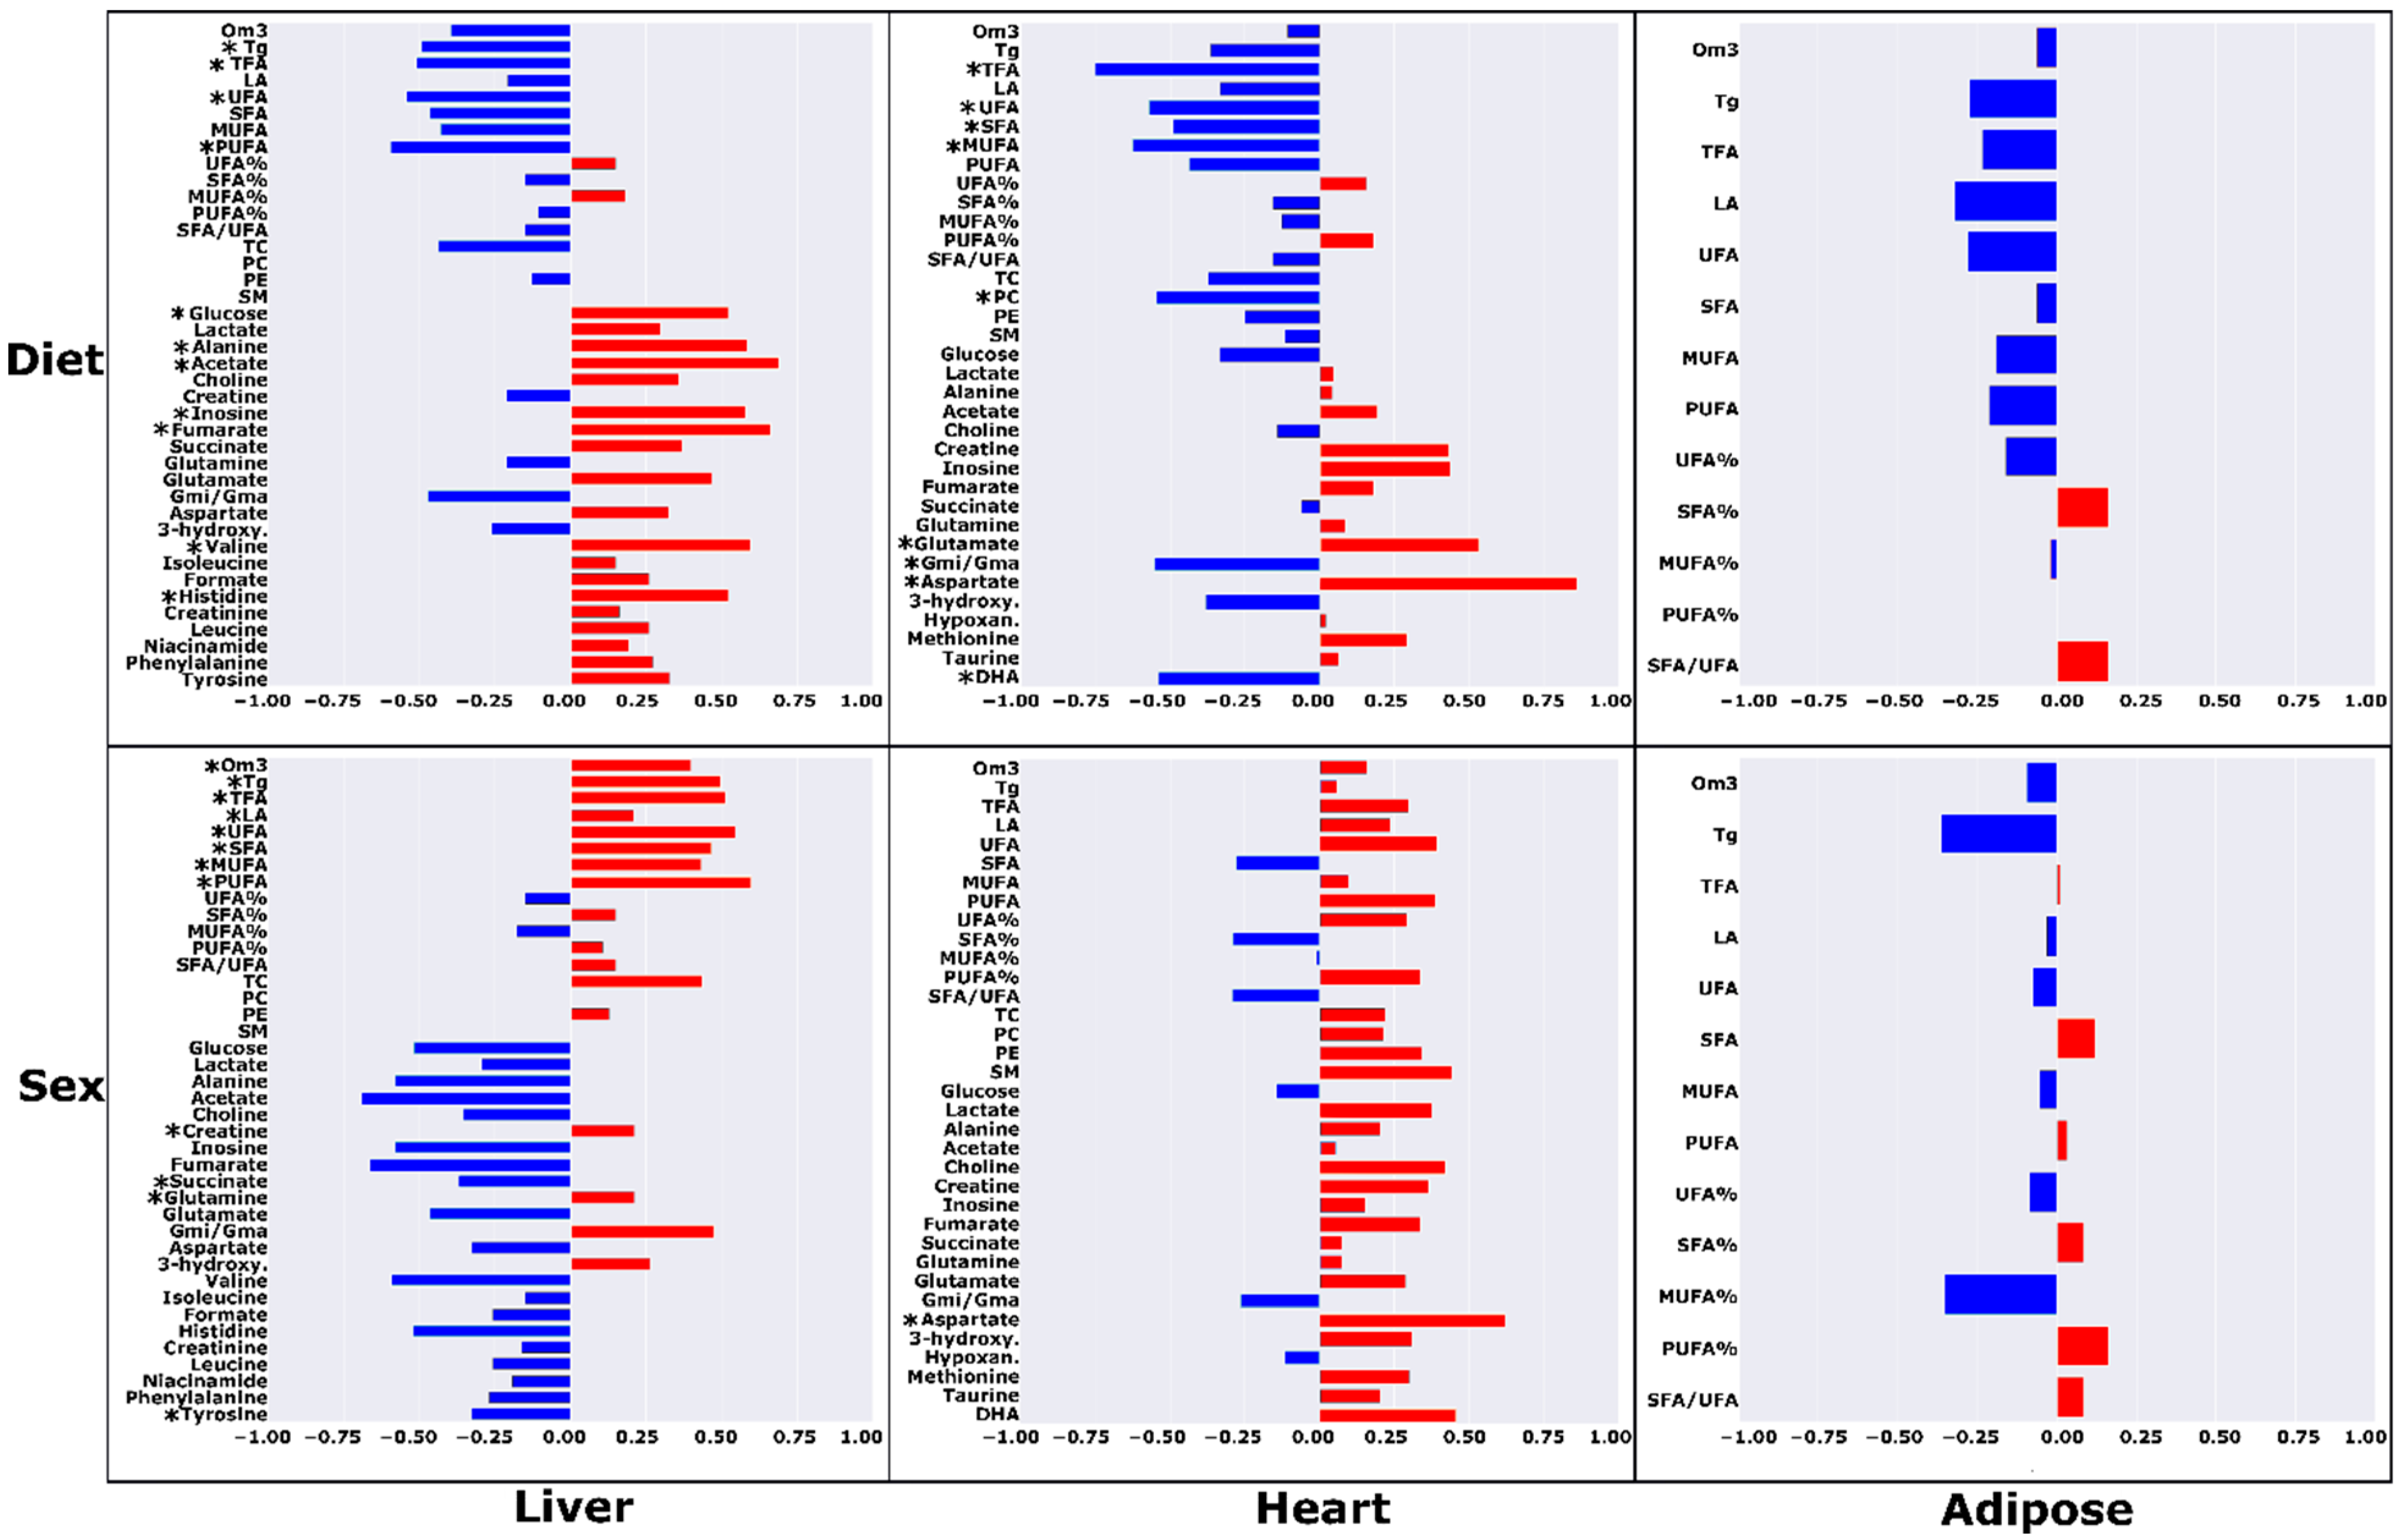
2.3. High-Fat TRF versus Ad Libitum
2.4. TRF Sex Differences
3. Discussion
3.1. Chow vs. HF-AD Diet Comparison
3.2. TRF vs. HF-AD Diet Comparison
3.3. Sex-Dependent Differences
3.4. Limitations
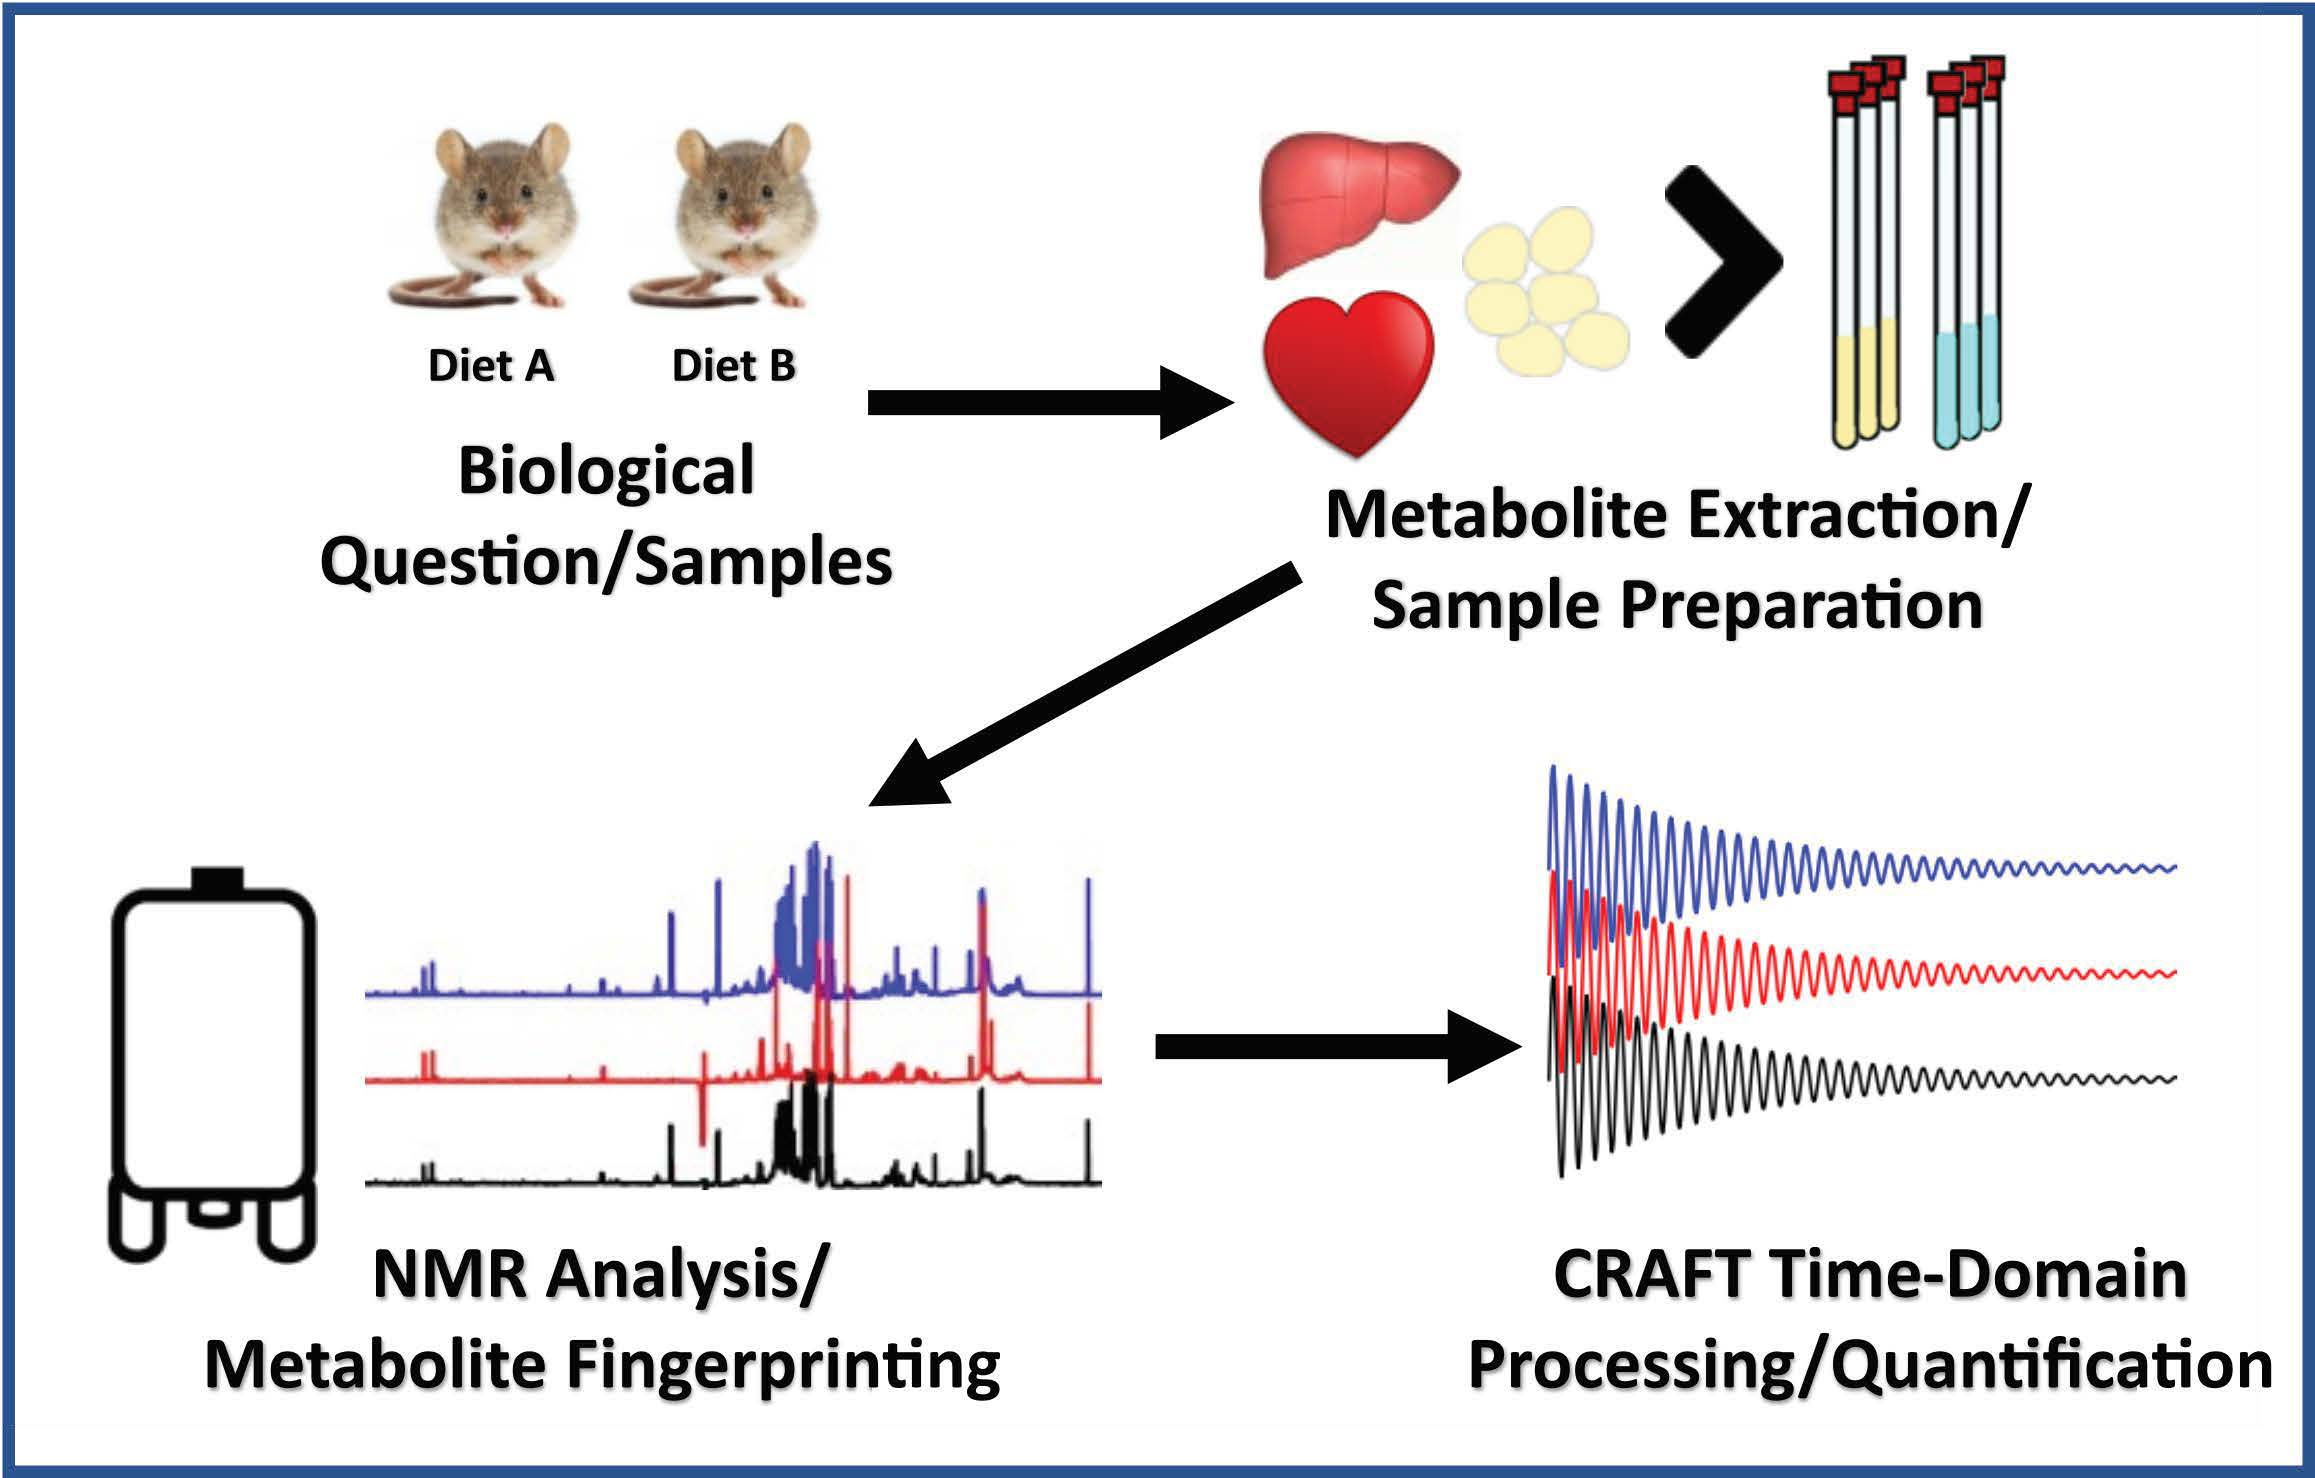
4. Materials and Methods
4.1. Animals
4.2. NMR Experiments
4.3. Multi-Tissue Metabolomics
4.4. Statistical Analysis
5. Conclusions
Author Contributions
Funding
Institutional Review Board Statement
Data Availability Statement
Acknowledgments
Conflicts of Interest
References
- Hirode, G.; Wong, R.J. Trends in the Prevalence of Metabolic Syndrome in the United States, 2011–2016. JAMA 2020, 323, 2526–2528. [Google Scholar] [CrossRef] [PubMed]
- Saklayen, M.G. The Global Epidemic of the Metabolic Syndrome. Curr. Hypertens. Rep. 2018, 20, 12. [Google Scholar] [CrossRef] [PubMed] [Green Version]
- Zhou, L.Y.; Deng, M.Q.; Zhang, Q.; Xiao, X.H. Early-life nutrition and metabolic disorders in later life: A new perspective on energy metabolism. Chin. Med. J. 2020, 133, 1961–1970. [Google Scholar] [CrossRef] [PubMed]
- Nilsson, P.M.; Tuomilehto, J.; Ryden, L. The metabolic syndrome—What is it and how should it be managed? Eur. J. Prev. Cardiol. 2019, 26, 33–46. [Google Scholar] [CrossRef] [PubMed]
- Wong, S.K.; Chin, K.Y.; Suhaimi, F.H.; Fairus, A.; Ima-Nirwana, S. Animal models of metabolic syndrome: A review. Nutr. Metab. 2016, 13, 65. [Google Scholar] [CrossRef] [Green Version]
- Hoyas, I.; Leon-Sanz, M. Nutritional Challenges in Metabolic Syndrome. J. Clin. Med. 2019, 8, 1301. [Google Scholar] [CrossRef] [Green Version]
- Regmi, P.; Heilbronn, L.K. Time-Restricted Eating: Benefits, Mechanisms, and Challenges in Translation. iScience 2020, 23, 101161. [Google Scholar] [CrossRef]
- Rothschild, J.; Hoddy, K.K.; Jambazian, P.; Varady, K.A. Time-restricted feeding and risk of metabolic disease: A review of human and animal studies. Nutr. Rev. 2014, 72, 308–318. [Google Scholar] [CrossRef]
- Adafer, R.; Messaadi, W.; Meddahi, M.; Patey, A.; Haderbache, A.; Bayen, S.; Messaadi, N. Food Timing, Circadian Rhythm and Chrononutrition: A Systematic Review of Time-Restricted Eating’s Effects on Human Health. Nutrients 2020, 12, 3770. [Google Scholar] [CrossRef]
- Che, T.; Yan, C.; Tian, D.; Zhang, X.; Liu, X.; Wu, Z. Time-restricted feeding improves blood glucose and insulin sensitivity in overweight patients with type 2 diabetes: A randomised controlled trial. Nutr. Metab. 2021, 18, 88. [Google Scholar] [CrossRef]
- Greenwell, B.J.; Trott, A.J.; Beytebiere, J.R.; Pao, S.; Bosley, A.; Beach, E.; Finegan, P.; Hernandez, C.; Menet, J.S. Rhythmic Food Intake Drives Rhythmic Gene Expression More Potently than the Hepatic Circadian Clock in Mice. Cell. Rep. 2019, 27, 649–657.e645. [Google Scholar] [CrossRef] [PubMed] [Green Version]
- Weger, B.D.; Gobet, C.; David, F.P.A.; Atger, F.; Martin, E.; Phillips, N.E.; Charpagne, A.; Weger, M.; Naef, F.; Gachon, F. Systematic analysis of differential rhythmic liver gene expression mediated by the circadian clock and feeding rhythms. Proc. Natl. Acad. Sci. USA 2021, 118, e2015803118. [Google Scholar] [CrossRef] [PubMed]
- Świątkiewicz, I.; Woźniak, A.; Taub, P.R. Time-Restricted Eating and Metabolic Syndrome: Current Status and Future Perspectives. Nutrients 2021, 13, 221. [Google Scholar] [CrossRef] [PubMed]
- Wilkinson, M.J.; Manoogian, E.N.C.; Zadourian, A.; Lo, H.; Fakhouri, S.; Shoghi, A.; Wang, X.; Fleischer, J.G.; Navlakha, S.; Panda, S.; et al. Ten-Hour Time-Restricted Eating Reduces Weight, Blood Pressure, and Atherogenic Lipids in Patients with Metabolic Syndrome. Cell. Metab. 2020, 31, 92–104.e105. [Google Scholar] [CrossRef] [PubMed]
- Shi, D.; Chen, J.; Wang, J.; Yao, J.; Huang, Y.; Zhang, G.; Bao, Z. Circadian Clock Genes in the Metabolism of Non-alcoholic Fatty Liver Disease. Front. Physiol. 2019, 10, 423. [Google Scholar] [CrossRef] [PubMed] [Green Version]
- Chait, A.; den Hartigh, L.J. Adipose Tissue Distribution, Inflammation and Its Metabolic Consequences, Including Diabetes and Cardiovascular Disease. Front. Cardiovasc. Med. 2020, 7, 22. [Google Scholar] [CrossRef] [Green Version]
- Ferrero, K.M.; Koch, W.J. Metabolic Crosstalk between the Heart and Fat. Korean Circ. J. 2020, 50, 379–394. [Google Scholar] [CrossRef]
- Grundy, S.M. Adipose tissue and metabolic syndrome: Too much, too little or neither. Eur. J. Clin. Investig. 2015, 45, 1209–1217. [Google Scholar] [CrossRef] [Green Version]
- Kim, J.B. Dynamic cross talk between metabolic organs in obesity and metabolic diseases. Exp. Mol. Med. 2016, 48, e214. [Google Scholar] [CrossRef] [Green Version]
- Nakamura, M.; Sadoshima, J. Heart over mind: Metabolic control of white adipose tissue and liver. EMBO Mol. Med. 2014, 6, 1521–1524. [Google Scholar] [CrossRef]
- Romero, A.; Eckel, J. Organ Crosstalk and the Modulation of Insulin Signaling. Cells 2021, 10, 2082. [Google Scholar] [CrossRef]
- Guasch-Ferre, M.; Bhupathiraju, S.N.; Hu, F.B. Use of Metabolomics in Improving Assessment of Dietary Intake. Clin. Chem. 2018, 64, 82–98. [Google Scholar] [CrossRef] [Green Version]
- Ryan, E.P.; Heuberger, A.L.; Broeckling, C.D.; Borresen, E.C.; Tillotson, C.; Prenni, J.E. Advances in Nutritional Metabolomics. Curr. Metab. 2013, 1, 109–120. [Google Scholar] [CrossRef] [Green Version]
- Schmidt, J.A.; Fensom, G.K.; Rinaldi, S.; Scalbert, A.; Gunter, M.J.; Holmes, M.V.; Key, T.J.; Travis, R.C. NMR Metabolite Profiles in Male Meat-Eaters, Fish-Eaters, Vegetarians and Vegans, and Comparison with MS Metabolite Profiles. Metabolites 2021, 11, 121. [Google Scholar] [CrossRef]
- Abbondante, S.; Eckel-Mahan, K.L.; Ceglia, N.J.; Baldi, P.; Sassone-Corsi, P. Comparative Circadian Metabolomics Reveal Differential Effects of Nutritional Challenge in the Serum and Liver. J. Biol. Chem. 2016, 291, 2812–2828. [Google Scholar] [CrossRef] [Green Version]
- Ye, Y.; Xu, H.; Xie, Z.; Wang, L.; Sun, Y.; Yang, H.; Hu, D.; Mao, Y. Time-Restricted Feeding Reduces the Detrimental Effects of a High-Fat Diet, Possibly by Modulating the Circadian Rhythm of Hepatic Lipid Metabolism and Gut Microbiota. Front. Nutr. 2020, 7, 596285. [Google Scholar] [CrossRef]
- Li, J.; Vosegaard, T.; Guo, Z. Applications of nuclear magnetic resonance in lipid analyses: An emerging powerful tool for lipidomics studies. Prog. Lipid Res. 2017, 68, 37–56. [Google Scholar] [CrossRef]
- Edison, A.S.; Colonna, M.; Gouveia, G.J.; Holderman, N.R.; Judge, M.T.; Shen, X.; Zhang, S. NMR: Unique Strengths That Enhance Modern Metabolomics Research. Anal. Chem. 2020, 93, 478–499. [Google Scholar] [CrossRef]
- Bharti, S.K.; Roy, R. Quantitative NMR Spectroscopy. TrAC Trends Anal. Chem. 2012, 34, 2227–2236. [Google Scholar] [CrossRef]
- Hatzakis, E. Nuclear Magnetic Resonance (NMR) Spectroscopy in Food Science: A Comprehensive Review. Compr. Rev. Food Sci. Food Saf. 2019, 18, 189–220. [Google Scholar] [CrossRef] [Green Version]
- Krishnamurthy, K. CRAFT (complete reduction to amplitude frequency table)—Robust and time-efficient Bayesian approach for quantitative mixture analysis by NMR. Magn. Reson. Chem. 2013, 51, 821–829. [Google Scholar] [CrossRef]
- Johnson, H.; Puppa, M.; van der Merwe, M.; Tipirneni-Sajja, A. CRAFT for NMR lipidomics: Targeting lipid metabolism in leucine-supplemented tumor-bearing mice. Magn. Reson. Chem. 2021, 59, 138–146. [Google Scholar] [CrossRef]
- Krishnamurthy, K. Complete Reduction to Amplitude Frequency Table (CRAFT)—A perspective. Magn. Reson. Chem. 2021, 59, 757–791. [Google Scholar] [CrossRef]
- Quirk, J.D.; Bretthorst, G.L.; Garbow, J.R.; Ackerman, J.J.H. Magnetic resonance data modeling: The Bayesian analysis toolbox. Concepts Magn. Reson. Part A 2019, 47, e21467. [Google Scholar] [CrossRef]
- Hatori, M.; Vollmers, C.; Zarrinpar, A.; DiTacchio, L.; Bushong, E.A.; Gill, S.; Leblanc, M.; Chaix, A.; Joens, M.; Fitzpatrick, J.A.; et al. Time-restricted feeding without reducing caloric intake prevents metabolic diseases in mice fed a high-fat diet. Cell. Metab. 2012, 15, 848–860. [Google Scholar] [CrossRef] [Green Version]
- de Goede, P.; Foppen, E.; Ritsema, W.I.G.R.; Korpel, N.L.; Yi, C.-X.; Kalsbeek, A. Time-Restricted Feeding Improves Glucose Tolerance in Rats, but Only When in Line With the Circadian Timing System. Front. Endocrinol. 2019, 10, 554. [Google Scholar] [CrossRef] [Green Version]
- Olsen, M.K.; Choi, M.H.; Kulseng, B.; Zhao, C.-M.; Chen, D. Time-restricted feeding on weekdays restricts weight gain: A study using rat models of high-fat diet-induced obesity. Physiol. Behav. 2017, 173, 298–304. [Google Scholar] [CrossRef]
- Sun, S.; Hanzawa, F.; Kim, D.; Umeki, M.; Nakajima, S.; Sakai, K.; Ikeda, S.; Mochizuki, S.; Oda, H. Circadian rhythm–dependent induction of hepatic lipogenic gene expression in rats fed a high-sucrose diet. J. Biol. Chem. 2019, 294, 15206–15217. [Google Scholar] [CrossRef]
- Chung, H.; Chou, W.; Sears, D.D.; Patterson, R.E.; Webster, N.J.; Ellies, L.G. Time-restricted feeding improves insulin resistance and hepatic steatosis in a mouse model of postmenopausal obesity. Metabolism 2016, 65, 1743–1754. [Google Scholar] [CrossRef] [Green Version]
- Das, M.; Ellies, L.G.; Kumar, D.; Sauceda, C.; Oberg, A.; Gross, E.; Mandt, T.; Newton, I.G.; Kaur, M.; Sears, D.D.; et al. Time-restricted feeding normalizes hyperinsulinemia to inhibit breast cancer in obese postmenopausal mouse models. Nat. Commun. 2021, 12, 565. [Google Scholar] [CrossRef]
- Power, M.L.; Schulkin, J. Sex differences in fat storage, fat metabolism, and the health risks from obesity: Possible evolutionary origins. Br. J. Nutr. 2008, 99, 931–940. [Google Scholar] [CrossRef]
- Ethun, K. Sex and Gender Differences in Body Composition, Lipid Metabolism, and Glucose Regulation. In Sex Differences in Physiology; Elsevier: Amsterdam, The Netherlands, 2016; pp. 145–165. [Google Scholar]
- Schneider, J.; Han, W.H.; Matthew, R.; Sauve, Y.; Lemieux, H. Age and sex as confounding factors in the relationship between cardiac mitochondrial function and type 2 diabetes in the Nile Grass rat. PLoS ONE 2020, 15, e0228710. [Google Scholar] [CrossRef]
- Subramaniam, A.; Landstrom, M.; Luu, A.; Hayes, K.C. The Nile Rat (Arvicanthis niloticus) as a Superior Carbohydrate-Sensitive Model for Type 2 Diabetes Mellitus (T2DM). Nutrients 2018, 10, 235. [Google Scholar] [CrossRef] [Green Version]
- Noda, K.; Melhorn, M.I.; Zandi, S.; Frimmel, S.; Tayyari, F.; Hisatomi, T.; Almulki, L.; Pronczuk, A.; Hayes, K.C.; Hafezi-Moghadam, A. An animal model of spontaneous metabolic syndrome: Nile grass rat. FASEB J. 2010, 24, 2443–2453. [Google Scholar] [CrossRef] [Green Version]
- Ramanathan, C.; Johnson, H.; Sharma, S.; Son, W.; Puppa, M.; Rohani, S.N.; Tipirneni-Sajja, A.; Bloomer, R.J.; van der Merwe, M. Early Time-Restricted Feeding Amends Circadian Clock Function and Improves Metabolic Health in Male and Female Nile Grass Rats. Medicines 2022, 9, 15. [Google Scholar] [CrossRef]
- Suganami, T.; Tanaka, M.; Ogawa, Y. Adipose tissue inflammation and ectopic lipid accumulation. Endocr. J. 2012, 59, 849–857. [Google Scholar] [CrossRef] [Green Version]
- Peterson, L.R.; Herrero, P.; Schechtman, K.B.; Racette, S.B.; Waggoner, A.D.; Kisrieva-Ware, Z.; Dence, C.; Klein, S.; Marsala, J.; Meyer, T.; et al. Effect of obesity and insulin resistance on myocardial substrate metabolism and efficiency in young women. Circulation 2004, 109, 2191–2196. [Google Scholar] [CrossRef] [Green Version]
- Kučera, O.; Garnol, T.; Lotková, H.; Staňková, P.; Mazurová, Y.; Hroch, M.; Bolehovská, R.; Roušar, T.; Červinková, Z. The Effect of Rat Strain, Diet Composition and Feeding Period on the Development of a Nutritional Model of Non-Alcoholic Fatty Liver Disease in Rats. Physiol. Res. 2011, 60, 317–328. [Google Scholar] [CrossRef]
- Guillou, H.; Yaligar, J.; Gopalan, V.; Kiat, O.W.; Sugii, S.; Shui, G.; Lam, B.D.; Henry, C.J.; Wenk, M.R.; Tai, E.S.; et al. Evaluation of Dietary Effects on Hepatic Lipids in High Fat and Placebo Diet Fed Rats by In Vivo MRS and LC-MS Techniques. PLoS ONE 2014, 9, e91436. [Google Scholar] [CrossRef]
- Nagarajan, V.; Gopalan, V.; Kaneko, M.; Angeli, V.; Gluckman, P.; Richards, A.M.; Kuchel, P.W.; Velan, S.S. Cardiac function and lipid distribution in rats fed a high-fat diet: In vivo magnetic resonance imaging and spectroscopy. Am. J. Physiol. Heart Circ. Physiol. 2013, 304, H1495–H1504. [Google Scholar] [CrossRef] [Green Version]
- Harasim, E.; Stępek, T.; Konstantynowicz-Nowicka, K.; Baranowski, M.; Górski, J.; Chabowski, A. Myocardial Lipid Profiling During Time Course of High Fat Diet and its Relationship to the Expression of Fatty Acid Transporters. Cell. Physiol. Biochem. 2015, 37, 1147–1158. [Google Scholar] [CrossRef]
- Rangel-Huerta, O.D.; Pastor-Villaescusa, B.; Gil, A. Are we close to defining a metabolomic signature of human obesity? A systematic review of metabolomics studies. Metabolomics 2019, 15, 93. [Google Scholar] [CrossRef] [Green Version]
- Caputo, T.; Gilardi, F.; Desvergne, B. From chronic overnutrition to metaflammation and insulin resistance: Adipose tissue and liver contributions. FEBS Lett. 2017, 591, 3061–3088. [Google Scholar] [CrossRef] [Green Version]
- Chaix, A.; Zarrinpar, A. The effects of time-restricted feeding on lipid metabolism and adiposity. Adipocyte 2015, 4, 319–324. [Google Scholar] [CrossRef] [Green Version]
- Aguila, M.B.; Sun, S.; Hanzawa, F.; Umeki, M.; Ikeda, S.; Mochizuki, S.; Oda, H. Time-restricted feeding suppresses excess sucrose-induced plasma and liver lipid accumulation in rats. PLoS ONE 2018, 13, e0201261. [Google Scholar] [CrossRef]
- Dyar, K.A.; Lutter, D.; Artati, A.; Ceglia, N.J.; Liu, Y.; Armenta, D.; Jastroch, M.; Schneider, S.; de Mateo, S.; Cervantes, M.; et al. Atlas of Circadian Metabolism Reveals System-wide Coordination and Communication between Clocks. Cell 2018, 174, 1571–1585.e1511. [Google Scholar] [CrossRef] [Green Version]
- Kessler, K.; Pivovarova-Ramich, O. Meal Timing, Aging, and Metabolic Health. Int. J. Mol. Sci. 2019, 20, 1911. [Google Scholar] [CrossRef] [Green Version]
- Wells, A.; Barrington, W.T.; Dearth, S.; May, A.; Threadgill, D.W.; Campagna, S.R.; Voy, B.H. Tissue Level Diet and Sex-by-Diet Interactions Reveal Unique Metabolite and Clustering Profiles Using Untargeted Liquid Chromatography-Mass Spectrometry on Adipose, Skeletal Muscle, and Liver Tissue in C57BL6/J Mice. J. Proteome. Res. 2018, 17, 1077–1090. [Google Scholar] [CrossRef]
- Sivakumar, R.; Anandh Babu, P.V.; Shyamaladevi, C.S. Protective effect of aspartate and glutamate on cardiac mitochondrial function during myocardial infarction in experimental rats. Chem. Biol. Interact. 2008, 176, 227–233. [Google Scholar] [CrossRef]
- Tang, W.; Wu, J.; Jin, S.; He, L.; Lin, Q.; Luo, F.; He, X.; Feng, Y.; He, B.; Bing, P.; et al. Glutamate and aspartate alleviate testicular/epididymal oxidative stress by supporting antioxidant enzymes and immune defense systems in boars. Sci. China Life Sci. 2020, 63, 116–124. [Google Scholar] [CrossRef]
- Amiel, A.; Tremblay-Franco, M.; Gautier, R.; Ducheix, S.; Montagner, A.; Polizzi, A.; Debrauwer, L.; Guillou, H.; Bertrand-Michel, J.; Canlet, C. Proton NMR Enables the Absolute Quantification of Aqueous Metabolites and Lipid Classes in Unique Mouse Liver Samples. Metabolites 2019, 10, 9. [Google Scholar] [CrossRef] [Green Version]
- Sostare, J.; Di Guida, R.; Kirwan, J.; Chalal, K.; Palmer, E.; Dunn, W.B.; Viant, M.R. Comparison of modified Matyash method to conventional solvent systems for polar metabolite and lipid extractions. Anal. Chim. Acta 2018, 1037, 301–315. [Google Scholar] [CrossRef]
- Bernstein, H.S.; Overmyer, K.A.; Thonusin, C.; Qi, N.R.; Burant, C.F.; Evans, C.R. Impact of Anesthesia and Euthanasia on Metabolomics of Mammalian Tissues: Studies in a C57BL/6J Mouse Model. PLoS ONE 2015, 10, e0117232. [Google Scholar] [CrossRef]
- Nagana Gowda, G.A.; Abell, L.; Lee, C.F.; Tian, R.; Raftery, D. Simultaneous Analysis of Major Coenzymes of Cellular Redox Reactions and Energy Using ex Vivo 1H NMR Spectroscopy. Anal. Chem. 2016, 88, 4817–4824. [Google Scholar] [CrossRef]
- Grinde, M.T.; Giskeødegård, G.F.; Andreassen, T.; Tessem, M.-B.; Bathen, T.F.; Moestue, S.A. Biomarker Discovery Using NMR-Based Metabolomics of Tissue. In NMR-Based Metabolomics; Humana: New York, NY, USA, 2019; pp. 243–262. [Google Scholar]
- Leary, S.; Underwood, W.; Anthony, R.; Cartner, S.; Grandin, T.; Greenacre, C.; Gwaltney-Brant, S.; McCrackin, M.A.; Meyer, R.; Miller, D.; et al. AVMA Guidelines for the Euthanasia of Animals: 2020 Edition; American Veterinarian Medical Association: Schaumburg, IL, USA, 2020. [Google Scholar]
- Crook, A.A.; Powers, R. Quantitative NMR-Based Biomedical Metabolomics: Current Status and Applications. Molecules 2020, 25, 5128. [Google Scholar] [CrossRef]
- Aboualizadeh, E.; Carmichael, O.T.; He, P.; Albarado, D.C.; Morrison, C.D.; Hirschmugl, C.J. Quantifying Biochemical Alterations in Brown and Subcutaneous White Adipose Tissues of Mice Using Fourier Transform Infrared Widefield Imaging. Front. Endocrinol. 2017, 8, 121. [Google Scholar] [CrossRef] [Green Version]
- Wishart, D.S.; Guo, A.; Oler, E.; Wang, F.; Anjum, A.; Peters, H.; Dizon, R.; Sayeeda, Z.; Tian, S.; Lee, B.L.; et al. HMDB 5.0: The Human Metabolome Database for 2022. Nucleic Acids Res. 2022, 50, D622–D631. [Google Scholar] [CrossRef]
- Nagana Gowda, G.A.; Raftery, D. Analysis of Plasma, Serum, and Whole Blood Metabolites Using (1)H NMR Spectroscopy. Methods Mol. Biol. 2019, 2037, 17–34. [Google Scholar] [CrossRef]
- Chi, Y.; Gupta, R.K. Alterations in membrane fatty acid unsaturation and chain length in hypertension as observed by 1H NMR spectroscopy. Am. J. Hypertens 1998, 11, 340–348. [Google Scholar] [CrossRef] [Green Version]
- Hernandez-Baixauli, J.; Quesada-Vazquez, S.; Marine-Casado, R.; Gil Cardoso, K.; Caimari, A.; Del Bas, J.M.; Escote, X.; Baselga-Escudero, L. Detection of Early Disease Risk Factors Associated with Metabolic Syndrome: A New Era with the NMR Metabolomics Assessment. Nutrients 2020, 12, 806. [Google Scholar] [CrossRef] [Green Version]
- Lei, S.S.; Zhang, N.Y.; Zhou, F.C.; He, X.; Wang, H.Y.; Li, L.Z.; Zheng, X.; Dong, Y.J.; Luo, R.; Li, B.; et al. Dendrobium officinale Regulates Fatty Acid Metabolism to Ameliorate Liver Lipid Accumulation in NAFLD Mice. Evid. Based Complement Altern. Med. 2021, 2021, 6689727. [Google Scholar] [CrossRef]
- When It Makes Sense to Not Correct for Multiple Comparisons. Available online: https://www.graphpad.com/guides/prism/latest/statistics/stat_when_to_not_correct_for_2.htm (accessed on 2 June 2022).
- Rothman, K.J. No adjustments are needed for multiple comparisons. Epidemiology 1990, 1, 43–46. [Google Scholar] [CrossRef] [Green Version]
- Muhammad, I.F.; Borne, Y.; Zaigham, S.; Soderholm, M.; Johnson, L.; Persson, M.; Melander, O.; Engstrom, G. Comparison of risk factors for ischemic stroke and coronary events in a population-based cohort. BMC Cardiovasc. Disord. 2021, 21, 536. [Google Scholar] [CrossRef]
- Perneger, T.V. What’s wrong with Bonferroni adjustments. BMJ 1998, 316, 1236–1238. [Google Scholar] [CrossRef]
- Menyhart, O.; Weltz, B.; Gyorffy, B. MultipleTesting.com: A tool for life science researchers for multiple hypothesis testing correction. PLoS ONE 2021, 16, e0245824. [Google Scholar] [CrossRef]


| Liver | Heart | Adipose | ||||||||||||||||
|---|---|---|---|---|---|---|---|---|---|---|---|---|---|---|---|---|---|---|
| Male | Female | p-Values | Male | Female | p-Values | Male | Female | p-Values | ||||||||||
| Chow (n =3 ) | HF-AD (n = 5) | Chow (n = 3) | HF-AD (n = 5) | Sex | Diet | Chow (n = 4) | HF-AD (n = 5) | Chow (n = 3) | HF-AD (n = 5) | Sex | Diet | Chow (n = 4) | HF-AD (n = 5) | Chow (n = 3) | HF-AD (n = 5) | Sex | Diet | |
| Om3 | 4.4 ± 1.2 | 5.7 ± 2 | 9.5 ± 1 | 8.2 ± 2.3 | 0.002 f | 1.00 | 0.91 ± 0.16 | 0.77 ± 0.17 | 0.87 ± 0.04 | 0.88 ± 0.2 | 0.54 | 0.36 | 1.91 ± 0.96 | 1.05 ± 0.44 | 1.34 ± 0.29 | 0.88 ± 0.1 | 0.19 | 0.028 ⁰ |
| Tg | 7.9 ± 3.1 | 30.6 ± 15.8 | 30.8 ± 10.1 | 68.6 ± 21.8 | 0.003 f | 0.003 * | 0.12 ± 0.12 | 0.36 ± 0.12 | 0.2 ± 0.06 | 0.35 ± 0.2 | 0.68 | 0.017 * | 22.2 ± 11.6 | 22.8 ± 2.9 | 20.9 ± 3.6 | 21.8 ± 3.7 | 0.72 | 0.81 |
| TFA | 49.6 ± 8 | 103.3 ± 37.5 | 121.4 ± 21.6 | 205.8 ± 41.7 | <0.001 f | 0.002 * | 8.2 ± 0.7 | 10.2 ± 1.3 | 8.3 ± 0.12 | 10.5 ± 0.61 | 0.51 | <0.001 * | 66.2 ± 32.4 | 68.2 ± 11.6 | 63.9 ± 12.1 | 67.7 ± 13.3 | 0.89 | 0.76 |
| LA | 6.1 ± 0.8 | 14.3 ± 5.7 | 18.6 ± 7.4 | 51.5 ± 39.5 | 0.06 | 0.11 | 0.39 ± 0.08 | 0.32 ± 0.06 | 0.31 ± 0.09 | 0.42 ± 0.07 | 0.88 | 0.26 | 33.8 ± 15.6 | 25.4 ± 3.4 | 30.9 ± 6.1 | 24.4 ± 3.7 | 0.10 | 0.65 |
| UFA | 32.4 ± 4.8 | 63.7 ± 20.1 | 86.6 ± 21.8 | 130.1 ± 25.4 | 0.005 f | <0.001 * | 6.2 ± 0.7 | 6.55 ± 1 | 5.4 ± 0.89 | 7.3 ± 0.98 | 0.68 | 0.06 | 51.2 ± 24.1 | 47.8 ± 14.2 | 44.7 ± 7.5 | 43.9 ± 10.6 | 0.51 | 0.79 |
| SFA | 17.1 ± 3.7 | 39.6 ± 18.5 | 34.8 ± 1.8 | 75.7 ± 20.6 | 0.007 f | 0.002 * | 2.0 ± 0.3 | 3.6 ± 0.66 | 2.8 ± 0.77 | 3.1 ± 0.78 | 0.77 | 0.007 * | 15.0 ± 11.3 | 20.3 ± 4.2 | 19.2 ± 6.3 | 23.8 ± 3.7 | 0.27 | 0.16 |
| MUFA | 7.6 ± 2.5 | 28.4 ± 14.4 | 26.1 ± 5.4 | 63.8 ± 12.7 | <0.001 f | <0.001 * | 0.90 ± 0.2 | 1.4 ± 0.22 | 0.7 ± 0.01 | 1.3 ± 0.22 | 0.30 | <0.001 * | 16.4 ± 6.6 | 24 ± 1.8 | 20 ± 4.4 | 25 ± 4.7 | 0.32 | 0.016 * |
| PUFA | 24.8 ± 3.7 | 35.3 ± 9 | 60.5 ± 17.1 | 66.3 ± 14.5 | <0.001 f | 0.22 | 5.3 ± 0.7 | 5.2 ± 0.9 | 4.7 ± 0.88 | 6.0 ± 0.88 | 0.49 | 0.35 | 34.9 ± 17.7 | 23.9 ± 14.2 | 24.7 ± 5.7 | 18.9 ± 6 | 0.23 | 0.19 |
| UFA-% | 66 ± 3% | 63 ± 7% | 71 ± 6% | 63 ± 5% | 0.36 | 0.11 | 75 ± 4% | 64 ± 5% | 66 ± 10% | 70 ± 8% | 0.80 | 0.18 | 77 ± 10% | 69 ± 8% | 70 ± 5% | 64 ± 4% | 0.13 | 0.08 |
| SFA-% | 34 ± 3% | 37 ± 7% | 29 ± 6% | 37 ± 5% | 0.36 | 0.11 | 25 ± 4% | 36 ± 5% | 34 ± 10% | 30 ± 8% | 0.80 | 0.18 | 18 ± 10% | 31 ± 8% | 30 ± 5% | 36 ± 4% | 0.13 | 0.08 |
| MUFA-% | 15 ± 3% | 26 ± 7% | 21 ± 1% | 31 ± 1% | 0.013 f | <0.001 * | 11 ± 2% | 14 ± 2% | 9 ± 0.1% | 12 ± 2% | 0.11 | 0.005 * | 21 ± 9% | 36 ± 5% | 31 ± 2% | 37 ± 1% | 0.040 f | 0.001 * |
| PUFA-% | 50 ± 6% | 37 ± 6% | 49 ± 7% | 32 ± 5% | 0.54 | 0.004 ⁰ | 64 ± 6% | 51 ± 5% | 57 ± 10% | 57 ± 7% | 0.80 | 0.033 ⁰ | 44 ± 21% | 33 ± 13% | 39 ± 8% | 27 ± 4% | 0.40 | 0.11 |
| SFA/UFA | 0.53 ± 0.08 | 0.6 ± 0.16 | 0.42 ± 0.16 | 0.59 ± 0.13 | 0.40 | 0.11 | 0.33 ± 0.08 | 0.56 ± 0.13 | 0.54 ± 0.23 | 0.44 ± 0.18 | 0.81 | 0.22 | 0.31 ± 0.15 | 0.46 ± 0.15 | 0.43 ± 0.11 | 0.56 ± 0.10 | 0.13 | 0.06 |
| TC | 1.9 ± 0.3 | 5.1 ± 1.5 | 2.8 ± 1 | 4.3 ± 2.9 | 0.95 | 0.035 * | 0.39 ± 0.04 | 0.40 ± 0.06 | 0.36 ± 0.02 | 0.42 ± 0.04 | 0.66 | 0.15 | - | - | - | - | - | - |
| PC | 3.2 ± 0.3 | 2.8 ± 0.5 | 3.4 ± 0.4 | 2.5 ± 0.7 | 0.89 | 0.031 ⁰ | 1.31 ± 0.14 | 1.41 ± 0.14 | 1.13 ± 0.02 | 1.46 ± 0.15 | 0.62 | 0.022 * | - | - | - | - | - | - |
| PE | 1.8 ± 0.2 | 1.7 ± 0.3 | 1.6 ± 0.3 | 1.4 ± 0.8 | 0.40 | 0.64 | 1.29 ± 0.17 | 1.16 ± 0.77 | 1.08 ± 0.06 | 1.38 ± 0.32 | 0.69 | 0.43 | - | - | - | - | - | - |
| SM | 0.3 ± 0 | 0.3 ± 0.1 | 0.2 ± 0.1 | 0.2 ± 0.1 | 0.24 | 0.45 | 0.06 ± 0.01 | 0.08 ± 0.04 | 0.06 ± 0.01 | 0.08 ± 0.01 | 0.72 | 0.18 | - | - | - | - | - | - |
| DHA | - | - | - | - | - | - | 1.1 ± 0.3 | 1.1 ± 0.06 | 1.1 ± 0.06 | 1.3 ± 0.25 | 0.52 | 0.93 | - | - | - | - | - | - |
| Liver | Heart | |||||||||||
|---|---|---|---|---|---|---|---|---|---|---|---|---|
| Male | Female | p-Values | Male | Female | p-Values | |||||||
| Chow (n = 3) | HF-AD (n = 5) | Chow (n = 3) | HF-AD (n = 5) | Sex | Diet | Chow (n = 4) | HF-AD (n = 5) | Chow (n = 3) | HF-AD (n = 5) | Sex | Diet | |
| Glucose | 12.5 ± 1.2 | 9.9 ± 3.1 | 5.1 ± 1.8 | 5.9 ± 2.3 | <0.001 m | 0.47 | 0.28 ± 0.06 | 0.43 ± 0.23 | 0.21 ± 0.02 | 3.81 ± 7.65 | 0.45 | 0.40 |
| Lactate | 2.2 ± 0.3 | 1.3 ± 0.2 | 1.5 ± 0.4 | 1.8 ± 0.9 | 0.71 | 0.37 | 1.40 ± 0.20 | 1.27 ± 0.40 | 1.42 ± 0.36 | 2.61 ± 2.22 | 0.36 | 0.43 |
| Alanine | 0.58 ± 0.12 | 0.43 ± 0.16 | 0.48 ± 0.07 | 0.42 ± 0.08 | 0.36 | 0.10 | 0.21 ± 0.05 | 0.20 ± 0.10 | 0.19 ± 0.05 | 0.35 ± 0.27 | 0.53 | 0.48 |
| Acetate | 0.27 ± 0.03 | 0.19 ± 0.02 | 0.2 ± 0.04 | 0.15 ± 0.04 | 0.006 m | 0.002 ⁰ | 0.02 ± 0.03 | 0.02 ± 0.003 | 0.02 ± 0.01 | 0.04 ± 0.04 | 0.48 | 0.33 |
| Choline | 0.10 ± 0.08 | 0.12 ± 0.06 | 0.13 ± 0.05 | 0.10 ± 0.05 | 0.80 | 0.75 | 0.01 ± 0.08 | 0.01 ± 0.004 | 0.01 ± 0.002 | 0.03 ± 0.03 | 0.35 | 0.37 |
| Creatine | 0.31 ± 0.27 | 0.20 ± 0.13 | 0.18 ± 0.07 | 0.07 ± 0.03 | 0.09 | 0.16 | 0.77 ± 0.17 | 0.62 ± 0.08 | 0.78 ± 0.18 | 0.67 ± 0.34 | 0.81 | 0.28 |
| Inosine | 1.01 ± 0.16 | 0.72 ± 0.25 | 0.99 ± 0.18 | 0.51 ± 0.16 | 0.28 | 0.003 ⁰ | 0.32 ± 0.09 | 0.27 ± 0.07 | 0.33 ± 0.09 | 0.32 ± 0.13 | 0.54 | 0.52 |
| Fumarate | 0.07 ± 0.02 | 0.07 ± 0.04 | 0.04 ± 0.002 | 0.04 ± 0.02 | 0.042 m | 0.80 | 0.03 ± 0.01 | 0.02 ± 0.01 | 0.02 ± 0.002 | 0.03 ± 0.005 | 0.63 | 0.22 |
| Succinate | 0.71 ± 0.16 | 0.63 ± 0.21 | 0.5 ± 0.11 | 0.26 ± 0.22 | 0.015 m | 0.13 | 0.08 ± 0.01 | 0.07 ± 0.03 | 0.08 ± 0.05 | 0.07 ± 0.01 | 0.93 | 0.24 |
| Glutamine | 1.9 ± 0.3 | 1.5 ± 0.3 | 1.3 ± 0.1 | 0.7 ± 0.3 | <0.001 m | 0.003 ⁰ | 0.32 ± 0.09 | 0.35 ± 0.11 | 0.38 ± 0.15 | 0.34 ± 0.05 | 0.54 | 0.95 |
| Glutamate | 1.2 ± 0.3 | 1.1 ± 0.4 | 1.1 ± 0.3 | 0.8 ± 0.5 | 0.53 | 0.35 | 0.45 ± 0.05 | 0.35 ± 0.06 | 0.44 ± 0.09 | 0.38 ± 0.15 | 0.82 | 0.11 |
| Gmi/Gma | 1.7 ± 0.2 | 1.5 ± 0.6 | 1.2 ± 0.2 | 1.3 ± 1.0 | 0.37 | 0.93 | 0.71 ± 0.23 | 1.03 ± 0.31 | 0.86 ± 0.23 | 1.0 ± 0.33 | 0.69 | 0.13 |
| Aspartate | 0.08 ± 0.01 | 0.06 ± 0.01 | 0.04 ± 0.03 | 0.06 ± 0.03 | 0.15 | 0.86 | 0.13 ± 0.07 | 0.15 ± 0.01 | 0.25 ± 0.10 | 0.25 ± 0.06 | 0.003 f | 0.68 |
| 3-hydroxybutyrate | 0.71 ± 0.02 | 0.12 ± 0.05 | 0.13 ± 0.03 | 0.14 ± 0.21 | 0.73 | 0.84 | 0.03 ± 0.01 | 0.04 ± 0.02 | 0.02 ± 0.01 | 0.05 ± 0.05 | 0.81 | 0.13 |
| Valine | 0.14 ± 0.02 | 0.11 ± 0.02 | 0.14 ± 0.07 | 0.09 ± 0.02 | 0.71 | 0.024 ⁰ | - | - | - | - | - | - |
| Isoleucine | 0.11 ± 0.03 | 0.11 ± 0.12 | 0.35 ± 0.07 | 0.04 ± 0.01 | 0.05 | 0.002 ⁰ | - | - | - | - | - | - |
| Formate | 0.04 ± 0.04 | 0.08 ± 0.06 | 0.05 ± 0.01 | 0.05 ± 0.03 | 0.50 | 0.39 | - | - | - | - | - | - |
| Histidine | 0.11 ± 0.03 | 0.09 ± 0.02 | 0.08 ± 0.04 | 0.06 ± 0.01 | 0.025 m | 0.14 | - | - | - | - | - | - |
| Creatinine | 0.03 ± 0.03 | 0.04 ± 0.01 | 0.06 ± 0.01 | 0.02 ± 0.02 | 0.49 | 0.06 | - | - | - | - | - | - |
| Leucine | 0.17 ± 0.07 | 0.11 ± 0.05 | 0.14 ± 0.05 | 0.09 ± 0.04 | 0.38 | 0.047 ⁰ | - | - | - | - | - | - |
| Niacinamide | 0.10 ± 0.04 | 0.07 ± 0.01 | 0.07 ± 0.01 | 0.05 ± 0.02 | 0.038 m | 0.025 ⁰ | - | - | - | - | - | - |
| Phenylalanine | 0.05 ± 0.01 | 0.03 ± 0.02 | 0.03 ± 0.01 | 0.02 ± 0.02 | 0.033 m | 0.07 | - | - | - | - | - | - |
| Tyrosine | 0.04 ± 0.01 | 0.03 ± 0.01 | 0.03 ± 0.003 | 0.01 ± 0.01 | 0.010 m | 0.013 ⁰ | - | - | - | - | - | - |
| Hypoxanthine | - | - | - | - | - | - | 0.04 ± 0.01 | 0.05 ± 0.01 | 0.05 ± 0.01 | 0.09 ± 0.08 | 0.35 | 0.27 |
| Methionine | - | - | - | - | - | - | 0.05 ± 0.02 | 0.04 ± 0.02 | 0.04 ± 0.02 | 0.06 ± 0.03 | 0.66 | 0.93 |
| Taurine | - | - | - | - | - | - | 0.74 ± 0.28 | 0.63 ± 0.21 | 0.63 ± 0.21 | 0.78 ± 0.21 | 0.67 | 0.94 |
| Male | Females | p-Values | ||||||
|---|---|---|---|---|---|---|---|---|
| HF-AD (n = 5) | HF-AM (n = 4) | HF-PM (n = 4) | HF-AD (n = 5) | HF-AM (n = 4) | HF-PM (n = 4) | Sex | Diet | |
| Omega-3 | 5.66 ± 2.03 | 4.79 ± 2.01 | 4.15 ± 1.89 | 8.21 ± 2.28 | 5.48 ± 2.45 | 6.10 ± 1.71 | 0.049 f | 0.13 |
| Triglycerides | 30.6 ± 15.8 | 17.9 ± 5.9 | 17.7 ± 9.9 | 68.6 ± 21.8 | 27.9 ± 18.5 | 45.56 ± 20.8 | 0.001 f | 0.009 * |
| TFA | 103.3 ± 37.5 | 90.0 ± 19.9 | 62.8 ± 28.1 | 205.8 ± 41.7 | 107.1 ± 51.1 | 148.4 ± 54.1 | <0.001 f | 0.015 ⁰,* |
| Linoleic Acid | 14.3 ± 5.7 | 10.3 ± 6.6 | 15.5 ± 12.1 | 51.4 ± 39.5 | 22.0 ± 11.3 | 38.5 ± 30.4 | 0.014 f | 0.31 |
| UFA | 63.7 ± 20.1 | 55.5 ± 13.6 | 38.9 ± 13.9 | 130.0 ± 25.4 | 73.4 ± 34.2 | 95.3 ± 35.2 | <0.001 f | 0.020 ⁰,* |
| SFA | 39.6 ± 18.5 | 34.4 ± 7.1 | 23.9 ± 14.3 | 75.7 ± 20.6 | 33.6 ± 16.9 | 53.1 ± 19.1 | 0.004 f | 0.017 * |
| MUFA | 28.4 ± 14.4 | 19.6 ± 6.2 | 20.6 ± 10.2 | 63.7 ± 12.7 | 31.6 ± 16.7 | 45.6 ± 18.3 | <0.001 f | 0.015 * |
| PUFA | 35.3 ± 9.0 | 35.9 ± 11.1 | 18.2 ± 10.1 | 66.2 ± 14.5 | 41.8 ± 17.6 | 49.7 ± 17.0 | <0.001 f | 0.041 ⁰ |
| UFA-% | 62 ± 7% | 62 ± 3% | 64 ± 6% | 63 ± 6% | 69 ± 2% | 63 ± 2% | 0.18 | 0.64 |
| SFA-% | 37 ± 7% | 38 ± 3% | 35 ± 6% | 36 ± 5% | 31 ± 2% | 36 ± 2% | 0.18 | 0.64 |
| MUFA-% | 26 ± 6% | 22 ± 6% | 34 ± 17% | 31 ± 1% | 28 ± 3% | 30 ± 3% | 0.48 | 0.20 |
| PUFA-% | 36 ± 12% | 39 ± 4% | 29 ± 17% | 32 ± 5% | 40 ± 4% | 33 ± 2% | 0.91 | 0.20 |
| SFA/UFA | 0.60 ± 0.16 | 0.62 ± 0.07 | 0.57 ± 0.16 | 0.58 ± 0.13 | 0.45 ± 0.03 | 0.56 ± 0.05 | 0.16 | 0.60 |
| Total Cholesterol | 5.11 ± 1.47 | 3.55 ± 1.03 | 3.52 ± 1.47 | 4.32 ± 2.88 | 2.11 ± 0.04 | 2.79 ± 0.89 | 0.14 | 0.05 |
| Phosphatidylcholine | 2.80 ± 0.49 | 3.25 ± 0.33 | 2.76 ± 0.15 | 2.48 ± 0.67 | 2.98 ± 0.45 | 2.62 ± 0.81 | 0.26 | 0.16 |
| Phosphatidylethanolamine | 1.69 ± 0.32 | 1.49 ± 0.16 | 1.33 ± 0.67 | 1.42 ± 0.83 | 1.46 ± 0.12 | 1.37 ± 0.63 | 0.69 | 0.73 |
| Sphingomyelin | 0.25 ± 0.11 | 0.37 ± 0.13 | 0.25 ± 0.09 | 0.19 ± 0.08 | 0.21 ± 0.05 | 0.18 ± 0.07 | 0.018 m | 0.20 |
| Glucose | 9.13 ± 2.85 | 11.01 ± 3.61 | 10.1 ± 2.56 | 5.49 ± 2.17 | 8.58 ± 3.58 | 11.3 ± 3.89 | 0.20 | 0.08 |
| Lactate | 1.34 ± 0.23 | 1.54 ± 0.65 | 1.47 ± 0.46 | 1.77 ± 0.95 | 1.24 ± 0.40 | 2.51 ± 1.07 | 0.17 | 0.22 |
| Alanine | 0.42 ± 0.16 | 0.56 ± 0.08 | 0.60 ± 0.15 | 0.41 ± 0.08 | 0.48 ± 0.12 | 0.65 ± 0.27 | 0.81 | 0.032 ‡ |
| Acetate | 0.19 ± 0.02 | 0.25 ± 0.05 | 0.21 ± 0.05 | 0.15 ± 0.04 | 0.24 ± 0.07 | 0.26 ± 0.07 | 0.92 | 0.006 +,‡ |
| Choline | 0.11 ± 0.06 | 0.11 ± 0.03 | 0.14 ± 0.03 | 0.10 ± 0.05 | 0.12 ± 0.05 | 0.10 ± 0.03 | 0.80 | 0.67 |
| Creatine | 0.20 ± 0.13 | 0.10 ± 0.04 | 0.15 ± 0.15 | 0.073 ± 0.03 | 0.08 ± 0.02 | 0.07 ± 0.03 | 0.031 m | 0.49 |
| Inosine | 0.24 ± 0.08 | 0.26 ± 0.09 | 0.30 ± 0.06 | 0.17 ± 0.05 | 0.26 ± 0.10 | 0.27 ± 0.06 | 0.26 | 0.06 |
| Fumarate | 0.07 ± 0.04 | 0.06 ± 0.02 | 0.11 ± 0.03 | 0.043 ± 0.02 | 0.06 ± 0.02 | 0.10 ± 0.04 | 0.38 | 0.003 ‡‡ |
| Succinate | 0.62 ± 0.21 | 0.44 ± 0.06 | 0.66 ± 0.09 | 0.26 ± 0.22 | 0.64 ± 0.27 | 0.57 ± 0.022 | 0.28 | 0.19 |
| Glutamine | 1.45 ± 0.32 | 1.28 ± 0.23 | 0.99 ± 0.41 | 0.74 ± 0.25 | 0.91 ± 0.39 | 0.95 ± 0.19 | 0.006 m | 0.64 |
| Glutamate | 1.06 ± 0.36 | 1.23 ± 0.54 | 1.61 ± 0.67 | 0.80 ± 0.54 | 1.67 ± 0.91 | 1.30 ± 0.84 | 0.95 | 0.15 |
| Gmi/Gma | 1.49 ± 0.56 | 1.25 ± 0.70 | 0.63 ± 0.13 | 1.33 ± 0.30 | 0.89 ± 0.90 | 0.91 ± 0.52 | 0.78 | 0.19 |
| Aspartate | 0.058 ± 0.01 | 0.08 ± 0.03 | 0.08 ± 0.02 | 0.06 ± 0.03 | 0.06 ± 0.03 | 0.06 ± 0.03 | 0.29 | 0.58 |
| 3-hydroxybutyrate | 0.12 ± 0.05 | 0.14 ± 0.04 | 0.05 ± 0.01 | 0.13 ± 0.21 | 0.05 ± 0.02 | 0.05 ± 0.02 | 0.55 | 0.30 |
| Valine | 0.10 ± 0.02 | 0.12 ± 0.04 | 0.15 ± 0.06 | 0.09 ± 0.02 | 0.15 ± 0.12 | 0.23 ± 0.23 | 0.48 | 0.16 |
| Isoleucine | 0.11 ± 0.12 | 0.08 ± 0.04 | 0.07 ± 0.05 | 0.04 ± 0.01 | 0.10 ± 0.13 | 0.21 ± 0.13 | 0.63 | 0.66 |
| Formate | 0.08 ± 0.06 | 0.06 ± 0.03 | 0.06 ± 0.02 | 0.05 ± 0.03 | 0.09 ± 0.06 | 0.11 ± 0.09 | 0.51 | 0.69 |
| Histidine | 0.04 ± 0.01 | 0.05 ± 0.02 | 0.06 ± 0.03 | 0.03 ± 0.01 | 0.05 ± 0.01 | 0.05 ± 0.01 | 0.12 | 0.09 |
| Creatinine | 0.04 ± 0.01 | 0.03 ± 0.02 | 0.04 ± 0.03 | 0.03 ± 0.02 | 0.03 ± 0.01 | 0.03 ± 0.01 | 0.12 | 0.46 |
| Leucine | 0.10 ± 0.05 | 0.15 ± 0.08 | 0.12 ± 0.05 | 0.09 ± 0.04 | 0.09 ± 0.04 | 0.13 ± 0.07 | 0.23 | 0.46 |
| Niacinamide | 0.02 ± 0.003 | 0.03 ± 0.01 | 0.02 ± 0.005 | 0.02 ± 0.01 | 0.02 ± 0.001 | 0.02 ± 0.01 | 0.028 m | 0.05 |
| Phenylalanine | 0.03 ± 0.02 | 0.06 ± 0.02 | 0.04 ± 0.02 | 0.02 ± 0.01 | 0.03 ± 0.001 | 0.04 ± 0.02 | 0.022 m | 0.10 |
| Tyrosine | 0.027 ± 0.01 | 0.05 ± 0.01 | 0.04 ± 0.01 | 0.02 ± 0.01 | 0.02 ± 0.01 | 0.03 ± 0.002 | <0.001 m | 0.034 + |
| Male | Female | p-Values | ||||||
|---|---|---|---|---|---|---|---|---|
| HF-AD (n = 5) | HF-AM (n = 4) | HF-PM (n = 4) | HF-AD (n = 5) | HF-AM (n = 4) | HF-PM (n = 4) | Sex | Diet | |
| Omega-3 | 0.77 ± 0.17 | 0.69 ± 0.17 | 0.73 ± 0.04 | 0.88 ± 0.2 | 0.82 ± 0.24 | 0.71 ± 0.09 | 0.27 | 0.40 |
| Triglycerides | 0.36 ± 0.12 | 0.2 ± 0.12 | 0.18 ± 0.12 | 0.35 ± 0.2 | 0.29 ± 0.26 | 0.28 ± 0.18 | 0.38 | 0.26 |
| TFA | 10.16 ± 1.26 | 8.89 ± 0.44 | 8.17 ± 0.75 | 10.46 ± 0.61 | 8.63 ± 1.44 | 8.68 ± 0.62 | 0.63 | <0.001 ⁰,* |
| Linoleic Acid | 1.38 ± 0.28 | 1.3 ± 0.26 | 1.04 ± 0.1 | 1.25 ± 0.25 | 0.89 ± 0.08 | 1.3 ± 0.15 | 0.27 | 0.10 |
| UFA | 6.55 ± 1 | 6.15 ± 0.89 | 5.62 ± 0.49 | 7.33 ± 0.98 | 5.99 ± 1.21 | 6.1 ± 0.71 | 0.32 | 0.046 |
| SFA | 3.62 ± 0.66 | 2.74 ± 0.56 | 2.55 ± 0.81 | 3.13 ± 0.78 | 2.64 ± 0.48 | 2.58 ± 0.51 | 0.48 | 0.033 ⁰ |
| MUFA | 1.37 ± 0.22 | 1.22 ± 0.11 | 0.98 ± 0.2 | 1.33 ± 0.22 | 0.98 ± 0.24 | 1.15 ± 0.27 | 0.66 | 0.018 ⁰,* |
| PUFA | 5.17 ± 0.9 | 4.93 ± 0.95 | 4.64 ± 0.56 | 6 ± 0.88 | 5.02 ± 1.0 | 4.95 ± 0.53 | 0.23 | 0.13 |
| UFA-% | 64 ± 5% | 69 ± 7% | 69 ± 8% | 70 ± 8% | 69 ± 5% | 70 ± 6% | 0.38 | 0.71 |
| SFA-% | 36 ± 5% | 31 ± 7% | 31 ± 8% | 30 ± 8% | 31 ± 5% | 30 ± 6% | 0.38 | 0.71 |
| MUFA-% | 14 ± 2% | 14 ± 2% | 12 ± 2% | 13 ± 2% | 11 ± 1% | 13 ± 3% | 0.37 | 0.73 |
| PUFA-% | 51 ± 5% | 55 ± 8% | 57 ± 10% | 57 ± 7% | 58 ± 4% | 57 ± 4% | 0.27 | 0.58 |
| SFA/UFA | 0.56 ± 0.13 | 0.46 ± 0.15 | 0.46 ± 0.17 | 0.44 ± 0.18 | 0.45 ± 0.09 | 0.43 ± 0.12 | 0.37 | 0.68 |
| Total Cholesterol | 0.4 ± 0.06 | 0.37 ± 0.07 | 0.36 ± 0.03 | 0.42 ± 0.04 | 0.38 ± 0.03 | 0.39 ± 0.04 | 0.39 | 0.24 |
| Phosphatidylcholine | 1.41 ± 0.14 | 1.3 ± 0.18 | 1.22 ± 0.08 | 1.46 ± 0.15 | 1.28 ± 0.15 | 1.25 ± 0.17 | 0.74 | 0.033 ⁰ |
| Phosphatidylethanolamine | 1.16 ± 0.77 | 0.81 ± 0.39 | 0.75 ± 0.45 | 1.38 ± 0.32 | 0.82 ± 0.11 | 1.34 ± 0.68 | 0.20 | 0.19 |
| Sphingomyelin | 0.08 ± 0.04 | 0.09 ± 0.02 | 0.06 ± 0.01 | 0.08 ± 0.01 | 0.07 ± 0.01 | 0.08 ± 0.01 | 0.31 | 0.35 |
| Glucose | 0.43 ± 0.23 | 0.22 ± 0.13 | 0.33 ± 0.1 | 3.81 ± 7.65 | 0.32 ± 0.32 | 0.23 ± 0.2 | 0.39 | 0.40 |
| Lactate | 1.27 ± 0.4 | 1.36 ± 0.66 | 1.43 ± 0.55 | 2.61 ± 2.22 | 1.59 ± 0.52 | 1.63 ± 0.49 | 0.20 | 0.51 |
| Alanine | 0.2 ± 0.1 | 0.23 ± 0.14 | 0.25 ± 0.1 | 0.35 ± 0.27 | 0.24 ± 0.06 | 0.23 ± 0.08 | 0.45 | 0.75 |
| Acetate | 0.02 ± 0.003 | 0.02 ± 0.01 | 0.03 ± 0.01 | 0.04 ± 0.04 | 0.02 ± 0.002 | 0.03 ± 0.01 | 0.46 | 0.48 |
| Choline | 0.01 ± 0.004 | 0.01 ± 0.01 | 0.01 ± 0.003 | 0.03 ± 0.03 | 0.02 ± 0.003 | 0.01 ± 0.004 | 0.12 | 0.43 |
| Creatine | 0.62 ± 0.08 | 0.73 ± 0.31 | 0.81 ± 0.17 | 0.67 ± 0.34 | 0.77 ± 0.14 | 0.85 ± 0.14 | 0.75 | 0.30 |
| Inosine | 0.27 ± 0.07 | 0.28 ± 0.09 | 0.39 ± 0.1 | 0.32 ± 0.13 | 0.36 ± 0.06 | 0.37 ± 0.08 | 0.39 | 0.21 |
| Fumarate | 0.02 ± 0.01 | 0.02 ± 0.01 | 0.02 ± 0.005 | 0.03 ± 0.005 | 0.02 ± 0.003 | 0.03 ± 0.01 | 0.16 | 0.49 |
| Succinate | 0.07 ± 0.03 | 0.11 ± 0.06 | 0.06 ± 0.01 | 0.07 ± 0.01 | 0.09 ± 0.03 | 0.07 ± 0.03 | 0.61 | 0.06 |
| Glutamine | 0.35 ± 0.11 | 0.34 ± 0.08 | 0.33 ± 0.09 | 0.34 ± 0.05 | 0.33 ± 0.17 | 0.36 ± 0.16 | 1.00 | 0.97 |
| Glutamate | 0.35 ± 0.06 | 0.36 ± 0.12 | 0.48 ± 0.14 | 0.38 ± 0.15 | 0.44 ± 0.12 | 0.58 ± 0.16 | 0.28 | 0.08 |
| Gmi/Gma | 1.03 ± 0.31 | 0.97 ± 0.21 | 0.73 ± 0.17 | 1.0 ± 0.33 | 0.8 ± 0.49 | 0.59 ± 0.17 | 0.45 | 0.09 |
| Aspartate | 0.15 ± 0.01 | 0.17 ± 0.04 | 0.4 ± 0.16 | 0.25 ± 0.06 | 0.29 ± 0.07 | 0.4 ± 0.05 | 0.034 f | <0.001 ‡‡ |
| 3-hydroxybutyrate | 0.04 ± 0.02 | 0.03 ± 0.01 | 0.02 ± 0.01 | 0.05 ± 0.05 | 0.15 ± 0.26 | 0.04 ± 0.01 | 0.23 | 0.44 |
| Hypoxanthine | 0.05 ± 0.02 | 0.04 ± 0.02 | 0.07 ± 0.02 | 0.09 ± 0.08 | 0.05 ± 0.02 | 0.05 ± 0.03 | 0.55 | 0.46 |
| Methionine | 0.04 ± 0.01 | 0.04 ± 0.02 | 0.05 ± 0.02 | 0.06 ± 0.03 | 0.05 ± 0.03 | 0.09 ± 0.05 | 0.23 | 0.50 |
| Taurine | 0.57 ± 0.15 | 0.56 ± 0.21 | 0.72 ± 0.17 | 0.78 ± 0.21 | 0.71 ± 0.12 | 0.68 ± 0.14 | 0.20 | 0.86 |
| DHA | 0.32 ± 0.06 | 0.29 ± 0.08 | 0.28 ± 0.07 | 0.42 ± 0.07 | 0.31 ± 0.1 | 0.3 ± 0.06 | 0.11 | 0.05 |
| Male | Female | p-Values | ||||||
|---|---|---|---|---|---|---|---|---|
| HF-AD (n = 5) | HF-AM (n = 4) | HF-PM (n =4) | HF-AD (n = 5) | HF-AM (n = 3) | HF-PM (n = 4) | Sex | Diet | |
| Omega-3 | 1.05 ± 0.44 | 1.08 ± 0.18 | 0.94 ± 0.24 | 0.88 ± 0.1 | 0.99 ± 0.06 | 0.84 ± 0.22 | 0.26 | 0.55 |
| Triglycerides | 22.8 ± 2.9 | 23.7 ± 1.1 | 22.4 ± 5 | 21.8 ± 3.7 | 25.8 ± 3.1 | 17.9 ± 4.4 | 0.46 | 0.08 |
| TFA | 68.2 ± 11.6 | 68.4 ± 3.6 | 61.1 ± 11.3 | 67.7 ± 13.3 | 72.6 ± 10.2 | 57.8 ± 14.6 | 0.98 | 0.17 |
| Linoleic Acid | 25.4 ± 3.4 | 23 ± 4.5 | 21 ± 6.1 | 24.4 ± 3.7 | 27.2 ± 4.6 | 19.7 ± 8.5 | 0.75 | 0.15 |
| UFA | 47.8 ± 14.2 | 45 ± 7.1 | 39.3 ± 9.9 | 43.9 ± 10.6 | 46.8 ± 6.1 | 37.7 ± 9 | 0.78 | 0.27 |
| SFA | 20.3 ± 4.2 | 23.4 ± 6.8 | 21.8 ± 2.4 | 23.8 ± 3.7 | 25.8 ± 4.1 | 20.1 ± 5.7 | 0.48 | 0.33 |
| MUFA | 24 ± 1.8 | 26.2 ± 1.4 | 23.5 ± 4.6 | 25 ± 4.7 | 24 ± 1.9 | 20.2 ± 5.5 | 0.34 | 0.21 |
| PUFA | 23.9 ± 14.2 | 18.7 ± 8.4 | 15.8 ± 5.6 | 18.9 ± 6 | 22.9 ± 5.9 | 17.5 ± 3.9 | 0.93 | 0.48 |
| UFA-% | 69 ± 8% | 66 ± 10% | 64 ± 5% | 64 ± 4% | 65 ± 1% | 66 ± 1% | 0.58 | 0.72 |
| SFA-% | 30 ± 8% | 34 ± 10% | 36 ± 5% | 36 ± 4% | 35 ± 1% | 34 ± 1% | 0.58 | 0.72 |
| MUFA-% | 35 ± 5% | 38 ± 3% | 38 ± 2% | 37 ± 1% | 33 ± 4% | 34 ± 3% | 0.07 | 0.91 |
| PUFA-% | 33 ± 13% | 27 ± 12% | 25 ± 5% | 27 ± 4% | 31 ± 4% | 31 ± 3% | 0.82 | 0.75 |
| SFA/UFA | 0.46 ± 0.15 | 0.54 ± 0.2 | 0.58 ± 0.11 | 0.56 ± 0.1 | 0.55 ± 0.03 | 0.53 ± 0.03 | 0.72 | 0.73 |
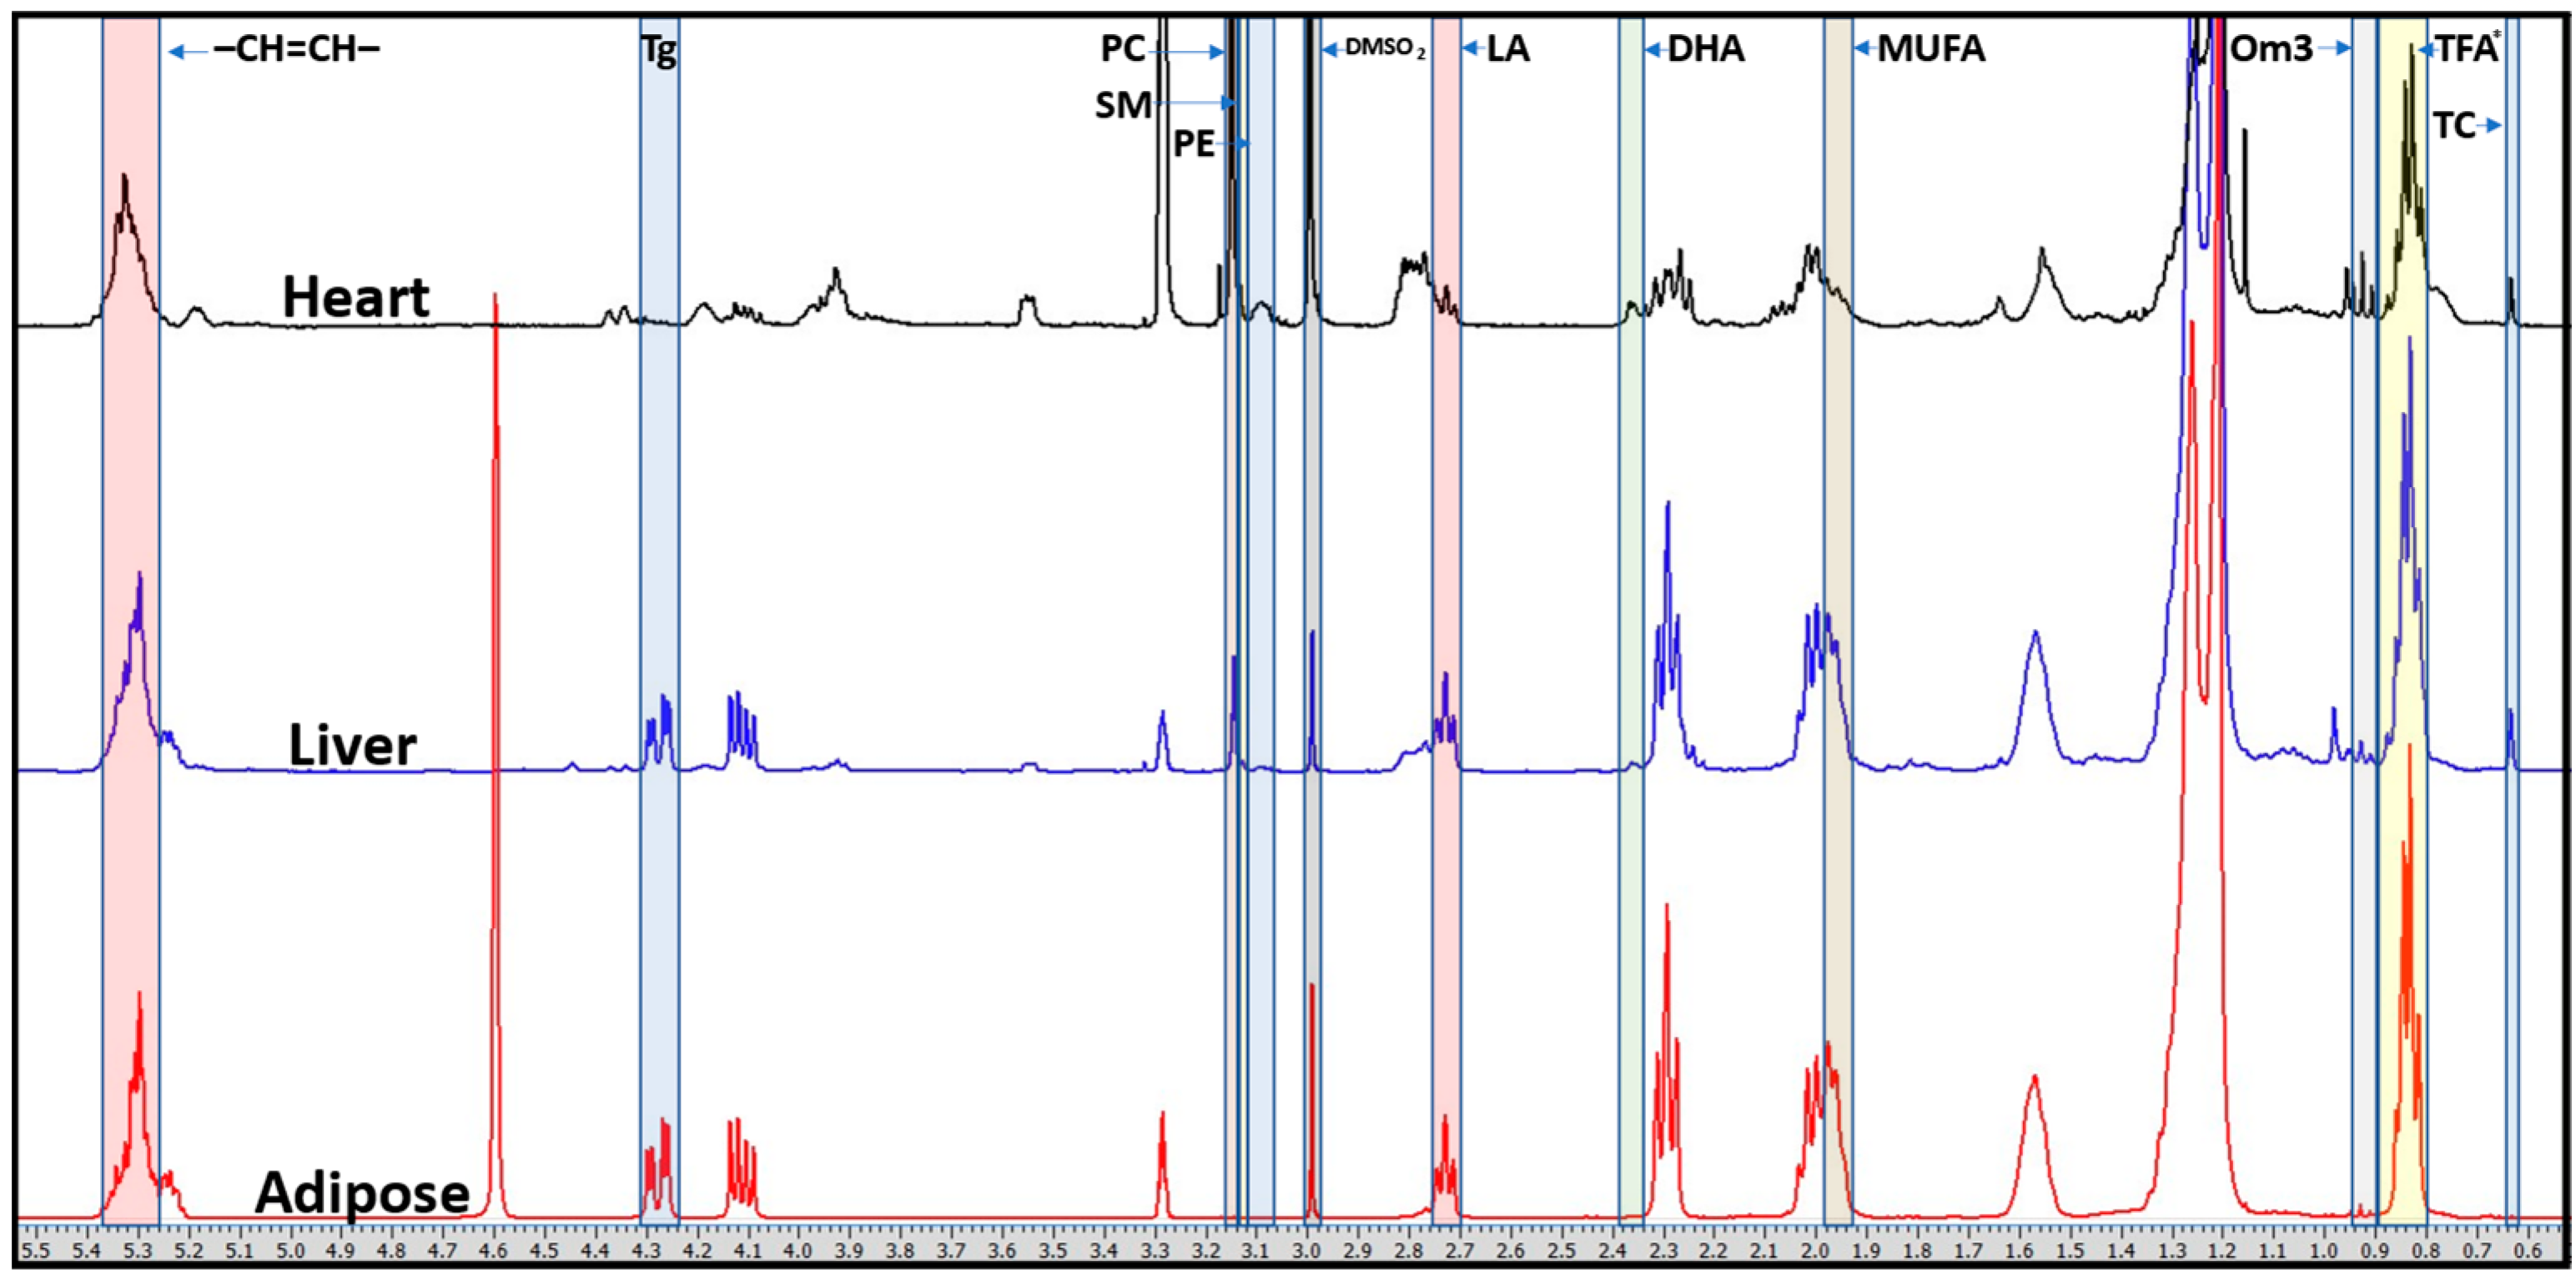
| Metabolite | Chemical Shift (ppm) and Multiplicity | Protons (n) | Organs |
|---|---|---|---|
| 3-hydroxybutyrate | 1.07 (d) | 3 | L, H |
| Acetate | 1.79 (s) | 3 | L, H |
| Alanine | 1.35 (d) | 3 | L, H |
| Aspartate | 2.69 (dd) | 2 | L, H |
| Choline | 3.08 (s) | 9 | L, H |
| Creatine | 2.91 (s) | 3 | L, H |
| Creatinine | 2.92(s) | 3 | L |
| Formate | 8.33 (s) | 1 | L |
| Fumarate | 6.39 (s) | 1 | L, H |
| Beta-Glucose | 5.11 (d) | 1 | L, H |
| Glutamate | 2.22 (m) | 2 | L, H |
| Glutamine | 2.32 (m) | 2 | L, H |
| Histidine | 7.75 (d) | 1 | L |
| Hypoxanthine | 8.04 (d) | 2 | H |
| Inosine | 8.22 (s) | 1 | L, H |
| Isoleucine | 0.89 (t) | 3 | L |
| Lactate | 1.20 (d) | 3 | L, H |
| Leucine | 0.83 (m) | 6 | L |
| Methionine | 2.49 (t) | 2 | H |
| Niacinamide | 8.81 (s) | 1 | H |
| Phenylalanine | 7.20 (d) | 2 | L |
| Succinate | 2.27 (s) | 4 | L, H |
| Taurine | 3.12 (m) | 2 | H |
| Tyrosine | 7.06 (d) | 2 | L |
| Valine | 0.91 (d) | 3 | L |
| –CH=CH– (olefinic acyl bonds) | 5.32 (m) | - | L, H, A |
| Docosahexaenoic Acid | 2.36 (d) | 4 | H |
| Linoleic Acid | 2.73 (t) | 2 | L, H, A |
| Monounsaturated Fatty Acids | 1.97 (m) | 2 | L, H, A |
| Omega-3 | 0.92 (t) | 3 | L, H, A |
| Phosphatidylcholine | 3.14 (s) | 9 | L, H, A |
| Phosphatidylethanolamine | 3.08 (t) | 2 | L, H, A |
| Sphingomyelin | 3.13 (s) | 9 | L, H, A |
| Total Cholesterol | 0.63 (s) | 3 | L, H |
| Total Fatty Acids | 0.83 (m) | 3 | L, H, A |
| Triglycerides | 4.27 (dd) | 2 | L, H, A |
Publisher’s Note: MDPI stays neutral with regard to jurisdictional claims in published maps and institutional affiliations. |
© 2022 by the authors. Licensee MDPI, Basel, Switzerland. This article is an open access article distributed under the terms and conditions of the Creative Commons Attribution (CC BY) license (https://creativecommons.org/licenses/by/4.0/).
Share and Cite
Johnson, H.; Yates, T.; Leedom, G.; Ramanathan, C.; Puppa, M.; van der Merwe, M.; Tipirneni-Sajja, A. Multi-Tissue Time-Domain NMR Metabolomics Investigation of Time-Restricted Feeding in Male and Female Nile Grass Rats. Metabolites 2022, 12, 657. https://doi.org/10.3390/metabo12070657
Johnson H, Yates T, Leedom G, Ramanathan C, Puppa M, van der Merwe M, Tipirneni-Sajja A. Multi-Tissue Time-Domain NMR Metabolomics Investigation of Time-Restricted Feeding in Male and Female Nile Grass Rats. Metabolites. 2022; 12(7):657. https://doi.org/10.3390/metabo12070657
Chicago/Turabian StyleJohnson, Hayden, Thomas Yates, Gary Leedom, Chidambaram Ramanathan, Melissa Puppa, Marie van der Merwe, and Aaryani Tipirneni-Sajja. 2022. "Multi-Tissue Time-Domain NMR Metabolomics Investigation of Time-Restricted Feeding in Male and Female Nile Grass Rats" Metabolites 12, no. 7: 657. https://doi.org/10.3390/metabo12070657