
HS-SPME-GC/MS Analysis for Revealing Carob’s Ripening


Abstract
:1. Introduction
2. Results and Discussion
2.1. Effect of Maturation on the VOCs Profile
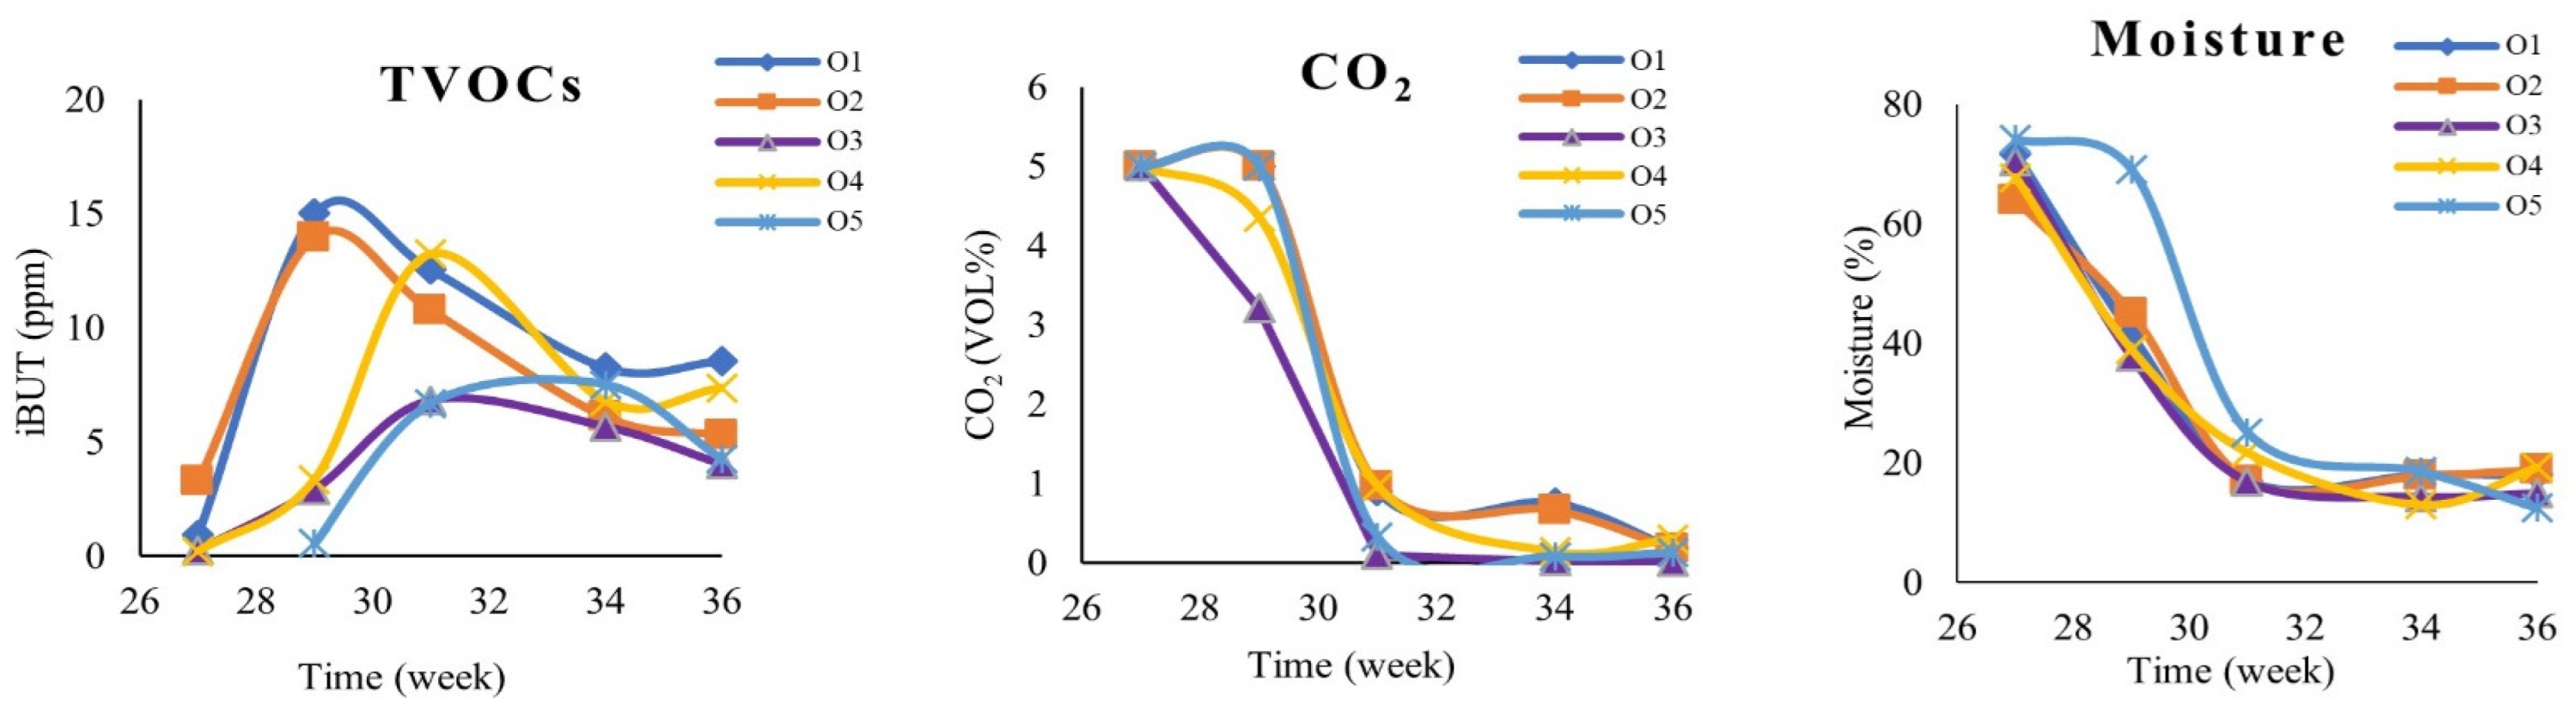
2.2. Ripening and Influence on TVOCs, CO2, and Humidity Values
3. Materials and Methods
3.1. Samples
3.2. HS-SPME-GC/MS Analysis
3.3. Determination of Moisture Content
3.4. Monitoring of Other Gaseous Emissions
4. Conclusions
Author Contributions
Funding
Institutional Review Board Statement
Informed Consent Statement
Data Availability Statement
Conflicts of Interest
References
- Ramón-Laca, L.; Mabberley, D.J. The ecological status of the carob-tree (Ceratonia siliqua, Leguminosae) in the Mediterranean. Bot. J. Linn. Soc. 2004, 144, 431–436. [Google Scholar] [CrossRef]
- Davies, W.N.L. The Carob Tree and Its Importance in the Agricultural Economy of Cyprus. Econ. Bot. 1970, 24, 460–470. [Google Scholar] [CrossRef]
- Insam, H.; Seewald, M.S.A. Volatile organic compounds (VOCs) in soils. Biol. Fertil. Soils 2010, 46, 199–213. [Google Scholar] [CrossRef] [Green Version]
- Dobson, H.E.M. Floral Volatiles in Insect Biology. In Insect-Plant Interactions; CRC Press: Boca Raton, FL, USA, 1994; pp. 47–81. [Google Scholar]
- Spracklen, D.V.; Bonn, B.; Carslaw, K.S. Boreal forests, aerosols and the impacts on clouds and climate. Philos. Trans. R. Soc. A Math. Phys. Eng. Sci. 2008, 366, 4613–4626. [Google Scholar] [CrossRef]
- Kazil, J.; Stier, P.; Zhang, K.; Quaas, J.; Kinne, S.; O’Donnell, D.; Rast, S.; Esch, M.; Ferrachat, S.; Lohmann, U.; et al. Aerosol nucleation and its role for clouds and Earth’s radiative forcing in the aerosol-climate model ECHAM5-HAM. Atmos. Chem. Phys. 2010, 10, 10733–10752. [Google Scholar] [CrossRef] [Green Version]
- Rantala, P.; Järvi, L.; Taipale, R.; Laurila, T.K.; Patokoski, J.; Kajos, M.K.; Kurppa, M.; Haapanala, S.; Siivola, E.; Petäjä, T.; et al. Anthropogenic and biogenic influence on VOC fluxes at an urban background site in Helsinki, Finland. Atmos. Chem. Phys. 2016, 16, 7981–8007. [Google Scholar] [CrossRef] [Green Version]
- Kyriacou, M.C.; Antoniou, C.; Rouphael, Y.; Graziani, G.; Kyratzis, A. Mapping the primary and secondary metabolomes of carob (Ceratonia siliqua l.) fruit and its postharvest antioxidant potential at critical stages of ripening. Antioxidants 2021, 10, 57. [Google Scholar] [CrossRef]
- Sophocleous Carob Collection during the 19th–20th Century (in Greek). 2004, pp. 128–129. Available online: http://foodmuseum.cs.ucy.ac.cy/web/guest/trofima/civitem/1770 (accessed on 1 June 2022).
- Nagashima, Y.; He, K.; Singh, J.; Metrani, R.; Crosby, K.M.; Jifon, J.; Jayaprakasha, G.K.; Patil, B.; Qian, X.; Koiwa, H. Transition of aromatic volatile and transcriptome profiles during melon fruit ripening. Plant Sci. 2021, 304, 110809. [Google Scholar] [CrossRef]
- Taiti, C.; Costa, C.; Menesatti, P.; Caparrotta, S.; Bazihizina, N.; Azzarello, E.; Petrucci, W.A.; Masi, E.; Giordani, E. Use of volatile organic compounds and physicochemical parameters for monitoring the post-harvest ripening of imported tropical fruits. Eur. Food Res. Technol. 2015, 241, 91–102. [Google Scholar] [CrossRef]
- Chen, X.; Fedrizzi, B.; Kilmartin, P.A.; Quek, S.Y. Development of volatile organic compounds and their glycosylated precursors in tamarillo (Solanum betaceum Cav.) during fruit ripening: A prediction of biochemical pathway. Food Chem. 2021, 339, 128046. [Google Scholar] [CrossRef]
- Lebrun, M.; Plotto, A.; Goodner, K.; Ducamp, M.N.; Baldwin, E. Discrimination of mango fruit maturity by volatiles using the electronic nose and gas chromatography. Postharvest Biol. Technol. 2008, 48, 122–131. [Google Scholar] [CrossRef]
- Li, H.; Brouwer, B.; Oud, N.; Verdonk, J.C.; Tikunov, Y.; Woltering, E.; Schouten, R.; Pereira da Silva, F. Sensory, GC-MS and PTR-ToF-MS profiling of strawberries varying in maturity at harvest with subsequent cold storage. Postharvest Biol. Technol. 2021, 182, 111719. [Google Scholar] [CrossRef]
- White, I.R.; Blake, R.S.; Taylor, A.J.; Monks, P.S. Metabolite profiling of the ripening of Mangoes Mangifera indica L. cv. ‘Tommy Atkins’ by real-time measurement of volatile organic compounds. Metabolomics 2016, 12, 57. [Google Scholar] [CrossRef] [PubMed] [Green Version]
- Custódio, L.; Serra, H.; Nogueira, J.M.F.; Gonçalves, S.; Romano, A. Analysis of the volatiles emitted by whole flowers and isolated flower organs of the carob tree using HS-SPME-GC/MS. J. Chem. Ecol. 2006, 32, 929–942. [Google Scholar] [CrossRef]
- Farag, M.A.; Rasheed, D.M.; Kamal, I.M. Volatiles and primary metabolites profiling in two Hibiscus sabdariffa (roselle) cultivars via headspace SPME-GC-MS and chemometrics. Food Res. Int. 2015, 78, 327–335. [Google Scholar] [CrossRef]
- Krokou, A.; Stylianou, M.; Agapiou, A. Assessing the volatile profile of carob tree (Ceratonia siliqua L.). Environ. Sci. Pollut. Res. 2019, 26, 35365–35374. [Google Scholar] [CrossRef]
- Krokou, A.; Kokkinofta, R.; Stylianou, M.; Agapiou, A. Decoding carob flavor aroma using HS–SPME–GC–MS and chemometrics. Eur. Food Res. Technol. 2020, 246, 1419–1428. [Google Scholar] [CrossRef]
- Kokkinofta, R.; Yiannopoulos, S.; Stylianou, M.A.; Agapiou, A. Use of chemometrics for correlating carobs nutritional compositional values with geographic origin. Metabolites 2020, 10, 62. [Google Scholar] [CrossRef] [Green Version]
- Li, G.; Jia, H.; Wu, R.; Teng, Y. Changes in volatile organic compound composition during the ripening of “Nanguoli” pears (Pyrus ussuriensis Maxim) harvested at different growing locations. J. Hortic. Sci. Biotechnol. 2013, 88, 563–570. [Google Scholar] [CrossRef]
- Liu, Y.; Bu, M.; Gong, X.; He, J.; Zhan, Y. Characterization of the volatile organic compounds produced from avocado during ripening by gas chromatography ion mobility spectrometry. J. Sci. Food Agric. 2021, 101, 666–672. [Google Scholar] [CrossRef]
- Nouri, F.G.; Chen, Z.; Maqbool, M. Monitoring Mango Fruit Ripening after Harvest using Electronic Nose (zNose TM) Technique. IPCBEE 2014, 65, 36–40. [Google Scholar] [CrossRef]
- Obenland, D.; Collin, S.; Sievert, J.; Negm, F.; Arpaia, M.L. Influence of maturity and ripening on aroma volatiles and flavor in “Hass” avocado. Postharvest Biol. Technol. 2012, 71, 41–50. [Google Scholar] [CrossRef]
- Li, C.; Xin, M.; Li, L.; He, X.; Yi, P.; Tang, Y.; Li, J.; Zheng, F.; Liu, G.; Sheng, J.; et al. Characterization of the aromatic profile of purple passion fruit (Passiflora edulis Sims) during ripening by HS-SPME-GC/MS and RNA sequencing. Food Chem. 2021, 355, 129685. [Google Scholar] [CrossRef] [PubMed]
- Liu, X.; Fan, P.; Jiang, J.; Gao, Y.; Liu, C.; Li, S.; Liang, Z. Evolution of volatile compounds composition during grape berry development at the germplasm level. Sci. Hortic. 2022, 293, 110669. [Google Scholar] [CrossRef]
- Baldassarre, V.; Cabassi, G.; Spadafora, N.D.; Aprile, A.; Müller, C.T.; Rogers, H.J.; Ferrante, A. Wounding tomato fruit elicits ripening-stage specific changes in gene expression and production of volatile compounds. J. Exp. Bot. 2015, 66, 1511–1526. [Google Scholar] [CrossRef]
- Ceccarelli, A.; Farneti, B.; Frisina, C.; Allen, D.; Donati, I.; Cellini, A.; Costa, G.; Spinelli, F.; Stefanelli, D. Harvest maturity stage and cold storage length influence on flavour development in peach fruit. Agronomy 2019, 9, 10. [Google Scholar] [CrossRef] [Green Version]
- Xi, W.; Zheng, H.; Zhang, Q.; Li, W. Profiling taste and aroma compound metabolism during apricot fruit development and ripening. Int. J. Mol. Sci. 2016, 17, 998. [Google Scholar] [CrossRef] [Green Version]
- Antoniou, C.; Kyratzis, A.C.; Soteriou, G.A.; Rouphael, Y.; Kyriacou, M.C. Configuration of the Volatile Aromatic Profile of Carob Powder Milled from Pods of Genetic Variants Harvested at Progressive Stages of Ripening from High and Low Altitudes. Front. Nutr. 2021, 8, 789169. [Google Scholar] [CrossRef]
- Ben Othmen, K.; Garcia-Beltrán, J.M.; Elfalleh, W.; Haddad, M.; Esteban, M.Á. Phytochemical Compounds and Biological Properties of Carob Pods (Ceratonia siliqua L.) Extracts at Different Ripening Stages. Waste Biomass Valoriz. 2021, 12, 4975–4990. [Google Scholar] [CrossRef]
- Xiang, W.; Zhang, X.; Chen, K.; Fang, J.; He, F.; Hu, X.; Tsang, D.C.W.; Sik, Y.; Gao, B. Enhanced adsorption performance and governing mechanisms of ball-milled biochar for the removal of volatile organic compounds (VOCs). Chem. Eng. J. 2020, 385, 123842. [Google Scholar] [CrossRef]
- Farag, M.A.; El-Kersh, D.M. Volatiles profiling in Ceratonia siliqua (Carob bean) from Egypt and in response to roasting as analyzed via solid-phase microextraction coupled to chemometrics. J. Adv. Res. 2017, 8, 379–385. [Google Scholar] [CrossRef] [PubMed]
- Racolța, E.; Tofană, M.; Mureșan, C.C.; Socaci, S.; Galchiș, G.F.; Mureșan, V. Volatile Compounds and Sensory Evaluation of Spreadable Creams Based on Roasted Sunflower Kernels and Cocoa or Carob Powder. Bull. Univ. Agric. Sci. Vet. Med. Cluj-Napoca. Food Sci. Technol. 2014, 71, 107–113. [Google Scholar] [CrossRef] [Green Version]
- Cantalejo, M.J. Sensor analyses of volatile components derived from earth-almond Cyperus esculentus L. and carob Ceratonia siliqua L. Eur. Food Res. Technol. 1999, 208, 373–378. [Google Scholar] [CrossRef]
- Javed, F.; Shahbaz, H.M.; Nawaz, A.; Olaimat, A.N.; Stratakos, A.C.; Wahyono, A.; Munir, S.; Mueen-ud-din, G.; Ali, Z.; Park, J. Formation of furan in baby food products: Identification and technical challenges. Compr. Rev. Food Sci. Food Saf. 2021, 20, 2699–2715. [Google Scholar] [CrossRef]
- Burg, S.P.; Burg, E.A. Interaction of ethylene, oxygen and carbon dioxide in the control of fruit ripening. Qual. Plant. Mater. Veg. 1969, 19, 185–200. [Google Scholar] [CrossRef]
- World Weather Online. 2020. Available online: https://www.worldweatheronline.com/ (accessed on 1 June 2022).


| Sample Type | Analytical Method | Ripening Biomarkers | References |
|---|---|---|---|
| Purple passion fruit (Passiflora edulis Sims) | Headspace solid-phase micro extraction gas chromatography/mass spectrometry (HS-SPME-GC/MS) | 85 volatile organic compounds (VOCs) (e.g., esters, ketones, alcohols, hydrocarbons, aldehydes, and terpenes) increased at the intermediate and ripe stages (purple color); 49 VOCs were not detected in the immature stage (green color); 11 VOCs (9 esters and 2 alcohols) were found in the ripe stage (symbols for ripe fruits). | [25] |
| Tamarillo (Solanum betaceum Cav.) | HS-SPME-GC/MS | Increase in acids, esters, and terpenoids/decrease in alcohols, phenols; Increase in color index (CI) values and sugars; Color changes from green to red; Softening of the flesh. | [12] |
| Grape berry | HS-SPME-GC/MS | During the three developmental stages: Increase in aldehydes; Alcohols, ketones, and hydrocarbons compounds did not change; Increase in esters (bourbonene, ethyl geranate, (Z)-butanoic acid, 3-hexenyl ester, and dodecanoic acid ethyl ester are the most dominant esters at ripening stage); Increase in monoterpenes at veraison and ripening stage; Decrease in sesquiterpenes after fruit-set stage. | [26] |
| Wounding tomato | HS-SPME-GC/MS | 40 VOCs were detected and changed at the ripening stage; hexadecane, dodecane, tetradecane,1-chloro, and sulfur compounds (dimethyl disulfide and 2-isobutyl thiazole) were characteristic of the light red developmental stages. | [27] |
| Strawberry | HS-SPME-GC/MS | Peak intensities of most esters (except for methyl butanoate and methyl hexanoate) and furanones raised during ripening; Red coloration and lower astringent attributes in ripe fruit; Increase in aldehydes and alcohols (e.g., 1-hexanol, 2-hexen-ol, 1-octanol, furaneol, mesifuran, propanal, hexanal, and benzaldehyde), as well as volatile fatty acids; 2-Hexenal was characteristic for the unripe fruit. | [14] |
| Exotic fruits (avocado, banana, mango, and mangosteen) | Proton-transfer-reaction time-of flight/mass spectrometry (PTR-TOF/MS) | 70 VOCs in avocado, 75 VOCs in banana pulp, 85 VOCs in mango, and 53 VOCs in mangosteen were identified; Ripe fruits: methanol, acetaldehyde, and ethanol were the most abundant compounds. Μethanol emissions for avocado, banana, and mangosteen increased, while methanol concentration in mango remained constant. Only for mango fruits, monoterpenes showed a strong discriminating power; Unripe fruits: monoterpenes, sesquiterpenes, cis- and trans-hexenal, and terpenes. | [11] |
| Mangoes (Mangifera indica L. cv.) | PTR-TOF/MS | Potential differentiation of ripe ‘Tommy Atkins’ and ‘Keitt’ mangoes; Mono- and sesquiterpenes, methanol, ethanol, acetaldehyde, and esters were related with mango ripeness. | [15] |
| Peach (Prunus persica L. Batsch) | HS-SPME-GC/MS | 18 VOCs (lactones, esters, alcohols, aldehydes) were detected. Ripen fruits: increase (↑) of lactones and esters, decrease (↓) of aldehydes. Immature fruits: ↑ (Z)-3-hexen-1-ol and (Z)-3-hexenal. | [28] |
| Apricot (Prunus armeniaca L.) | HS-SPME-GC/MS | 47 VOCs (6 aldehydes, 5 alcohols, 7 esters, 5 norisoprenoids, 8 lactones, 10 terpenes, and 6 acids) were reported; ↓ Total aldehydes (hexanal, (Z)-3-hexenal, and (E, Z)-2,6-nonadienal); ↓ Total terpenes (β-myrcene, linalool, α-terpineol, geraniol, and limonene); ↑ Apocarotenoids (β-damascenone, β-ionone, and dihydro-β-ionone); ↑ Total lactones; ↑ Hexyl acetate and (Z)-3-hexenyl acetate. | [29] |
| Avocado | Gas chromatography/ion mobility spectrometry (GC/IMS) | 30 VOCs; Reduction in phenol and acrolein; Increase in chloroform, isoprene, and acetone. | [22] |
| Mango | e-nose | Ripened fruit: ↑ TVOCs, especially α- and β-pinene, limonene, γ-terpinene, α-terpinolene, β-caryophyllene, α-hmulene, 3-carene, myrcene and α-terpinene; Green fruit: ↑ Hexanal, octanal, and cis-3-hexenol. | [13] |
| Carob powder | HS-SPME-GC/MS | 56 VOCs (acids, esters, aldehydes, ketones, alcohols, furans, alkanes); ↑ Acids (isobutyric acid, most abundant); ↓ Aldehydes and alcohols. Immature stages: Isobutyrate and methyl isobutyrate ester. | [30] |
| Compound | a W26–28 | b SD | W29–30 | SD | W31–32 | SD | W34–35 | SD | W35–36 | SD | Reference |
|---|---|---|---|---|---|---|---|---|---|---|---|
| Acids | |||||||||||
| Acetic acid | 0.05 | 0.11 | 1.34 | 1.15 | 5.77 | 1.91 | 4.33 | 1.55 | 6.06 | 2.75 | * CF [18], ** CP [18,32] |
| Propanoic acid | 0.00 | 0.00 | 0.00 | 0.00 | 0.06 | 0.05 | 0.04 | 0.03 | 0.07 | 0.06 | CF [18], CP [18,32,33] |
| Propanoic acid, 2-methyl- | 3.70 | 4.16 | 13.19 | 10.86 | 22.18 | 5.05 | 44.57 | 7.28 | 40.54 | 3.27 | CF [18], CP [18,32,33] |
| Butanoic acid | 0.16 | 0.31 | 1.03 | 0.90 | 2.86 | 1.15 | 3.60 | 0.84 | 3.97 | 1.82 | CF [18], CP [18,32,33] |
| Butanoic acid, 3-methyl- | 0.00 | 0.00 | 0.03 | 0.03 | 0.05 | 0.06 | 0.05 | 0.03 | 0.08 | 0.09 | CF [18], CP [32] |
| Butanoic acid, 2-methyl- | 0.00 | 0.00 | 0.25 | 0.26 | 0.49 | 0.24 | 1.12 | 0.29 | 1.20 | 0.49 | CF [18] |
| Hexanoic acid | 0.00 | 0.00 | 0.19 | 0.24 | 0.85 | 0.33 | 1.12 | 0.34 | 1.30 | 0.61 | CF [18,33], CP [18,32] |
| Alcohols | |||||||||||
| 1-Propanol, 2-methyl- | 5.31 | 0.00 | 0.00 | 0.00 | 0.00 | 0.00 | 0.00 | 0.00 | 0.00 | 0.00 | |
| Ethanol | 9.32 | 10.09 | 8.30 | 11.96 | 0.20 | 0.14 | 0.04 | 0.04 | 0.35 | 0.66 | CF [18], CP [18,32] |
| 4-Hexen-1-ol | 0.00 | 0.00 | 0.00 | 0.00 | 0.00 | 0.00 | 0.01 | 0.02 | 0.11 | 0.15 | |
| Aldehydes | |||||||||||
| Acetaldehyde | 0.64 | 1.08 | 0.33 | 0.18 | 0.13 | 0.04 | 0.23 | 0.09 | 0.46 | 0.51 | CF [18], CP [18,32] |
| Propanal, 2-methyl- | 0.41 | 0.81 | 0.27 | 0.30 | 0.34 | 0.26 | 0.40 | 0.34 | 0.88 | 1.19 | CF [18], CP [18,32] |
| Butanal | 0.00 | 0.00 | 0.04 | 0.05 | 0.00 | 0.01 | 0.00 | 0.00 | 0.04 | 0.08 | CP [18,32] |
| Butanal, 3-methyl- | 0.24 | 0.49 | 0.19 | 0.25 | 0.51 | 0.34 | 0.49 | 0.37 | 1.22 | 1.66 | CF [18], CP [18,32] |
| Butanal, 2-methyl- | 0.16 | 0.32 | 0.17 | 0.25 | 0.19 | 0.23 | 0.11 | 0.16 | 0.00 | 0.00 | CF [18], CP [18,32] |
| Hexanal | 0.00 | 0.00 | 0.22 | 0.27 | 0.33 | 0.11 | 0.30 | 0.18 | 0.47 | 0.49 | |
| Heptanal | 0.00 | 0.00 | 0.00 | 0.00 | 0.00 | 0.00 | 0.00 | 0.00 | 0.04 | 0.09 | |
| Benzaldehyde | 0.00 | 0.00 | 0.02 | 0.02 | 0.19 | 0.14 | 0.13 | 0.12 | 0.26 | 0.22 | CF [18], CP [18,32,33] |
| Octanal | 0.00 | 0.00 | 0.00 | 0.00 | 0.00 | 0.00 | 0.01 | 0.02 | 0.11 | 0.21 | |
| Nonanal | 0.00 | 0.00 | 0.00 | 0.00 | 0.11 | 0.05 | 0.16 | 0.05 | 0.23 | 0.21 | CF [18], CP [18,32] |
| Esters | |||||||||||
| Acetic acid, methyl ester | 0.00 | 0.00 | 0.23 | 0.32 | 0.46 | 0.16 | 0.81 | 0.19 | 1.06 | 0.61 | CF [18], CP [18,32] |
| Ethyl Acetate | 0.85 | 1.47 | 6.39 | 11.10 | 0.99 | 0.47 | 0.59 | 0.43 | 0.49 | 0.55 | CF [18], CP [18,32] |
| Methyl propionate | 0.00 | 0.00 | 0.00 | 0.00 | 0.01 | 0.01 | 0.03 | 0.02 | 0.06 | 0.08 | CF [18], CP [18,32] |
| Methyl isobutyrate | 0.77 | 1.00 | 1.79 | 1.46 | 2.75 | 2.06 | 3.56 | 1.26 | 4.80 | 2.21 | |
| Propanoic acid, ethyl ester | 0.03 | 0.06 | 0.06 | 0.11 | 0.02 | 0.02 | 0.02 | 0.03 | 0.01 | 0.01 | |
| n-Propyl acetate | 0.00 | 0.00 | 0.06 | 0.12 | 0.00 | 0.01 | 0.00 | 0.00 | 0.00 | 0.00 | |
| Butanoic acid, methyl ester | 0.00 | 0.00 | 0.09 | 0.09 | 0.81 | 0.18 | 1.50 | 0.28 | 2.53 | 2.32 | CF [18], CP [18,32] |
| Propanoic acid, 2-methyl-, ethyl ester | 6.32 | 9.16 | 14.68 | 5.29 | 7.24 | 4.67 | 4.32 | 2.68 | 3.37 | 2.86 | CF [18], CP [18] |
| Isobutyl acetate | 0.13 | 0.26 | 5.46 | 7.20 | 0.27 | 0.24 | 0.07 | 0.07 | 0.14 | 0.20 | CP [18,32] |
| Butanoic acid, 2-methyl-, methyl ester | 0.00 | 0.00 | 0.03 | 0.04 | 0.06 | 0.05 | 0.10 | 0.05 | 0.15 | 0.09 | CF [18], CP [18,32] |
| Butanoic acid, ethyl ester | 0.07 | 0.14 | 0.79 | 0.71 | 1.15 | 0.48 | 0.68 | 0.36 | 0.98 | 1.43 | CF [18], CP [18,32] |
| Butanoic acid, 2-methyl-, ethyl ester | 0.48 | 0.69 | 0.42 | 0.40 | 0.04 | 0.08 | 0.03 | 0.05 | 0.26 | 0.46 | CF [18], CP [18,32] |
| Butanoic acid, 3-methyl-, ethyl ester | 0.09 | 0.09 | 0.09 | 0.03 | 0.00 | 0.00 | 0.00 | 0.00 | 0.00 | 0.00 | |
| Propanoic acid, 2-methyl-, propyl ester | 0.00 | 0.00 | 0.19 | 0.24 | 0.22 | 0.15 | 0.10 | 0.05 | 0.10 | 0.06 | |
| 1-Butanol, 3-methyl-, acetate | 0.74 | 1.37 | 0.32 | 0.39 | 0.41 | 0.20 | 0.33 | 0.12 | 0.76 | 0.56 | CF [18], |
| 1-Butanol, 2-methyl-, acetate | 0.00 | 0.00 | 0.10 | 0.18 | 0.10 | 0.05 | 0.06 | 0.02 | 0.16 | 0.11 | |
| Propanoic acid, 2-methyl-, 2-methylpropyl ester | 0.58 | 1.16 | 8.22 | 7.55 | 8.57 | 9.82 | 2.19 | 3.15 | 2.63 | 4.77 | CP [18,32] |
| Hexanoic acid, methyl ester | 0.05 | 0.11 | 0.21 | 0.13 | 1.18 | 0.15 | 1.56 | 0.14 | 3.21 | 3.31 | CF [18], CP [18,32] |
| Butanoic acid, 2-methylpropyl ester | 0.00 | 0.00 | 0.32 | 0.36 | 0.87 | 0.85 | 0.26 | 0.23 | 0.99 | 1.60 | CP [32] |
| Propanoic acid, 2-methyl-, 1-methylbutyl ester | 0.00 | 0.00 | 0.20 | 0.13 | 0.67 | 0.31 | 0.51 | 0.43 | 0.79 | 0.57 | |
| Butanoic acid, butyl ester | 0.00 | 0.00 | 0.00 | 0.00 | 0.02 | 0.04 | 0.00 | 0.00 | 0.08 | 0.16 | |
| Hexanoic acid, ethyl ester | 0.06 | 0.13 | 0.94 | 0.88 | 1.06 | 0.41 | 0.49 | 0.26 | 0.98 | 1.57 | CP [32] |
| Butanoic acid, 2-methyl-, 2-methyl propyl ester | 0.00 | 0.00 | 0.36 | 0.42 | 0.44 | 0.47 | 0.11 | 0.13 | 0.56 | 0.92 | |
| Isobutyl isovalerate | 0.00 | 0.00 | 0.03 | 0.03 | 0.01 | 0.02 | 0.00 | 0.00 | 0.04 | 0.08 | |
| Propanoic acid, 2-methyl-, 2-methyl butyl ester | 0.00 | 0.00 | 0.96 | 0.85 | 5.45 | 0.81 | 6.22 | 1.29 | 13.19 | 10.99 | CF [18], CP [18,32] |
| Propanoic acid, 2-methyl-, 3-methyl butyl ester | 0.00 | 0.00 | 0.62 | 0.58 | 1.82 | 0.74 | 1.82 | 0.56 | 4.29 | 3.94 | |
| 2-Heptanol, acetate | 0.00 | 0.00 | 0.22 | 0.00 | 0.00 | 0.00 | 0.00 | 0.00 | 0.00 | 0.00 | |
| Propanoic acid, 2-methyl-, butyl ester | 0.00 | 000 | 0.43 | 0.53 | 0.48 | 0.43 | 0.24 | 0.29 | 0.27 | 0.29 | |
| Butanoic acid, 3-methylbutyl ester | 0.00 | 0.00 | 0.00 | 0.00 | 0.17 | 0.12 | 0.21 | 0.08 | 0.68 | 0.92 | |
| Butanoic acid, 2-methylbutyl ester | 0.00 | 0.00 | 0.00 | 0.00 | 0.04 | 0.05 | 0.01 | 0.01 | 0.17 | 0.23 | |
| Butanoic acid, 2-methyl-, 3-methylbutyl ester | 0.00 | 0.00 | 0.00 | 0.00 | 0.06 | 0.06 | 0.07 | 0.04 | 0.31 | 0.40 | |
| Butanoic acid, 2-methyl-, 2-methylbutyl ester | 0.00 | 0.00 | 0.00 | 0.00 | 0.02 | 0.03 | 0.00 | 0.00 | 0.24 | 0.34 | |
| Propanoic acid, 2-methyl-, hexyl ester | 0.00 | 0.00 | 0.15 | 0.16 | 0.55 | 0.43 | 0.43 | 0.21 | 0.86 | 0.91 | |
| Hexanoic acid, 2-methylpropyl ester | 0.00 | 000 | 0.21 | 0.26 | 0.51 | 0.59 | 0.11 | 0.12 | 0.56 | 0.96 | |
| Butanoic acid, 1-methylhexyl ester | 0.00 | 0.00 | 0.42 | 0.31 | 1.08 | 0.68 | 0.72 | 0.32 | 1.38 | 0.78 | |
| Isopentyl hexanoate | 0.00 | 0.00 | 0.00 | 0.00 | 0.03 | 0.04 | 0.34 | 0.48 | 0.16 | 0.23 | |
| Ketones | |||||||||||
| Acetone | 15.62 | 13.13 | 0.54 | 0.44 | 0.34 | 0.19 | 0.54 | 0.23 | 0.60 | 0.31 | CF [18], CP [18,32] |
| 2,3-Butanedione | 0.00 | 0.00 | 0.37 | 0.37 | 0.32 | 0.15 | 0.30 | 0.13 | 0.42 | 0.30 | CF [18], CP [18] |
| 2-Butanone | 0.00 | 0.00 | 0.03 | 0.03 | 0.05 | 0.01 | 0.06 | 0.02 | 0.10 | 0.07 | CF [18], CP [18] |
| 2-Pentanone | 5.06 | 9.71 | 9.02 | 3.27 | 6.84 | 2.51 | 3.70 | 1.06 | 4.06 | 1.49 | CF [18], CP [18] |
| 3-Pentanone | 1.31 | 2.26 | 0.31 | 0.31 | 0.09 | 0.07 | 0.01 | 0.02 | 0.01 | 0.01 | |
| 2-Hexanone | 0.06 | 0.11 | 0.14 | 0.10 | 0.19 | 0.08 | 0.11 | 0.06 | 0.25 | 0.25 | CF [18], CP [18] |
| 4-Heptanone | 0.58 | 1.17 | 0.34 | 0.30 | 0.22 | 0.08 | 0.09 | 0.08 | 0.09 | 0.11 | |
| 2-Heptanone | 5.51 | 11.03 | 9.97 | 8.74 | 17.01 | 6.78 | 10.78 | 4.65 | 13.74 | 6.64 | CF [18,34] |
| 3-Hepten-2-one | 0.00 | 0.00 | 0.01 | 0.02 | 0.13 | 0.06 | 0.11 | 0.03 | 0.20 | 0.18 | |
| 2-Octanone | 0.25 | 0.00 | 1.13 | 0.00 | 0.00 | 0.00 | 0.00 | 0.00 | 0.00 | 0.00 | CF [18] |
| 4-Nonanone | 0.15 | 0.30 | 0.18 | 0.11 | 0.15 | 0.05 | 0.04 | 0.05 | 0.11 | 0.13 | |
| 2-Nonanone | 0.39 | 0.79 | 1.18 | 0.85 | 2.14 | 0.61 | 1.72 | 0.43 | 2.84 | 1.62 | CF [18], CP [18] |
| Furans | |||||||||||
| Furan, 2-methyl- | 0.30 | 0.59 | 0.13 | 0.24 | 0.03 | 0.01 | 0.03 | 0.02 | 0.14 | 0.24 | CF [18], CP [18] |
| Furan, 3-methyl- | 20.27 | 13.66 | 2.38 | 3.01 | 0.00 | 0.00 | 0.00 | 0.00 | 0.00 | 0.00 | CP [32] |
| Furan, 2-ethyl- | 0.00 | 0.00 | 0.00 | 0.00 | 0.03 | 0.03 | 0.01 | 0.01 | 0.10 | 0.15 | |
| Furan, 2,5-dimethyl- | 0.00 | 0.00 | 0.00 | 0.00 | 0.00 | 0.00 | 0.00 | 0.00 | 0.07 | 0.13 | |
| Furan, 2-pentyl- | 0.00 | 0.00 | 0.03 | 0.03 | 0.01 | 0.01 | 0.00 | 0.00 | 0.13 | 0.25 | |
| Hydrocarbons | |||||||||||
| Pentane | 10.23 | 359 | 0.33 | 0.47 | 0.00 | 0.00 | 0.00 | 0.00 | 0.00 | 0.00 | CF [18], CP [18,32] |
| Isoprene | 20.49 | 5.92 | 0.41 | 0.58 | 0.00 | 0.00 | 0.00 | 0.00 | 0.00 | 0.00 | |
| 4-methyl-1,3-pentadiene | 0.00 | 0.00 | 0.10 | 0.21 | 0.00 | 0.00 | 0.00 | 0.00 | 0.03 | 0.06 | |
| Octane | 0.72 | 1.27 | 0.08 | 0.07 | 0.16 | 0.09 | 0.10 | 0.12 | 0.38 | 0.50 | CF [18], CP [18,32] |
| Styrene | 5.86 | 7.53 | 4.24 | 3.24 | 0.02 | 0.03 | 0.00 | 0.00 | 0.00 | 0.00 | |
| Limonene | 0.00 | 0.00 | 0.02 | 0.04 | 0.00 | 0.00 | 0.00 | 0.00 | 0.15 | 0.26 | CF [18], CP [18,32] |
| o-Cymene | 0.54 | 0.54 | 0.12 | 0.12 | 0.00 | 0.00 | 0.04 | 0.04 | 0.00 | 0.00 | CF [18], CP [18,32] |
| Toluene | 5.92 | 0.00 | 0.00 | 0.00 | 0.00 | 0.00 | 0.00 | 0.00 | 0.00 | 0.00 | CF [18] |
| Others | |||||||||||
| Disulfide, dimethyl | 2.51 | 5.02 | 0.00 | 0.00 | 0.03 | 0.05 | 0.12 | 0.21 | 0.79 | 1.43 | CF [18], CP [18,32] |
| Carob Orchard (Codes) | Village (District) | Coordinates/Altitude | Annual Average Rainfall 2020 (mm) [38] |
|---|---|---|---|
| O1 | Livadia (Larnaca) | 34°56′49.2″ N, 33°37′50.3″ E (34.947000, 33.630639) | 235 |
| O2 | Maroni (Larnaca) | 34°45′15.5″ N, 33°22′44.3″ E (34.754315, 33.378971) | 684 |
| O3 | Skarinou (Larnaca) | 34°48′36.6″ N, 33°21′21.1″ E (34.810172, 33.355856) | 740 |
| O4 | Mazotos (Larnaca) | 34°48′27.6″ N, 33°29’51.4″ E (34.807672, 33.497615) | 235 |
| O5 | Kokkinotrimithia (Nicosia) | 35°08′32.1″ N, 33°12′15.7″ E (35.142242, 33.204372) | 443 |
Publisher’s Note: MDPI stays neutral with regard to jurisdictional claims in published maps and institutional affiliations. |
© 2022 by the authors. Licensee MDPI, Basel, Switzerland. This article is an open access article distributed under the terms and conditions of the Creative Commons Attribution (CC BY) license (https://creativecommons.org/licenses/by/4.0/).
Share and Cite
Fella, P.; Kaikiti, K.; Stylianou, M.; Agapiou, A. HS-SPME-GC/MS Analysis for Revealing Carob’s Ripening. Metabolites 2022, 12, 656. https://doi.org/10.3390/metabo12070656
Fella P, Kaikiti K, Stylianou M, Agapiou A. HS-SPME-GC/MS Analysis for Revealing Carob’s Ripening. Metabolites. 2022; 12(7):656. https://doi.org/10.3390/metabo12070656
Chicago/Turabian StyleFella, Panagiota, Kyriaki Kaikiti, Marinos Stylianou, and Agapios Agapiou. 2022. "HS-SPME-GC/MS Analysis for Revealing Carob’s Ripening" Metabolites 12, no. 7: 656. https://doi.org/10.3390/metabo12070656