
Renal Sinus Fat Is Expanded in Patients with Obesity and/or Hypertension and Reduced by Bariatric Surgery Associated with Hypertension Remission

 , , , and
Abstract
:1. Introduction
2. Results
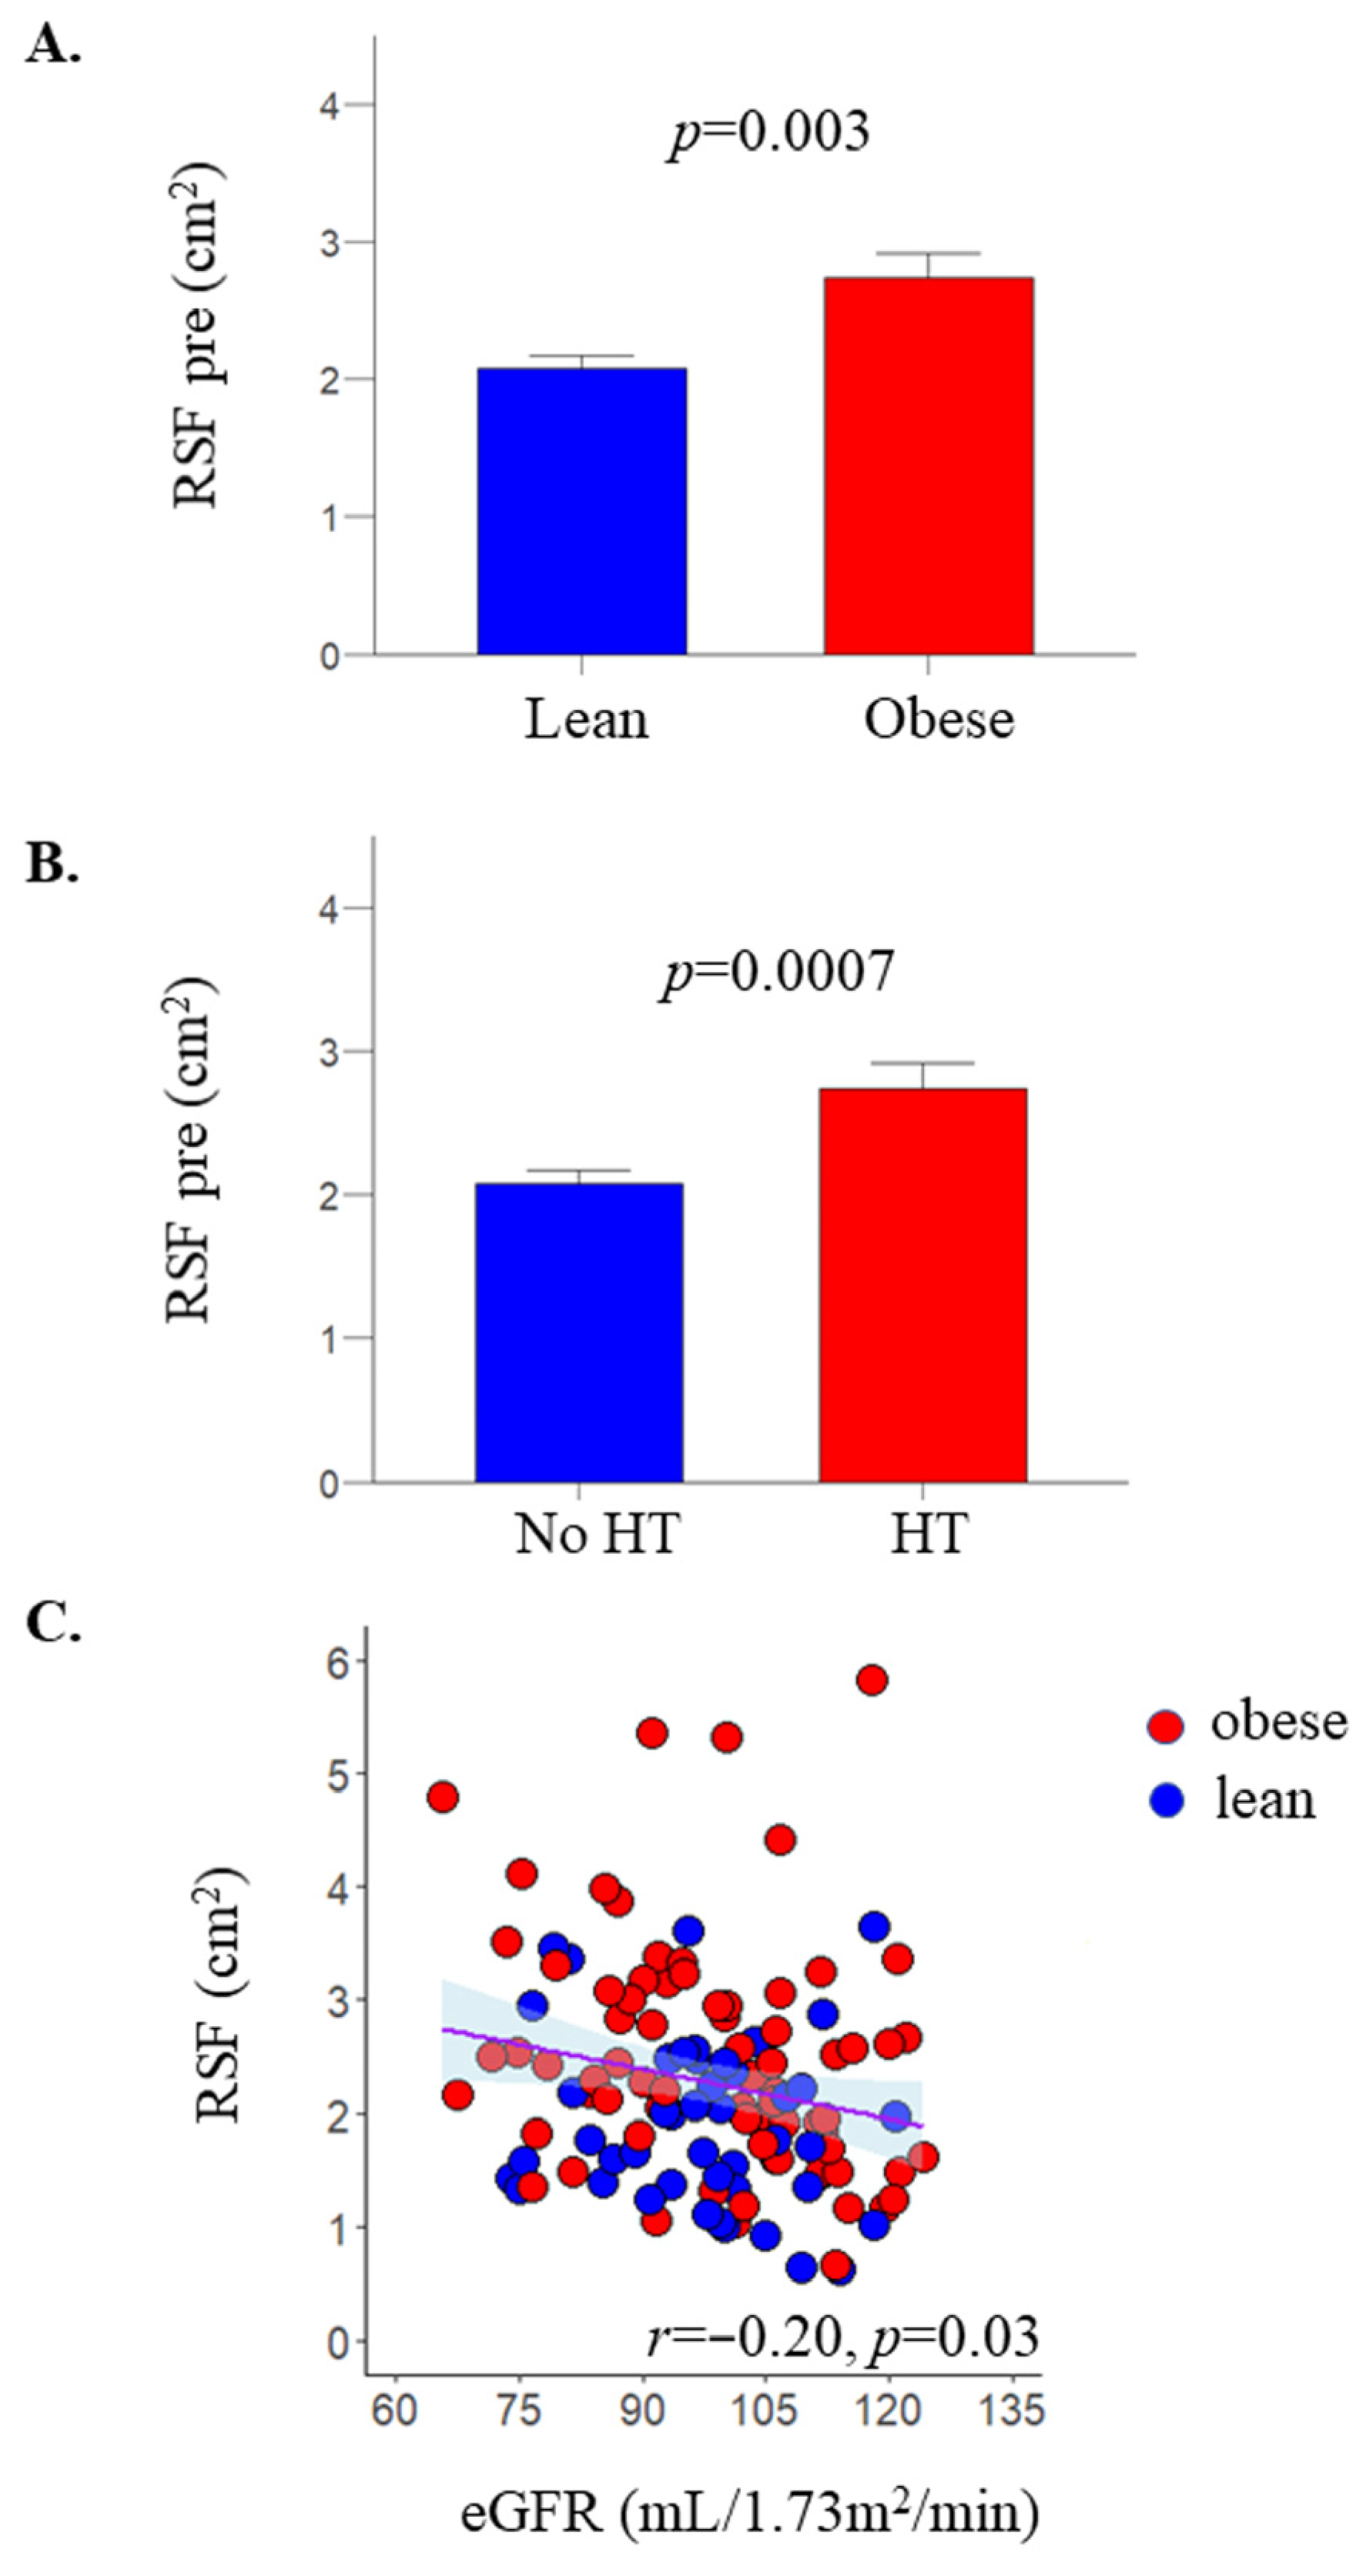
2.1. RSF
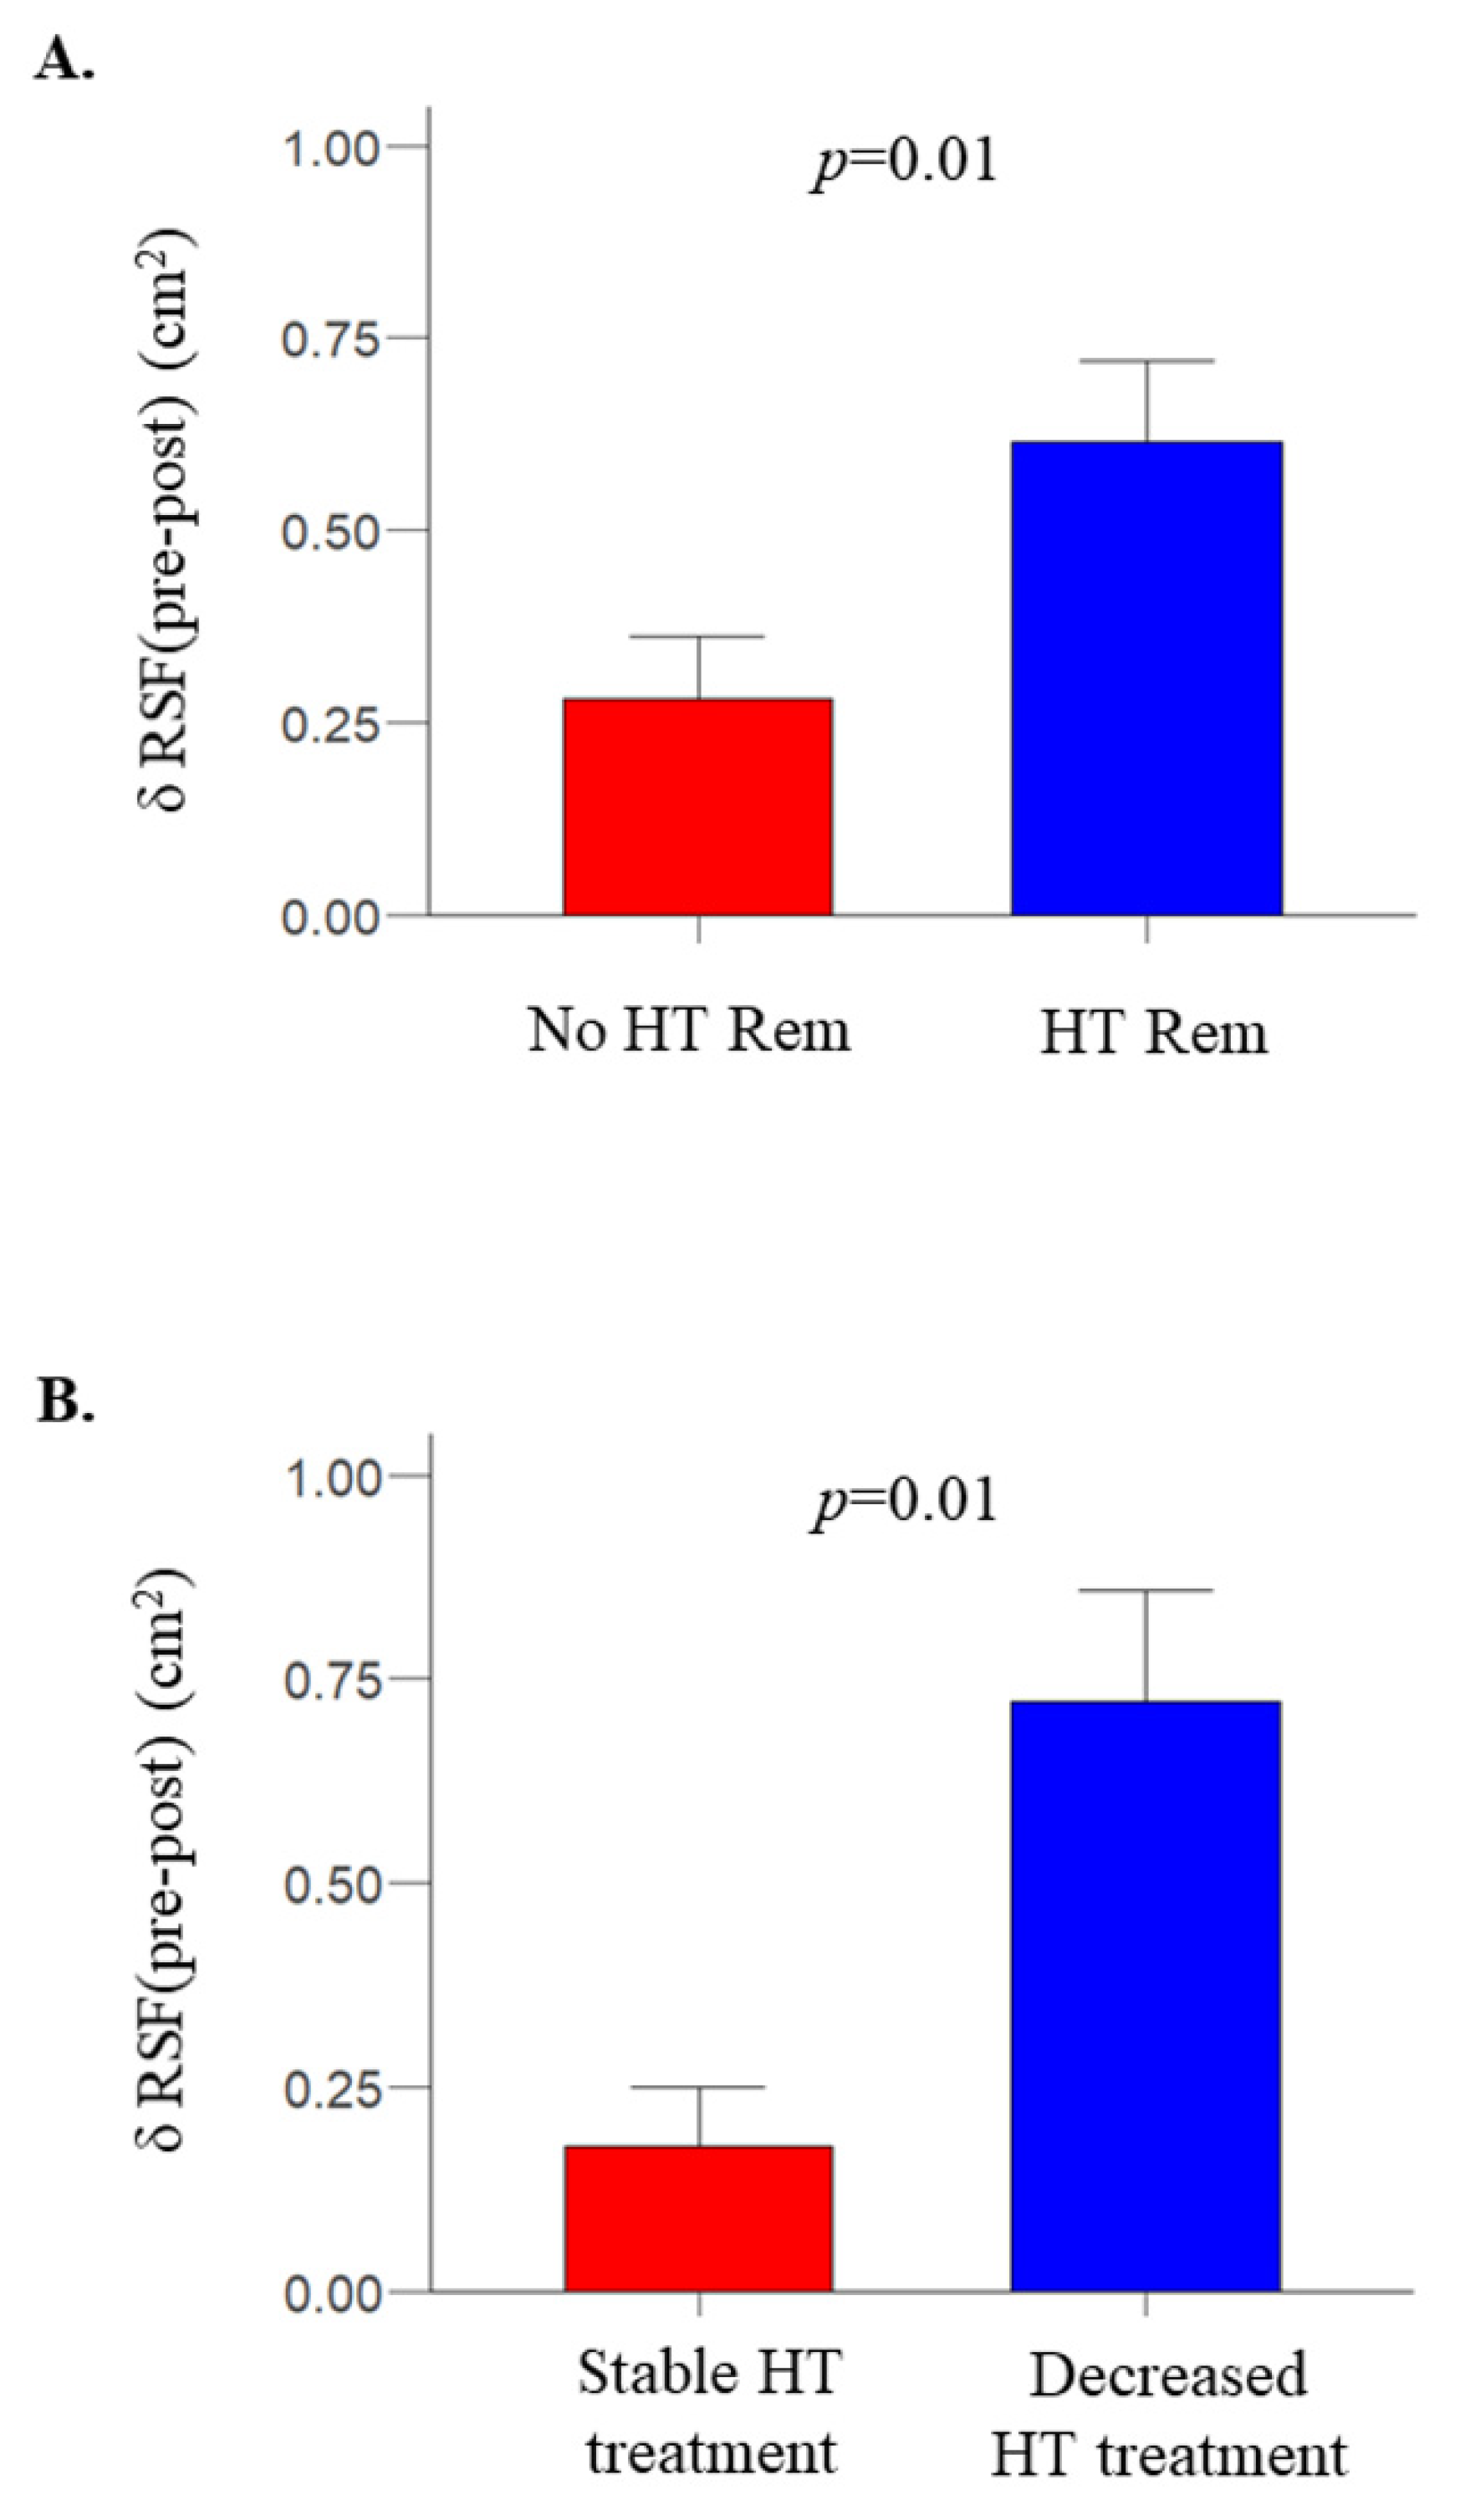
2.2. After Bariatric Surgery
3. Materials and Methods
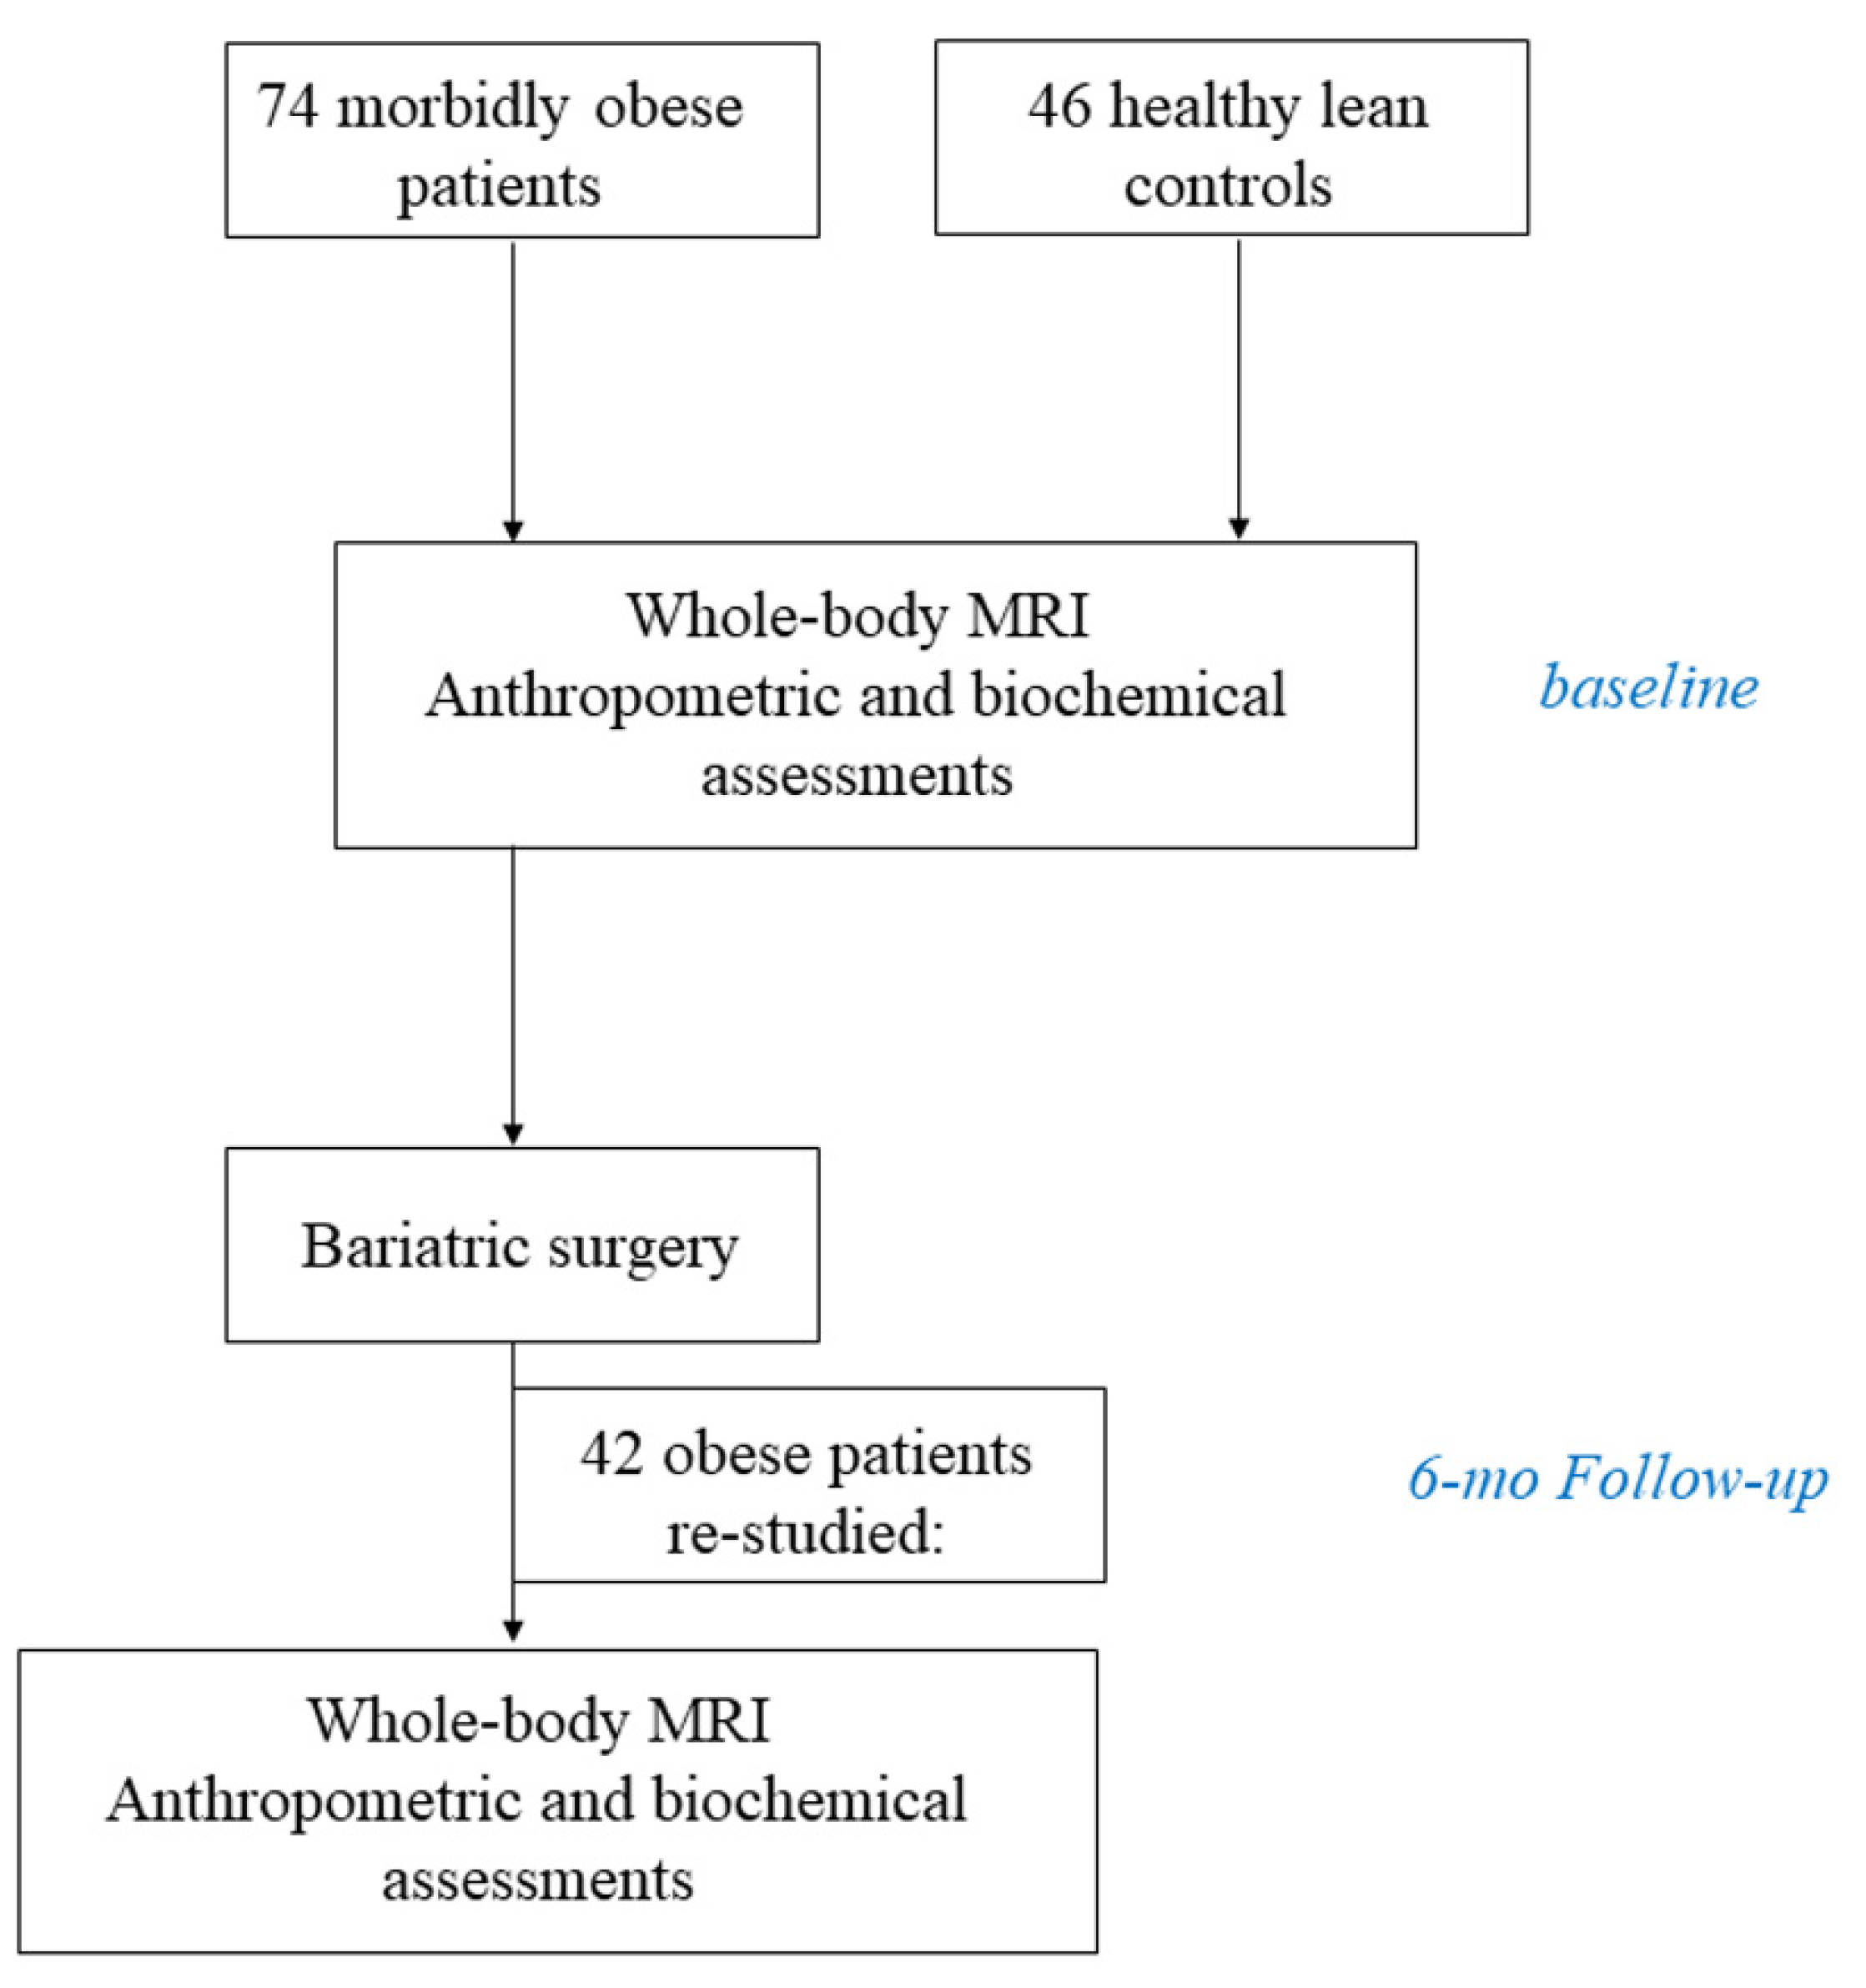
3.1. Participants and Study Design
3.2. Study Protocol
3.3. Distribution of Body Fat
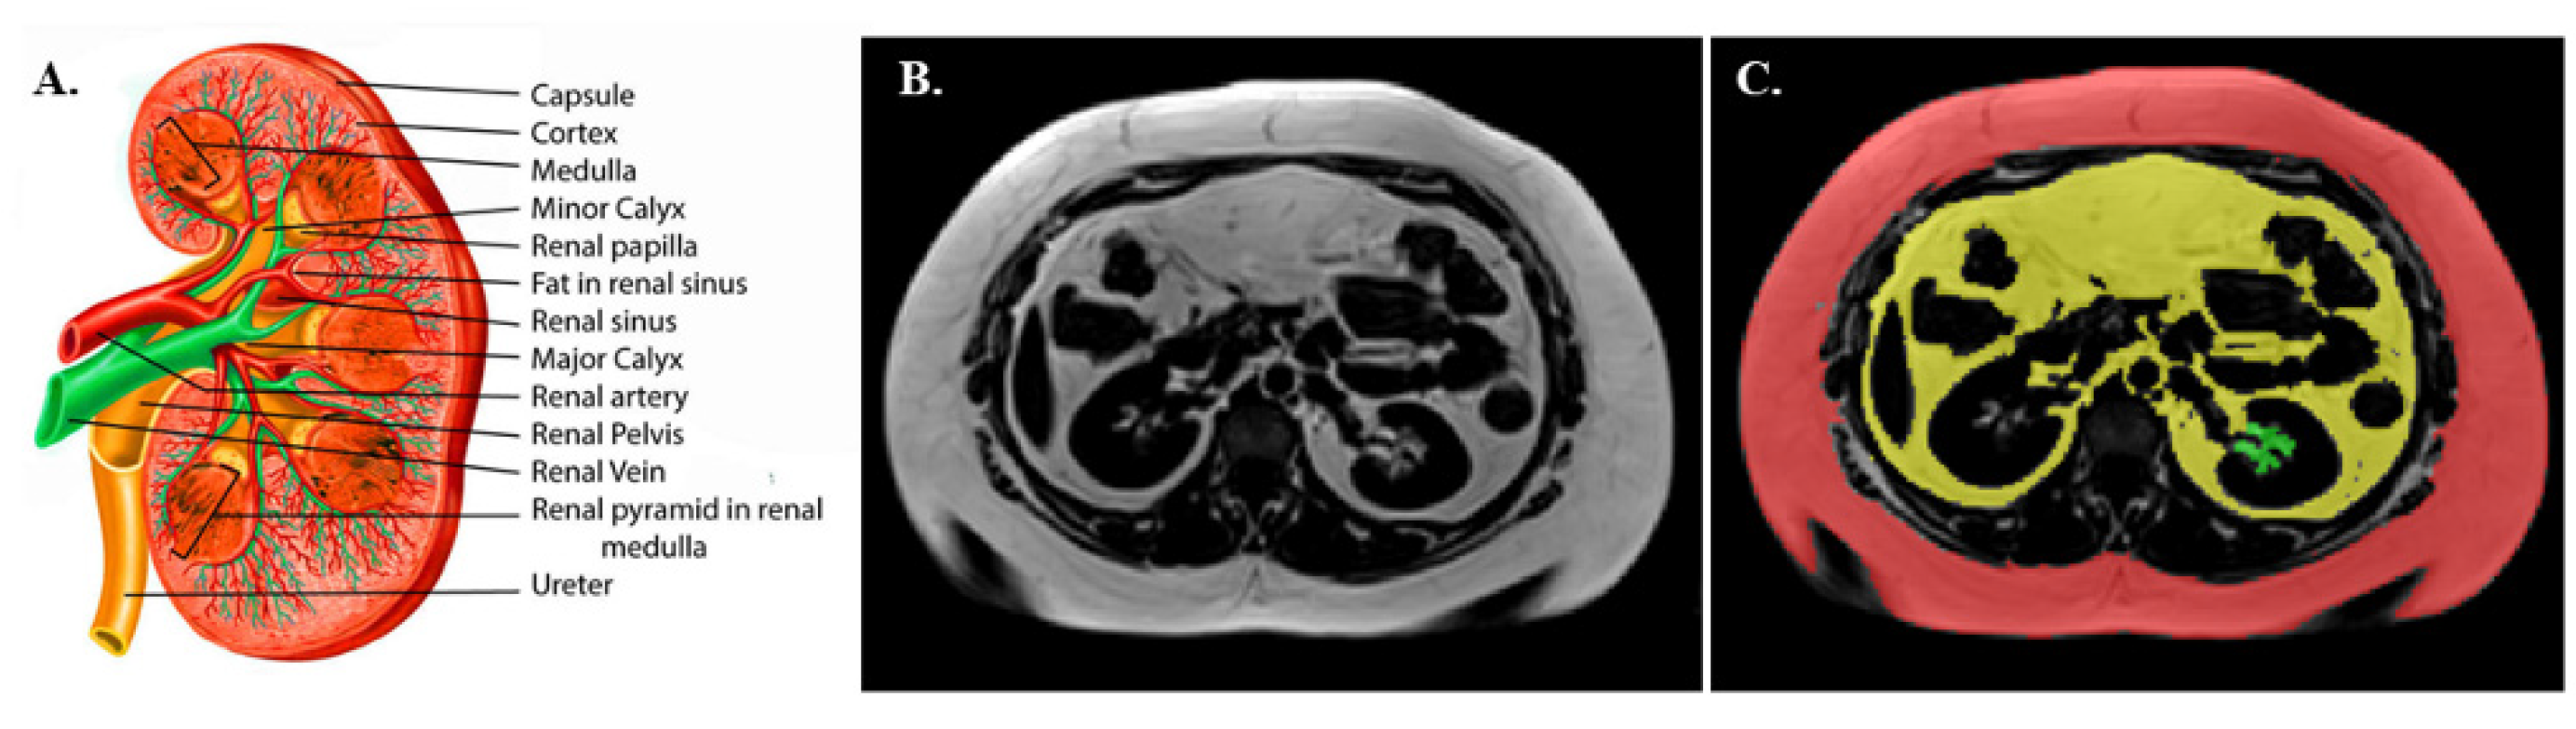
3.4. Renal Sinus Fat Area (RSF) Determination
3.5. Estimated Glomerular Filtration Rate (eGFR)
3.6. Body Surface Area (BSA)
3.7. Oral Glucose Insulin Sensitivity (OGIS)
3.8. Analytical Methods
3.9. Statistical Analysis
4. Discussion
Author Contributions
Funding
Institutional Review Board Statement
Informed Consent Statement
Data Availability Statement
Conflicts of Interest
References
- Obesity, W.O.P. Available online: https://www.worldobesity.org/about/about-Obesity/Prevalence-of-Obesity (accessed on 20 June 2022).
- Mokdad, A.H.; Ford, E.S.; Bowman, B.A.; Dietz, W.H.; Vinicor, F.; Bales, V.S.; Marks, J.S. Prevalence of Obesity, Diabetes, and Obesity-Related Health Risk Factors, 2001. JAMA 2003, 289, 76–79. [Google Scholar] [CrossRef] [PubMed]
- Rebelos, E.; Rinne, J.O.; Nuutila, P.; Ekblad, L.L. Brain Glucose Metabolism in Health, Obesity, and Cognitive Decline-Does Insulin Have Anything to Do with It? A Narrative Review. J. Clin. Med. 2021, 10, 1532. [Google Scholar] [CrossRef] [PubMed]
- Moriconi, D.; Masi, S.; Rebelos, E.; Virdis, A.; Manca, M.L.; De Marco, S.; Taddei, S.; Nannipieri, M. Obesity Prolongs the Hospital Stay in Patients Affected by COVID-19, and May Impact on SARS-CoV-2 Shedding. Obes. Res. Clin. Pract. 2020, 14, 205–209. [Google Scholar] [CrossRef]
- Rebelos, E.; Moriconi, D.; Virdis, A.; Taddei, S.; Foschi, D.; Nannipieri, M. Letter to the Editor: Importance of Metabolic Health in the Era of COVID-19. Metabolism 2020, 108, 154247. [Google Scholar] [CrossRef]
- Lavie, C.J.; Milani, R.V.; Ventura, H.O. Obesity and Cardiovascular Disease: Risk Factor, Paradox, and Impact of Weight Loss. J. Am. Coll. Cardiol. 2009, 53, 1925–1932. [Google Scholar] [CrossRef] [PubMed] [Green Version]
- Foster, M.C.; Hwang, S.-J.; Larson, M.G.; Lichtman, J.H.; Parikh, N.I.; Vasan, R.S.; Levy, D.; Fox, C.S. Overweight, Obesity, and the Development of Stage 3 CKD: The Framingham Heart Study. Am. J. Kidney Dis. Off. J. Natl. Kidney Found. 2008, 52, 39–48. [Google Scholar] [CrossRef] [PubMed] [Green Version]
- Rebelos, E.; Dadson, P.; Oikonen, V.; Iida, H.; Hannukainen, J.C.; Iozzo, P.; Ferrannini, E.; Nuutila, P. Renal Hemodynamics and Fatty Acid Uptake: Effects of Obesity and Weight Loss. Am. J. Physiol. Endocrinol. Metab. 2019, 317, E871–E878. [Google Scholar] [CrossRef]
- Whelton, P.K.; Klag, M.J. Hypertension as a Risk Factor for Renal Disease. Review of Clinical and Epidemiological Evidence. Hypertens 1989, 13, I19–I27. [Google Scholar] [CrossRef] [Green Version]
- Foster, M.C.; Hwang, S.-J.; Porter, S.A.; Massaro, J.M.; Hoffmann, U.; Fox, C.S. Fatty Kidney, Hypertension, and Chronic Kidney Disease: The Framingham Heart Study. Hypertens 2011, 58, 784–790. [Google Scholar] [CrossRef] [Green Version]
- Chughtai, H.L.; Morgan, T.M.; Rocco, M.; Stacey, B.; Brinkley, T.E.; Ding, J.; Nicklas, B.; Hamilton, C.; Hundley, W.G. Renal Sinus Fat and Poor Blood Pressure Control in Middle-Aged and Elderly Individuals at Risk for Cardiovascular Events. Hypertens 2010, 56, 901–906. [Google Scholar] [CrossRef] [Green Version]
- Spit, K.A.; Muskiet, M.H.A.; Tonneijck, L.; Smits, M.M.; Kramer, M.H.H.; Joles, J.A.; de Boer, A.; van Raalte, D.H. Renal Sinus Fat and Renal Hemodynamics: A Cross-Sectional Analysis. MAGMA 2020, 33, 73–80. [Google Scholar] [CrossRef] [PubMed] [Green Version]
- Wagner, R.; Machann, J.; Lehmann, R.; Rittig, K.; Schick, F.; Lenhart, J.; Artunc, F.; Linder, K.; Claussen, C.D.; Schleicher, E.; et al. Exercise-Induced Albuminuria Is Associated with Perivascular Renal Sinus Fat in Individuals at Increased Risk of Type 2 Diabetes. Diabetologia 2012, 55, 2054–2058. [Google Scholar] [CrossRef] [PubMed]
- Dwyer, T.M.; Mizelle, H.L.; Cockrell, K.; Buhner, P. Renal Sinus Lipomatosis and Body Composition in Hypertensive, Obese Rabbits. Int. J. Obes. Relat. Metab. Disord. J. Int. Assoc. Study Obes. 1995, 19, 869–874. [Google Scholar]
- Montani, J.-P.; Carroll, J.F.; Dwyer, T.M.; Antic, V.; Yang, Z.; Dulloo, A.G. Ectopic Fat Storage in Heart, Blood Vessels and Kidneys in the Pathogenesis of Cardiovascular Diseases. Int. J. Obes. Relat. Metab. Disord. J. Int. Assoc. Study Obes. 2004, 28 (Suppl. S4), S58–S65. [Google Scholar] [CrossRef] [PubMed] [Green Version]
- Maciejewski, M.L.; Arterburn, D.E.; Van Scoyoc, L.; Smith, V.A.; Yancy, W.S.J.; Weidenbacher, H.J.; Livingston, E.H.; Olsen, M.K. Bariatric Surgery and Long-Term Durability of Weight Loss. JAMA Surg. 2016, 151, 1046–1055. [Google Scholar] [CrossRef] [PubMed]
- Moriconi, D.; Manca, M.L.; Anselmino, M.; Rebelos, E.; Bellini, R.; Taddei, S.; Ferrannini, E.; Nannipieri, M. Predictors of Type 2 Diabetes Relapse after Roux-En-Y Gastric Bypass: A Ten-Year Follow-up Study. Diabetes Metab. 2021, 48, 101282. [Google Scholar] [CrossRef]
- Guarino, D.; Moriconi, D.; Mari, A.; Rebelos, E.; Colligiani, D.; Baldi, S.; Anselmino, M.; Ferrannini, E.; Nannipieri, M. Postprandial Hypoglycaemia after Roux-En-Y Gastric Bypass in Individuals with Type 2 Diabetes. Diabetologia 2019, 62, 178–186. [Google Scholar] [CrossRef] [Green Version]
- Rebelos, E.; Moriconi, D.; Scalese, M.; Denoth, F.; Molinaro, S.; Siciliano, V.; Anselmino, M.; Taddei, S.; Ferrannini, E.; Nannipieri, M. Impact of Postprandial Hypoglycemia on Weight Loss After Bariatric Surgery. Obes. Surg. 2020, 30, 2266–2273. [Google Scholar] [CrossRef]
- Bal, B.S.; Finelli, F.C.; Shope, T.R.; Koch, T.R. Nutritional Deficiencies after Bariatric Surgery. Nat. Rev. Endocrinol. 2012, 8, 544–556. [Google Scholar] [CrossRef]
- Davies, D.J.; Baxter, J.M.; Baxter, J.N. Nutritional Deficiencies after Bariatric Surgery. Obes. Surg. 2007, 17, 1150–1158. [Google Scholar] [CrossRef]
- Fenske, W.K.; Dubb, S.; Bueter, M.; Seyfried, F.; Patel, K.; Tam, F.W.K.; Frankel, A.H.; le Roux, C.W. Effect of Bariatric Surgery-Induced Weight Loss on Renal and Systemic Inflammation and Blood Pressure: A 12-Month Prospective Study. Surg. Obes. Relat. Dis. Off. J. Am. Soc. Bariatr. Surg. 2013, 9, 559–568. [Google Scholar] [CrossRef] [PubMed]
- Dadson, P.; Landini, L.; Helmiö, M.; Hannukainen, J.C.; Immonen, H.; Honka, M.J.; Bucci, M.; Savisto, N.; Soinio, M.; Salminen, P.; et al. Effect of Bariatric Surgery on Adipose Tissue Glucose Metabolism in Different Depots in Patients with or without Type 2 Diabetes. Diabetes Care 2016, 39, 292–299. [Google Scholar] [CrossRef] [PubMed] [Green Version]
- Rebelos, E.; Immonen, H.; Bucci, M.; Hannukainen, J.C.; Nummenmaa, L.; Honka, M.-J.; Soinio, M.; Salminen, P.; Ferrannini, E.; Iozzo, P.; et al. Brain Glucose Uptake Is Associated with Endogenous Glucose Production in Obese Patients before and after Bariatric Surgery and Predicts Metabolic Outcome at Follow-Up. Diabetes Obes. Metab. 2019, 21, 218–226. [Google Scholar] [CrossRef] [PubMed]
- Rebelos, E.; Hirvonen, J.; Bucci, M.; Pekkarinen, L.; Nyman, M.; Hannukainen, J.C.; Iozzo, P.; Salminen, P.; Nummenmaa, L.; Ferrannini, E.; et al. Brain Free Fatty Acid Uptake Is Elevated in Morbid Obesity, and Is Irreversible 6 Months after Bariatric Surgery: A Positron Emission Tomography Study. Diabetes Obes. Metab. 2020, 22, 1074–1082. [Google Scholar] [CrossRef]
- Mäkinen, J.; Hannukainen, J.C.; Karmi, A.; Immonen, H.M.; Soinio, M.; Nelimarkka, L.; Savisto, N.; Helmiö, M.; Ovaska, J.; Salminen, P.; et al. Obesity-Associated Intestinal Insulin Resistance Is Ameliorated after Bariatric Surgery. Diabetologia 2015, 58, 1055–1062. [Google Scholar] [CrossRef] [Green Version]
- Denic, A.; Mathew, J.; Lerman, L.O.; Lieske, J.C.; Larson, J.J.; Alexander, M.P.; Poggio, E.; Glassock, R.J.; Rule, A.D. Single-Nephron Glomerular Filtration Rate in Healthy Adults. N. Engl. J. Med. 2017, 376, 2349–2357. [Google Scholar] [CrossRef]
- Brethauer, S.A.; Kim, J.; el Chaar, M.; Papasavas, P.; Eisenberg, D.; Rogers, A.; Ballem, N.; Kligman, M.; Kothari, S. Standardized Outcomes Reporting in Metabolic and Bariatric Surgery. Surg. Obes. Relat. Dis. Off. J. Am. Soc. Bariatr. Surg. 2015, 11, 489–506. [Google Scholar] [CrossRef]
- McMahon, R.S.; Penfold, D.; Bashir, K. Anatomy, Abdomen and Pelvis, Kidney Collecting Ducts; StatPearls Publishing: Treasure Island, FL, USA, 2021. [Google Scholar]
- Levey, A.S.; Stevens, L.A.; Schmid, C.H.; Zhang, Y.L.; Castro, A.F., 3rd; Feldman, H.I.; Kusek, J.W.; Eggers, P.; Van Lente, F.; Greene, T.; et al. A New Equation to Estimate Glomerular Filtration Rate. Ann. Intern. Med. 2009, 150, 604–612. [Google Scholar] [CrossRef]
- Du Bois, D.; Du Bois, E.F. A Formula to Estimate the Approximate Surface Area If Height and Weight Be Known. 1916. Nutrition 1989, 5, 303. [Google Scholar]
- Mari, A.; Pacini, G.; Murphy, E.; Ludvik, B.; Nolan, J.J. A Model-Based Method for Assessing Insulin Sensitivity from the Oral Glucose Tolerance Test. Diabetes Care 2001, 24, 539–548. [Google Scholar] [CrossRef] [Green Version]
- Rebelos, E.; Mari, A.; Bucci, M.; Honka, M.-J.; Hannukainen, J.C.; Virtanen, K.A.; Hirvonen, J.; Nummenmaa, L.; Heni, M.; Iozzo, P.; et al. Brain Substrate Metabolism and SS-Cell Function in Humans: A Positron Emission Tomography Study. Endocrinol. Diabetes Metab. 2020, 3, e00136. [Google Scholar] [CrossRef] [PubMed]
- Friedewald, W.T.; Levy, R.I.; Fredrickson, D.S. Estimation of the Concentration of Low-Density Lipoprotein Cholesterol in Plasma, without Use of the Preparative Ultracentrifuge. Clin. Chem. 1972, 18, 499–502. [Google Scholar] [CrossRef] [PubMed]
- Wickham, H. Elegant Graphics for Data Analysis; Springer: Berlin/Heidelberg, Germany, 2016. [Google Scholar]
- Revelle, W. psych: Procedures for Psychological, Psychometric, and Personality Research; R Package Version 2.2.5; Northwestern University: Evanston, IL, USA, 2022. [Google Scholar]
- Portney, L.G.; Watkins, M.P. Foundations of Clinical Research Applications to Practice, 3rd ed.; Pearson Education Limited: London, UK, 2014. [Google Scholar]
- Le Jemtel, T.H.; Samson, R.; Milligan, G.; Jaiswal, A.; Oparil, S. Visceral Adipose Tissue Accumulation and Residual Cardiovascular Risk. Curr. Hypertens. Rep. 2018, 20, 77. [Google Scholar] [CrossRef] [PubMed]
- Ciardullo, S.; Grassi, G.; Mancia, G.; Perseghin, G. Nonalcoholic Fatty Liver Disease and Risk of Incident Hypertension: A Systematic Review and Meta-Analysis. Eur. J. Gastroenterol. Hepatol. 2022, 34, 365–371. [Google Scholar] [CrossRef] [PubMed]
- Krievina, G.; Tretjakovs, P.; Skuja, I.; Silina, V.; Keisa, L.; Krievina, D.; Bahs, G. Ectopic Adipose Tissue Storage in the Left and the Right Renal Sinus is Asymmetric and Associated With Serum Kidney Injury Molecule-1 and Fibroblast Growth Factor-21 Levels Increase. EBioMedicine 2016, 13, 274–283. [Google Scholar] [CrossRef] [Green Version]
- Ricci, M.A.; Scavizzi, M.; Ministrini, S.; De Vuono, S.; Pucci, G.; Lupattelli, G. Morbid Obesity and Hypertension: The Role of Perirenal Fat. J. Clin. Hypertens. 2018, 20, 1430–1437. [Google Scholar] [CrossRef] [Green Version]
- Dustan, H.P. Obesity and Hypertension. Diabetes Care 1991, 14, 488–504. [Google Scholar] [CrossRef]
- Dorresteijn, J.A.N.; Visseren, F.L.J.; Spiering, W. Mechanisms Linking Obesity to Hypertension. Obes. Rev. Off. J. Int. Assoc. Study Obes. 2012, 13, 17–26. [Google Scholar] [CrossRef]
- Tuck, M.L.; Sowers, J.; Dornfeld, L.; Kledzik, G.; Maxwell, M. The Effect of Weight Reduction on Blood Pressure, Plasma Renin Activity, and Plasma Aldosterone Levels in Obese Patients. N. Engl. J. Med. 1981, 304, 930–933. [Google Scholar] [CrossRef]
- Nauli, A.M.; Matin, S. Why Do Men Accumulate Abdominal Visceral Fat? Front. Physiol. 2019, 10, 1486. [Google Scholar] [CrossRef] [Green Version]


| Lean | Obese | p Value | ||
|---|---|---|---|---|
| Pre | Post | |||
| N | 46 | 74 | 42 | - |
| M/W | 10/36 | 6/68 | 3/39 | 0.03 |
| Hypertension (N, %) | 0, 0 | 36, 49 | 18, 43 *# | <0.0001 |
| NGT/IFG&IGT/T2D | 37/9/0 | 20/30/24 | 23/9/10 *# | <0.0001 |
| Age (years) | 46 ± 9 | 45 ± 10 | 45 ± 9 | 0.8 |
| BMI (kg·m−2) | 23.4 [21.6–24.8] | 41.5 [39.1–43.9] | 32.2 [29.78–34.1] *# | <0.0001 |
| Systolic BP (mmHg) | 123 ± 13 | 134 ± 17 | 125 ± 13 * | 0.002 |
| Diastolic BP (mmHg) | 79 ± 8 | 86 ± 10 | 80 ± 9 * | <0.0001 |
| HbA1c (%) | 5.5 [5.3–5.6] | 5.7 [5.4–6.1] | 5.6 [5.3–5.8] * | 0.001 |
| HbA1c (mmol/mol) | 37 [34–38] | 39 [36–43] | 38 [34–40] * | 0.001 |
| Plasma glucose (mmol/L) | 5.4 [5.0–5.6] | 5.8 [5.3–6.5] | 5.3 [4.9–5.8] * | <0.0001 |
| Plasma insulin (pmol/L) | 30 [24–48] | 84 [50–131] | 42 [24–51] *# | <0.0001 |
| Plasma C-peptide (nmol/l) | 0.53 [0.42–0.68] | 1.10 [0.87–1.40] | 0.70 [0.59–0.85] *# | <0.0001 |
| OGIS (ml·min−1m−2) | 424 [387–443] | 330 [278–368] | 424 [369–465] | <0.0001 |
| Total cholesterol (mmol/L) | 4.5 [4.1–5.0] | 4.1 [3.7–4.8] | 4.1 [3.6–4.8] | 0.06 |
| LDL cholesterol (mmol/L) | 2.6 [2.1–3.0] | 2.6 [2.0–2.9] | 2.3 [1.8–3.0] | 0.8 |
| HDL cholesterol (mmol/L) | 1.6 [1.4–2.1] | 1.3 [1.1–1.4] | 1.4 [1.2–1.7] | <0.0001 |
| Triglycerides (mmol/L) | 0.86 ± 0.4 | 1.29 ± 0.47 | 1.0 ± 0.42 * | <0.0001 |
| C-reactive protein (mg/L) | 0.6 [0.2–1.0] | 3.2 [1.8–5.3] | 1.0 [0.5–2.0] * | <0.0001 |
| Creatinine (μmol/L) | 68 [60–76] | 65 [58–71] | 60 [52–65] | 0.1 |
| eGFR (ml/1.73 m2/min) | 98 [93–107] | 100 [87–112] | 110 [91–115] * | 0.5 |
| Total eGFR (ml/min) | 99 [93–108] | 129 [111–140] | 120 [104–129] # | <0.0001 |
| Left RSF (cm2) | 1.8 [1.3–2.5] | 2.2 [1.6–2.9] | 1.5 [1.2–2.1] * | 0.0995 |
| Right RSF (cm2) | 1.7 [1.3–2.4] | 2.5 [1.7–3.3] | 1.9 [1.4–2.3] * | 0.004 |
| Average RSF (cm2) | 1.8 [1.4–2.5] | 2.3 [1.7–3.1] | 1.6 [1.3–2.3] * | 0.003 |
| Total SAT (Kg) | 3.9 [2.6–5.1] | 17.2 [15.1–22.0] | 11.0 [8.4–13.1] *# | <0.0001 |
| Total VAT (Kg) | 1.1 [0.7–1.7] | 4.5 [3.1–5.8] | 2.4 [1.4–3.4] *# | <0.0001 |
Publisher’s Note: MDPI stays neutral with regard to jurisdictional claims in published maps and institutional affiliations. |
© 2022 by the authors. Licensee MDPI, Basel, Switzerland. This article is an open access article distributed under the terms and conditions of the Creative Commons Attribution (CC BY) license (https://creativecommons.org/licenses/by/4.0/).
Share and Cite
Moritz, E.; Dadson, P.; Saukko, E.; Honka, M.-J.; Koskensalo, K.; Seppälä, K.; Pekkarinen, L.; Moriconi, D.; Helmiö, M.; Salminen, P.; et al. Renal Sinus Fat Is Expanded in Patients with Obesity and/or Hypertension and Reduced by Bariatric Surgery Associated with Hypertension Remission. Metabolites 2022, 12, 617. https://doi.org/10.3390/metabo12070617
Moritz E, Dadson P, Saukko E, Honka M-J, Koskensalo K, Seppälä K, Pekkarinen L, Moriconi D, Helmiö M, Salminen P, et al. Renal Sinus Fat Is Expanded in Patients with Obesity and/or Hypertension and Reduced by Bariatric Surgery Associated with Hypertension Remission. Metabolites. 2022; 12(7):617. https://doi.org/10.3390/metabo12070617
Chicago/Turabian StyleMoritz, Emilia, Prince Dadson, Ekaterina Saukko, Miikka-Juhani Honka, Kalle Koskensalo, Kerttu Seppälä, Laura Pekkarinen, Diego Moriconi, Mika Helmiö, Paulina Salminen, and et al. 2022. "Renal Sinus Fat Is Expanded in Patients with Obesity and/or Hypertension and Reduced by Bariatric Surgery Associated with Hypertension Remission" Metabolites 12, no. 7: 617. https://doi.org/10.3390/metabo12070617