Article

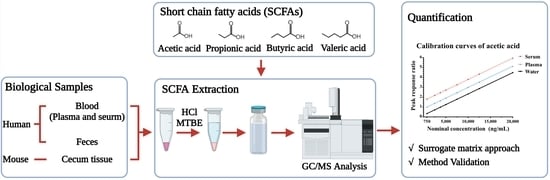
An Improved Method to Quantify Short-Chain Fatty Acids in Biological Samples Using Gas Chromatography–Mass Spectrometry

1
Department of Clinical Pharmacology and Therapeutics, Seoul National University College of Medicine and Hospital, Seoul 03080, Korea
2
Department of Biomedical Sciences, Seoul National University College of Medicine, Seoul 03080, Korea
*
Author to whom correspondence should be addressed.
Metabolites 2022, 12(6), 525; https://doi.org/10.3390/metabo12060525
Submission received: 13 February 2022 / Revised: 27 May 2022 / Accepted: 1 June 2022 / Published: 7 June 2022
(This article belongs to the Special Issue Analysis and Metabolism of Bioactive Compounds)

Abstract

:
Gut microbial metabolites, short-chain fatty acids (SCFAs), are found at multiple locations in the host body and are identified as important metabolites in gut microbiome-associated diseases. Quantifying SCFAs in diverse biological samples is important to understand their roles in host health. This study developed an accurate SCFA quantification method by performing gas chromatography–mass spectrometry (GC/MS) in human plasma, serum, feces, and mouse cecum tissue. The samples were acidified with hydrochloric acid, and the SCFAs were extracted using methyl tert-butyl ether. In this method, distilled water was selected as a surrogate matrix for the quantification of SCFAs in target biological samples. The method was validated in terms of linearity, parallelism, precision, recovery, and matrix effect. The developed method was further applied in target biological samples. In conclusion, this optimized method can be used as a simultaneous SCFA quantification method in diverse biological samples.

Graphical Abstract

1. Introduction

Short-chain fatty acids (SCFAs) are fatty acids with fewer than six carbons [1]. The SCFAs are produced by the gut bacteria that metabolizes indigestible starch and dietary fiber, and those SCFAs are also found in the host body via transportation into portal circulation [2,3,4]. The SCFAs have been identified as important metabolites in gut microbiome-associated diseases, e.g., inflammatory bowel disease [5,6], obesity [7,8], hypertension [9], diabetes [10,11], rheumatoid arthritis [12], and multiple sclerosis [13]. Therefore, a sensitive and accurate quantification method for the SCFAs in diverse biological specimens is required to better understand the gut microbiome–host interaction.
Gas chromatography–mass spectrometry (GC/MS)-based analysis of SCFAs commonly requires precolumn derivatization [14,15,16,17]. However, many derivatization agents are moisture-sensitive; thus, an anhydrous environment is required to improve sensitivity [14]. Moreover, the derivatization process is time-consuming, and analysis may be deviated due to evaporation during the sample preparation. Direct aqueous injection of a biological sample is an alternative method to avoid derivatization of SCFAs [18,19], but the GC/MS system can be contaminated, due to the complex biological components. Therefore, an improved method that reduces the GC/MS contamination is required.
Background noise of SCFAs was reported by a few previous studies [14,15,20]. This background noise can be produced by organic solvents widely used for lipid extraction, such as ethyl acetate (EA) and methanol [21,22]. Thus, optimizing the organic solvent for extraction is important to accurately determine SCFAs. Furthermore, since the SCFAs are endogenous metabolites, a metabolite-free biological matrix is not accessible to prepare calibration standard samples. To address this limitation, surrogate matrices, such as an artificial matrix (e.g., bovine serum albumin in phosphate buffer saline) and a metabolite-depleted matrix (e.g., charcoal-stripped biological matrix), are widely used [23,24]. However, using a surrogate matrix can cause matrix-specific peak response alterations (matrix effect); therefore, the similar matrix effect and extraction recovery should be demonstrated in both the surrogate matrix and biological matrix, and a parallel relationship between the surrogate and biological matrix should also be confirmed [25,26]. This work aims to develop an accurate GC/MS quantification method using the surrogate matrix approach to measure the SCFAs in plasma, serum, feces, and cecum tissue. We optimized the liquid–liquid extraction (LLE) procedure to detect SCFAs without derivatization and reduce the GC/MS contamination. In this method, distilled water was selected as a surrogate matrix, and it showed similar extraction recovery with SCFAs in the target biological samples. The developed method was further validated in terms of linearity, parallelism, precision, recovery, and matrix effect. These results can be used as a customized protocol for the SCFA analysis in diverse types of biological samples.

2. Results and Discussion

2.1. Method Optimization

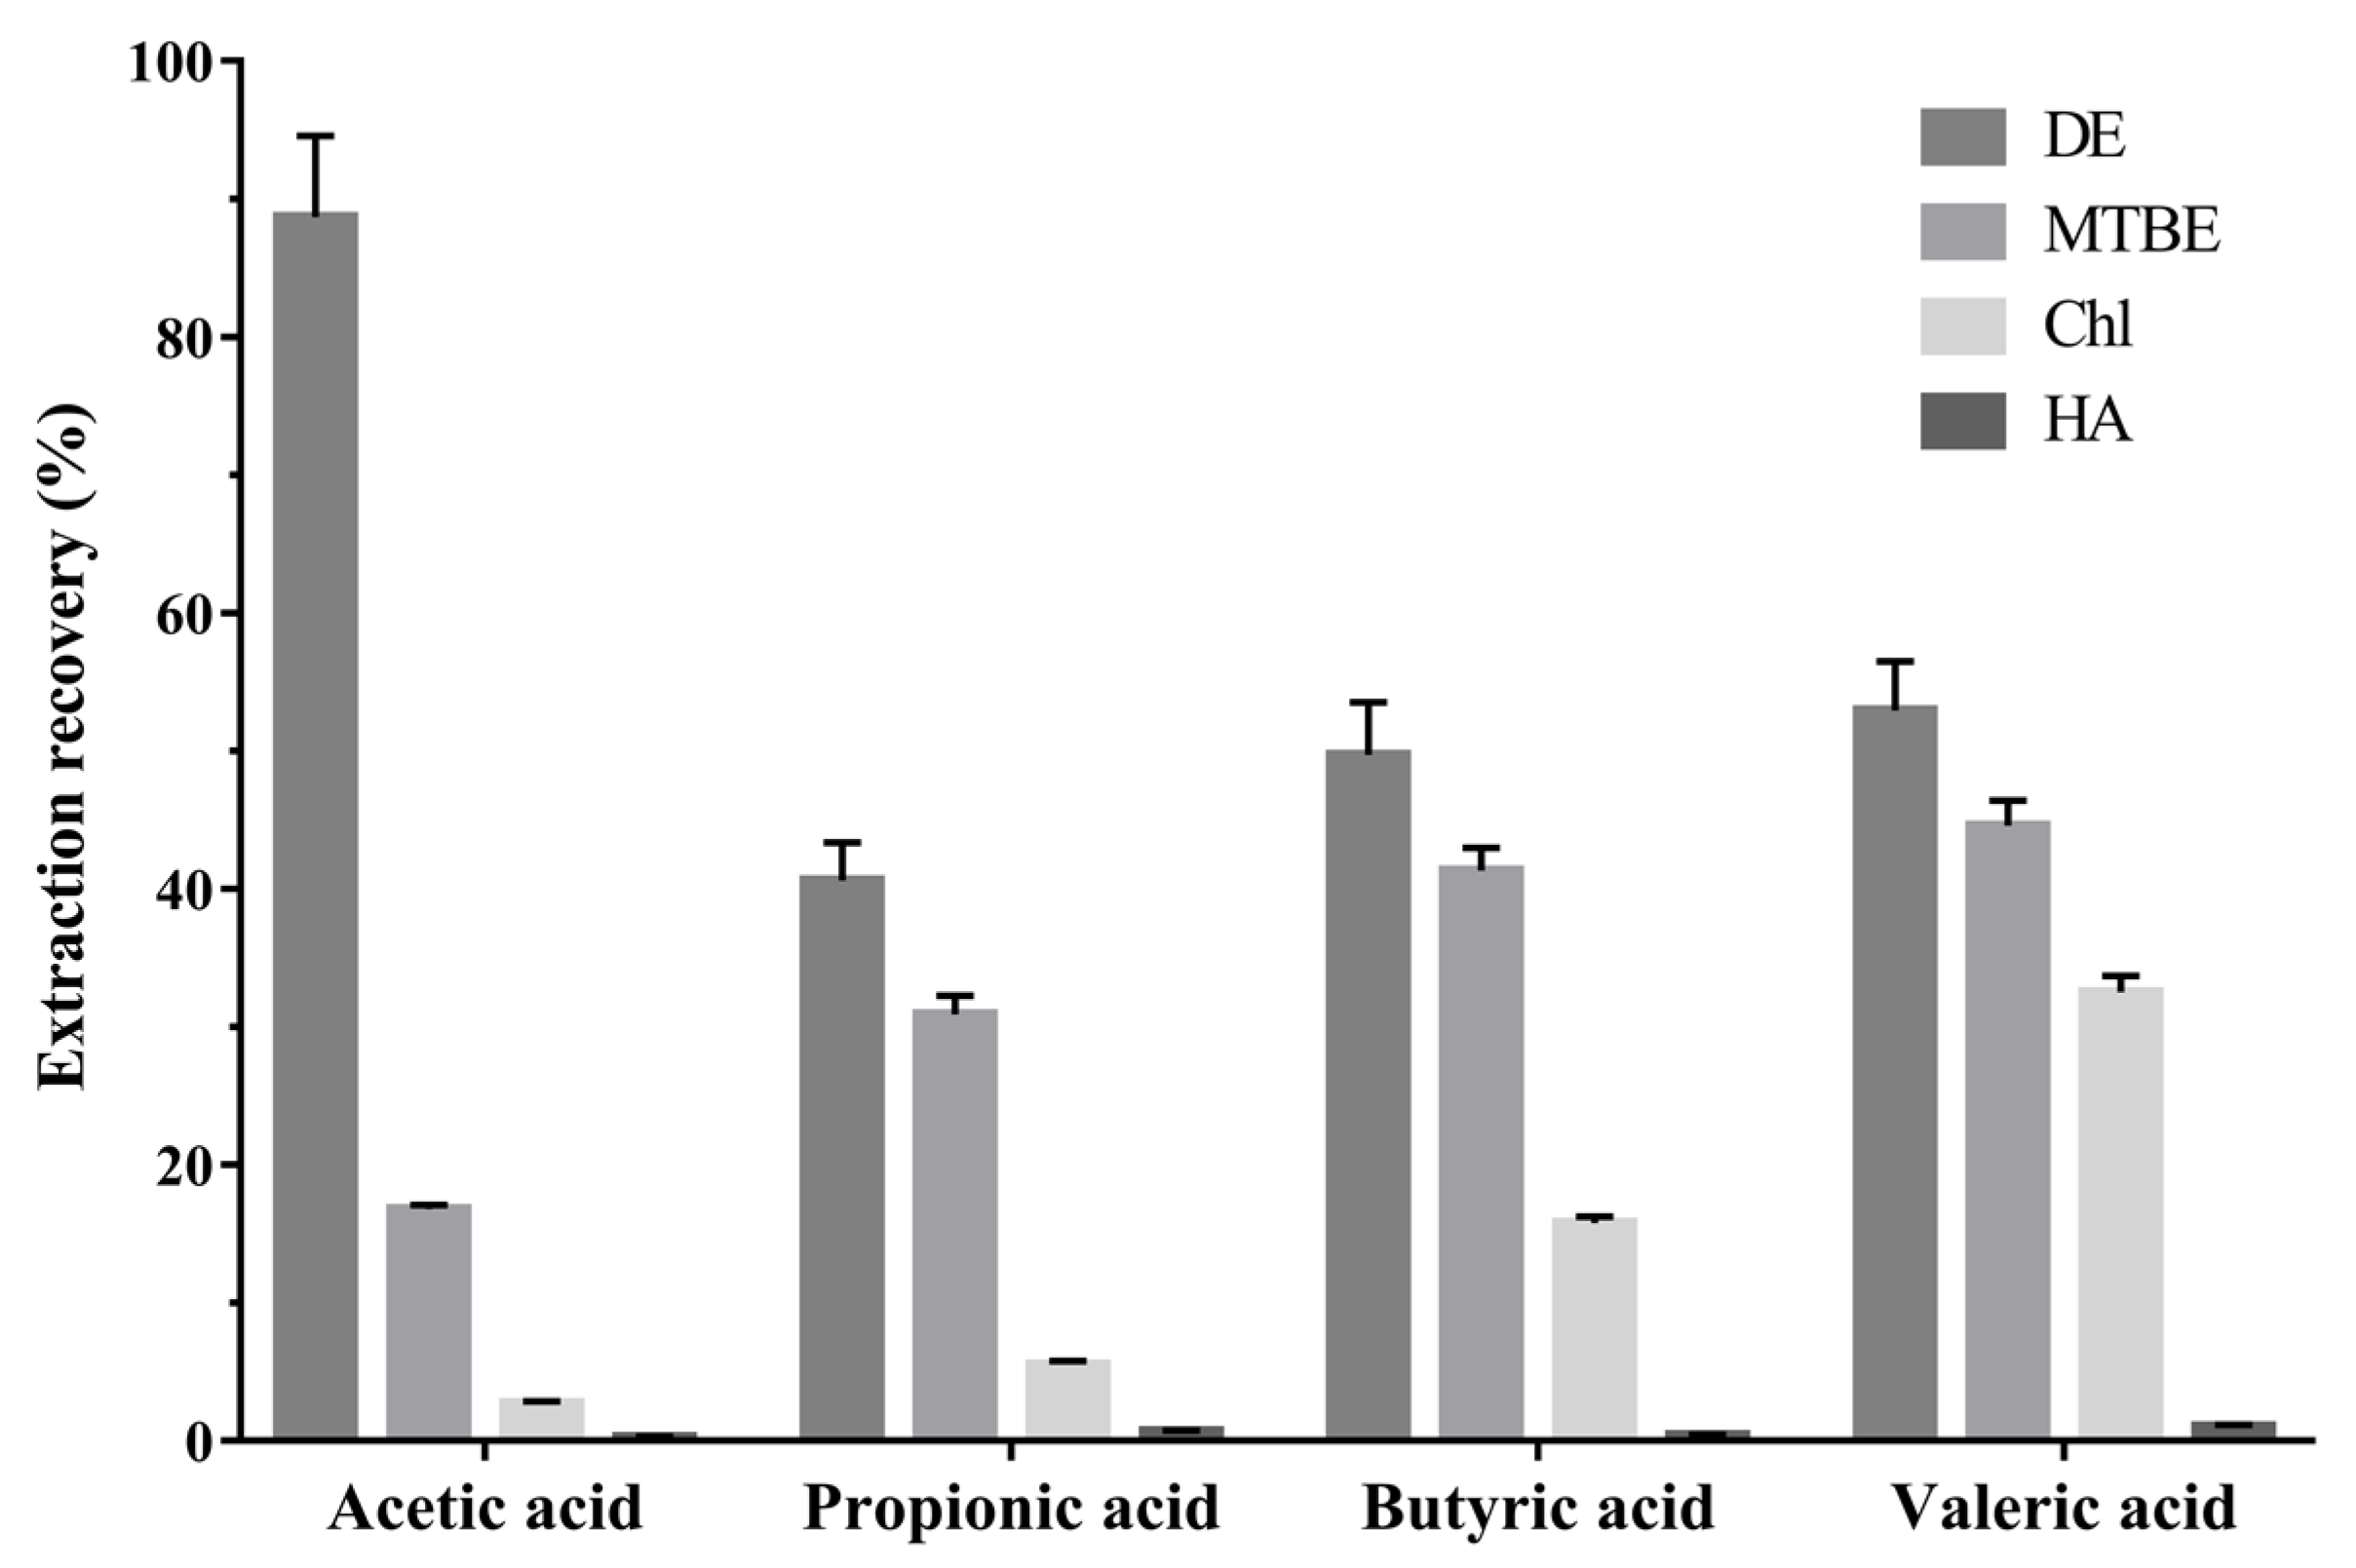
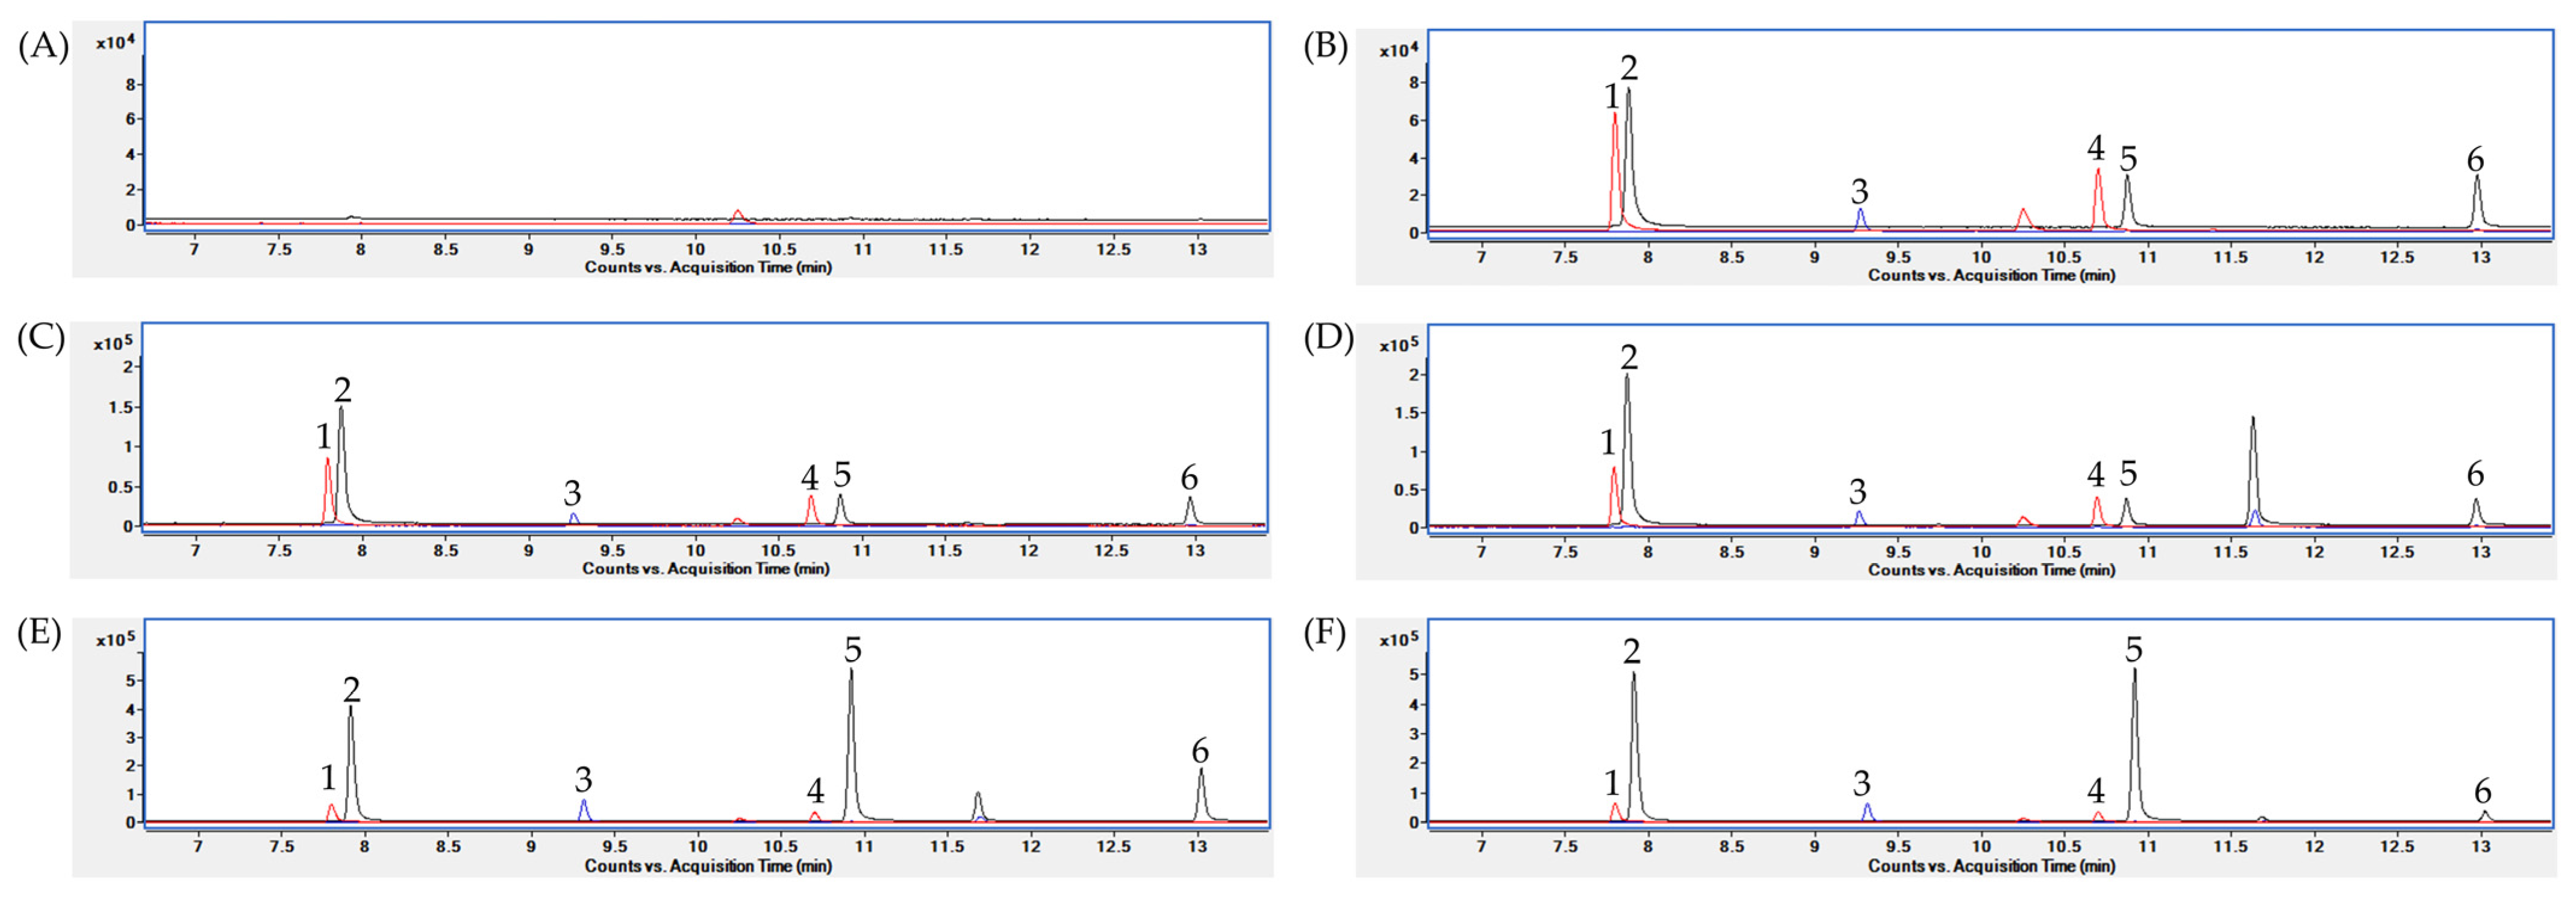
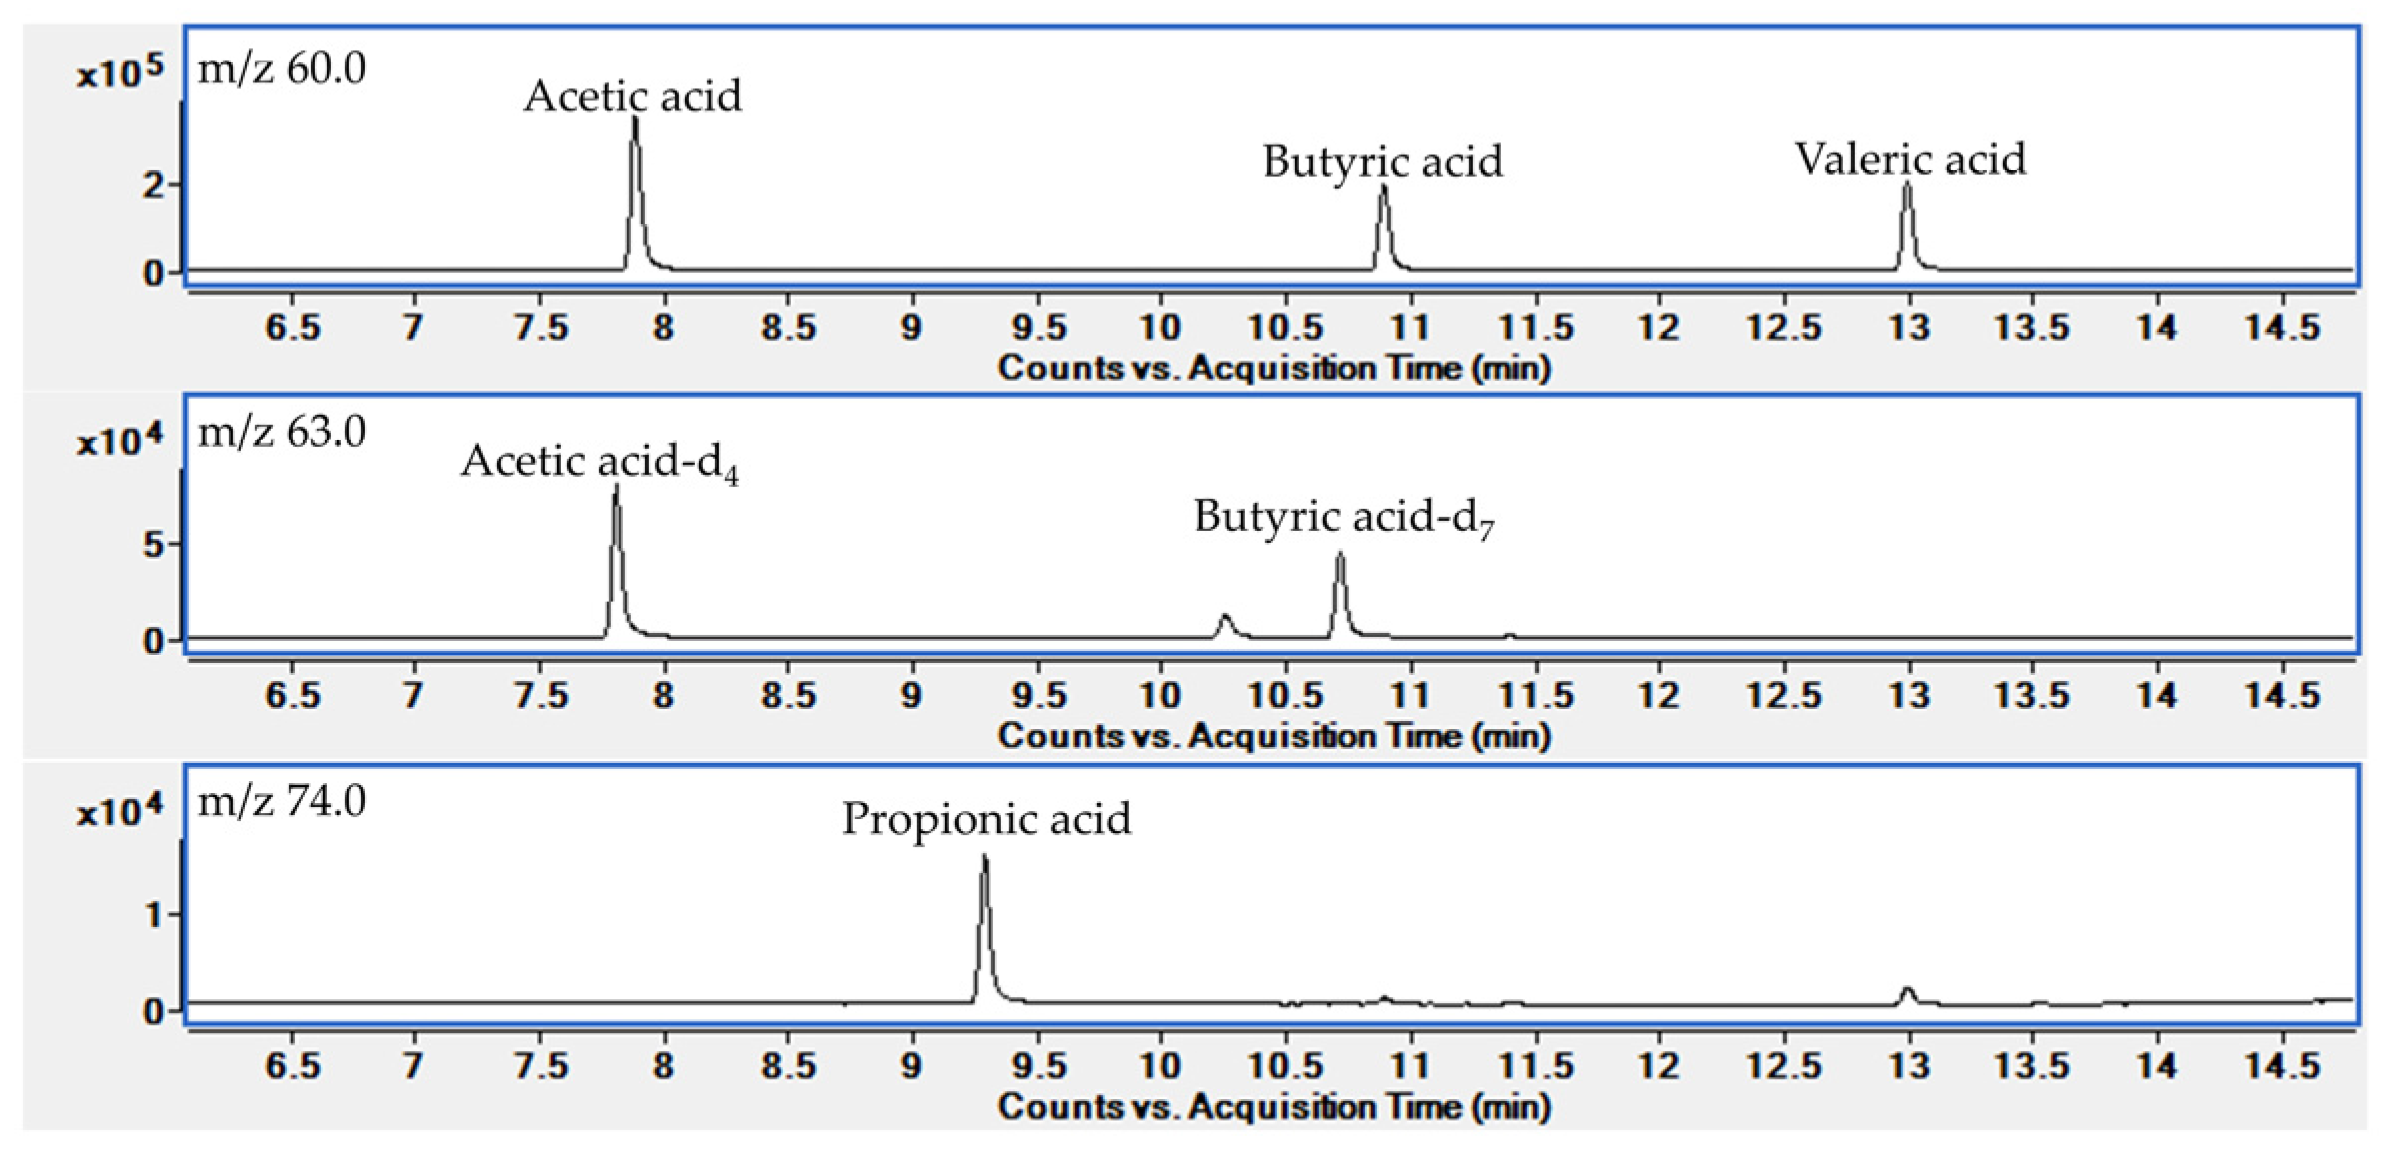
2.1.1. GC/MS Condition

In this study, we used a high-polarity polyethylene glycol (PEG) type column to detect SCFAs without derivatization. First, MS data were acquired by analyzing each analytical standard in full scan mode in an m/z range of 40–150. All the analytes were detected on the PEG type column and identified with a specific m/z ratio and retention time. Next, we developed a selected ion monitoring (SIM) mode for target analytes. In the SIM mode, the base peak in the EI mass spectra was selected as the target ion, and an analyte-specific m/z value was selected as a confirmative ion (Table 1). As shown in Figure A1, the target analytes were also successfully separated by retention time and m/z value.

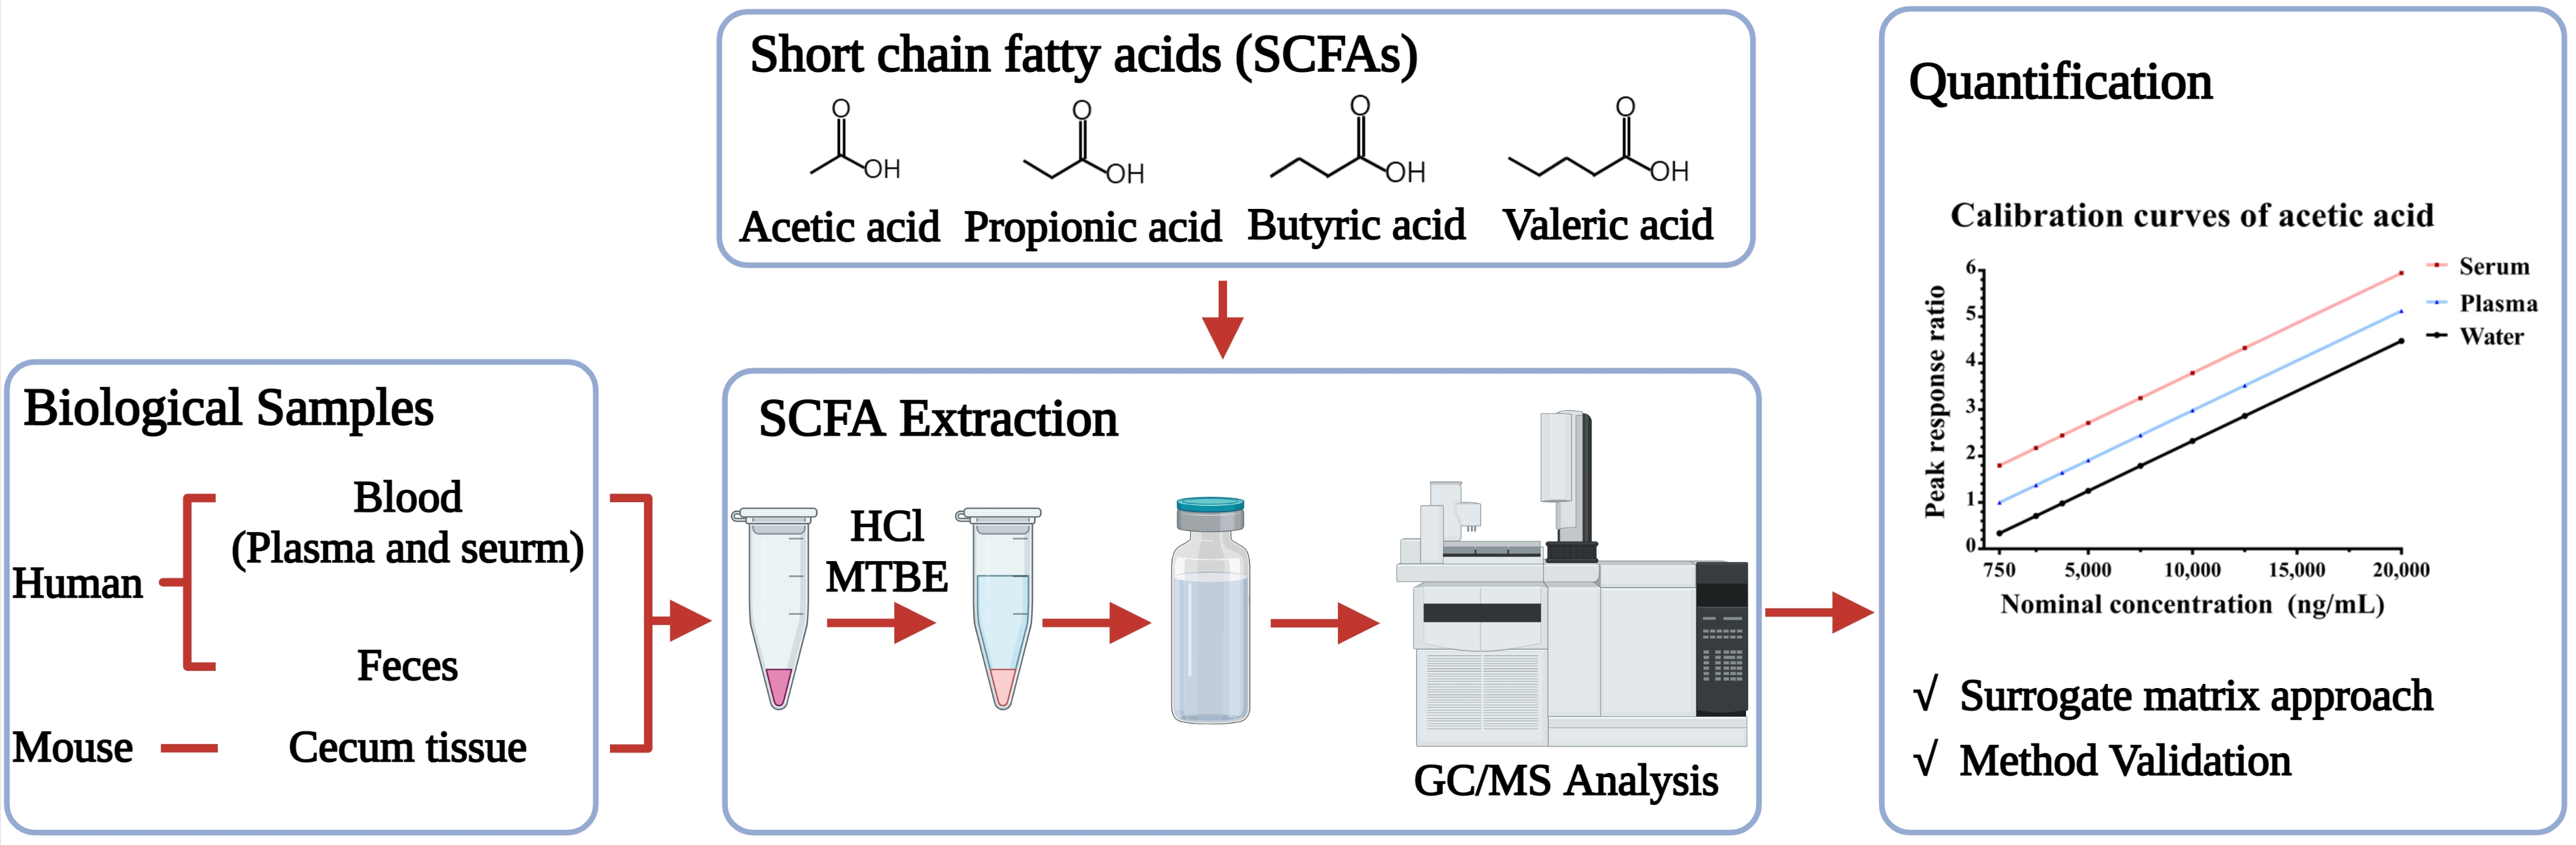
2.1.2. Extraction Condition Optimization

An analytical method for SCFAs, using a PEG column, by injecting the acidified water or acidified biological sample were published previously [18,19]. However, a PEG column can be contaminated by strong acids, and the aqueous conditions can contaminate the ion source. To avoid this direct injection of acidic samples, we performed liquid–liquid extraction (LLE). Since the SCFAs are weak acids, with pKa values from 4.75 to 4.80 [27], hydrochloric acid (HCl) was added to adjust the pH of the aqueous sample to 2–3 so that the SCFAs will be undissociated forms [28]. Then, we evaluated the extraction recovery of four organic solvents used for lipid extraction, methyl tert-butyl ether (MTBE), diethyl ether (DE), chloroform (Chl), and n-hexane (HA), from an SCFA working solution dissolved in acidified water (Figure 1). The DE was the most effective solvent for SCFA extraction. However, high background noise for acetic acid was found in a blank water sample extracted with DE (Figure A2). A further investigation suggested that acetic acid can be produced via DE oxidation [29]. Consequentially, we selected the MTBE as an extraction solvent for the SCFAs. Next, the LLE procedure with MTBE was applied to each biological matrix: human plasma, serum, feces, and mouse cecum tissue. Figure 2 shows chromatograms of the target analytes extracted with MTBE from each water and biological matrix. The target analytes were well separated and detected, and no interfering substances were found around the retention times of the analytes.

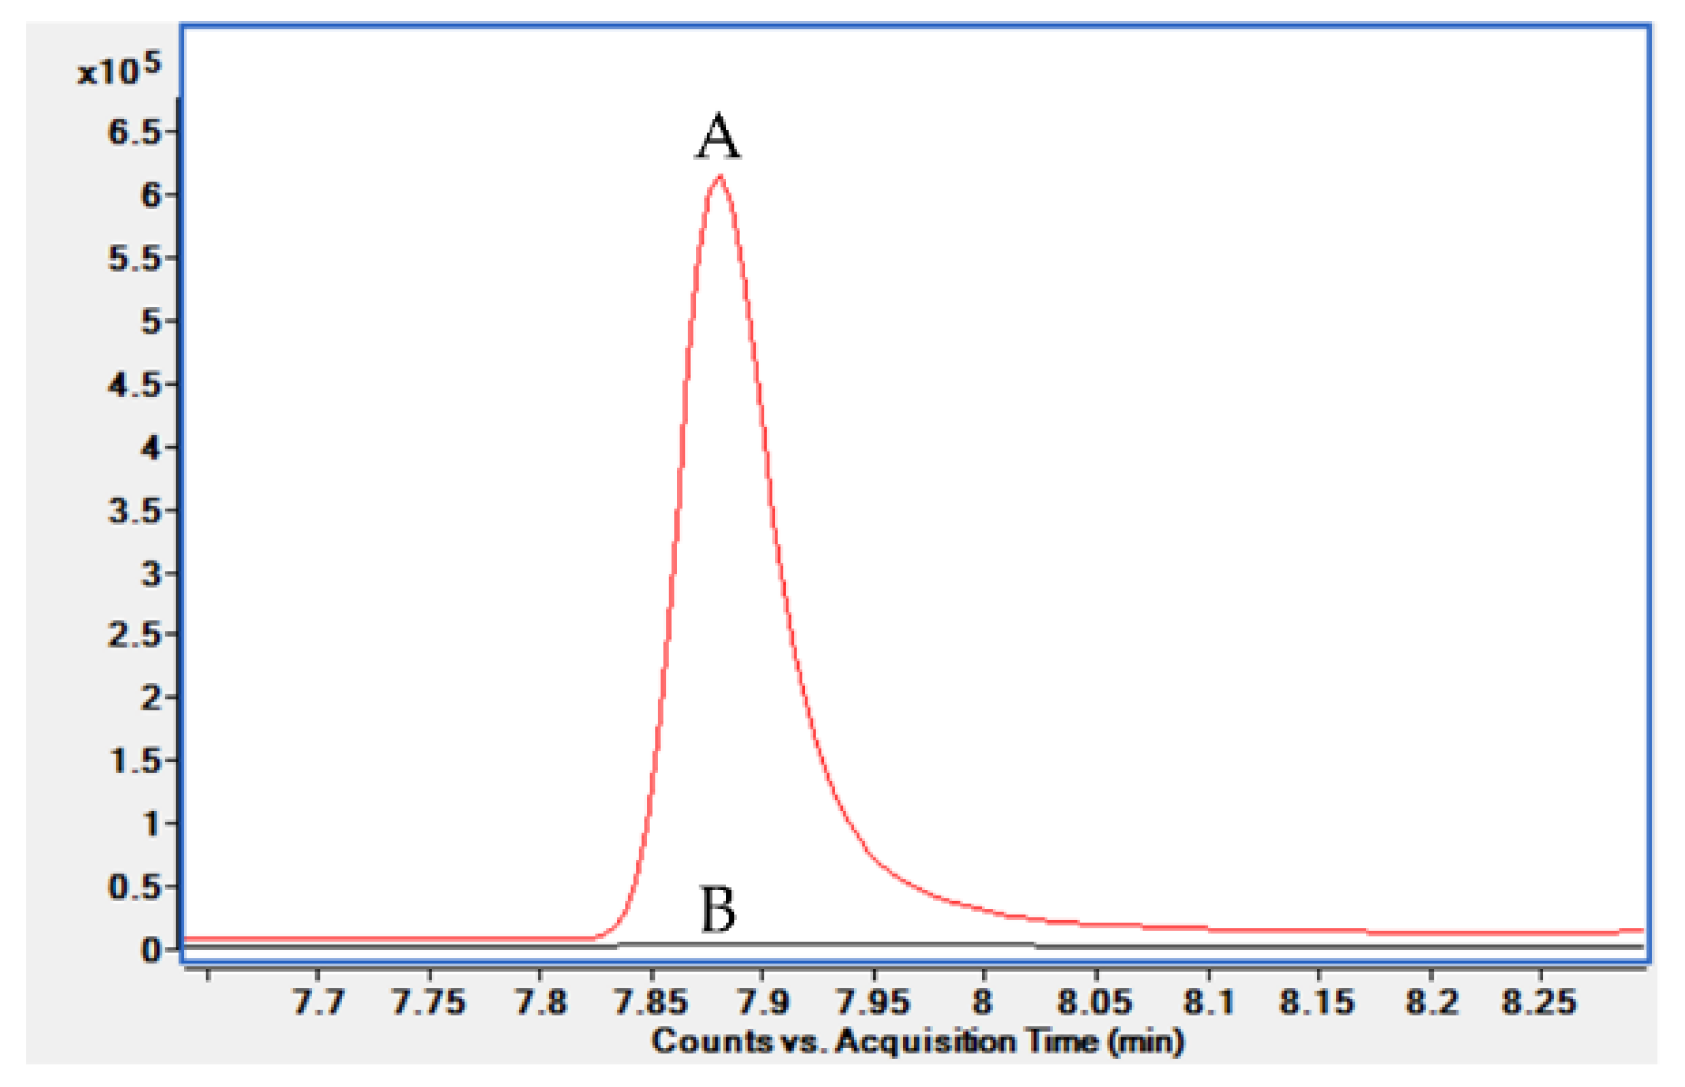
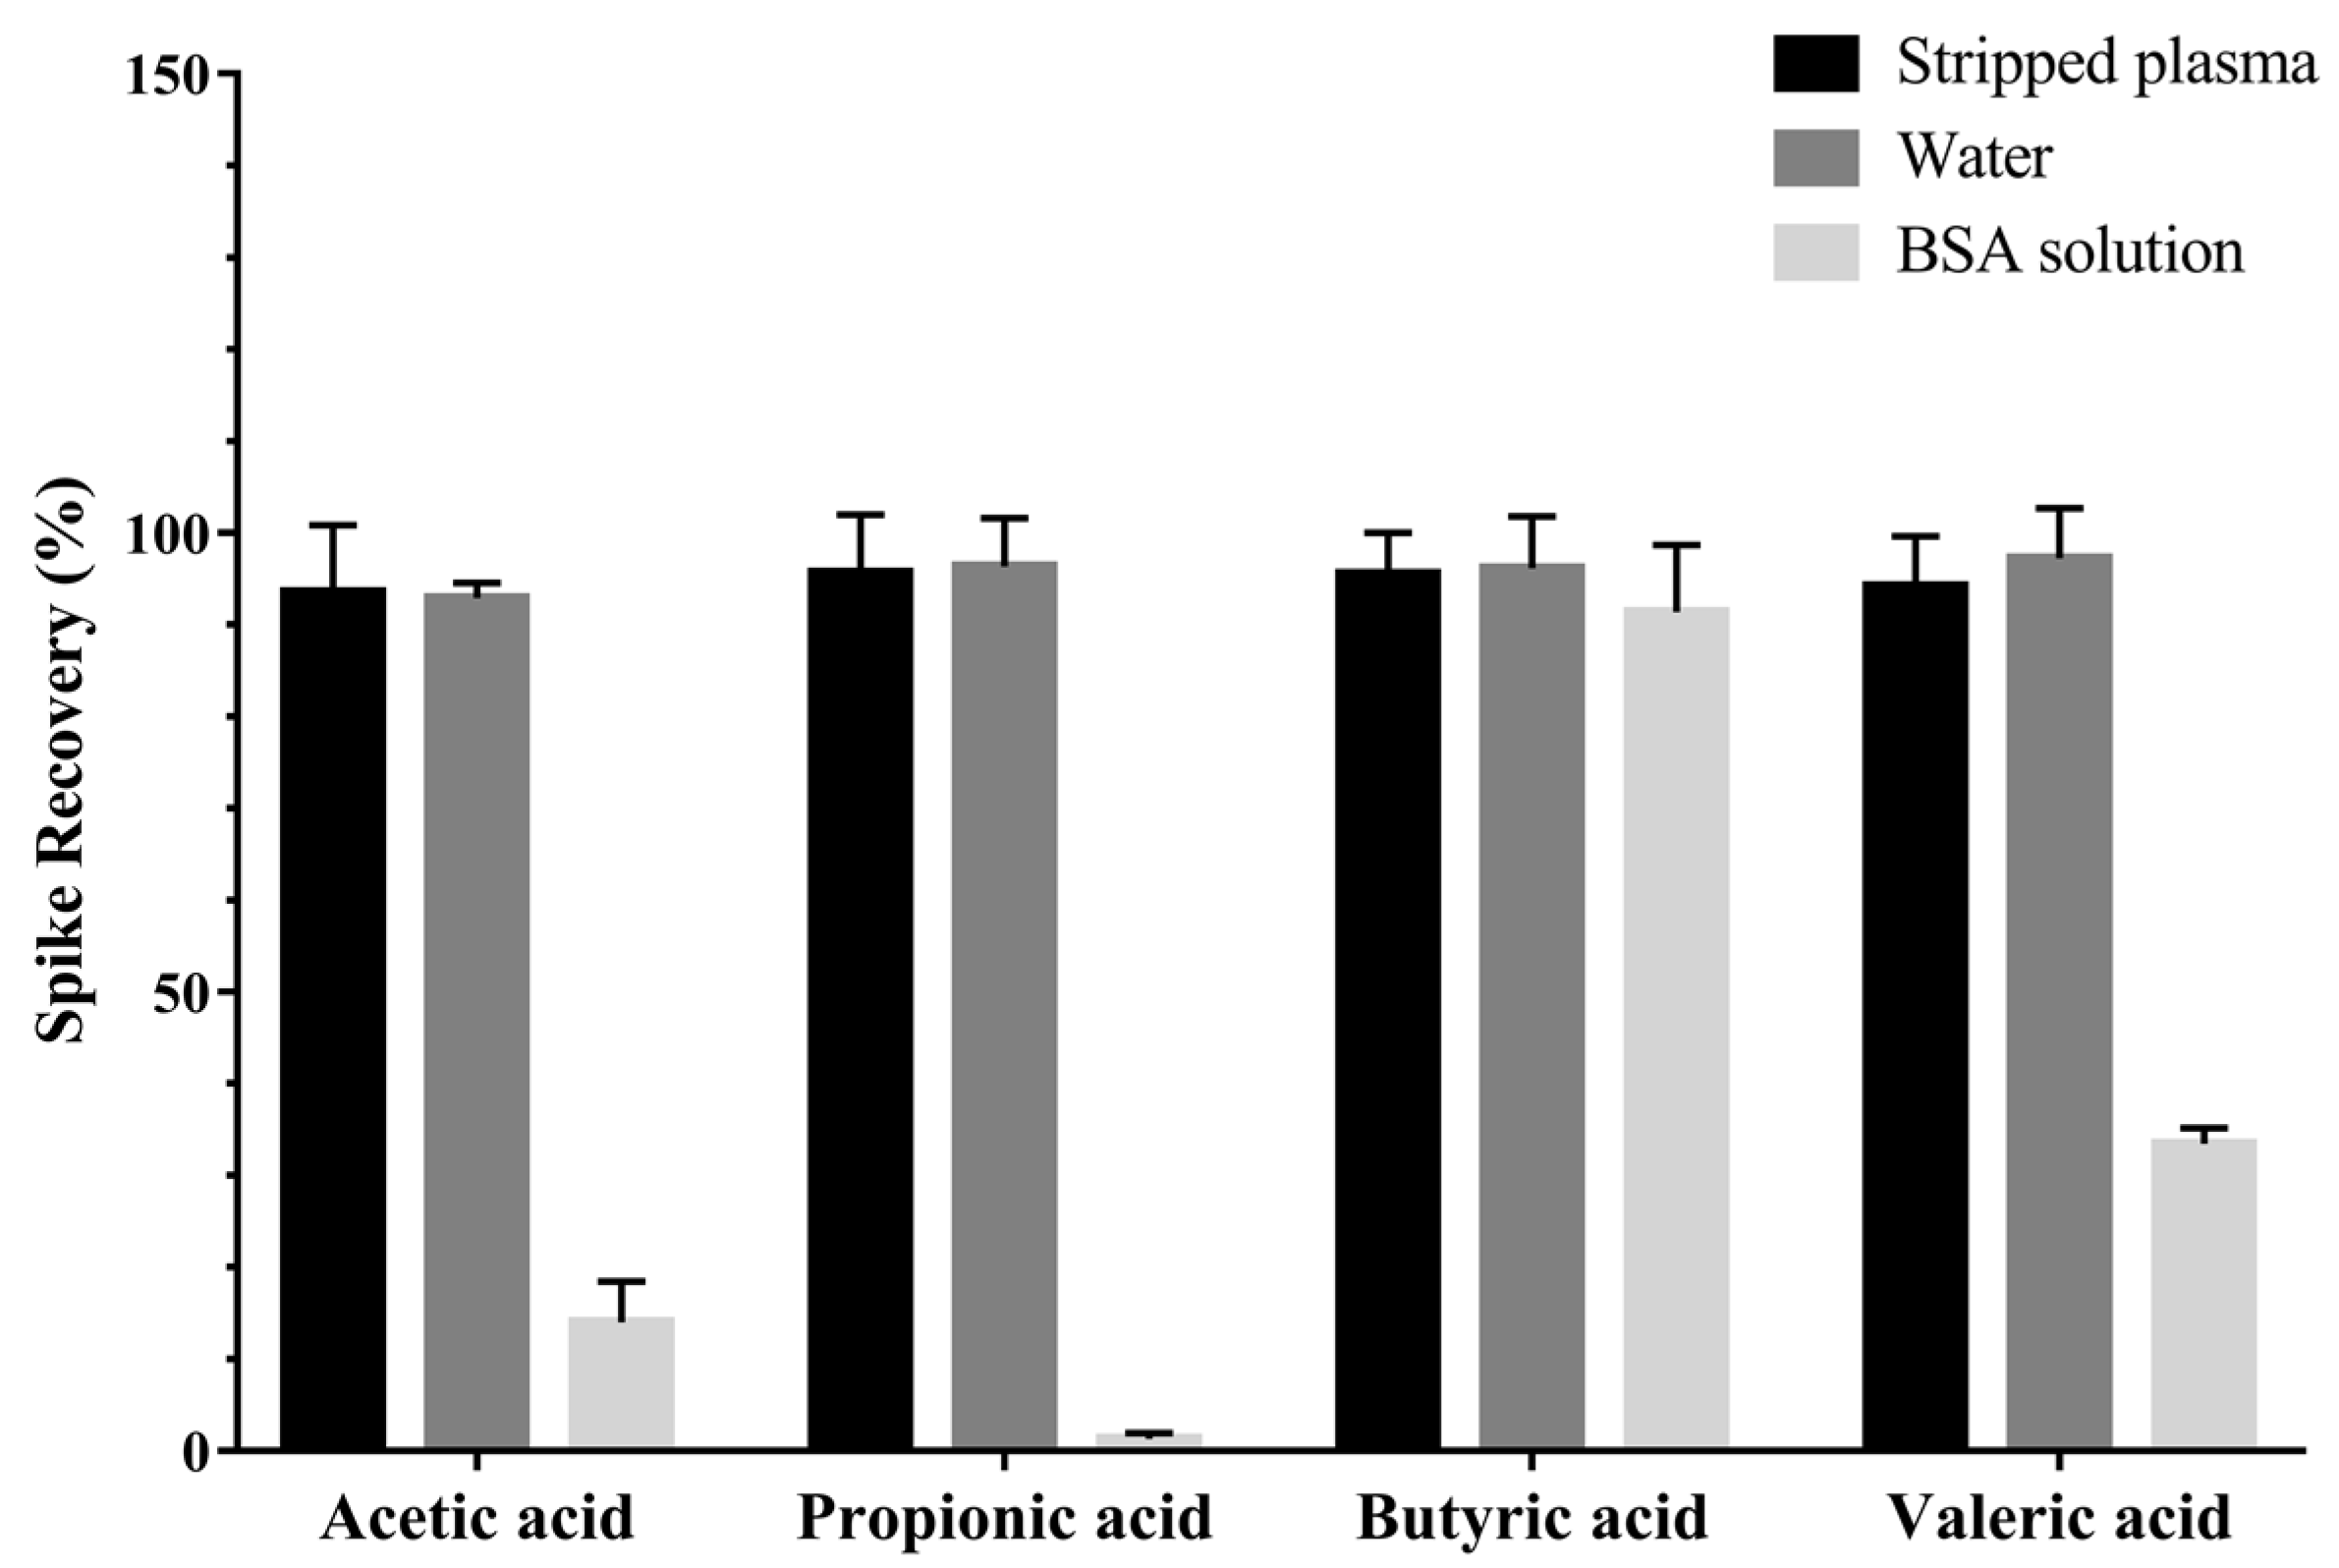
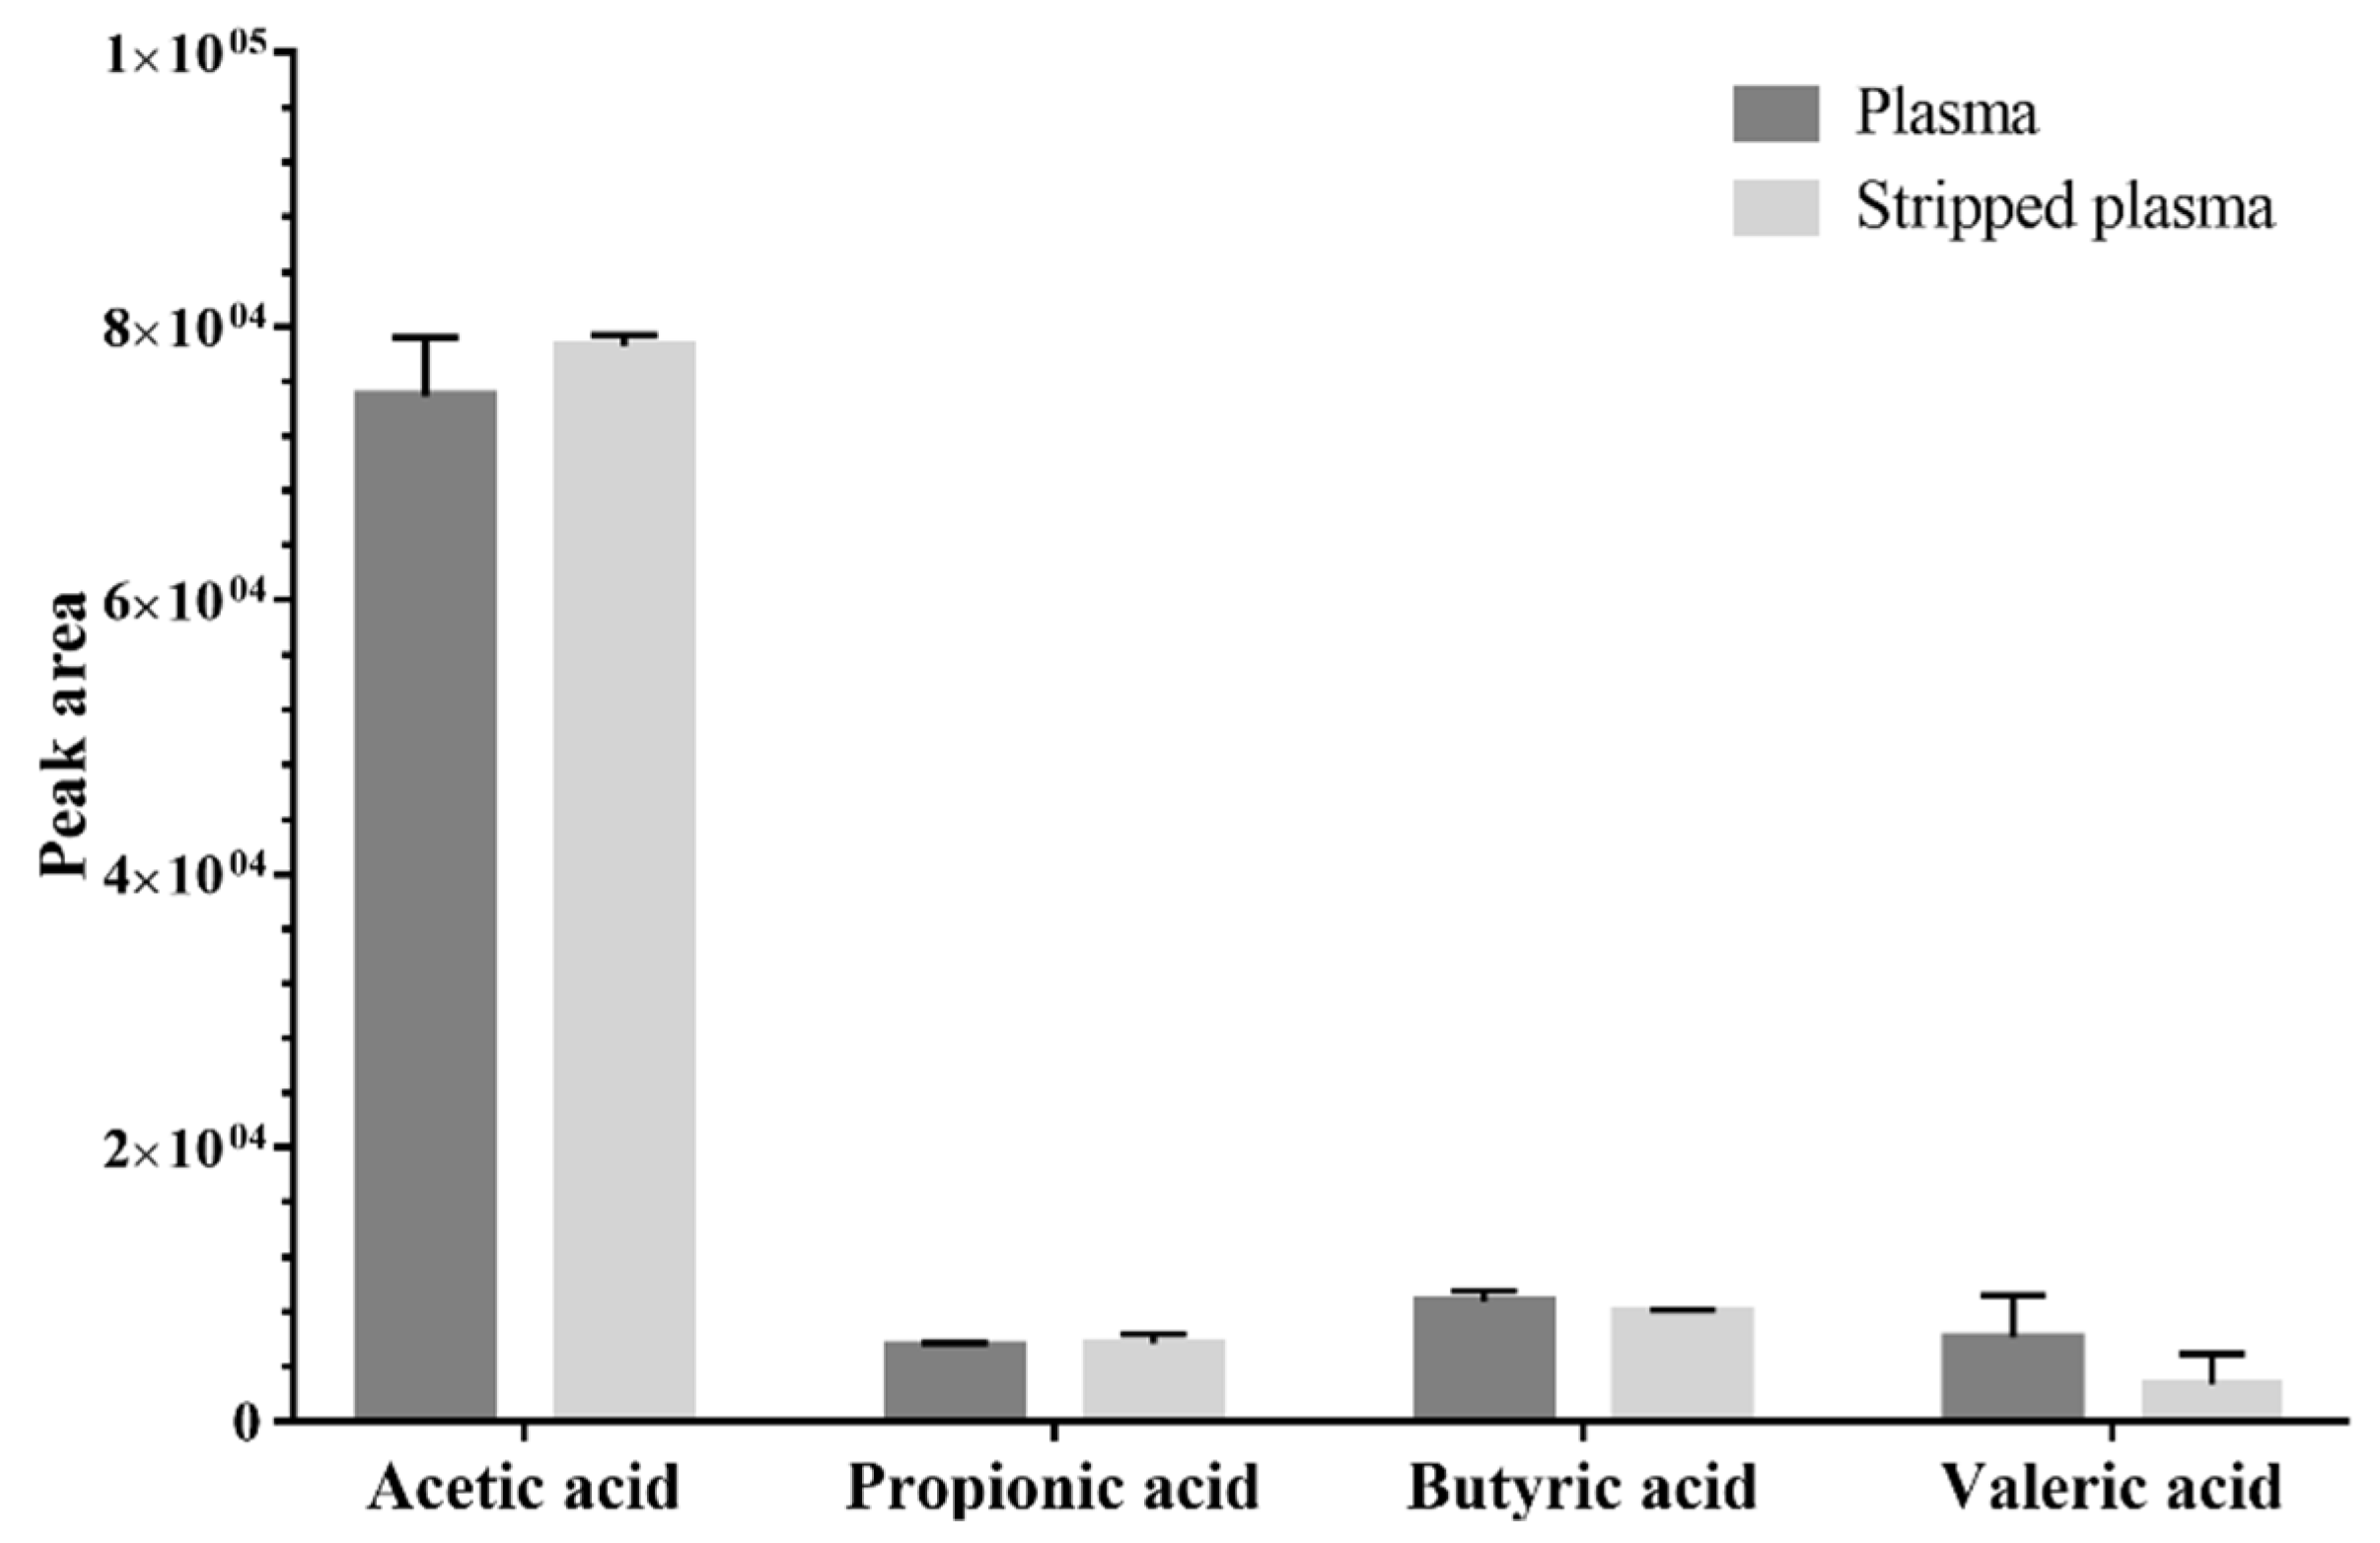
2.1.3. Surrogate Matrix Selection

One limitation related to the quantification of endogenous SCFAs in the biological sample is the absence of matrix-matched calibration. We aimed to avoid the excessive use of biological matrices for calibration standard preparation so we could analyze small amounts of the samples. Thus, we explored the surrogate matrix approach. In this study, charcoal-stripped plasma, bovine serum albumin (BSA) solution, and water were selected for testing the spike recovery for SCFAs with plasma (Figure A3). First, the charcoal-stripped plasma was not in the SCFA-depleted matrix, which was discarded (Figure A4). The BSA solution showed low recovery. The water exhibited a similar extraction recovery for SCFAs with plasma. Consecutively, the spike recovery between the water and the other target biological matrices, including serum, feces, and cecum tissue, were further evaluated, and similar results were obtained (Table A1). The spike recovery results indicate that the water shows a similar extraction efficiency for SCFAs with target biological matrices. Therefore, the water was selected as a surrogate matrix for the quantification of SCFAs in those biological matrices.

2.2. Method Validation

2.2.1. Calibration Curve and Precision

In this study, the calibration ranges of each SCFA were divided to analyze the plasma and serum, as well as the feces and cecum tissue, because the amounts of SCFA in the feces and cecum tissue were much higher than those in the plasma and serum. Table 2 shows the two calibration curve parameters for each SCFA, including the calibration range, limit of detection (LOD), and limit of quantification (LOQ). The LOQ of propionic acid, butyric acid, and valeric acid, which was calculated from the calibration range for the analysis of plasma and serum, ranged between 12.67–28.06, which was lower than in a previous study [14]. The relative standard deviation (RSD) values of inter-day precision of three concentration levels (Table A2) were less than 10%, which was within the acceptable range of the relevant guidelines (Table 2) [25,26]. We thus confirmed the precision of the developed method.

2.2.2. Parallelism

The slope parallelism results between the slope of water and the biological sample were 0.98 to 1.02, respectively, with a standard deviation (SD) less than 0.02 (Table 3). Improved results were obtained compared with previous studies, especially for butyric acid and valeric acid, which were measured as 0.82 and 0.83, respectively [20]. Relative error (RE) was measured between the extrapolated negative X-intercept value from the curve in the biological sample and the interpolated concentration from the curve in water. The mean RE values were less than 10% (Table 3). The two parallelism assessment results indicate that water is a feasible surrogate matrix for the quantification of SCFAs in plasma, serum, feces, and cecum tissue.

2.2.3. Recovery and Matrix Effect

The recovery was evaluated at three concentration levels for SCFAs in plasma, serum, feces, and cecum tissue (Table 4). The mean recovery results ranged from 94.89–109.32%, and these results validated the consistent extraction efficiencies for SCFAs in the target biological samples. The matrix effects at three concentration levels ranged from 97.18–108.37% (Table 4), with an SD of less than 6.52%, and these results were improved over those in a previous study, which found a range of 65–74% of the matrix effect value for acetic acid [30]. In conclusion, the developed method can be applied for the quantification of SCFAs in plasma, serum, feces, and cecum tissue.

2.3. Quantification of the SCFAs in the Biological Samples

We quantified the SCFAs using the validated method in 10 human plasmas, 20 sera, and 10 feces, and 6 mouse cecum tissues to determine whether the validated method can be applied in biological samples (Table 5). The serum, feces, and cecum tissue samples were quantified within the calibration range. Among the 10 plasma samples, two butyric acids and three valeric acids were quantified at lower than the calibration range. The concentration ranges of SCFAs in this study were similarly determined from previous studies in each human plasma [31], serum [8], feces [32], and mouse cecum tissue [33]. The quantification results indicate that the developed method can be applied to the four biological matrices. In addition, the composition of the SCFAs was similarly determined in this study, compared to the previous studies. The composition of the SCFAs found in the human serum, i.e., acetic acid, propionic acid, and butyric acid, were analyzed to be 92:7:1, respectively. In a previous study, the composition of acetic acid, propionic acid, and butyric acid in human serum was reported to be 95:4:1, respectively [8]. In the human colon, the composition of acetic acid, propionic acid, and butyric acid is 60:20:20, respectively [34]. In our results, a similar composition of acetic acid, propionic acid, and butyric acid was found in human feces, i.e., 53:26:21, respectively.

3. Materials and Methods

3.1. Chemicals and Reagents

The reference standards, including acetic acid (purity ≥ 99%), propionic acid (purity ≥ 99.5%), butyric acid (purity ≥ 99.5%), valeric acid (purity ≥ 99.8%), and acetic acid-d4 (purity ≥ 99.5%) were obtained from Sigma-Aldrich (South Korea), and the butyric acid-d7 (purity ≥ 98%) was obtained from Cayman Chemical (Ann Arbor, MI, USA).
The reagents, including 37% HCl, MTBE (purity ≥ 99.5%), DE (purity ≥ 99.9%), chloroform (Chl, purity ≥ 99.5%), n-hexane (HA, purity ≥ 95%), bovine serum albumin (BSA), phosphate buffer saline (1.0 M), and dextran-coated charcoal were obtained from Sigma-Aldrich (Darmstadt, Germany), and distilled water was obtained from J. T. Baker (Phillipsburg, NJ, USA).

3.2. Preparation of Standard Solutions

Stock solutions of each SCFA were prepared in water at the concentration of 10 mg/mL. Working and calibration solutions of SCFAs were also prepared in water. Internal standard (IS) solutions (acetic acid-d4 and butyric acid-d7) were prepared in water, at the concentration of 100 µg/mL and 10 µg/mL (for plasma and serum analysis) or 500 µg/mL and 30 µg/mL (for feces and cecum tissue analysis), respectively. All the solutions were stored at 4 °C. The stabilities of the solutions were evaluated weekly, and RSD lower than 5% was observed.

3.3. Biological Sample Preparation

Human plasmas, sera, and feces were obtained from healthy fasting volunteers and the mouse cecum tissues were collected immediately after sacrifice. All the biological samples were kept at −80 °C until analysis. For the analysis of the sample, the plasma and serum were thawed at 4 °C. Water was added to feces and cecum tissue at 500 µL: 50 mg ratio right before the sample analysis. The feces samples were vortexed for 20 min, and the cecum tissues were homogenized using TissueRuptor (Qiagen, Hilden, Germany). The homogenized feces and homogenized cecum tissue were centrifuged for 5 min at 18,341× g and 4 °C, and the supernatants were transferred into a 1.5 mL plastic tube.

3.4. Extraction Procedure

A 100 µL of standard solution, plasma, serum, homogenized feces, and homogenized cecum tissue were transferred into a 1.5 mL plastic tube. Then, 10 µL of 1.0 M HCl was added to the samples. Consecutively, each 10 µL of the IS working solutions was spiked to facilitate quantification of SCFAs [26]. The mixture was vortexed for 1 min and centrifuged for 5 min at 18,341× g and 4 °C. A 100 µL of supernatants were transferred into new 1.5 mL plastic tubes, and then 200 µL of MTBE was added to induce LLE. The LLE was processed by vigorously vortexing the mixture for 20 min and then centrifuged for 5 min at 18,341× g and 4 °C. Finally, 100 µL of MTBE phase was transferred into an autosampler vial with a glass insert and analyzed by GC/MS.

3.5. Extraction Recovery

The extraction recovery was evaluated to optimize the extraction solvent for SCFAs in acidified water. The 100 µL SCFA standard mixture at a certain concentration (8 µg/mL for acetic acid and 0.8 µg/mL for propionic, butyric, and valeric acid, respectively) was acidified with 10 µL of 1.0 M HCl. The mixture was extracted with 200 µL of each organic solvent: DE, MTBE, Chl, and HA. The peak area of each SCFA was compared to the SCFA standard mixture at the same concentration, dissolved in water. The extraction recovery (%) was analyzed in triplicate and was calculated as A/B × 100, where A is the peak area of SCFA extracted with each solvent, and B is the peak area of SCFA dissolved in water. The extraction recovery value was analyzed in triplicate and expressed as mean ± SD.

3.6. Surrogate Matrix Selection

We processed the surrogate matrix selection by evaluating the spike recovery with an authentic biological matrix. We tested stripped plasma (8.0 g dextran-coated charcoal in 50 mL of plasma), BSA solution (2 mg/mL of BSA in 1.0 M phosphate buffer saline), and water to select the surrogate matrix. A total of 20 µL of SCFA standard mixture (at 40 µg/mL for acetic acid and 4 µg/mL for propionic, butyric, and valeric acid, respectively) and 20 µL of IS solution (at 50 µg/mL for acetic acid-d4 and 5 µg/mL for butyric acid-d7) were spiked in the surrogate and biological matrices. A blank sample was also prepared to correct the amount of the baseline SCFA. The samples were extracted as described in the extraction procedure. The spike recovery (%) was calculated as A/B × 100, where A is the peak area ratio (peak area of SCFA/peak area of the corresponding IS) of SCFA in the surrogate matrix and B is the peak area ratio of SCFA in the biological sample. The spike recovery was analyzed in triplicate, and the results were presented as mean ± SD.

3.7. GC/MS Analysis

The sample analysis was performed using an Agilent 7890B gas chromatograph (Agilent Technologies Inc., Santa Clara, CA, USA), coupled with an Agilent 7000B triple quadrupole mass spectrometer (Agilent Technologies Inc., Santa Clara, CA, USA). A total of 1 µL aliquots of the samples were injected at different split ratios; for the plasma and serum, the samples were injected with a front inlet split ratio of 10, whereas the split ratio of 100 was used for the feces and cecum tissue analyses. The injected samples were separated through the DB-FFAP (free fatty acid phase) column (30 m × 0.25 mm id, 0.25 µm; J&W Scientific, Folsom, CA, USA). Helium (purity ≥ 99.999%) gas was used as a carrier gas at a constant flow of 1.0 mL/min. The initial GC oven temperature was 40 °C, held for 2 min, increased by 40 °C/min to 95 °C, held for 1 min, increased by 5 °C/min to 140 °C, and then finally increased by 40 °C/min to 200 °C. The post-run time was 6 min at 240 °C. The transfer line, ion source, and quadrupole temperatures were set to be 280, 230, and 150 °C, respectively. The energy of electron ionization was set to 70 eV.
The MS data of the analytes were acquired in full scan mode from m/z range 40–150. The identification of compounds was achieved by the injection of chemical standards and comparison of the retention time and corresponding MS spectra. The analytes were quantified in the selected ion monitoring (SIM) mode using target ions (60.0, 63.0, and 74.0 m/z) and confirmed by confirmative ions (43.0, 45.0, 46.0, and 73.0 m/z), as shown in Table 1. The compounds were integrated with the specific m/z value. Data were acquired and analyzed using the Masshunter quantitative program B.06.00 (Agilent Technologies Inc., Santa Clara, CA, USA) and Graphpad Prism 7.00 (GRAPH PAD Software Inc., San Diego, CA, USA).

3.8. Method Validation

The validation was processed by referring to the relevant bioanalytical guidelines [25,26].

3.8.1. Calibration Curve, Linearity, and Precision

The two calibration ranges were developed for each SCFA. One was the calibration range for analysis of the plasma and serum, and the other was the calibration range for analysis of the feces and cecum tissue. Eight concentration levels of the calibration standards, diluted in water, were prepared and extracted as described in the extraction procedure. The calibration curve was constructed by plotting the peak area ratio of each SCFA to the corresponding IS versus the concentration of each SCFA, and linear regression was performed. The linearity of the calibration curve of each SCFA was determined by the calculated coefficient of determination (R2) value over 0.99 (n = 5). The LOD was calculated as: 3.3 × Sa/b, where Sa is the SD of the Y-intercept (n = 5), and b is the slope of the linear regression curve [35,36]. The LOQ was calculated as 3 × LOD. Inter-day precision was evaluated at three different concentration levels (low, medium, and high) of SCFA working solutions (Table A2). Five replicates of the samples were analyzed during three different days, and the inter-day precision was expressed as RSD.

3.8.2. Parallelism

Parallelism was evaluated using the standard addition approach. Each water and biological sample was divided into aliquots of 100 µL and then extracted as described in the extraction procedure. Then the same amount of eight concentration levels of calibration solutions and the IS solution were spiked in each aliquot to construct the standard curve by linear regression. The parallelism was analyzed in sextuplicate in each biological sample type. The slope of the curve between the water and the biological matrix was compared and calculated as slope of the curve in water/slope of the curve in the biological sample. The slope comparison results were expressed as mean ± SD. The parallelism was also evaluated by measuring the RE% and calculated as |A − B|/A, where A is the negative X-intercept value of extrapolated curve in the biological sample, and B is the biological sample interpolated from the curve in the water. RE values were expressed as mean ± SD.

3.8.3. Recovery and Matrix Effect

The developed method employs the sample extraction procedure. Thus, the recovery of the biological samples was evaluated by spiking the SCFA working solutions, either pre-or post-extraction step. The recovery (%) was calculated as A/B × 100%, where A is the peak area of SCFA in the post-extraction spiked samples, and B is the peak area of the SCFA in the pre-extraction spiked samples. The recovery values were evaluated at three concentration levels of the SCFA working solutions (Table A2) and represented as mean ± SD (n = 3).
For the matrix effect evaluation, each water and biological sample was spiked with three concentration levels of the SCFA working solutions (Table A2) and an equal amount of IS working solution and then extracted as described in the extraction procedure. The blank biological sample spiked with the IS working solution was also prepared and extracted to correct the baseline. The matrix effect value (%) was calculated as (A − B)/C × 100%, where A is the peak area ratio of SCFA in the spiked biological sample, B is the peak area ratio of SCFA in the blank biological sample, and C is the peak area ratio of SCFA in the spiked water sample. The matrix effect was evaluated from six different origins by each biological matrix, and the results are expressed as mean ± SD.

4. Conclusions

An improved method was developed by employing a surrogate matrix approach and GC/MS for the quantification of SCFAs from human plasma, serum, feces, and mouse cecum tissue. SCFAs extracted with MTBE were successfully detected without derivatization. The water was a feasible surrogate matrix and could be applied without the additional use of the biological samples to prepare the calibration standards. This developed method was validated in terms of parallelism, recovery, and matrix effect. The method can be used as a simple and accurate SCFA profiling method in gut microbiome–host interaction studies.

Author Contributions

Conceptualization, J.-Y.C.; methodology, K.-S.K. and Y.L.; software, K.-S.K.; validation, K.-S.K.; formal analysis, K.-S.K.; investigation, K.-S.K. and Y.L.; resources, J.-Y.C.; data curation, K.-S.K. and W.C.; writing—original draft preparation, K.-S.K.; writing—review and editing, Y.L., W.C., and J.-Y.C.; visualization, K.-S.K.; supervision, J.-Y.C.; project administration, J.-Y.C.; funding acquisition, J.-Y.C. All authors have read and agreed to the published version of the manuscript.

Funding

This research was supported by (1) the Bio and Medical Technology Development Program of the National Research Foundation (NRF-2016M3A9B6902851) funded by the Ministry of Science and ICT and by (2) the Technology Innovation Program (20013712) funded by the Ministry of Trade, Industry, and Energy (MOTIE, Korea).

Institutional Review Board Statement

The human study was conducted per the Declaration of Helsinki and approved by the Institutional Review Board of Bundang Seoul National University Hospital (B-2004/606-003). The animal study was conducted according to the guidelines provided by the Institutional Animal Care and Use Committee at SNU (SNU-181128-2).

Informed Consent Statement

Informed consent was obtained from all subjects involved in the study.

Data Availability Statement

The data presented in this study are available on request from the corresponding author because the raw data are not publicly available due to restrictions.

Acknowledgments

Kyeong-Seog Kim received a scholarship from the BK21 FOUR education program.

Conflicts of Interest

The authors declare no conflict of interest.

Appendix A

Figure A1. SIM chromatograms of SCFA standard mixture dissolved in water.
Metabolites 12 00525 g0a1
Figure A2. Overlay of the acetic acid in selected ion monitoring (SIM) chromatograms of the (A) water blank with DE for extraction and (B) water blank with MTBE for extraction.
Metabolites 12 00525 g0a2
Figure A3. Spike recovery of SCFAs between surrogate matrix candidates and plasma (n = 3, mean ± standard deviation).
Metabolites 12 00525 g0a3
Figure A4. Baseline peak area of SCFAs in plasma and charcoal-stripped plasma (n = 3, mean ± standard deviation).
Metabolites 12 00525 g0a4
Table A1. Spike recovery results between water and serum, feces, and cecum (n = 3, mean ± standard deviation).
SCFAsSerumFecesCecum
Acetic acid92.78 ± 0.9698.26 ± 1.21100.27 ± 1.17
Propionic acid96.04 ± 1.17105.33 ± 1.87105.77 ± 6.35
Butyric acid100.08 ± 1.02104.67 ± 3.64105.16 ± 5.74
Valeric acid97.09 ± 0.88104.3 ± 5.05108.29 ± 4.24
Table A2. Spiked concentration levels in each calibration range.
SCFAsSpiked Concentration Levels for Calibration Ranges of Plasma and Serum (µg/mL)Spiked Concentration Levels for Calibration Ranges of Feces and Cecum Tissue (µg/mL)
LowMediumHighLowMediumHigh
Acetic acid2.2581560250375
Propionic acid0.150.81.5690150
Butyric acid0.0750.81.5690150
Valeric acid0.0450.81.5330150

References

  1. McNeil, N.I.; Cummings, J.; James, W. Short chain fatty acid absorption by the human large intestine. Gut 1978, 19, 819–822. [Google Scholar] [CrossRef] [PubMed] [Green Version]
  2. Koh, A.; De Vadder, F.; Kovatcheva-Datchary, P.; Bäckhed, F. From dietary fiber to host physiology: Short-chain fatty acids as key bacterial metabolites. Cell 2016, 165, 1332–1345. [Google Scholar] [CrossRef] [PubMed] [Green Version]
  3. Dalile, B.; Van Oudenhove, L.; Vervliet, B.; Verbeke, K. The role of short-chain fatty acids in microbiota-gut-brain communication. Nat. Rev. Gastroenterol. Hepatol. 2019, 16, 461–478. [Google Scholar] [CrossRef] [PubMed]
  4. Frost, G.; Sleeth, M.L.; Sahuri-Arisoylu, M.; Lizarbe, B.; Cerdan, S.; Brody, L.; Anastasovska, J.; Ghourab, S.; Hankir, M.; Zhang, S.; et al. The short-chain fatty acid acetate reduces appetite via a central homeostatic mechanism. Nat. Commun. 2014, 5, 3611. [Google Scholar] [CrossRef] [Green Version]
  5. Sun, M.; Wu, W.; Liu, Z.; Cong, Y. Microbiota metabolite short chain fatty acids, GPCR, and inflammatory bowel diseases. J. Gastroenterol. 2017, 52, 1–8. [Google Scholar] [CrossRef] [PubMed]
  6. Zhuang, X.; Li, T.; Li, M.; Huang, S.; Qiu, Y.; Feng, R.; Zhang, S.; Chen, M.; Xiong, L.; Zeng, Z. Systematic Review and Meta-analysis: Short-Chain Fatty Acid Characterization in Patients With Inflammatory Bowel Disease. Inflamm. Bowel Dis. 2019, 25, 1751–1763. [Google Scholar] [CrossRef]
  7. Holmes, Z.C.; Silverman, J.D.; Dressman, H.K.; Wei, Z.; Dallow, E.P.; Armstrong, S.C.; Seed, P.C.; Rawls, J.F.; David, L.A. Short-Chain Fatty Acid Production by Gut Microbiota from Children with Obesity Differs According to Prebiotic Choice and Bacterial Community Composition. MBio 2020, 11, e00914-20. [Google Scholar] [CrossRef]
  8. Rahman, M.N.; Diantini, A.; Fattah, M.; Barliana, M.I.; Wijaya, A. A highly sensitive, simple, and fast gas chromatography–mass spectrometry method for the quantification of serum short-chain fatty acids and their potential features in central obesity. Anal. Bioanal. Chem. 2021, 413, 6837–6844. [Google Scholar] [CrossRef]
  9. Natarajan, N.; Hori, D.; Flavahan, S.; Steppan, J.; Flavahan, N.A.; Berkowitz, D.E.; Pluznick, J.L. Microbial short chain fatty acid metabolites lower blood pressure via endothelial G protein-coupled receptor 41. Physiol. Genom. 2016, 48, 826–834. [Google Scholar] [CrossRef]
  10. Remely, M.; Aumueller, E.; Merold, C.; Dworzak, S.; Hippe, B.; Zanner, J.; Pointner, A.; Brath, H.; Haslberger, A.G. Effects of short chain fatty acid producing bacteria on epigenetic regulation of FFAR3 in type 2 diabetes and obesity. Gene 2014, 537, 85–92. [Google Scholar] [CrossRef]
  11. Zhao, L.; Zhang, F.; Ding, X.; Wu, G.; Lam, Y.Y.; Wang, X.; Fu, H.; Xue, X.; Lu, C.; Ma, J. Gut bacteria selectively promoted by dietary fibers alleviate type 2 diabetes. Science 2018, 359, 1151–1156. [Google Scholar] [CrossRef] [PubMed] [Green Version]
  12. Rosser, E.C.; Piper, C.J.M.; Matei, D.E.; Blair, P.A.; Rendeiro, A.F.; Orford, M.; Alber, D.G.; Krausgruber, T.; Catalan, D.; Klein, N.; et al. Microbiota-Derived Metabolites Suppress Arthritis by Amplifying Aryl-Hydrocarbon Receptor Activation in Regulatory B Cells. Cell Metab. 2020, 31, 837–851.e10. [Google Scholar] [CrossRef] [PubMed]
  13. Saresella, M.; Marventano, I.; Barone, M.; La Rosa, F.; Piancone, F.; Mendozzi, L.; d’Arma, A.; Rossi, V.; Pugnetti, L.; Roda, G.; et al. Alterations in Circulating Fatty Acid Are Associated With Gut Microbiota Dysbiosis and Inflammation in Multiple Sclerosis. Front. Immunol. 2020, 11, 1390. [Google Scholar] [CrossRef] [PubMed]
  14. Zhang, S.; Wang, H.; Zhu, M.J. A sensitive GC/MS detection method for analyzing microbial metabolites short chain fatty acids in fecal and serum samples. Talanta 2019, 196, 249–254. [Google Scholar] [CrossRef]
  15. Li, M.; Zhu, R.; Song, X.; Wang, Z.; Weng, H.; Liang, J. A sensitive method for the quantification of short-chain fatty acids by benzyl chloroformate derivatization combined with GC-MS. Analyst 2020, 145, 2692–2700. [Google Scholar] [CrossRef]
  16. He, L.; Prodhan, M.A.I.; Yuan, F.; Yin, X.; Lorkiewicz, P.K.; Wei, X.; Feng, W.; McClain, C.; Zhang, X. Simultaneous quantification of straight-chain and branched-chain short chain fatty acids by gas chromatography mass spectrometry. J. Chromatogr. B 2018, 1092, 359–367. [Google Scholar] [CrossRef]
  17. Zheng, X.; Qiu, Y.; Zhong, W.; Baxter, S.; Su, M.; Li, Q.; Xie, G.; Ore, B.M.; Qiao, S.; Spencer, M.D.; et al. A targeted metabolomic protocol for short-chain fatty acids and branched-chain amino acids. Metabolomics 2013, 9, 818–827. [Google Scholar] [CrossRef] [Green Version]
  18. Zhao, G.; Nyman, M.; Jonsson, J.A. Rapid determination of short-chain fatty acids in colonic contents and faeces of humans and rats by acidified water-extraction and direct-injection gas chromatography. Biomed. Chromatogr. 2006, 20, 674–682. [Google Scholar] [CrossRef]
  19. Wang, C.Y.; Chen, Y.W.; Tain, Y.L.; Chang, S.K.C.; Huang, L.T.; Hsieh, C.W.; Hou, C.Y. Fast quantification of short-chain fatty acids in rat plasma by gas chromatography. J. Food Sci. 2020, 85, 1932–1938. [Google Scholar] [CrossRef]
  20. Lotti, C.; Rubert, J.; Fava, F.; Tuohy, K.; Mattivi, F.; Vrhovsek, U. Development of a fast and cost-effective gas chromatography-mass spectrometry method for the quantification of short-chain and medium-chain fatty acids in human biofluids. Anal. Bioanal. Chem. 2017, 409, 5555–5567. [Google Scholar] [CrossRef]
  21. Yamabe, S.; Tsuchida, N.; Hayashida, Y. Reaction paths of the water-assisted neutral hydrolysis of ethyl acetate. J. Phys. Chem. A 2005, 109, 7216–7224. [Google Scholar] [CrossRef] [PubMed]
  22. Pal, P.; Nayak, J. Acetic acid production and purification: Critical review towards process intensification. Sep. Purif. Rev. 2017, 46, 44–61. [Google Scholar] [CrossRef]
  23. Jones, B.R.; Schultz, G.A.; Eckstein, J.A.; Ackermann, B.L. Surrogate matrix and surrogate analyte approaches for definitive quantitation of endogenous biomolecules. Bioanalysis 2012, 4, 2343–2356. [Google Scholar] [CrossRef] [PubMed]
  24. Luo, L.; Ramanathan, R.; Horlbogen, L.; Mathialagan, S.; Costales, C.; Vourvahis, M.; Holliman, C.L.; Rodrigues, A.D. A multiplexed HILIC-MS/HRMS assay for the assessment of transporter inhibition biomarkers in phase i clinical trials: Isobutyryl-carnitine as an organic cation transporter (OCT1) biomarker. Anal. Chem. 2020, 92, 9745–9754. [Google Scholar] [CrossRef]
  25. U.S. Department of Health and Human Services; Food and Drug Administration; Center for Drug Evaluation and Research (CDER); Center for Veterinary Medicine (CVM). Bioanalytical Method Validation—Guidance for Industry. 2018. Available online: http://www.fda.gov/downloads/Drugs/Guidances/ucm070107.pdf (accessed on 3 April 2022).
  26. European Medicines Agency. ICH Guideline M10 on Bioanalytical Method Validation Step 2b. 2019. Available online: https://www.ema.europa.eu/en/documents/scientific-guideline/draft-ich-guideline-m10-bioanalytical-method-validation-step-2b_en.pdf (accessed on 3 April 2022).
  27. Hurst, N.R.; Kendig, D.M.; Murthy, K.S.; Grider, J.R. The short chain fatty acids, butyrate and propionate, have differential effects on the motility of the guinea pig colon. Neurogastroenterol. Motil. 2014, 26, 1586–1596. [Google Scholar] [CrossRef]
  28. Wieling, J.; Dijkstra, H.; Mensink, C.; Jonkman, J.; Coenegracht, P.; Duineveld, C.; Doornbos, D. Chemometrics in bioanalytical sample preparation: A fractionated combined mixture and factorial design for the modelling of the recovery of five tricyclic amines from plasma after liquid—liquid extraction prior to high-performance liquid chromatography. J. Chromatogr. A 1993, 629, 181–199. [Google Scholar] [CrossRef]
  29. Di Tommaso, S.; Rotureau, P.; Crescenzi, O.; Adamo, C. Oxidation mechanism of diethyl ether: A complex process for a simple molecule. Phys. Chem. Chem. Phys. 2011, 13, 14636–14645. [Google Scholar] [CrossRef]
  30. Garcia-Villalba, R.; Gimenez-Bastida, J.A.; Garcia-Conesa, M.T.; Tomas-Barberan, F.A.; Carlos Espin, J.; Larrosa, M. Alternative method for gas chromatography-mass spectrometry analysis of short-chain fatty acids in faecal samples. J. Sep. Sci. 2012, 35, 1906–1913. [Google Scholar] [CrossRef]
  31. Jaochico, A.; Sangaraju, D.; Shahidi-Latham, S.K. A rapid derivatization based LC–MS/MS method for quantitation of short chain fatty acids in human plasma and urine. Bioanalysis 2019, 11, 741–753. [Google Scholar] [CrossRef]
  32. Han, J.; Lin, K.; Sequeira, C.; Borchers, C.H. An isotope-labeled chemical derivatization method for the quantitation of short-chain fatty acids in human feces by liquid chromatography–tandem mass spectrometry. Anal. Chim. Acta 2015, 854, 86–94. [Google Scholar] [CrossRef]
  33. Laffin, M.; Fedorak, R.; Zalasky, A.; Park, H.; Gill, A.; Agrawal, A.; Keshteli, A.; Hotte, N.; Madsen, K.L. A high-sugar diet rapidly enhances susceptibility to colitis via depletion of luminal short-chain fatty acids in mice. Sci. Rep. 2019, 9, 12294. [Google Scholar] [CrossRef] [PubMed] [Green Version]
  34. Cummings, J.; Pomare, E.; Branch, W.; Naylor, C.; Macfarlane, G. Short chain fatty acids in human large intestine, portal, hepatic and venous blood. Gut 1987, 28, 1221–1227. [Google Scholar] [CrossRef] [PubMed] [Green Version]
  35. Song, H.E.; Lee, H.Y.; Kim, S.J.; Back, S.H.; Yoo, H.J. A Facile Profiling Method of Short Chain Fatty Acids Using Liquid Chromatography-Mass Spectrometry. Metabolites 2019, 9, 173. [Google Scholar] [CrossRef] [PubMed] [Green Version]
  36. European Medicines Agency. Validation of Analytical Procedures: Text and Methodology Q2 (R1). 1996. Available online: https://www.ema.europa.eu/en/documents/scientific-guideline/ich-q-2-r1-validation-analytical-procedures-text-methodology-step-5_en.pdf (accessed on 3 April 2022).
Figure 1. Extraction recovery of SCFAs with organic solvents. DE, diethyl ether; MTBE, methyl tert-butyl ether; Chl, chloroform; HA, n-hexane (mean ± standard deviation, n = 3).
Metabolites 12 00525 g001
Figure 2. Aggregates of SIM chromatograms (black, m/z = 60.0; red, m/z = 63.0; blue, m/z = 74.0) of SCFAs extracted with MTBE in (A) blank water, (B) SCFA standard mixture in water, (C) plasma, (D) serum, (E) feces, and (F) mouse cecum tissue samples. Peak identification: 1, acetic acid-d4; 2, acetic acid; 3, propionic acid; 4, butyric acid-d7; 5, butyric acid; 6, valeric acid.
Metabolites 12 00525 g002
Table 1. Retention time and target m/z values of the SCFAs and internal standard.
AnalytesRetention Time (min)Target Ion
(m/z)
Confirmative Ion (m/z)
Acetic acid7.9260.043.0
Propionic acid9.3274.045.0
Butyric acid10.9260.073.0
Valeric acid13.0260.073.0
Acetic acid-d4 a7.8463.046.0
Butyric acid-d7 b10.7463.077.0
a Internal standard of acetic acid; b Internal standard of propionic acid, butyric acid, and valeric acid.
Table 2. Calibration range, limit of detection (LOD), limit of quantification, and inter-day precision values for SCFAs.
SCFAsCalibration Range (µg/mL)LOD
(ng/mL)
LOQ
(ng/mL)
Inter-Day Precision
(n = 15, RSD%)
LowMediumHigh
Acetic acid a0.75–20176.15528.456.225.135.02
Propionic acid a0.05–29.3528.066.186.968.18
Butyric acid a0.025–26.6619.994.4423.26
Valeric acid a0.015–24.2212.679.766.108.2
Acetic acid b20–500159.69526.981.921.351.51
Propionic acid b2–200225.99745.773.824.032.72
Butyric acid b2–20031.27103.194.54.913.29
Valeric acid b1–20042.69140.884.465.636.11
a Calibration ranges for analysis of SCFAs in the plasma and serum; b Calibration ranges for analysis of SCFAs in the feces and cecum tissue; RSD, Relative standard deviation.
Table 3. Parallelism results including slope comparison and relative error (RE) of SCFA concentration obtained from the curve in the biological matrix and water. Presented values are mean ± standard deviation.
MatrixSCFAsParallelism (n = 6)
Slope (Water/Biological Matrix)RE% of SCFA Concentration
PlasmaAcetic acid0.98 ± 0.026.59 ± 0.04
Propionic acid1.02 ± 0.019.98 ± 0.12
Butyric acid0.99 ± 0.016.36 ± 0.04
Valeric acid0.97 ± 0.026.17 ± 0.03
SerumAcetic acid0.98 ± 0.014.01 ± 3.36
Propionic acid0.97 ± 0.026.89 ± 4.58
Butyric acid0.98 ± 0.013.73 ± 1.51
Valeric acid0.98 ± 0.026.43 ±3.33
FecesAcetic acid0.99 ± 0.013.77 ± 4.12
Propionic acid0.98 ± 0.022.84 ± 2.88
Butyric acid1 ± 0.023.57 ± 2.85
Valeric acid0.99 ± 0.013.43 ± 3.02
Cecum tissueAcetic acid1.01 ± 0.023.87 ± 3.26
Propionic acid1 ± 0.026.87 ± 4.62
Butyric acid1 ± 0.024.5 ± 3.14
Valeric acid1 ± 0.025.81 ± 4.76
Table 4. Recovery and matrix effect values evaluated at three concentration levels. Presented values are mean ± standard deviation.
MatrixSCFAsRecovery (%, n = 3)Matrix Effect (%, n = 6)
LowMediumHighLowMediumHigh
PlasmaAcetic acid102.12 ± 4.41108.95 ± 2.06103.62 ± 3107.19 ± 6.4299.73 ± 3.5299.9 ± 1.81
Propionic acid101.62 ± 4.23109.32 ± 2.69103.45 ± 2.8298.26 ± 6.5297.31 ± 6.06102.51 ± 1.28
Butyric acid100.26 ± 3.68106.69 ± 2.61101.8 ± 2.29107.14 ± 5.3399.03 ± 3.29100.68 ± 0.77
Valeric acid97.27 ± 4.21105.84 ± 3.33103.96 ± 2.67105.19 ± 2.8898.93 ± 1.96102 ± 1.15
SerumAcetic acid95.9 ± 3.4598.98 ± 4.9298.75 ± 2.48101.64 ± 5.9799.76 ± 2.48100.18 ± 1.48
Propionic acid97.66 ± 5.41100.36 ± 4.2898.61 ± 3.96108.37 ± 2.97100.29 ± 3.7103.08 ± 1.26
Butyric acid95.65 ± 6.04100.3 ± 3.9298.88 ± 2.55102.25 ± 1.59101.88 ± 2.3100.85 ± 0.36
Valeric acid96.14 ± 5.94102.95 ± 3.58100.07 ± 4.0499.54 ± 1.56100.46 ± 0.94101.69 ± 1.7
FecesAcetic acid97.7 ± 3.16102.78 ± 4.15107.58 ± 3.7103.91 ± 2.3699.54 ± 2.2101.22 ± 1.11
Propionic acid96.59 ± 4.38102.26 ± 4.14107.12 ± 3.91107.78 ± 4.65103.51 ± 5.8997.65 ± 1.57
Butyric acid98.98 ± 2.36102.09 ± 5.13106.43 ± 3.97105.29 ±5.198.92 ± 4.0397.83 ± 1.54
Valeric acid98.77 ± 5.03102.76 ± 4.46106.6 ± 4.06103.34 ± 2.4299.94 ± 2.5198.59 ± 1.21
Cecum tissueAcetic acid100.7 ± 2.3496.37 ± 4.7299.47 ± 2.4699.02 ± 2.8997.18 ± 2.3298.7 ± 2.53
Propionic acid94.89 ± 5.495.35 ± 6.0599.74 ± 2.74102.69 ± 2.2299.45 ± 1.1298.5 ± 1.15
Butyric acid98.94 ± 4.2695.98 ± 6.26100.3 ± 2.95103.29 ± 5.8299.96 ± 2.5698.34 ± 1.16
Valeric acid98.21 ± 6.2696.14 ± 6.71100.49 ± 2.8899.67 ± 2.6699.76 ± 1.5399.06 ± 1.53
Table 5. Quantification results of the SCFA in the plasma, serum, feces, and mouse cecum tissue. Presented values are range with mean ± standard deviation.
SCFAsPlasma a (ng/mL)
n = 10
Serum (ng/mL)
n = 20
Feces (µg/g)
n = 10
Cecum Tissue (µg/g)
n = 6
Acetic acid1504.21–2906.72
(2077.55 ± 456.35)
4788.13–8823.54
(6561.86 ± 1068.53)
1251.97–4193.4
(2849.87 ± 1040.81)
2262–4363.38
(2907.17 ± 691.22)
Propionic acid63.94–184.89
(97.57 ± 37.78)
247.69–757.96
(516.93 ± 108.27)
668.82–2398.44
(1406.92 ± 487.19)
308.13–566.11
(399.31 ± 86.59)
Butyric acid25.5–63.61
(38.77 ± 13)
45.01–105.76
(72.78 ± 17.65)
342.08–1966.7
(1086.97 ± 514.29)
865.21–1353.25
(1008 ± 168.88)
Valeric acid18.04–28.34
(22.52 ± 3.35)
20.44–77.65
(38.26 ± 16.42)
86.17–412.25
(199.91 ± 107.49)
43.14–85.53
(65.96 ± 12.73)
a The concentrations lower than the calibration range (butyric acid, n = 2; valeric acid, n = 3) were excluded from the statistics.
Publisher’s Note: MDPI stays neutral with regard to jurisdictional claims in published maps and institutional affiliations.

