Article

Untargeted Metabolomics Profiling Reveals Perturbations in Arginine-NO Metabolism in Middle Eastern Patients with Coronary Heart Disease

1
Qatar Computing Research Institute, Hamad Bin Khalifa University, Doha P.O. Box 5825, Qatar
2
Clinical Research, Trauma & Vascular Surgery, Hamad Medical Corporation, Doha P.O. Box 3050, Qatar
3
Department of Clinical Medicine, Weill Cornell Medical College, Doha P.O. Box 24144, Qatar
4
Department of Cardiology, Heart Hospital, Hamad Medical Corporation, Doha P.O. Box 3050, Qatar
5
Anti-doping Lab Qatar, Doha P.O. Box 27775, Qatar
6
Department of Internal Medicine, Allergy and Immunology, Hamad General Hospital, Hamad Medical Corporation, Doha P.O. Box 3050, Qatar
*
Author to whom correspondence should be addressed.
These authors contributed equally to this work.
Metabolites 2022, 12(6), 517; https://doi.org/10.3390/metabo12060517
Submission received: 28 March 2022 / Revised: 10 May 2022 / Accepted: 21 May 2022 / Published: 3 June 2022
(This article belongs to the Topic Proteomics and Metabolomics in Biomedicine)

Abstract

:
Coronary heart disease (CHD) is a major cause of death in Middle Eastern (ME) populations, with current studies of the metabolic fingerprints of CHD lacking in diversity. Identification of specific biomarkers to uncover potential mechanisms for developing predictive models and targeted therapies for CHD is urgently needed for the least-studied ME populations. A case-control study was carried out in a cohort of 1001 CHD patients and 2999 controls. Untargeted metabolomics was used, generating 1159 metabolites. Univariate and pathway enrichment analyses were performed to understand functional changes in CHD. A metabolite risk score (MRS) was developed to assess the predictive performance of CHD using multivariate analysis and machine learning. A total of 511 metabolites were significantly different between the CHD patients and the controls (FDR p < 0.05). The enriched pathways (FDR p < 10−300) included D-arginine and D-ornithine metabolism, glycolysis, oxidation and degradation of branched chain fatty acids, and sphingolipid metabolism. MRS showed good discriminative power between the CHD cases and the controls (AUC = 0.99). In this first study in the Middle East, known and novel circulating metabolites and metabolic pathways associated with CHD were identified. A small panel of metabolites can efficiently discriminate CHD cases and controls and therefore can be used as a diagnostic/predictive tool.

1. Introduction

Coronary heart disease (CHD) is a major cause of mortality worldwide [1]. Many risk factors have been identified that contribute to CHD, including genetic, lifestyle, and environmental mediators [2]. Greater insight into biological processes of CHD is needed to better understand and improve its diagnosis and treatment. The advent of omics technology such as genomics, transcriptomics, and metabolomics has significantly aided the discovery of novel risk markers, as well as the elucidation of mechanisms related to the etiology and pathogenesis of CHD. Metabolomics is a type of omics data that is understudied for CHD and could provide diagnostic, prognostic, and therapeutic insights [3].
Changes in metabolism could both lead to CHD and be a consequence of the disease itself [4]. At the level of the heart, alterations in cardiac metabolism may have a direct impact on the contractile function [5]. These alterations impact the uptake of the substrates used for biological functions, such as cell growth and regeneration, resulting in different pathologies [6]. Under normal conditions, 60–90% of the energy used by the heart is generated by mitochondrial oxidation of fatty acids, and the remaining is supplied by glucose, lactate, and ketones [6].
CHD patients usually have comorbidities that accelerate the disease progression. Many of these are diseases of metabolic dysfunction, such as diabetes mellitus, dyslipidemia, and obesity, which impact many body organs and tissues, including the liver, skeletal muscle, vasculature, and myocardium [7,8,9]. These comorbidities influence the trajectory of the onset of CHD, but CHD can occur in their absence as well [9].
Previous studies have identified novel CHD risk factors using metabolomic data, but this has mainly been in individuals of European ancestries [10,11,12], and more recently in individuals of African ancestries [13]. CHD is rampant in the Middle East (ME) and Gulf region, especially in young individuals [14]. Metabolomics for CHD has not as yet been studied in ME populations. In this study, we investigated changes in systemic metabolites in CHD using untargeted metabolomics in a large ME cohort collected by the Qatar Cardiovascular Biorepository (QCbio) [14] and the Qatar Biobank (QBB) [15]. We investigated several research questions including: (1) Are there differences in metabolite levels between CHD patients and controls; (2) are there changes in metabolite groups (pathways) that are not by chance and that indicate systematic alterations in the activity level of the pathways; and (3) can multivariate analysis and machine learning models be developed as a metabolite risk score (MRS) to assess predictive performance of CHD using metabolic profiles?

2. Results

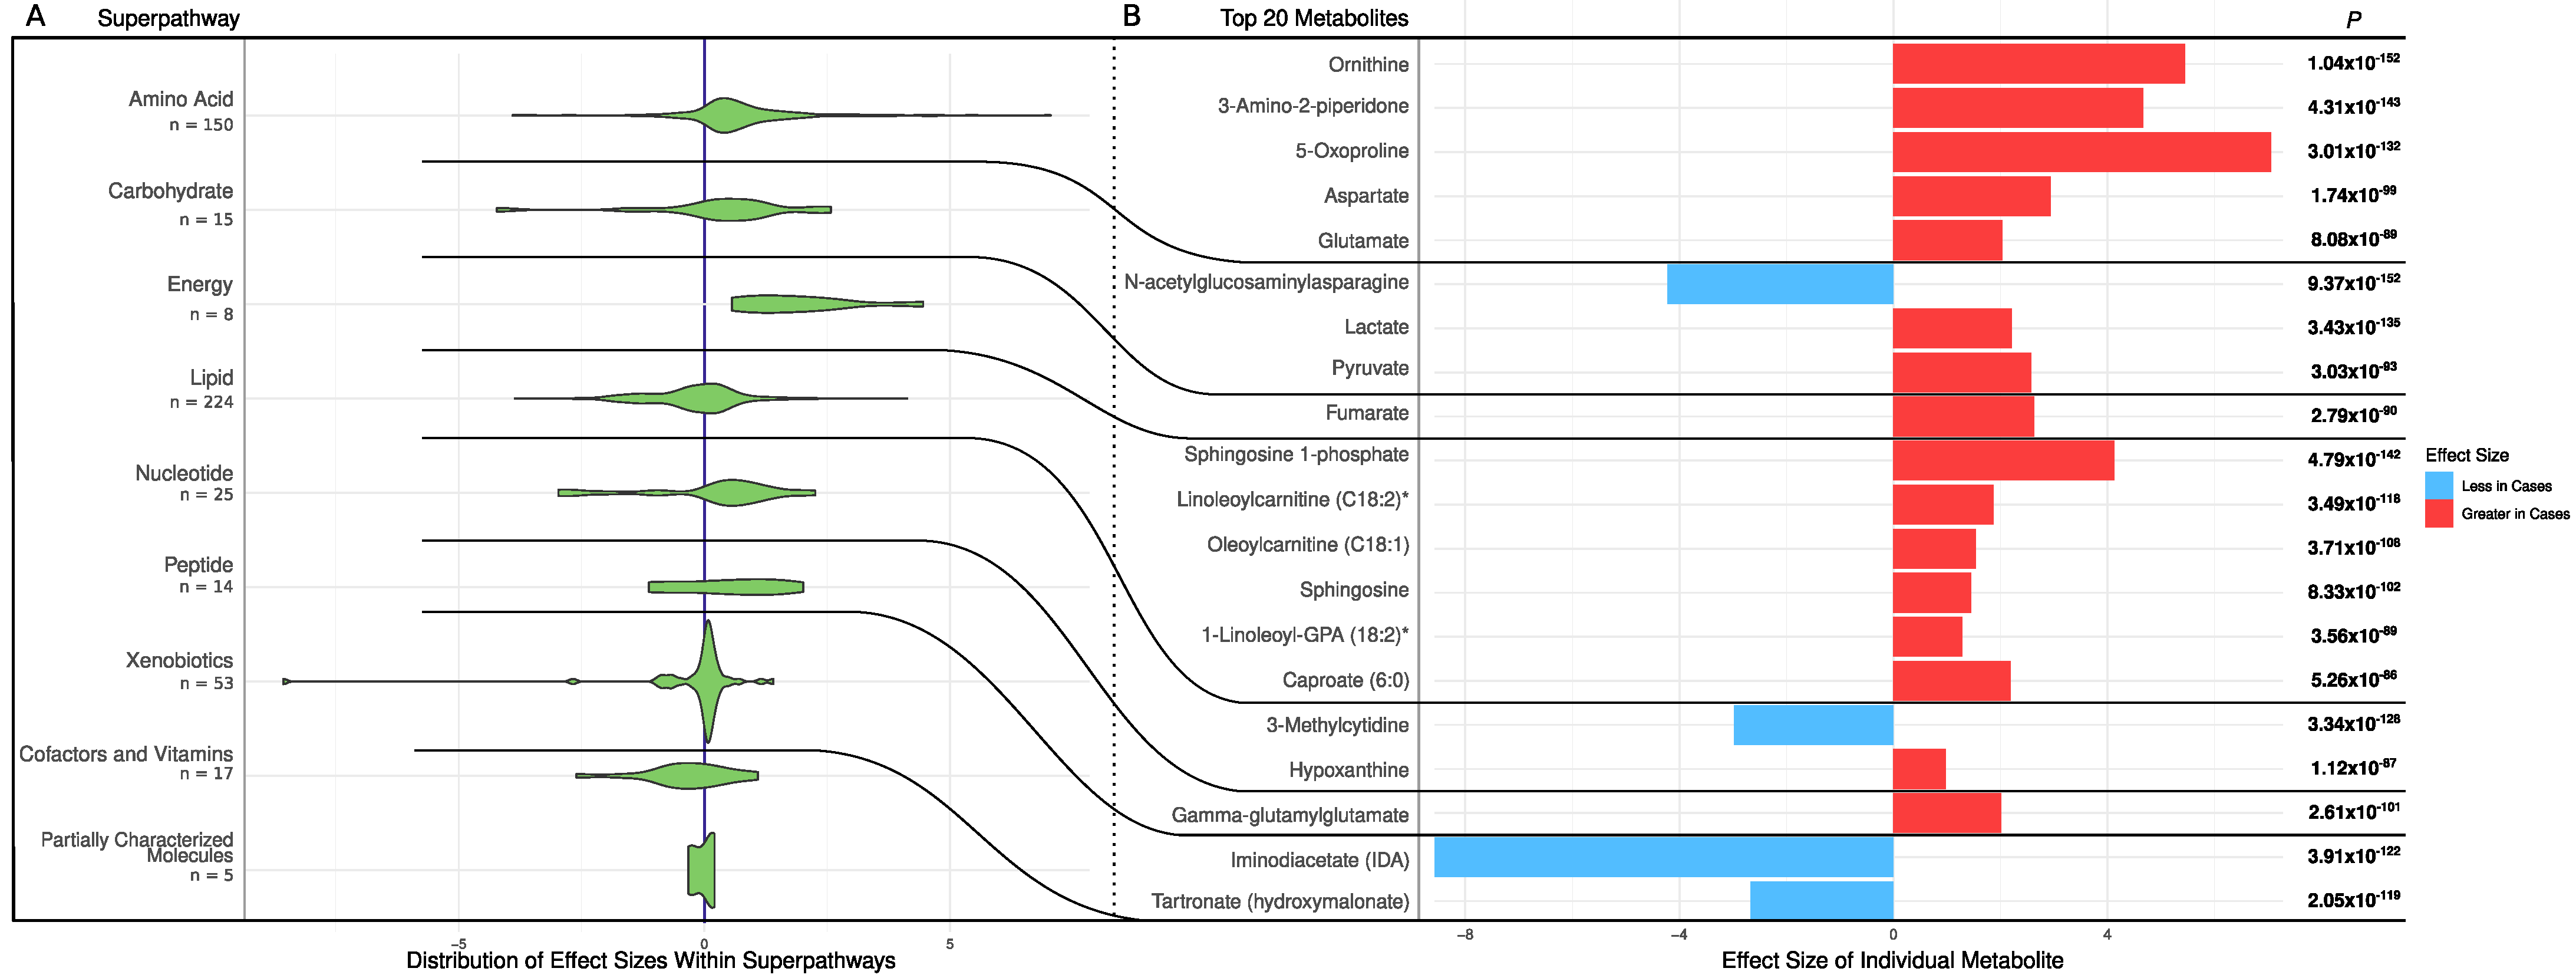
2.1. Univariate Analysis

A total of 511 metabolites were significantly different between the CHD patients and the controls (FDR p < 0.05). Most metabolites (331 out of 511, 65%) were elevated in the CHD cases, including amino acids, carbohydrates, energy-related metabolites, nucleotides, peptides, and xenobiotics (Figure 1A). The 20 most significantly altered metabolites had FDR p < 5.26 × 10−86 and are shown in Figure 1B. Of these, there were five amino acid metabolites (all elevated in CHD), three carbohydrates metabolites (two elevated in CHD), one energy metabolite (elevated in CHD), six lipid metabolites (all elevated in CHD), two nucleotide metabolites (one elevated in CHD), one peptide metabolite (elevated in CHD), and two xenobiotic metabolites (both decreased in CHD) (Figure 1B).

2.2. Pathway Enrichment Analysis

The results of the metabolic pathway enrichment analysis are shown in Table 1 for the 45 most significant pathways with FDR p < 10−300. The enriched pathways included D-arginine and D-ornithine metabolism (enrichment ratio (ER) = 760.0); glycolysis (ER = 572.2); arginine and proline metabolism (ER = 441.3); oxidation of branched chain fatty acids (ER = 429.3); sphingolipid metabolism (ER = 341.8); and valine, leucine, and isoleucine degradation (ER = 328.1). In the following sections, pathways of relevance in CHD have been highlighted.

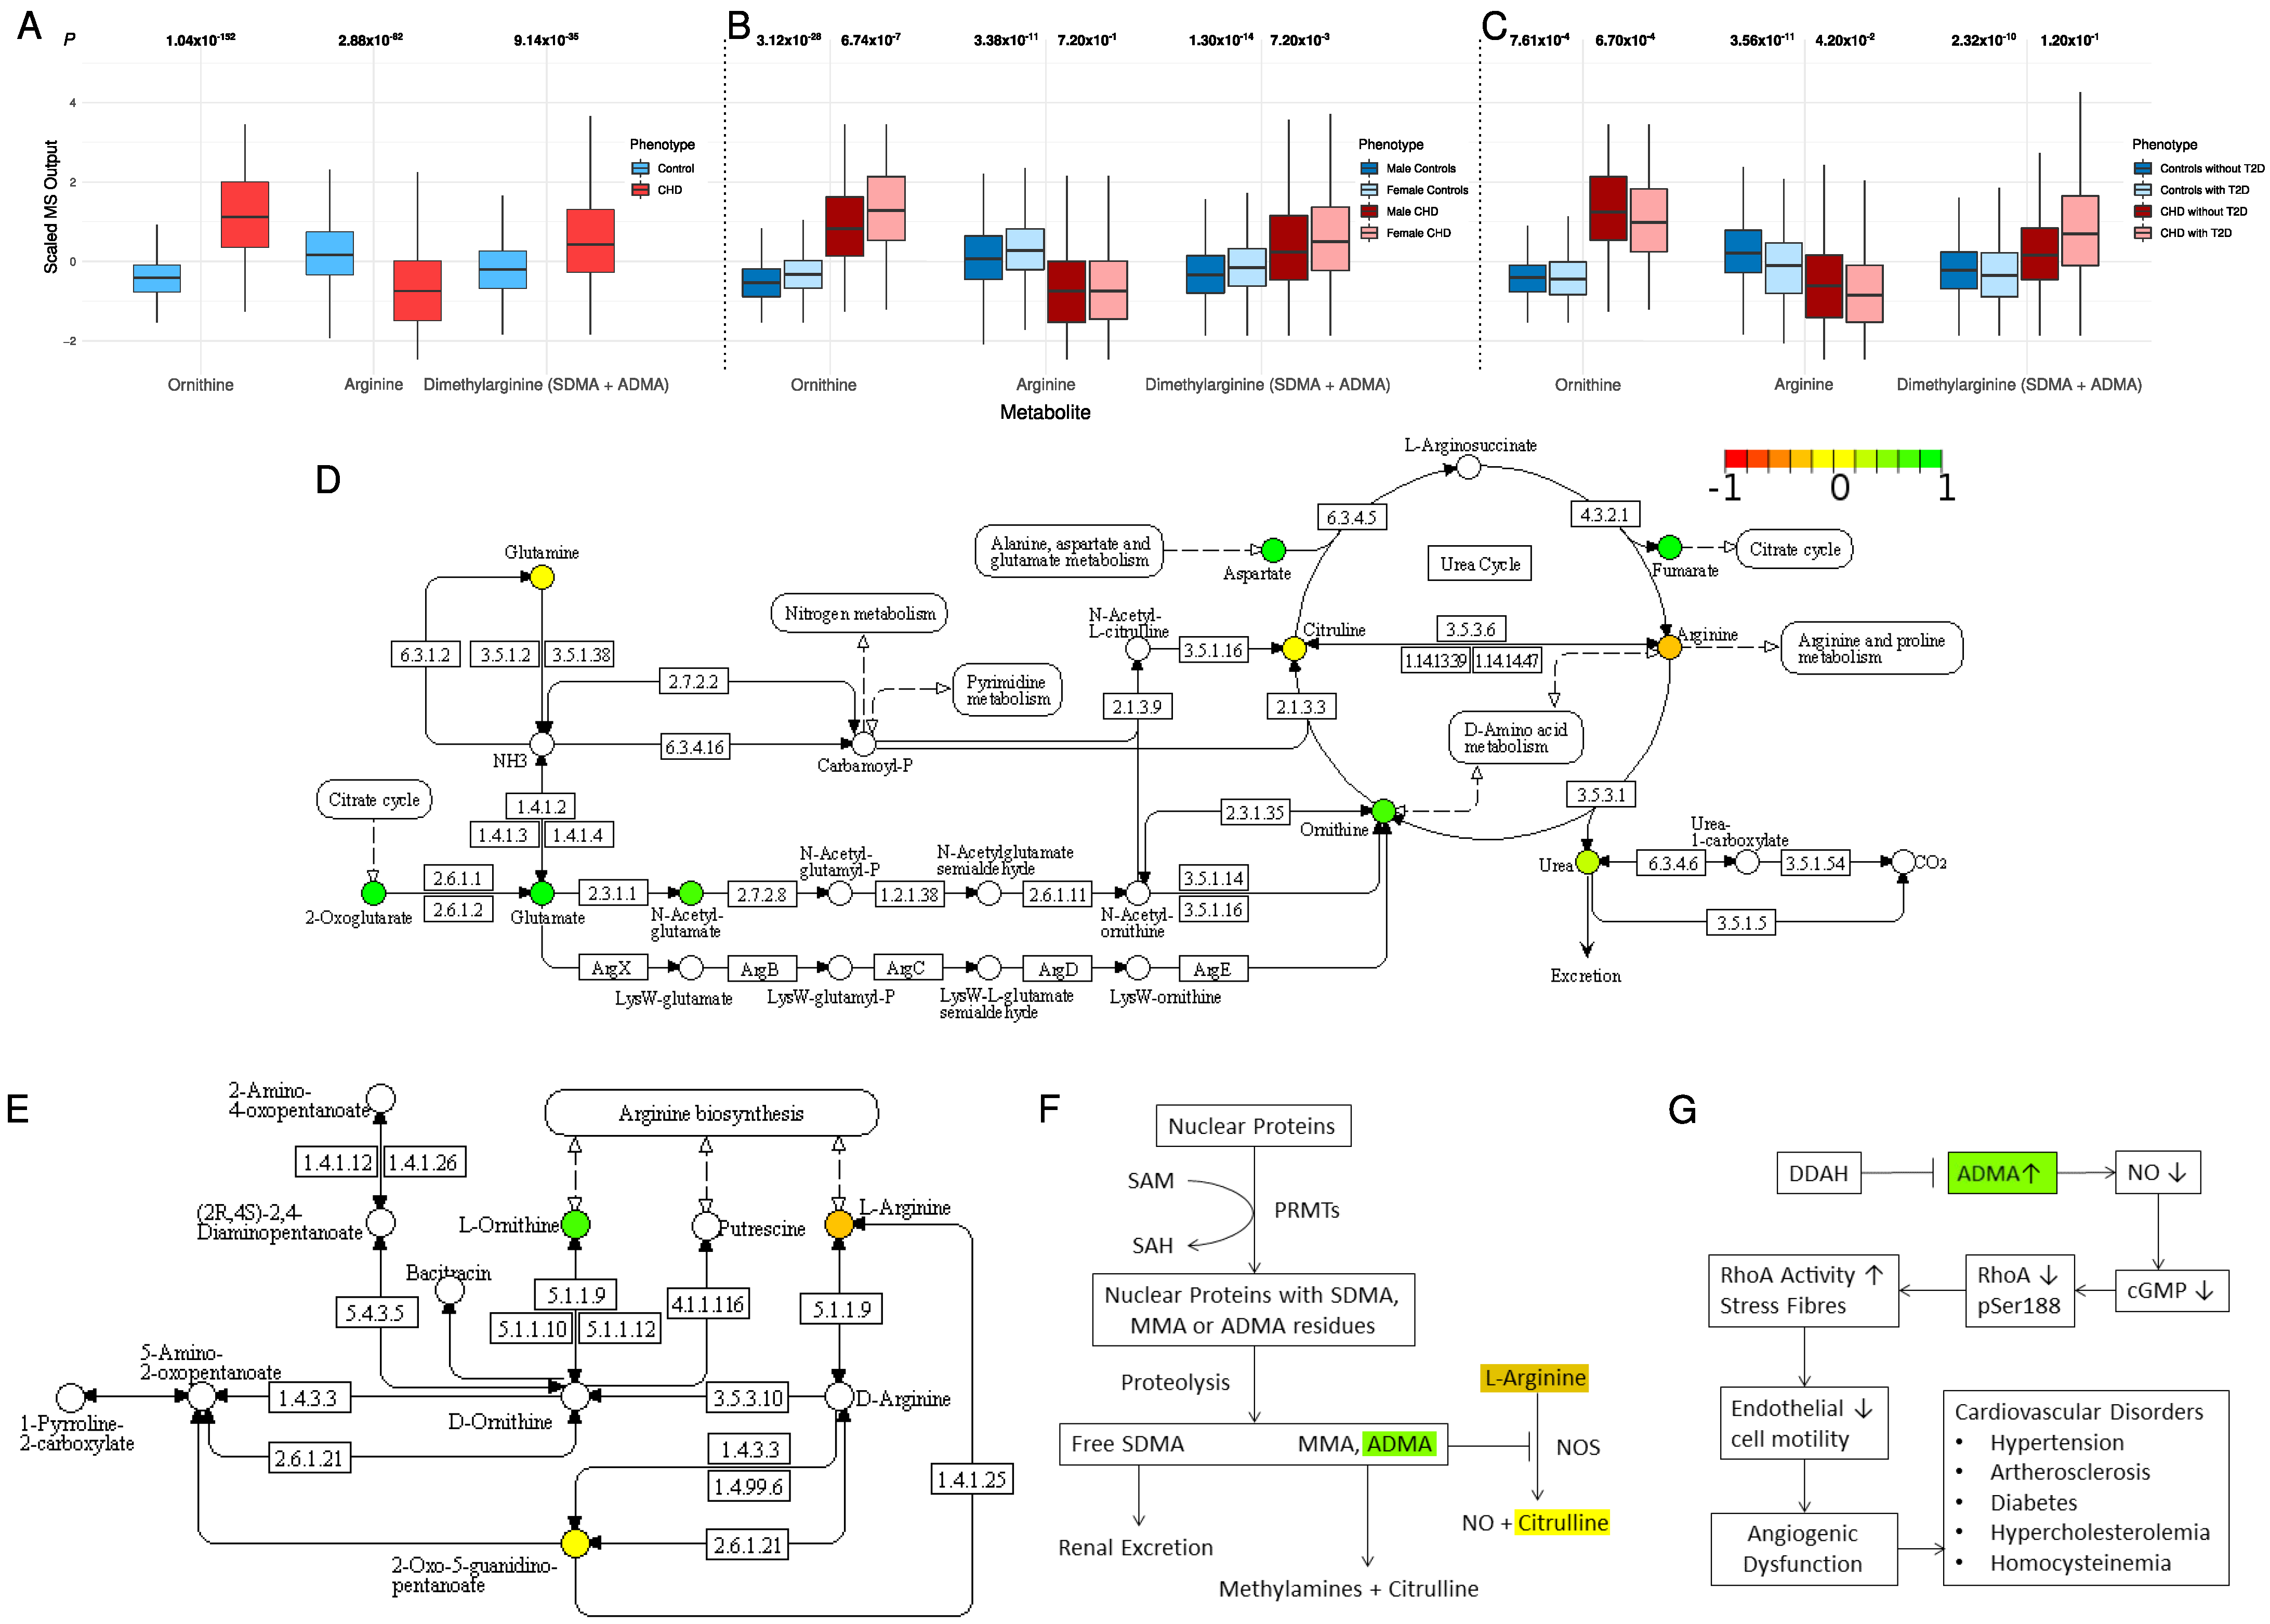
2.3. Alternation in Arginine and Ornithine Metabolism and Synthesis

In the D-arginine and D-ornithine metabolism pathway (the second most-enriched pathway; Table 1), we observed a lower concentration of arginine in CHD (FDR p = 2.88 × 10−82) and higher concentrations of both ornithine (p = 1.04 × 10−152) and total dimethylarginine (symmetric and asymmetric, i.e., SDMA, ADMA; p = 9.14 × 10⁻³⁵) (Figure 2A). L-arginine is metabolized by two competing pathways (Figure 2D–G). In the first pathway, nitric oxide synthase (NOS) converts L-arginine to nitric oxide (NO) and citrulline. This is catalyzed by endothelial nitric oxide synthase (eNOS) (EC 1.14.13.39). In the second pathway, L-arginine is the substrate of arginase (EC 3.5.3.10) that produces ornithine and urea. Within cases, the metabolite concentration of ornithine was approximately twice the concentration of arginine (ornithine-to-arginine ratio (OAR) = mean concentration of ornithine divided by mean concentration of arginine = 1.94). Within the controls, however, an opposite trend was observed (OAR = 0.89), indicating a shift in arginine metabolism for higher production of ornithine. The reduced production of NO may be attributed in part to the higher inhibitory effect of ADMA (in CHD patients) on nitric oxide synthase (Figure 2F,G).
Stratifying the analysis by sex, a gender difference was observed for ornithine concentration in both the CHD and the control groups (p = 3.12 × 10⁻²⁸ and 6.74 × 10⁻⁷, respectively; Figure 2B). Arginine concentration was similar between females and males in the CHD group (p = 0.72), but female controls had higher concentrations of arginine than male controls (p = 3.38 × 10⁻¹¹). Females in both the CHD and the control groups had higher concentrations of dimethylarginine than males (p = 0.0072 and 1.3 × 10⁻¹⁴, respectively; Figure 2B). The OAR was 2.01 in CHD males and 1.83 in CHD females. These ratios indicate a shift in arginine metabolism for higher production of ornithine in male patients compared with female patients.
Stratifying the analysis by type 2 diabetes (T2D), we observed that concentrations of arginine and ornithine were significantly lower in subjects with T2D compared with subjects without T2D (Figure 2C). This indicates less availability of arginine to produce NO, which is a key component for vascular function as well as homeostasis. Interestingly, the concentrations of dimethylarginine were higher in the CHD patients who had T2D than in the CHD patients without T2D, although the difference was not statistically significant (p = 0.12), most likely because of the high data variability and small sample size. The opposite trend was observed in the controls at statistical significance (p = 2.32 × 10⁻¹⁰). This supports the hypothesis of the lower production of NO in CHD patients with T2D by inhibiting nitric oxide synthase. The OAR was 0.88 in controls without T2D, 0.98 in controls with T2D, 1.96 in CHD cases without T2D, and 1.92 in CHD cases with T2D (Figure 2C). These ratios indicate a higher production of ornithine in controls with T2D compared with the controls who do not have T2D.

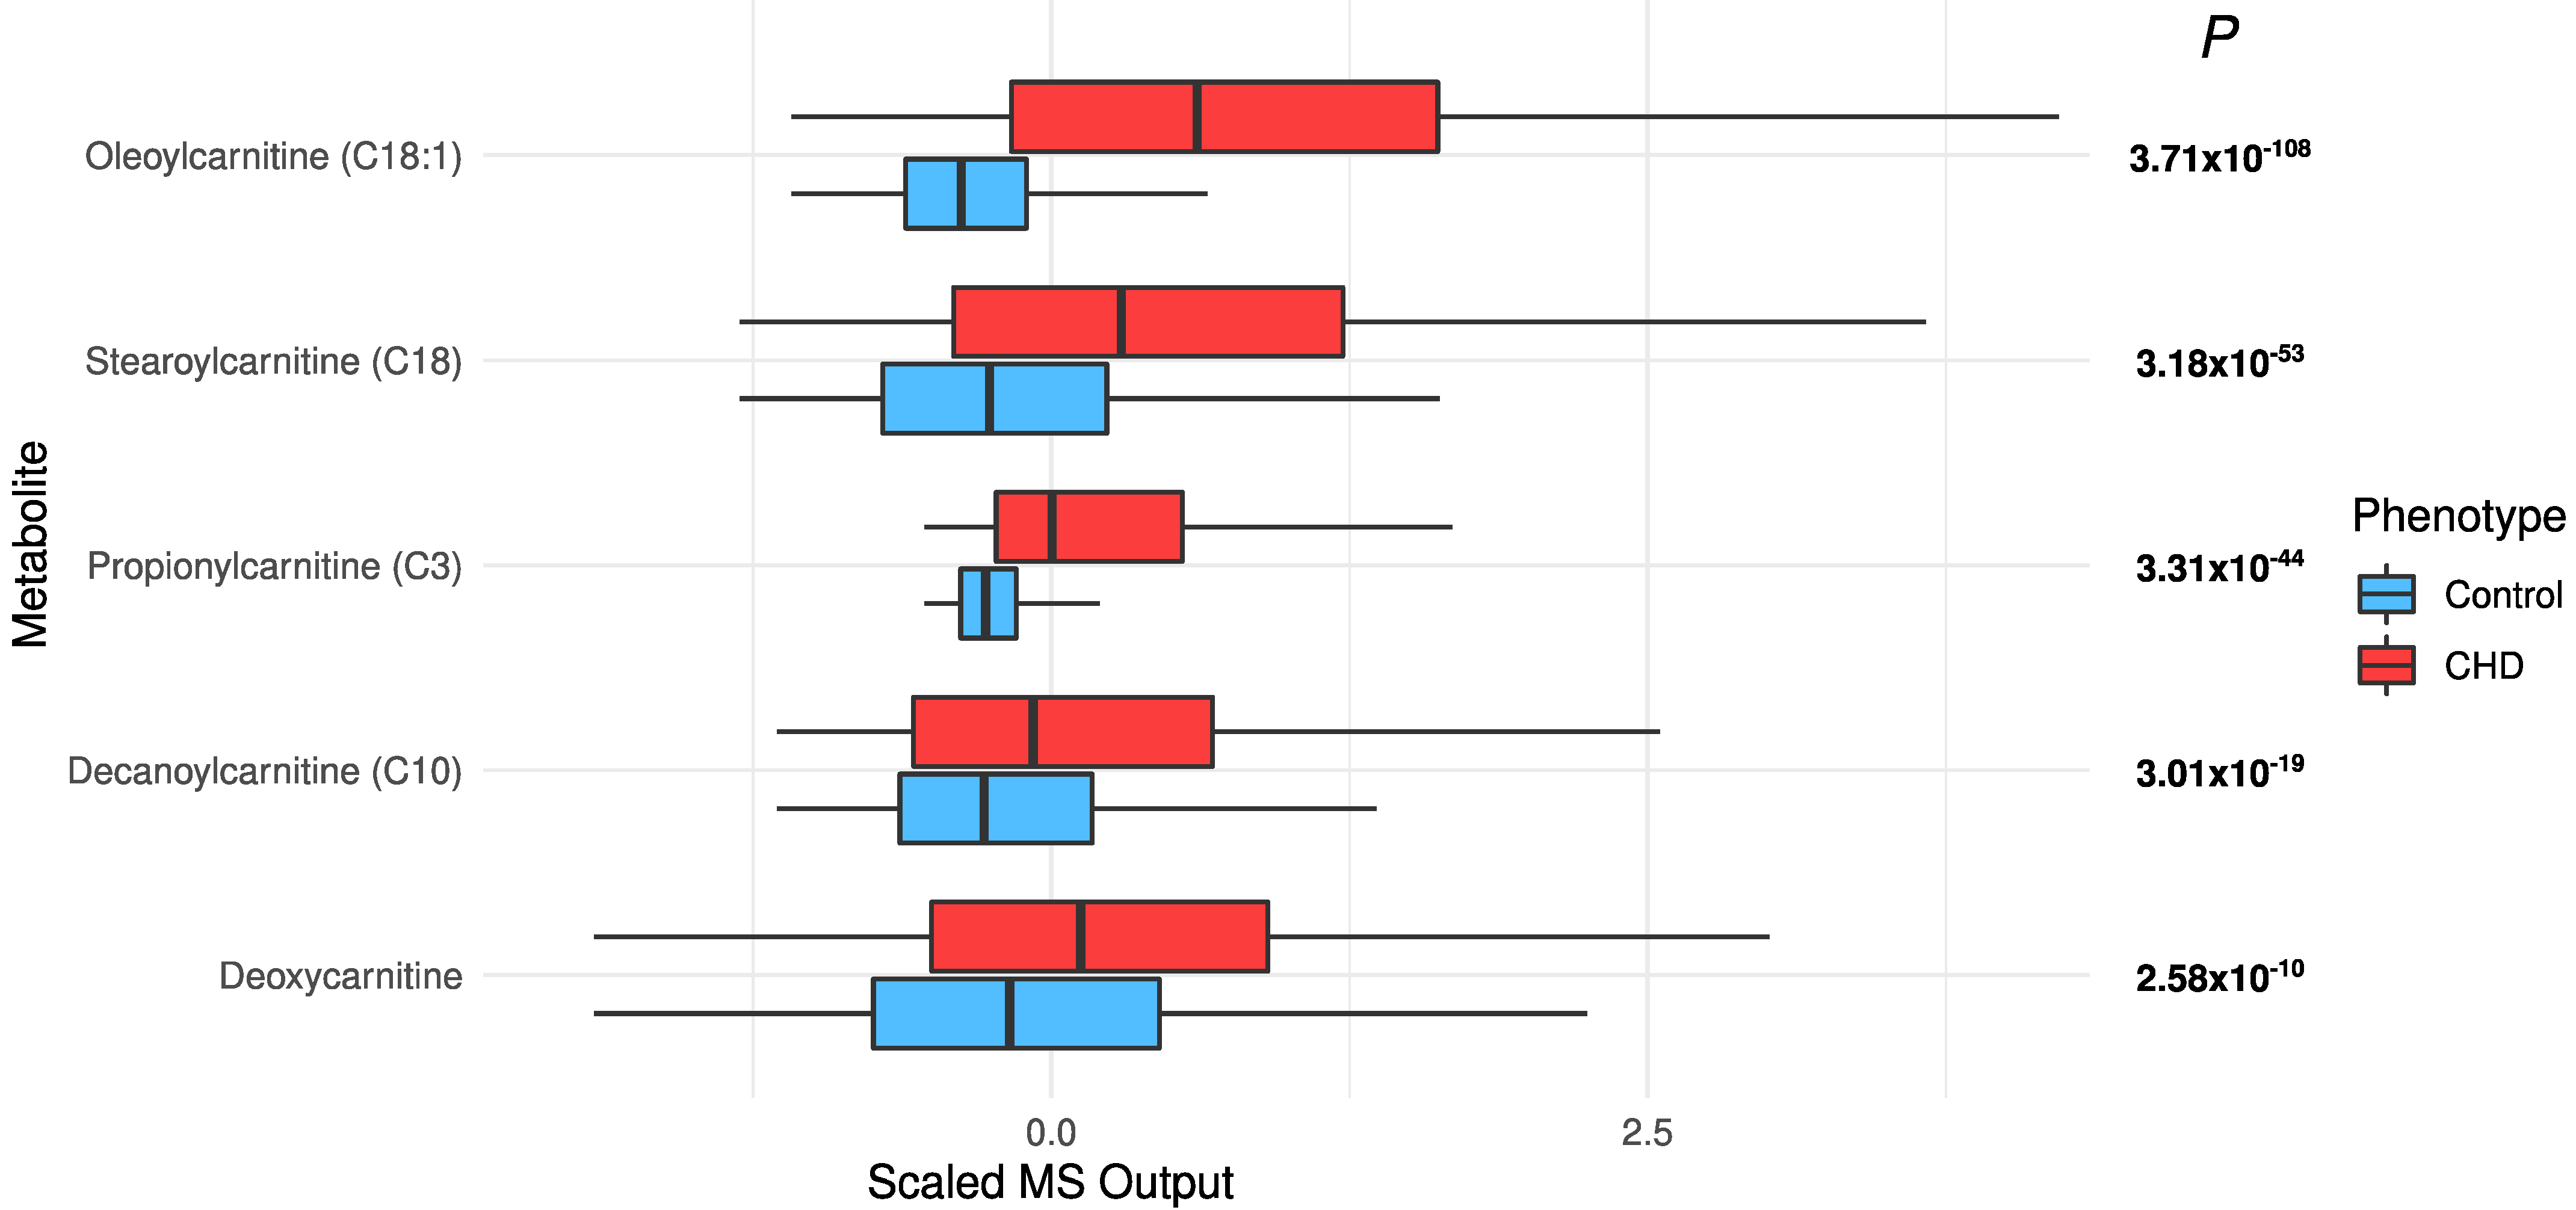
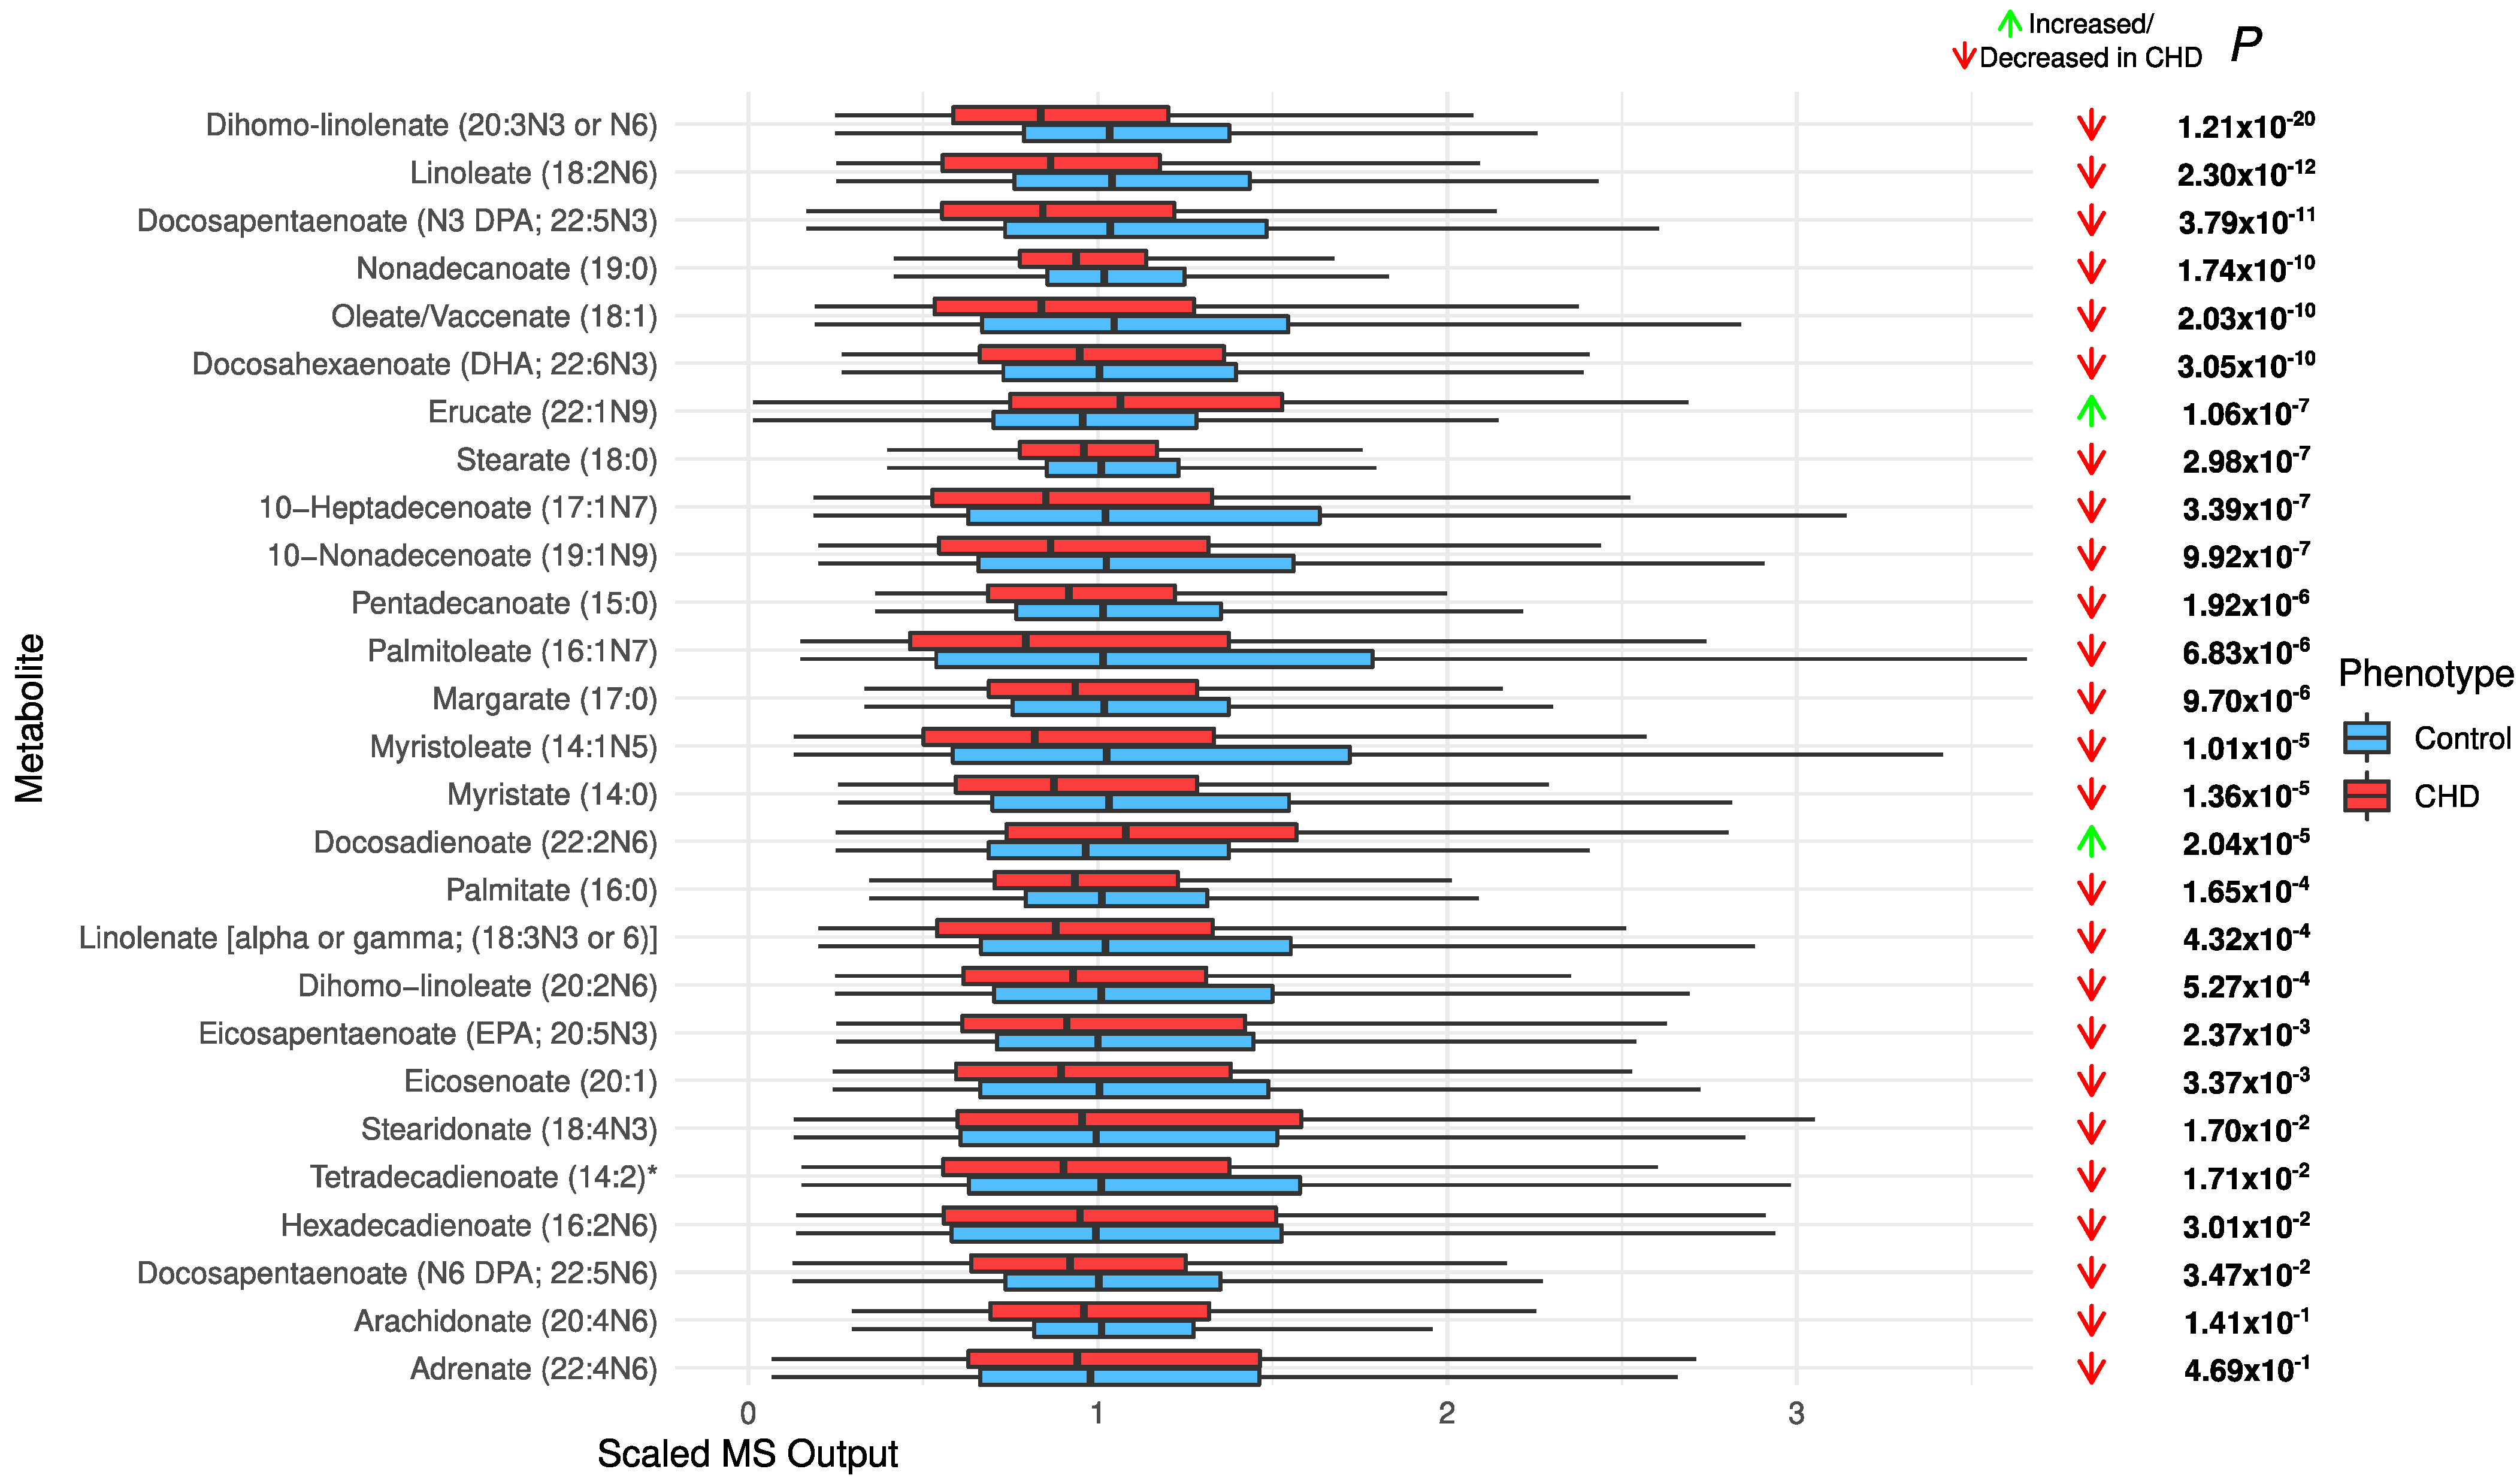
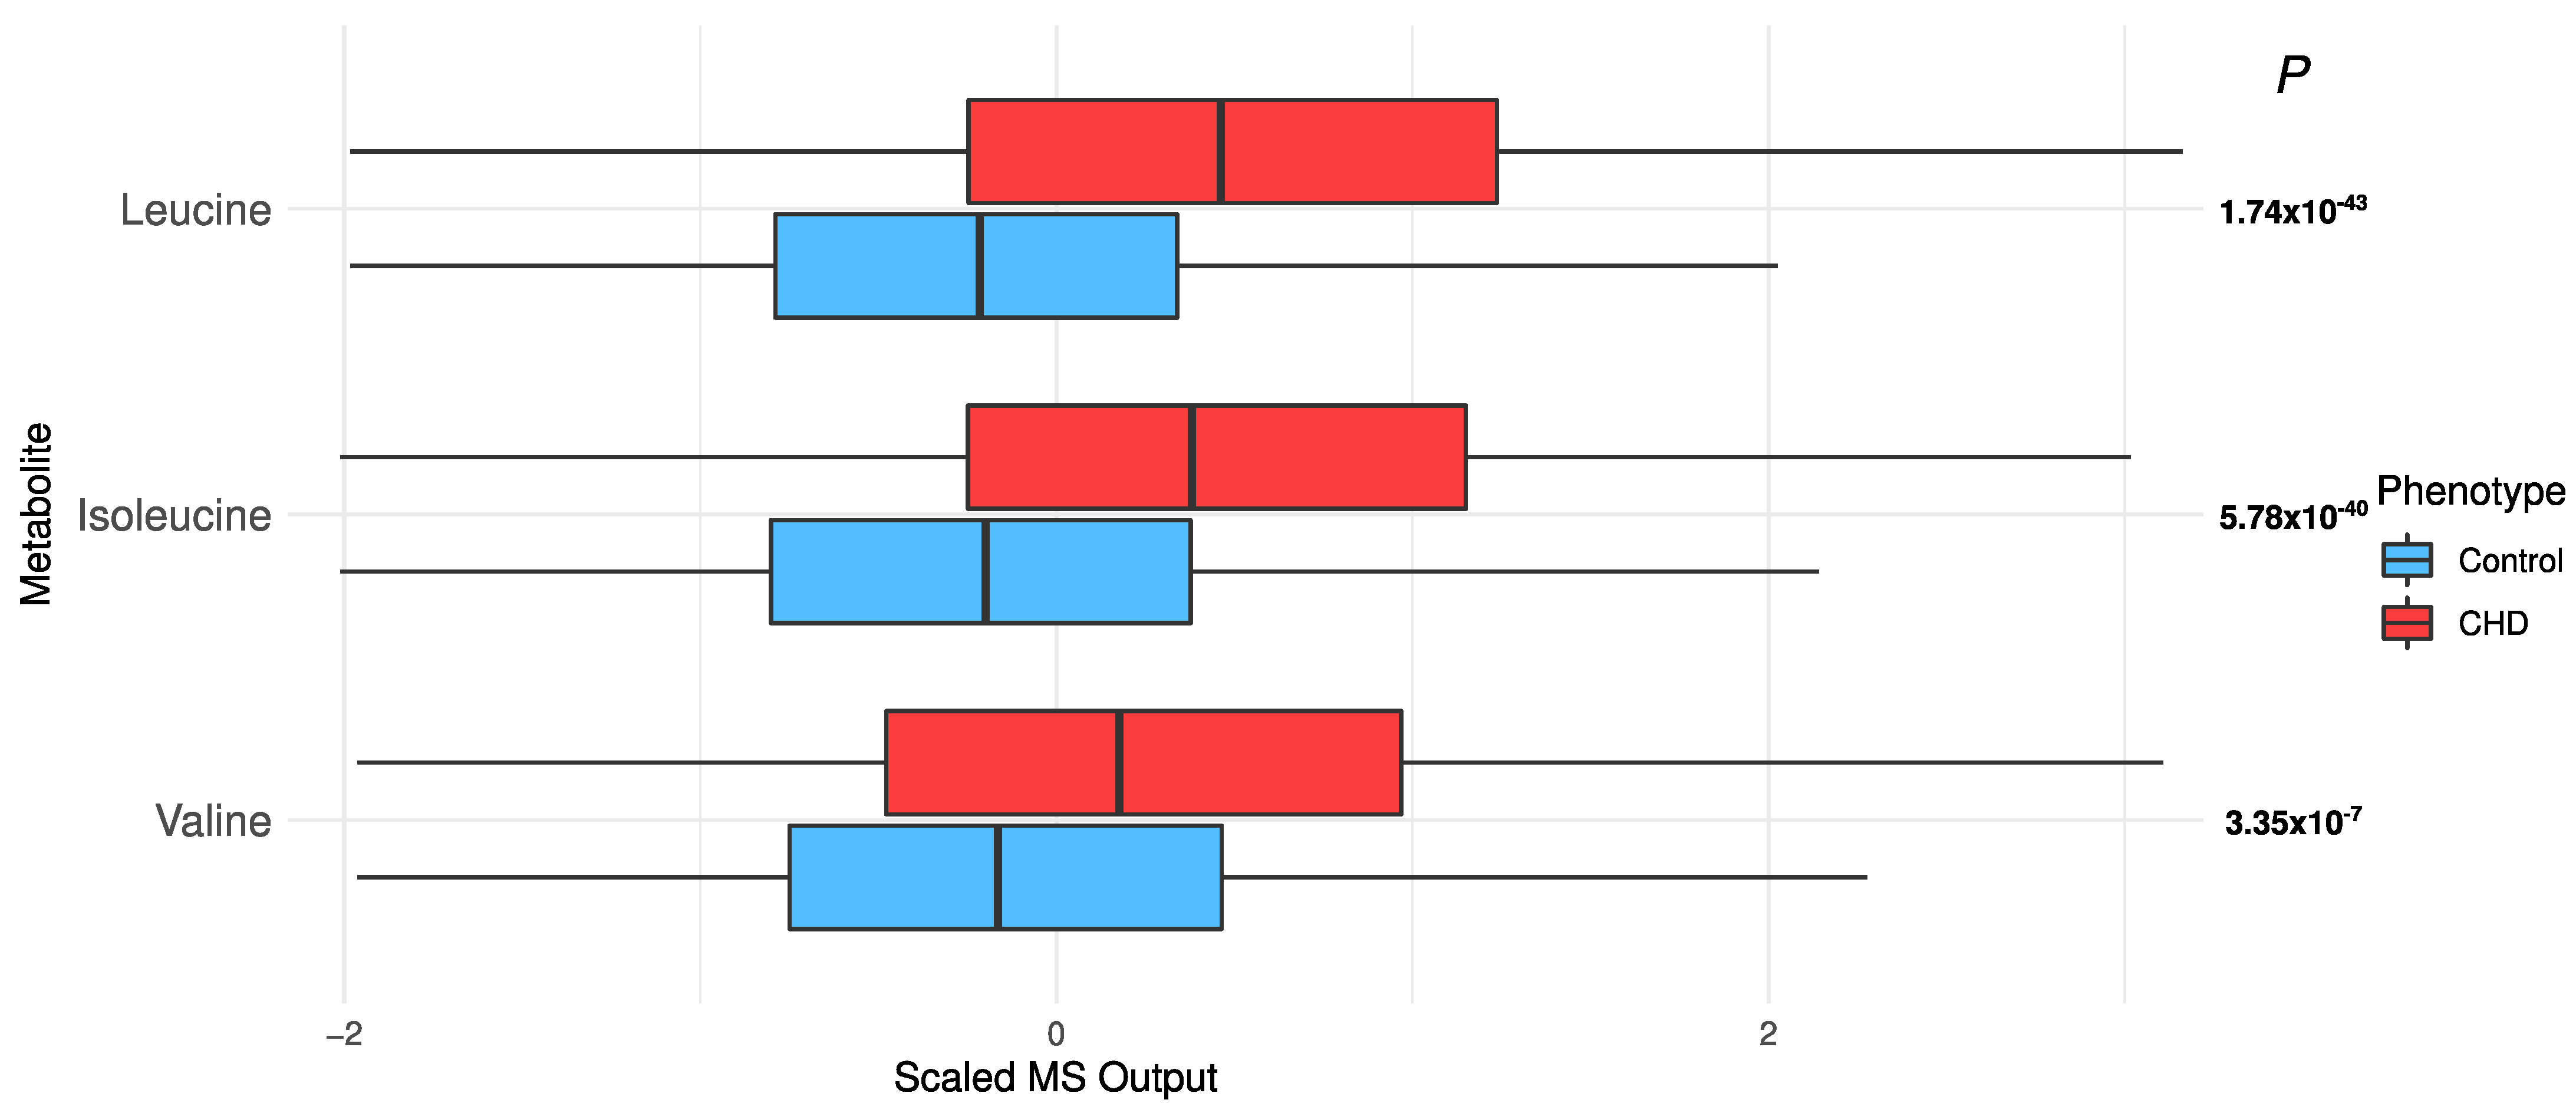
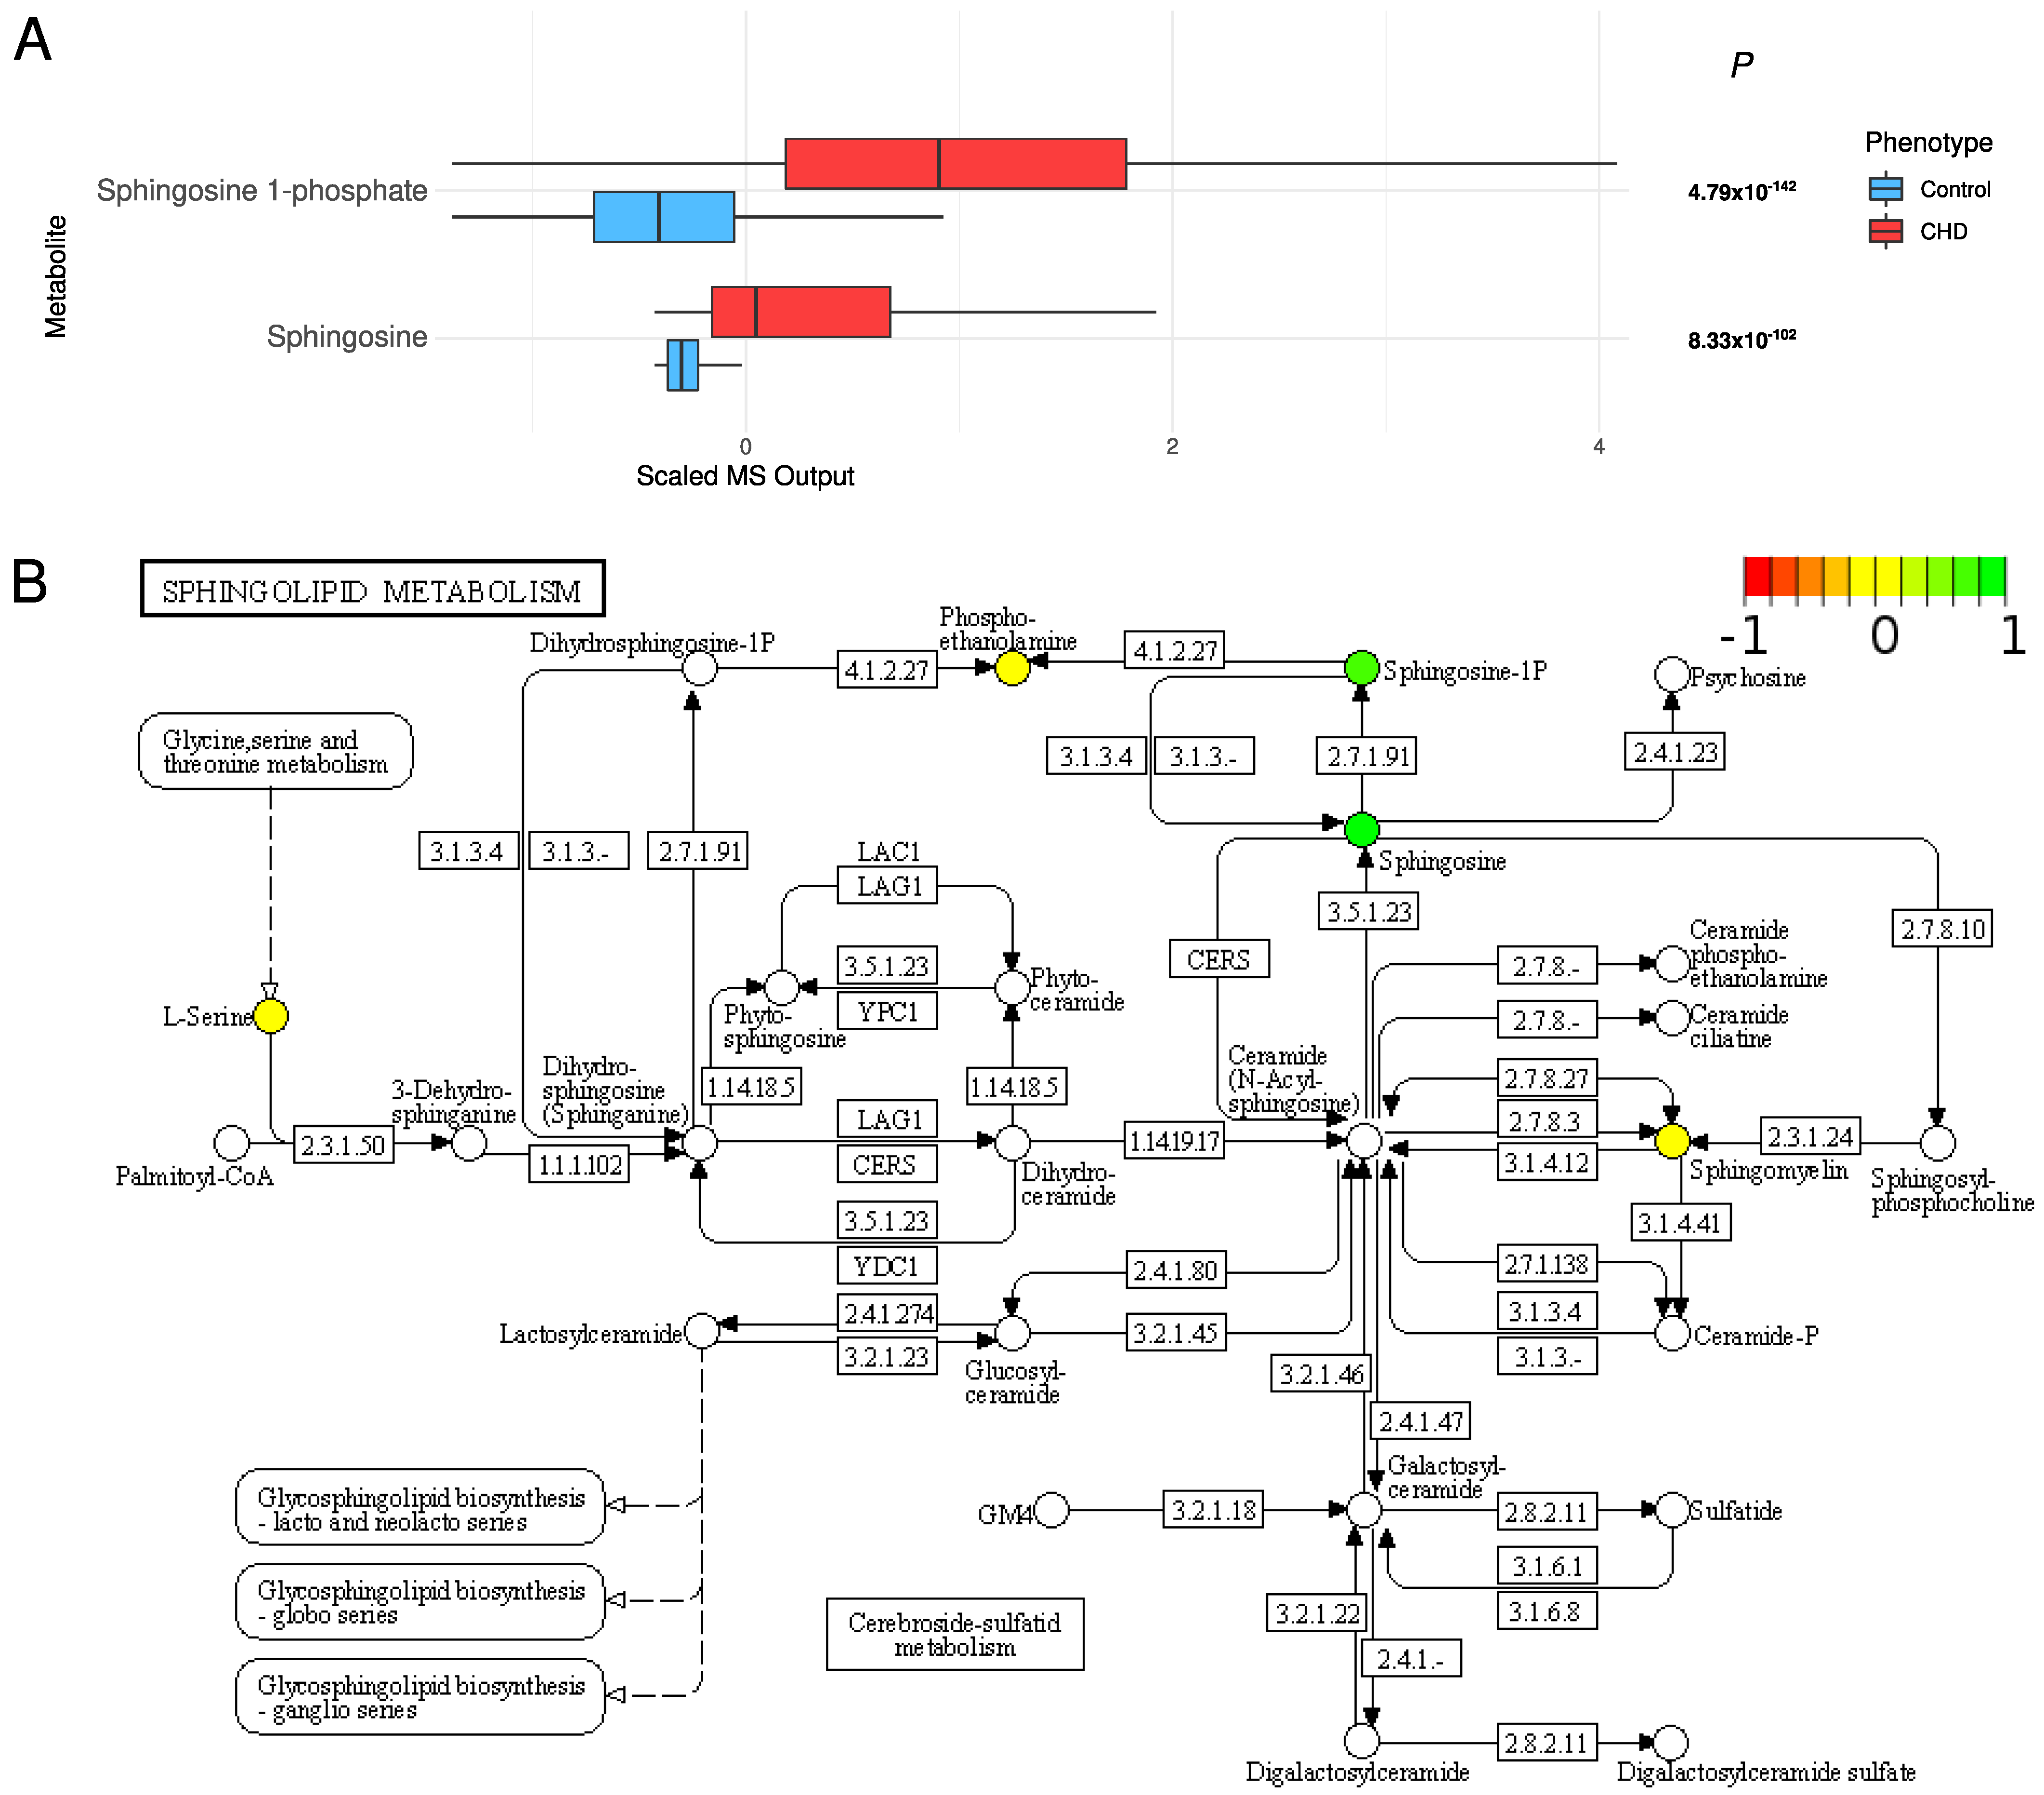
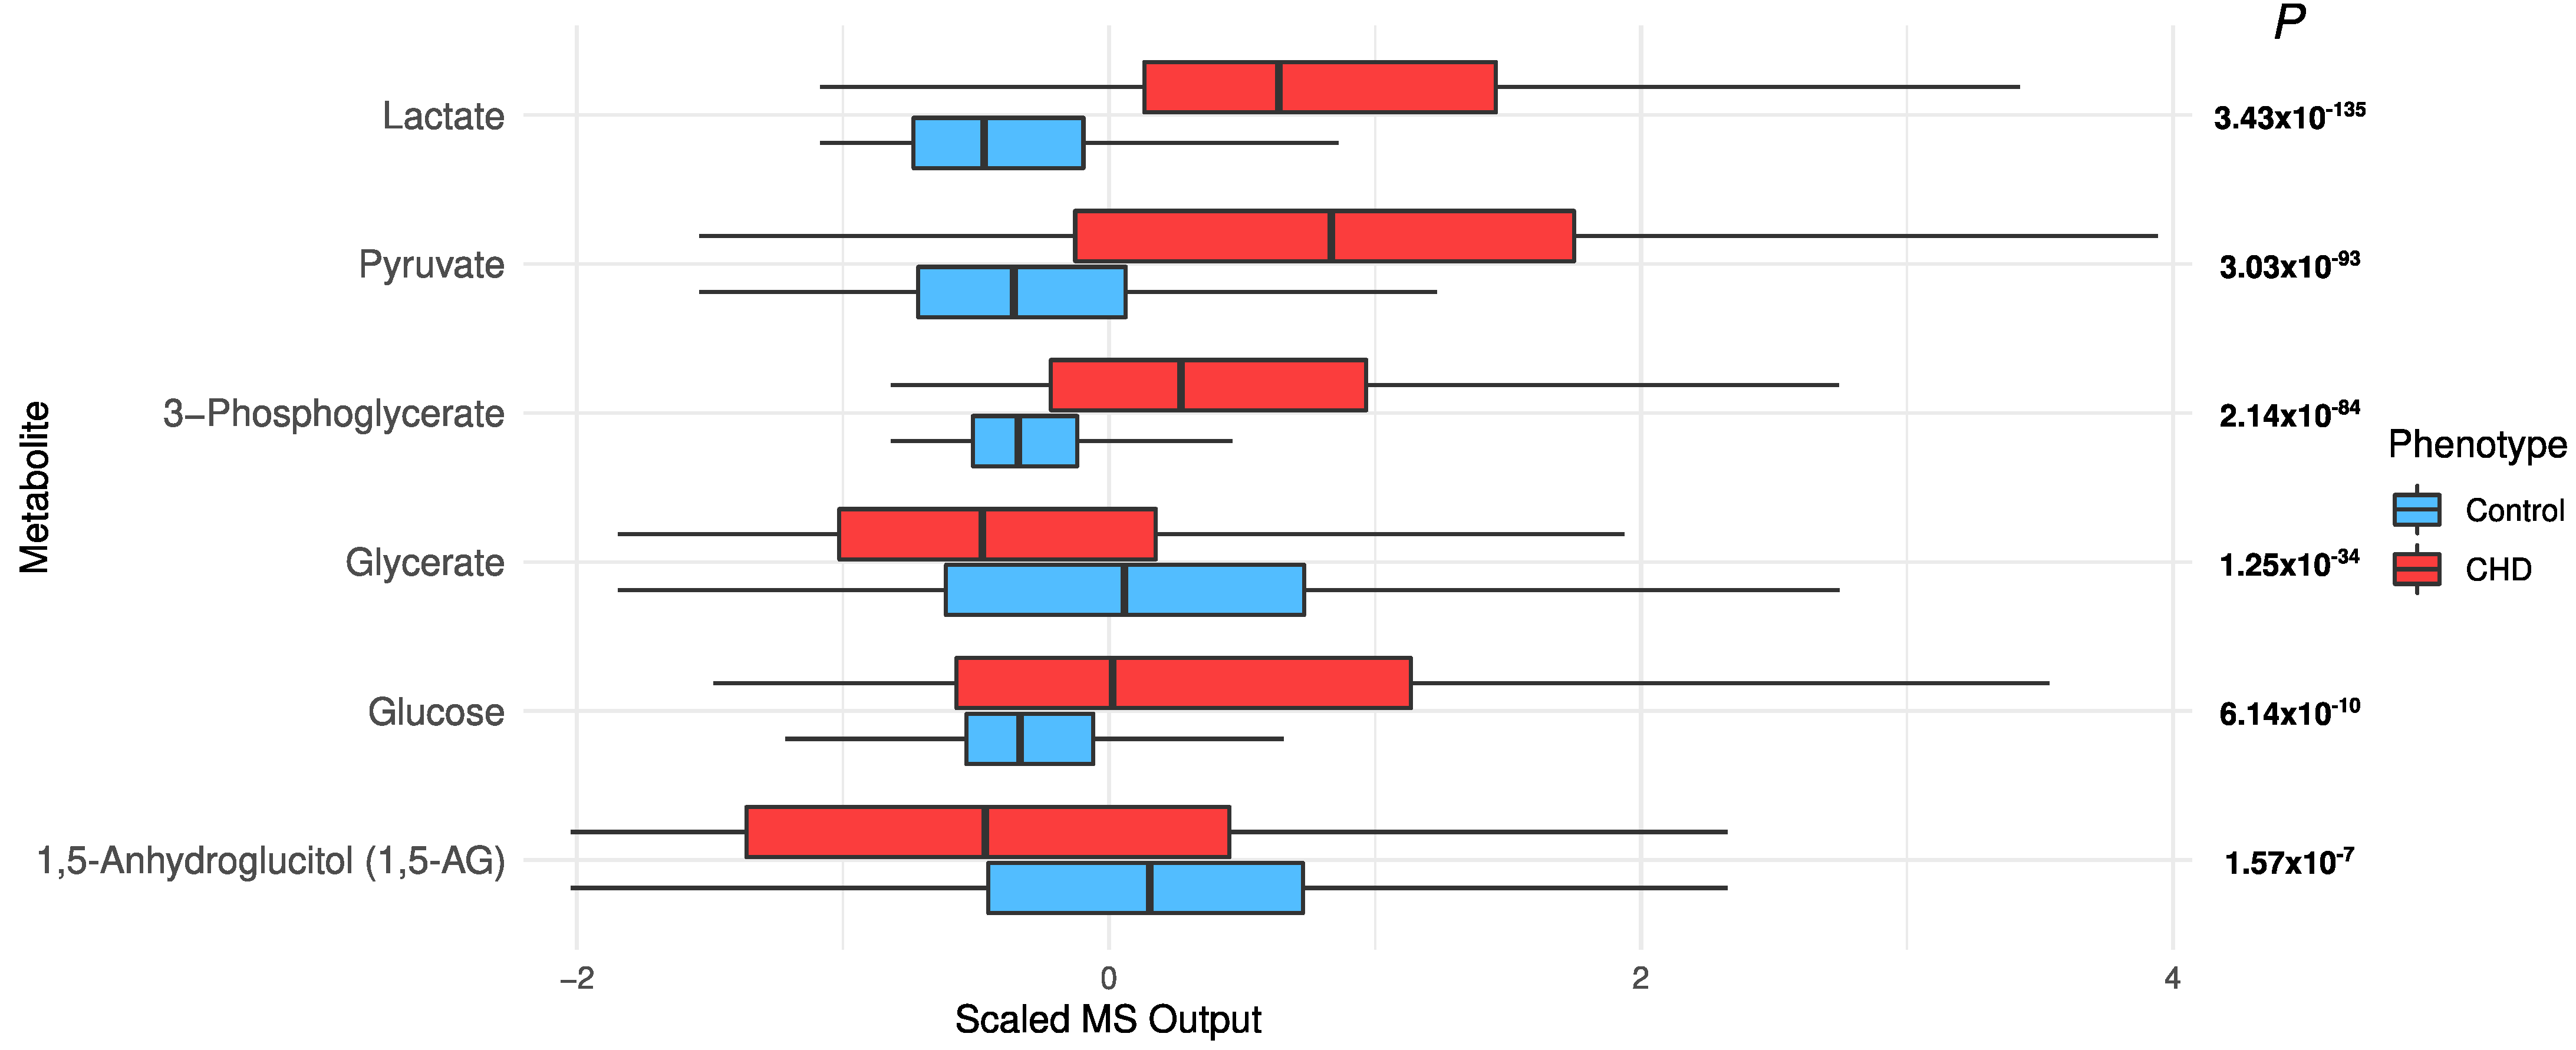
2.4. Changes in Acylcarnitines, Branched Chain Amino Acids, Sphingolipids, and Sugar Metabolisms

Increased acylcarnitines and decreased long-chain fatty acids in CHD: All significant acylcarnitines were elevated in the CHD patients: oleoylcarnitine (C18:1) (FDR p = 3.71 × 10−108), stearoylcarnitine (C18) (FDR p = 3.18 × 10−53), propionylcarnitine (C3) (FDR p = 3.31 × 10−44), decanoylcarnitine (10) (FDR p = 3.01 × 10⁻¹⁹), and deoxycarnitine (FDR p = 2.58 × 10⁻¹⁰) (Figure 3). The most significant long-chain fatty acids (23 out of 25) were decreased in CHD (Figure 4). This may be attributed to their conversion to acylcarnitines, which were increased in CHD.
Elevated branched chain amino acids (BCAAs): BCAAs, i.e., leucine, isoleucine, and valine, were significantly elevated in the CHD patients (leucine, p = 1.74 × 10−43; isoleucine, p = 5.78 × 10−40; and valine, p = 3.35 × 10⁻⁷; Figure 5).
High concentrations of sphingolipids: Sphingolipids were significantly increased in the CHD patients: sphingosine 1-phosphate (S1P) (FDR p = 4.79 × 10−142) and sphingosine (FDR p = 8.33 × 10−102) (Figure 6).
Sugar metabolism: All six “glycolysis, gluconeogenesis, and pyruvate metabolism” metabolites were significantly different, with FDR p ≤ 8.25 × 10⁻⁸ (Figure 7). Lactate (p = 3.43 × 10−135), pyruvate (p = 3.03 × 10−93), and glucose (p = 6.14 × 10⁻¹⁰) were higher in cases than controls (Figure 7). After adjusting for T2D, age, sex, and BMI in the univariate model, glucose and 1,5-anhydroglucitol (1,5-AG) were not significant (p = 0.35 and 0.5, respectively), but the remaining metabolites remained very significant (p ≤ 3.77 × 10⁻³²; data not shown).

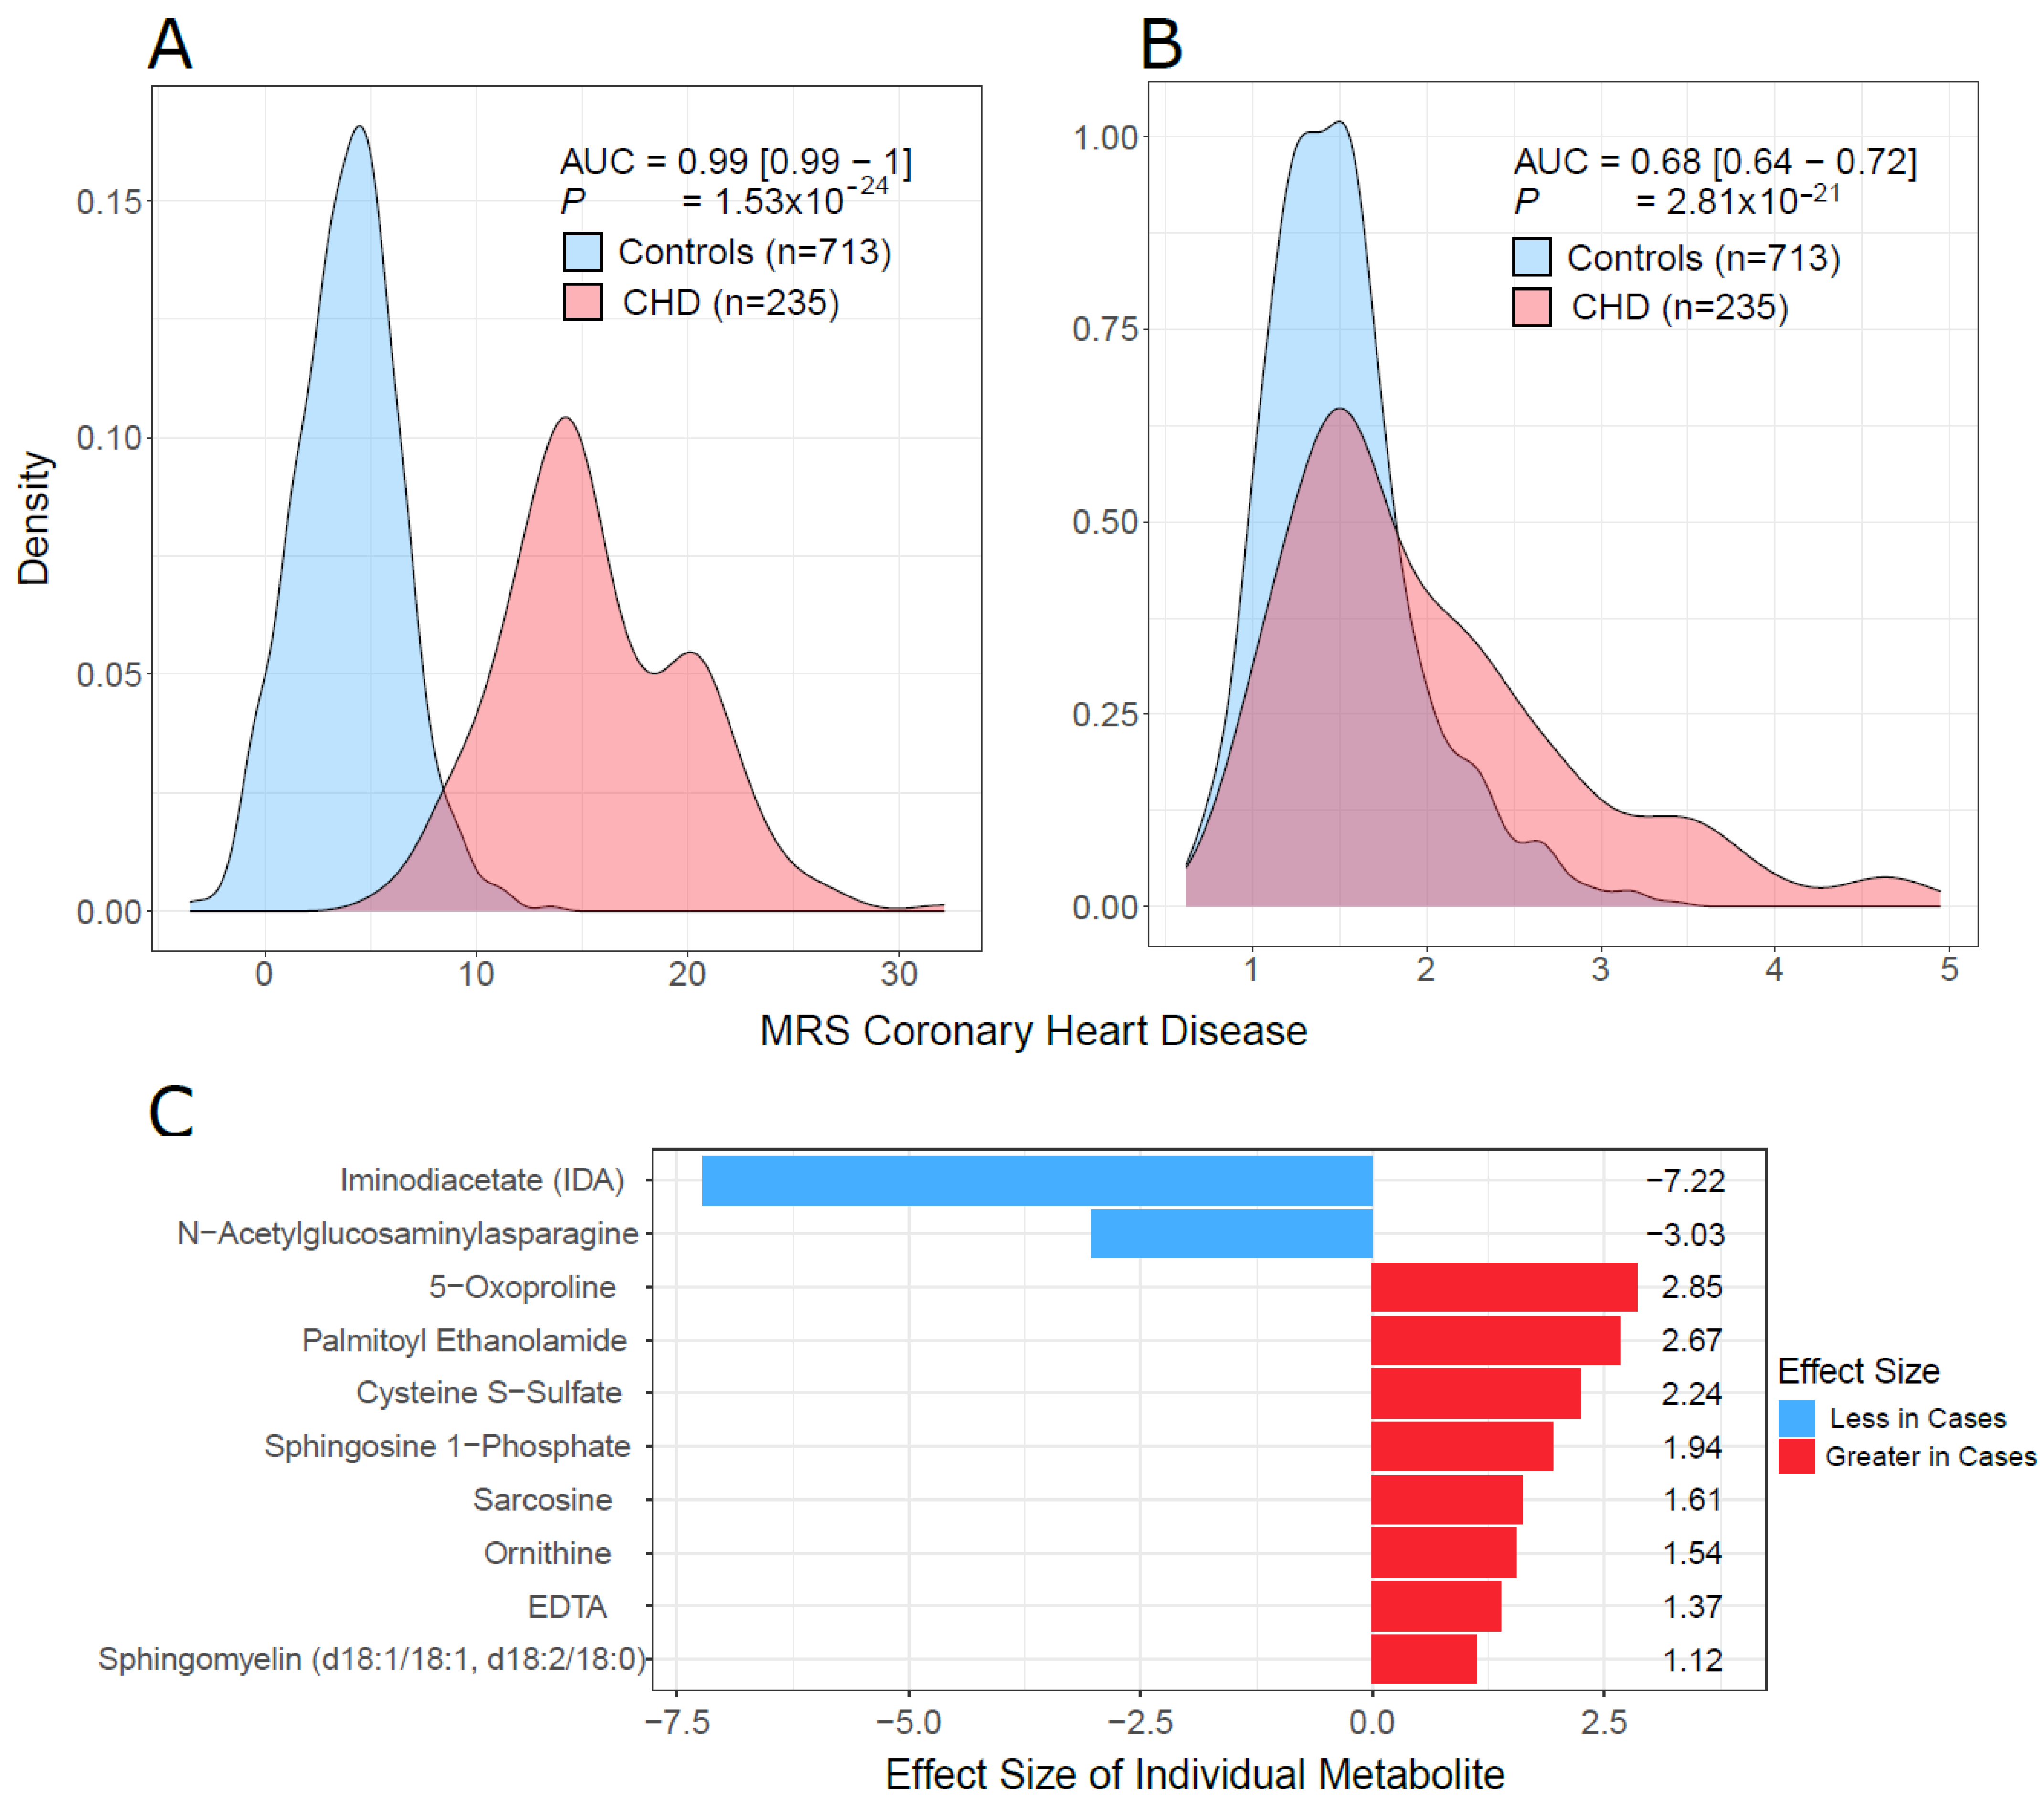
2.5. Multivariate Analysis and Predictive Model

The random forest (RF) models on the test set yielded area under the receiver operator curve (AUC) values of 0.97 and 0.98 using the full model, i.e., A (641 metabolites), and the reduced model, i.e., B (17 metabolites), respectively. The accuracies of models A and B were 98.5% and 98.7%, respectively. The mean decrease in accuracy (variable importance) of the random forest model trained on all metabolites is shown in Supplementary Figure S2. The AUCs for males and females were 1.0 and 0.97, respectively, indicating that the performance of the RF model is consistent for females and males (data not shown). Using the LASSO approach on the training data, we built a metabolite risk score using the 107 metabolites with non-zero coefficients (MRS107) (Supplementary Figure S3). MRS107 discriminated CHD patients and controls in the test data with AUC of 0.998. A reduced MRS, MRS10, was also built on 10 metabolites with the highest LASSO coefficients selected based on the knee point (Supplementary Figure S3). MRS10 performance was similar to that of MRS107, and the AUC did not decrease much (AUC = 0.99, 95% CI [0.99–1], p = 1.53 × 10⁻²⁴; Figure 8A, Supplementary Figure S3). We tested the model developed by Wang et al. [13] on our test data. The performance was worse, and the AUC was much smaller (AUC = 0.68, 95% CI [0.64–0.72], p = 2.81 × 10⁻²¹; Figure 8B). The metabolites in MRS10 and their LASSO effect sizes are shown in Figure 8C. We investigated the predictive performance of MRS10 for samples with T2D by removing all the subjects in the test set who did not have T2D. AUC was 0.99, indicating that the predictive performance of our model on T2D is as good as its performance on the overall dataset.

3. Discussion

This is the first study that has investigated the metabolic profile and its impact on CHD in a large case-control cohort from the Middle East, using an untargeted metabolomics approach. Our results provide strong evidence that many circulating metabolites and metabolic pathways are altered in CHD patients. The results also showed that a small panel of metabolites can efficiently discriminate CHD cases and controls and can therefore be used as a diagnostic/predictive tool. In this study, we confirm known metabolites that are associated with CHD, identify novel ones, and provide insights into some underlying biological mechanisms for CHD.
Ornithine and arginine were significantly associated with CHD. The ornithine concentration in the CHD patients was twice the concentration of arginine, unlike in the controls, in whom arginine was higher. As arginine is the only physiological substrate for NOS-mediated generation of NO [16,17], our results indicate a reduced bioavailability of NO in CHD patients. NOS and arginase compete for a common substrate, L-arginine. As NOS is the only known producer of NO [17], competition for its substrate through increased arginase activity is likely to lead NOS being substrate starved. This has been observed in other non-metabolomics studies [18,19,20,21]. A higher concentration of the NOS antagonist ADMA also contributes to inhibition of NO production. Moreover, increased activity of arginase is also found in diabetes [22,23], and inhibition of arginase is found to improve endothelial function [24,25]. Diminished NO bioactivity may cause constriction of coronary arteries during exercise or during mental stress and could contribute to the provocation of myocardial ischemia in patients with CHD [26]. Thus, it could be a potential target for cardiovascular treatment. In addition, our results showed a lower concentration of arginine in T2D subjects, both in controls and in CHD patients. Male controls showed lower levels of arginine than female controls, which may be associated with the lower CHD prevalence in females.
Our analysis has revealed increased concentrations of acylcarnitines, which is associated with many heart problems such as CHD [11,27,28]. Long-chain fatty acids are converted to acylcarnitines in mitochondria via beta-oxidation. This conversion allows long-chain fatty acids to be transported across the mitochondrial membrane [29]. The increased transport can lead to storage of excess triglycerides in the cell. The generation of toxic triglyceride intermediates can lead to cellular and organ dysfunction. Moreover, elevation of long-chain acylcarnitines is associated with incomplete oxidation of fatty acids and results in insulin resistance [30,31].
BCAAs were higher in CHD patients as well. These are the main source of nitrogen for production of glutamine and alanine in muscles. In myocardial ischemia, an important oxidative energy substrate of the heart may be BCAAs, which are produced by muscle protein mobilization [32]. Accretion of BCAAs and catabolic products is attributed to heart diseases [33] such as heart failure, supporting our findings. One of the potential mechanisms of BCAAs and cardiac dysfunction is through myocardial mTOR signaling [34]. Catabolic flux modulation of BCAAs has been proposed as a potential therapy for heart failure [33,35].
Our CHD patients were found to have higher concentrations of sphingolipids than the controls. Sphingolipids were recently identified as cholesterol-independent biomarkers of CHD [36], and changes in sphingolipid metabolism, distribution, signaling, and concentration have been observed in cardiovascular diseases [37]. Sphingolipids have been previously shown to be increased in CHD [38]. Sphingolipids are active components of cell membranes and perform intracellular signal transduction and regulation of other cellular processes [38]. They are known to support essential functions in cardiogenesis and cardiac function and to mediate pathological processes [39].
Sugar metabolism was also increased in the CHD patients. Cardiac contractility requires a constant supply of adenosine triphosphate (ATP). Under normal conditions, the high demand of ATP is primarily satisfied by fatty acid oxidation (FAO), with a small contribution from glucose metabolism [7]. Under stress conditions as well as in cardiovascular diseases, there is a shift in the supply of ATP from FAO to glucose utilization [40]. Conditional analysis on T2D showed that most of the sugar metabolites remained associated with CHD, independent of T2D.
Efforts have been made to develop clinical data-based predictive models, but the accuracy of these models in CHD is <75% [41]. We have developed a predictive model to classify a metabolomic profile for CHD in this cohort. Our results were compared to those reported by Wang et al. [13], who developed a model based on metabolomics data. We developed several models to explore different aspects of predictive modeling in metabolomics. A good model can be built by using all the metabolites, but such a model is not practically feasible in a clinical setting as it will require too many metabolites for prediction. We used variable importance to select a small subset of metabolites that can generate a model with good predictive performance. The model we developed from our data had better predictive performance for our ME population than did Wang et al.’s [13] model. Wang et al.’s MRS19 had worse performance than the LASSO MRS10 developed in our cohort. This may be due to the differences in ancestries between studies, which stresses the need to study diverse populations.

4. Materials and Methods

4.1. Study Population

The study cohort comprised 1001 CHD patients and 2999 control subjects (Table 2). The CHD patients were recruited as part of QCbio, a prospective study to establish a biorepository of plasma and DNA from Qatari patients with CHD [14]. The patients were recruited between October 2013 and February 2018. The CHD patients were identified from the Cardiac Catheterization Laboratory, Coronary Care Unit, and Heart Hospital Clinics at Hamad Medical Corporation, Doha, Qatar. Patients with a history of acute coronary syndrome or stable angina were included in the study. The control subjects were recruited by the Qatar Biobank [15]. All participants were enrolled in the study after giving written informed consent. The informed consent document conformed to the guidelines regarding bioethics resources and human subject research and International Society of Biological and Environmental Biorepositories. Females and males were approximately equally represented in the control cohort, but the CHD cohort included more females (62%). The CHD patients were older than the controls (mean ± SD years = 52.7 ± 14.5 for cases and 39.8 ± 12.0 for controls; p < 2.2 × 10⁻¹⁶; Table 2).

4.2. Metabolomic Profiling and Quality Control

Serum metabolites for both the cases and the controls were jointly quantified by untargeted, ultrahigh-performance liquid chromatography-tandem mass spectroscopy (UPLC-MS/MS) and curated by Metabolon Inc. Samples were run in analytical plates containing 144 experimental samples per plate (batch). The data were normalized across batches to generate batch-normalized data and to correct for minor instrument technical variation from batch to batch. Each compound was corrected in instrument batch blocks by registering the medians of each batch to equal one and normalizing each data point proportionally. A total of 1159 metabolites were profiled within nine super pathways: lipid (30.1%), xenobiotics (21.1%), amino acid (17.3%), nucleotide (3.1%), peptide (2.9%), cofactors and vitamins (2.6%), carbohydrate (1.9%), partially characterized molecules (1.1%), energy (0.7%), and unnamed metabolites (19.2%). Unnamed metabolites were removed, leaving 937 metabolites for analysis.
Quality control steps were conducted to ensure data quality. Samples and metabolites with more than 80% missing data were removed based on the criteria suggested by Wei et al. [42]. This led to the exclusion of 7 samples and 296 metabolites. Missing values in the remaining data were imputed by replacing the missing values for each metabolite with the minimum value detected for the metabolite. Sample outliers were identified using principal component analysis (PCA) if the first five principal component values fell outside [µ ± 5 SD] (40 outliers removed; Supplementary Figure S1). Metabolites in the remaining samples were winsorized using 80% winsorization: Values for a metabolite below the 10th percentile were set to the 10th percentile, and values above the 90th percentile were set to the 90th percentile. A total of 641 metabolites among 3953 samples remained for subsequent analysis.

4.3. Univariate Statistical Analysis

Individual metabolite differences between the CHD patients and the controls were tested using logistic regression in R (R Core Team, version 3.6, Vienna, Austria; https://www.R-project.org/) adjusting for age, sex, and BMI to mitigate the correlations between metabolites and age, sex, and BMI. FDR corrected p-values (p) from the models were used to identify significantly different metabolites between the CHD cases and the controls, and the effect size was used to identify the direction of the changes in the metabolite concentrations with respect to disease status. A metabolite has a positive effect size if its concentration is higher in CHD patients compared with controls.

4.4. Pathway Enrichment Analysis

Pathway enrichment analysis provides mechanistic insight into gene lists generated from genome-scale (omics) experiments. This method identifies biological pathways that are more enriched in a metabolite list than would be expected by chance. Pathway enrichment analysis was performed using MetaboanalystR 3.0 [43]. Comma-separated value (CSV) data files containing samples, disease status, compound IDs, and values of metabolites for each sample were generated. For compound matching, the Human Metabolome Database (HMDB) IDs provided by Metabolon were used. The auto-normalization option was selected for data normalization, which scales the data to mean = 0 and SD = 1. The quantitative enrichment analysis (QEA.) option was used, which uses the metabolite concentrations for the analysis instead of the list of differentially expressed metabolites. QEA. uses a generalized linear model to estimate a statistic (called Q-stat) of a metabolite set that describes the correlation between compound concentration profiles and phenotype [44]. This approach identifies metabolite sets when only concentrations of a few compounds are significantly different or when many related compounds have correlated small changes. The enrichment ratio (ER) is defined as the ratio of the Q-stat for the given data to its expected value by chance. ERs greater than 1 mean that the given metabolite set has different metabolite concentrations than what is expected by chance. Pathway maps were generated for visualization using the online tool Pathview (https://pathview.uncc.edu/; accessed on 23 November 2021). Pathview annotated the KEGG pathway maps [45] with normalized metabolite concentrations using red, yellow, and green to represent lower, same, and higher concentrations in CHD patients compared with controls, respectively.

4.5. Multivariate Analysis and Predictive Modeling

A random forest model was developed using the randomforest R package [46] to assess the predictive performance of inferring CHD with metabolomics data. RF models work well with relatively few samples, capture nonlinear interactions, and generalize well. The samples were divided into a training set (randomly selected 75% CHD patients (N = 735) and 75% controls (N = 2270)) and a testing set (remaining sample; N = 948). The variable importance, which is the mean decrease in accuracy if the variable is removed from the model, was calculated using the caret R package [47]. AUCs were calculated using the ROCR package in R [48]. The knee point of the variable importance curve was determined by selecting a minimum number of variables having area under the ROC comparable with the model using all metabolites. Performance of the RF model was tested in females and males separately by splitting the test set into males (N = 444) and females (N = 504). Two RF models were built: (A) based on all the metabolites (i.e., 641) and (B) based on a small subset of metabolites having the highest variable importance in model (A). Multivariate analysis was performed through least absolute shrinkage and selection operator (LASSO) using the glmnet R package [49]. We fit a model with 200-fold cross-validation and incorporated all 614 metabolites as well as age, sex, and BMI. The penalty parameter λ was determined based on the lowest mean error obtained by cross-validation. Two metabolite risk scores (MRS) were developed, one using all metabolites with a non-zero LASSO coefficient and a reduced model that used the metabolites with the highest LASSO coefficients.

5. Conclusions

Our study has focused on a cohort from an underrepresented population, with subjects representing the Middle East and Gulf region. Similar studies should be carried on new cohorts to replicate our findings and strengthen our conclusions. Overall, our study underscores the value of metabolomics in exploring biomarkers and biological mechanisms to identify potential therapeutic targets for treating CHD.

Supplementary Materials

The following supporting information can be downloaded at: https://www.mdpi.com/article/10.3390/metabo12060517/s1, Figure S1: Principal component analysis of samples. First two principal components are shown. Samples outside [µ ± 5SD] are labelled outliers. The dotted lines represent µ ± 5SD; Figure S2: Mean decrease in accuracy (variable importance) of the random forest model trained on all metabolites; Figure S3: Non-zero coefficients of metabolites in the LASSO model. Absolute value of the coefficients is plotted to identify knee point to select a subset of metabolites to develop metabolic risk score.

Author Contributions

A.E.-M. and J.A.S. conceived the study. A.E.-M. and J.A.S. collected the CHD patients. QGP/QBB provided the control cohort. A.B., A.E.-M., E.A., H.R.B.M., M.A.-N., J.A.S., R.E. and V.M.-A. prepared the samples. E.U., A.E.-M., J.A.S., M.A.-M., M.S. and V.M.-A. designed the analysis plan. E.U. analyzed the data. E.U., K.K. and M.S. generated the results and drafted the manuscript. E.U., A.E.-M., J.A.S., K.K., M.A.-M., M.S. and V.M.-A. interpreted the results. All authors revised the manuscript and approved it. J.A.S. coordinated the study. All authors have read and agreed to the published version of the manuscript.

Funding

This study was supported in part by the National Qatar Research Fund (NPRP: 5-1024-3-225 with MRC: MRC-01-17-005) and Anti-Doping Lab Qatar.

Institutional Review Board Statement

The study was conducted in accordance with the Declaration of Helsinki, and approved by the Institutional Review Board of Hamad Medical Corporation.

Informed Consent Statement

All participants gave informed consent.

Data Availability Statement

The data are not available in public repositories. They can be accessed through application to the Qatar Biobank through an established ISO-certified process by submitting a request online, subject to institutional review board approval by the Qatar Biobank. To submit a request, see https://www.qatarbiobank.org.qa/research/how-to-apply-new/.

Acknowledgments

The authors gratefully acknowledge the individuals who provided biological samples and data for QCBio and QBB. We would like to thank the Qatar Biobank for their support and for providing the metabolomics data on the controls. We would also like to thank Fayaz Mir for the help with the sample acquisition in QCBio. Qatar National Library funded the publication of this article.

Conflicts of Interest

The authors declare no conflict of interest.

References

  1. Virani, S.S.; Alonso, A.; Aparicio, H.J.; Benjamin, E.J.; Bittencourt, M.S.; Callaway, C.W.; Carson, A.P.; Chamberlain, A.M.; Cheng, S.; Delling, F.N.; et al. Heart Disease and Stroke Statistics-2021 Update: A Report From the American Heart Association. Circulation 2021, 143, e254–e743. [Google Scholar] [CrossRef]
  2. Hajar, R. Risk Factors for Coronary Artery Disease: Historical Perspectives. Heart Views 2017, 18, 109–114. [Google Scholar] [CrossRef]
  3. Menotti, A.; Puddu, P.E. Epidemiology of Heart Disease of Uncertain Etiology: A Population Study and Review of the Problem. Medicina 2019, 55, 687. [Google Scholar] [CrossRef] [Green Version]
  4. Rana, J.S.; Nieuwdorp, M.; Jukema, J.W.; Kastelein, J.J. Cardiovascular metabolic syndrome—An interplay of, obesity, inflammation, diabetes and coronary heart disease. Diabetes Obes. Metab. 2007, 9, 218–232. [Google Scholar] [CrossRef]
  5. Shah, S.H.; Hauser, E.R.; Bain, J.R.; Muehlbauer, M.J.; Haynes, C.; Stevens, R.D.; Wenner, B.R.; Dowdy, Z.E.; Granger, C.B.; Ginsburg, G.S.; et al. High heritability of metabolomic profiles in families burdened with premature cardiovascular disease. Mol. Syst. Biol. 2009, 5, 258. [Google Scholar] [CrossRef]
  6. Kolwicz, S.C., Jr.; Purohit, S.; Tian, R. Cardiac metabolism and its interactions with contraction, growth, and survival of cardiomyocytes. Circ. Res. 2013, 113, 603–616. [Google Scholar] [CrossRef] [Green Version]
  7. Doenst, T.; Nguyen, T.D.; Abel, E.D. Cardiac metabolism in heart failure: Implications beyond ATP production. Circ. Res. 2013, 113, 709–724. [Google Scholar] [CrossRef] [Green Version]
  8. Fox, C.S.; Coady, S.; Sorlie, P.D.; D’Agostino, R.B., Sr.; Pencina, M.J.; Vasan, R.S.; Meigs, J.B.; Levy, D.; Savage, P.J. Increasing cardiovascular disease burden due to diabetes mellitus: The Framingham Heart Study. Circulation 2007, 115, 1544–1550. [Google Scholar] [CrossRef]
  9. Krauss, R.M.; Winston, M.; Fletcher, B.J.; Grundy, S.M. Obesity: Impact on cardiovascular disease. Circulation 1998, 98, 1472–1476. [Google Scholar]
  10. Shah, S.H.; Sun, J.L.; Stevens, R.D.; Bain, J.R.; Muehlbauer, M.J.; Pieper, K.S.; Haynes, C.; Hauser, E.R.; Kraus, W.E.; Granger, C.B.; et al. Baseline metabolomic profiles predict cardiovascular events in patients at risk for coronary artery disease. Am. Heart J. 2012, 163, 844–850.e1. [Google Scholar] [CrossRef]
  11. Rizza, S.; Copetti, M.; Rossi, C.; Cianfarani, M.A.; Zucchelli, M.; Luzi, A.; Pecchioli, C.; Porzio, O.; Di Cola, G.; Urbani, A.; et al. Metabolomics signature improves the prediction of cardiovascular events in elderly subjects. Atherosclerosis 2014, 232, 260–264. [Google Scholar] [CrossRef]
  12. Vaarhorst, A.A.; Verhoeven, A.; Weller, C.M.; Bohringer, S.; Goraler, S.; Meissner, A.; Deelder, A.M.; Henneman, P.; Gorgels, A.P.; van den Brandt, P.A.; et al. A metabolomic profile is associated with the risk of incident coronary heart disease. Am. Heart J. 2014, 168, 45–52.e7. [Google Scholar] [CrossRef]
  13. Wang, Z.; Zhu, C.; Nambi, V.; Morrison, A.C.; Folsom, A.R.; Ballantyne, C.M.; Boerwinkle, E.; Yu, B. Metabolomic Pattern Predicts Incident Coronary Heart Disease. Arterioscler. Thromb. Vasc. Biol. 2019, 39, 1475–1482. [Google Scholar] [CrossRef]
  14. El-Menyar, A.; Al Suwaidi, J.; Badii, R.; Mir, F.; Dalenberg, A.K.; Kullo, I.J. Discovering Novel Biochemical and Genetic Markers for Coronary Heart Disease in Qatari Individuals: The Initiative Qatar Cardiovascular Biorepository. Heart Views 2020, 21, 6–16. [Google Scholar] [CrossRef]
  15. Salman, A.; Baber, R.; Hannigan, L.; Habermann, J.K.; Henderson, M.K.; Mayrhofer, M.T.; Afifi, N. Qatar Biobank Milestones in Building a Successful Biobank. Biopreserv. Biobank. 2019, 17, 485–486. [Google Scholar] [CrossRef] [Green Version]
  16. Moon, J.; Kim, O.Y.; Jo, G.; Shin, M.J. Alterations in Circulating Amino Acid Metabolite Ratio Associated with Arginase Activity Are Potential Indicators of Metabolic Syndrome: The Korean Genome and Epidemiology Study. Nutrients 2017, 9, 740. [Google Scholar] [CrossRef] [Green Version]
  17. Sourij, H.; Meinitzer, A.; Pilz, S.; Grammer, T.B.; Winkelmann, B.R.; Boehm, B.O.; Marz, W. Arginine bioavailability ratios are associated with cardiovascular mortality in patients referred to coronary angiography. Atherosclerosis 2011, 218, 220–225. [Google Scholar] [CrossRef]
  18. Kovamees, O.; Shemyakin, A.; Pernow, J. Amino acid metabolism reflecting arginase activity is increased in patients with type 2 diabetes and associated with endothelial dysfunction. Diabetes Vasc. Dis. Res. 2016, 13, 354–360. [Google Scholar] [CrossRef] [Green Version]
  19. Pernow, J.; Jung, C. Arginase as a potential target in the treatment of cardiovascular disease: Reversal of arginine steal? Cardiovasc. Res. 2013, 98, 334–343. [Google Scholar] [CrossRef] [Green Version]
  20. Durante, W.; Johnson, F.K.; Johnson, R.A. Arginase: A critical regulator of nitric oxide synthesis and vascular function. Clin. Exp. Pharmacol. Physiol. 2007, 34, 906–911. [Google Scholar] [CrossRef] [Green Version]
  21. Caldwell, R.B.; Toque, H.A.; Narayanan, S.P.; Caldwell, R.W. Arginase: An old enzyme with new tricks. Trends Pharmacol. Sci. 2015, 36, 395–405. [Google Scholar] [CrossRef] [Green Version]
  22. Romero, M.J.; Platt, D.H.; Tawfik, H.E.; Labazi, M.; El-Remessy, A.B.; Bartoli, M.; Caldwell, R.B.; Caldwell, R.W. Diabetes-induced coronary vascular dysfunction involves increased arginase activity. Circ. Res. 2008, 102, 95–102. [Google Scholar] [CrossRef]
  23. Pernow, J.; Kiss, A.; Tratsiakovich, Y.; Climent, B. Tissue-specific up-regulation of arginase I and II induced by p38 MAPK mediates endothelial dysfunction in type 1 diabetes mellitus. Br. J. Pharmacol. 2015, 172, 4684–4698. [Google Scholar] [CrossRef]
  24. Yao, L.; Chandra, S.; Toque, H.A.; Bhatta, A.; Rojas, M.; Caldwell, R.B.; Caldwell, R.W. Prevention of diabetes-induced arginase activation and vascular dysfunction by Rho kinase (ROCK) knockout. Cardiovasc. Res. 2013, 97, 509–519. [Google Scholar] [CrossRef] [Green Version]
  25. Johnson, F.K.; Johnson, R.A.; Peyton, K.J.; Durante, W. Arginase inhibition restores arteriolar endothelial function in Dahl rats with salt-induced hypertension. Am. J. Physiol.-Regul. Integr. Comp. Physiol. 2005, 288, R1057–R1062. [Google Scholar] [CrossRef]
  26. Cannon, R.O., 3rd. Role of nitric oxide in cardiovascular disease: Focus on the endothelium. Clin. Chem. 1998, 44, 1809–1819. [Google Scholar]
  27. Shah, S.H.; Bain, J.R.; Muehlbauer, M.J.; Stevens, R.D.; Crosslin, D.R.; Haynes, C.; Dungan, J.; Newby, L.K.; Hauser, E.R.; Ginsburg, G.S.; et al. Association of a peripheral blood metabolic profile with coronary artery disease and risk of subsequent cardiovascular events. Circ. Cardiovasc. Genet. 2010, 3, 207–214. [Google Scholar] [CrossRef] [Green Version]
  28. Kalim, S.; Clish, C.B.; Wenger, J.; Elmariah, S.; Yeh, R.W.; Deferio, J.J.; Pierce, K.; Deik, A.; Gerszten, R.E.; Thadhani, R.; et al. A plasma long-chain acylcarnitine predicts cardiovascular mortality in incident dialysis patients. J. Am. Heart Assoc. 2013, 2, e000542. [Google Scholar] [CrossRef] [Green Version]
  29. Brittain, E.L.; Talati, M.; Fessel, J.P.; Zhu, H.; Penner, N.; Calcutt, M.W.; West, J.D.; Funke, M.; Lewis, G.D.; Gerszten, R.E.; et al. Fatty Acid Metabolic Defects and Right Ventricular Lipotoxicity in Human Pulmonary Arterial Hypertension. Circulation 2016, 133, 1936–1944. [Google Scholar] [CrossRef]
  30. Koves, T.R.; Ussher, J.R.; Noland, R.C.; Slentz, D.; Mosedale, M.; Ilkayeva, O.; Bain, J.; Stevens, R.; Dyck, J.R.; Newgard, C.B.; et al. Mitochondrial overload and incomplete fatty acid oxidation contribute to skeletal muscle insulin resistance. Cell Metab. 2008, 7, 45–56. [Google Scholar] [CrossRef] [Green Version]
  31. Schooneman, M.G.; Vaz, F.M.; Houten, S.M.; Soeters, M.R. Acylcarnitines: Reflecting or inflicting insulin resistance? Diabetes 2013, 62, 1–8. [Google Scholar] [CrossRef] [Green Version]
  32. Szpetnar, M.; Pasternak, K.; Boguszewska, A. Branched chain amino acids (BCAAs) in heart diseases (ischaemic heart disease and myocardial infarction). Ann. Univ. Mariae Curie-Sklodowska Med. 2004, 59, 91–95. [Google Scholar]
  33. Sun, H.; Wang, Y. Branched chain amino acid metabolic reprogramming in heart failure. Biochim. Biophys. Acta 2016, 1862, 2270–2275. [Google Scholar] [CrossRef]
  34. Wang, W.; Zhang, F.; Xia, Y.; Zhao, S.; Yan, W.; Wang, H.; Lee, Y.; Li, C.; Zhang, L.; Lian, K.; et al. Defective branched chain amino acid catabolism contributes to cardiac dysfunction and remodeling following myocardial infarction. Am. J. Physiol. Heart Circ. Physiol. 2016, 311, H1160–H1169. [Google Scholar] [CrossRef]
  35. Uddin, G.M.; Zhang, L.; Shah, S.; Fukushima, A.; Wagg, C.S.; Gopal, K.; Al Batran, R.; Pherwani, S.; Ho, K.L.; Boisvenue, J.; et al. Impaired branched chain amino acid oxidation contributes to cardiac insulin resistance in heart failure. Cardiovasc. Diabetol. 2019, 18, 86. [Google Scholar] [CrossRef]
  36. Poss, A.M.; Maschek, J.A.; Cox, J.E.; Hauner, B.J.; Hopkins, P.N.; Hunt, S.C.; Holland, W.L.; Summers, S.A.; Playdon, M.C. Machine learning reveals serum sphingolipids as cholesterol-independent biomarkers of coronary artery disease. J. Clin. Investig. 2020, 130, 1363–1376. [Google Scholar] [CrossRef] [Green Version]
  37. Lim, G.B. Sphingolipids are biomarkers of coronary disease. Nat. Rev. Cardiol. 2020, 17, 200. [Google Scholar] [CrossRef]
  38. Borodzicz, S.; Czarzasta, K.; Kuch, M.; Cudnoch-Jedrzejewska, A. Sphingolipids in cardiovascular diseases and metabolic disorders. Lipids Health Dis. 2015, 14, 55. [Google Scholar] [CrossRef] [Green Version]
  39. Kovilakath, A.; Jamil, M.; Cowart, L.A. Sphingolipids in the Heart: From Cradle to Grave. Front. Endocrinol. 2020, 11, 652. [Google Scholar] [CrossRef]
  40. Wende, A.R.; Brahma, M.K.; McGinnis, G.R.; Young, M.E. Metabolic Origins of Heart Failure. JACC Basic Transl. Sci. 2017, 2, 297–310. [Google Scholar] [CrossRef]
  41. Shorewala, V. Early detection of coronary heart disease using ensemble techniques. Inform. Med. Unlocked 2021, 26, 100655. [Google Scholar]
  42. Wei, R.; Wang, J.; Su, M.; Jia, E.; Chen, S.; Chen, T.; Ni, Y. Missing Value Imputation Approach for Mass Spectrometry-based Metabolomics Data. Sci. Rep. 2018, 8, 663. [Google Scholar] [CrossRef] [Green Version]
  43. Pang, Z.; Chong, J.; Li, S.; Xia, J. MetaboAnalystR 3.0: Toward an Optimized Workflow for Global Metabolomics. Metabolites 2020, 10, 186. [Google Scholar] [CrossRef]
  44. Xia, J.; Wishart, D.S. MSEA: A web-based tool to identify biologically meaningful patterns in quantitative metabolomic data. Nucleic Acids Res. 2010, 38, W71–W77. [Google Scholar] [CrossRef] [Green Version]
  45. Kanehisa, M. Toward understanding the origin and evolution of cellular organisms. Protein Sci. 2019, 28, 1947–1951. [Google Scholar] [CrossRef]
  46. Liaw, A.; Wiener, M. Classification and Regression by RandomForest. Forest 2001, 23. [Google Scholar]
  47. Kuhn, M. Caret: Classification and Regression Training. R Package Version 6 2021. [Google Scholar]
  48. Sing, T.; Sander, O.; Beerenwinkel, N.; Lengauer, T. ROCR: Visualizing classifier performance in R. Bioinformatics 2005, 21, 3940–3941. [Google Scholar] [CrossRef]
  49. Friedman, J.; Hastie, T.; Tibshirani, R. Regularization Paths for Generalized Linear Models via Coordinate Descent. J. Stat. Softw. 2010, 33, 1–22. [Google Scholar]
Figure 1. Metabolic differences between CHD patients and controls. (A) Distribution of effect sizes of metabolites grouped by super pathways. (B) Effect sizes of top 20 significantly different metabolites in cases and controls. p and effect size of the metabolites were calculated using a logistic regression adjusting for age, sex, and BMI.
Metabolites 12 00517 g001
Figure 2. (A) The distribution of ornithine, arginine, and dimethylarginine in CHD patients and controls. (B) The impact of sex on ornithine, arginine, and dimethylarginine distribution. (C) The impact of type 2 diabetes on ornithine, arginine, and dimethylarginine distribution. (D) The arginine biosynthesis pathway (KEGG pathway: hsa00220). (E) The arginine and ornithine metabolism pathway (KEGG pathway: hsa00472). (F) The role of increased concentrations of ADMA in the metabolism of L-arginine. (G) The DDAH/ADMA pathway and the role of increased concentrations of ADMA in vascular function and homeostasis. Colored metabolites were found in our metabolomic profile. Metabolites in red, yellow, and green have lower, the same, and higher concentration in cases compared with controls, respectively.
Metabolites 12 00517 g002
Figure 3. The distribution of significant acylcarnitines in the CHD patients and the controls.
Metabolites 12 00517 g003
Figure 4. The distribution of long-chain chain fatty acids in the CHD patients and the controls.
Metabolites 12 00517 g004
Figure 5. The distribution of branched chain amino acids in the CHD patients and the controls.
Metabolites 12 00517 g005
Figure 6. (A) The distribution of sphingolipids in the CHD patients and the controls. (B) The sphingolipid metabolism pathway (KEGG pathway: hsa00600). Colored metabolites are found in our metabolomic profile. Metabolites in red, yellow, and green have lower, the same, and higher concentrations compared with controls, respectively.
Metabolites 12 00517 g006
Figure 7. The distribution of sugars in the CHD patients and the controls.
Metabolites 12 00517 g007
Figure 8. MRS discriminative performance. (A) Density plots of MRS10 in cases and controls in our test data. (B) Density plots of MRS19, which was developed by Wang et al. [13] on our test data. (C) The list of 10 metabolites used to build MRS10 using LASSO and their effect sizes. p (in (A,B)) was the p value from the logistic regression: CHD Status ~ MRS+ age + sex + BMI. AUC = area under the receiver operating curve, was calculated for the model that only contained the MRS (omitting all covariates) because of unbalance of cases and controls with respect to covariates.
Metabolites 12 00517 g008
Table 1. The 45 most significant enriched pathways with FDR corrected p < 10−300.
RankPathwayCHERRankPathwayCHER
1Malate-Aspartate Shuttle103937.7624Oxidation of Branched Chain Fatty Acids264429.34
2D-Arginine and D-Ornithine Metabolism11376025Mitochondrial Electron Transport Chain194422.54
3Glucose-Alanine Cycle135740.0426Propanoate Metabolism425419.62
4Gluconeogenesis356730.9527Tryptophan Metabolism6012386.48
5Warburg Effect5812695.1128Ammonia Recycling3212386.28
6Citric Acid Cycle327683.4129Glycine and Serine Metabolism5921379.37
7Glutathione Metabolism216659.6230Nicotinate and Nicotinamide Metabolism379363.32
8Lysine Degradation304638.0431Carnitine Synthesis228346.34
9Pyruvate Metabolism485620.8532Betaine Metabolism216342.96
10Tyrosine Metabolism729608.3233Sphingolipid Metabolism4010341.81
11Urea Cycle2912578.2134Valine, Leucine and Isoleucine Degradation608328.06
12Transfer of Acetyl Groups into Mitochondria225573.5135Histidine Metabolism4310305.92
13Glycolysis254572.236Arachidonic Acid Metabolism694288.72
14Phytanic Acid Peroxisomal Oxidation262571.6537Starch and Sucrose Metabolism315265.43
15Phenylalanine and Tyrosine Metabolism287544.8938Steroidogenesis433261.33
16Alanine Metabolism177531.5839Methionine Metabolism4315243.09
17Cysteine Metabolism266514.2340Glycerolipid Metabolism256240.15
18Amino Sugar Metabolism336459.1841Pyrimidine Metabolism599155.08
19Glutamate Metabolism4912457.0442Fatty Acid Biosynthesis358133.24
20Arginine and Proline Metabolism5316441.2743Bile Acid Biosynthesis6511107.6
21Beta-Alanine Metabolism348441.1244Galactose Metabolism387133.77
22Aspartate Metabolism3512438.0745Phosphatidylcholine Biosynthesis144359.58
23Purine Metabolism7412433.8
Rank: Rank of pathways based on descending ER; ER: Enrichment ratio; C: The number of compounds within each pathway; H: the number of tested metabolites that overlap with the pathway.
Table 2. The cohort characteristics after the quality control steps.
CHDControlsp *
FemalesMalesAllFemalesMalesAll
Participants, N (%)600
(61.9)
370
(38.1)
970
(100)
1505
(50.5)
1478
(49.6)
2983
(100)
7.9 × 10⁻¹⁰
Age, Mean (SD) years53.4
(14.5)
51.6
(14.9)
52.7
(14.6)
39.6
(11.4)
40.1
(12.6)
39.8
(12.0)
<2.2 × 10⁻¹⁶
BMI, Mean (SD) kg.m−229.8
(5.0)
31.8
(6.2)
30.5
(5.5)
28.6
(5.5)
29.4
(6.3)
29.0
(5.9)
2.7 × 10⁻¹³
Type 2 Diabetes #, N (%)302
(62.8)
179
(37.2)
481
(100)
135
(49.6)
137
(50.4)
272
(100)
5.9 × 10⁻⁴
* p: p-values were calculated using a chi-square test to compare the numbers of cases and controls with respect to sex and Type 2 diabetes. Two-sample t-test was used to compare age and BMI between the cases and controls. # Type 2 diabetes (T2D) status within CHD was defined as fasting blood glucose ≥ 126 mg/dL, random glucose ≥ 200 mg/dL, hemoglobin A1C ≥ 6.5%, or a prior diagnosis with oral hypoglycemic or insulin therapy. Within the controls, hemoglobin A1C ≥ 6.5% was used to define T2D patients.
Publisher’s Note: MDPI stays neutral with regard to jurisdictional claims in published maps and institutional affiliations.

